Article

Lipomics: A Potential Carrier for the Intravenous Delivery of Lipophilic and Hydrophilic Drugs

by
David Ramírez-Hernández
1,2,
Carlos Juárez-Osornio
2,
Vanessa Izquierdo-Sánchez
2,
Pavel A. Figueroa-Rodríguez
2,
Jorge Organista-Nava
3,
Yazmín Gómez-Gómez
3 and
Luis Alberto Medina
2,4,*
1
Facultad de Química, Universidad Nacional Autónoma de México, Mexico City 04510, Mexico
2
Unidad de Investigación Biomédica en Cáncer INCan-UNAM, Instituto Nacional de Cancerología, Mexico City 14080, Mexico
3
Facultad de Ciencias Químico Biológicas, Universidad Autónoma de Guerrero, Chilpancingo 39090, Guerrero, Mexico
4
Instituto de Física, Universidad Nacional Autónoma de México, Mexico City 04510, Mexico
*
Author to whom correspondence should be addressed.
Pharmaceutics 2022, 14(8), 1651; https://doi.org/10.3390/pharmaceutics14081651
Submission received: 21 June 2022 / Revised: 22 July 2022 / Accepted: 4 August 2022 / Published: 8 August 2022

Abstract

:
In the present work, we propose the development of a novel carrier that does not need organic solvents for its preparation and with the potential for the intravenous delivery of lipophilic and hydrophilic drugs. Named lipomics, this is a mixed colloid of micelles incorporated within a liposome. This system was designed through ternary diagrams and characterized by physicochemical techniques to determine the particle size, zeta potential, shape, morphology, and stability properties. The lipomics were subjected to electron microscopy (SEM, TEM, and STEM) to evaluate their physical size and morphology. Finally, pharmacokinetic studies were performed by radiolabeling the lipomics with Technetium-99m chelated with BMEDA to evaluate the in vivo biodistribution through techniques of molecular imaging (microSPECT/CT) in rats. Radiolabeling efficiency was used to compare the encapsulation efficiency of the hydrophilic and lipophilic molecules in lipomics and liposomes. According to the results, lipomics are potentially carriers of lipophilic and hydrophilic drugs.

1. Introduction

The development of pharmaceutical carriers has been one of the essential objectives of nanomedicine. Nanocarriers provide more efficient and less toxic treatments with cytotoxic drugs, diagnostic imaging through radionuclides or contrast agents, and the monitoring of diseases [1,2]. One of the most used nanocarriers is lipid-based nanosystems, such as liposomes; these particles have relevant advantages as drug delivery systems, for example, drug protection against enzymatic degradation, low toxicity, increased permeability, biocompatibility, and low immunogenicity [2,3]. However, some of these advantages are limited because of the low encapsulation efficiency of drugs with poor aqueous solubility.
The development of nanocarriers to transport low-solubility drugs is relevant because many drug candidates or diagnostic agents are lipophilic with poor solubility in water [3]. The therapeutic applications of hydrophobic drugs are associated with minimal absorption and low bioavailability; in addition, the aggregation of these drugs on intravenous administration causes problems of embolism and local toxicity [4]. On the other hand, low solubility is also an intrinsic property of many lipophilic drugs, which helps the molecule or drug penetrate the cell membrane and achieve important intracellular targets. Different micelles-forming surfactants, colloidal dispersions with a particle size of 5 to 100 nm, have been used to overcome the low solubility of certain drugs. An essential property of micelles is their ability to increase the solubility and bioavailability of poorly soluble or insoluble drugs [2,5].
In the present study, we describe a new system named lipomics, potentially carrying both lipophilic and hydrophilic drugs. Lipomic are lipid nanostructures composed of a mixture of phospholipids, which under specific physicochemical conditions, form a nucleus of mixed micelles (phospholipid monomers and surfactants) surrounded by a bilayer of phospholipids (a liposome membrane), which can transport hydrophilic drugs in the aqueous space of the core and lipophilic drugs within the micelles [6].
In the manufacturing of lipomics, Taguchi’s experimental design was used to identify controllable parameters that minimize variations that could affect the method’s reproducibility. Pseudo-ternary phase diagrams were used to determine the proportion of the excipients needed to obtain the best lipomic formulation. Physicochemical techniques to determine particle size, zeta potential, morphology, and in vitro stability properties were implemented. For the in vivo biodistribution, pharmacokinetic studies of 99mTc-lipomics were performed by plasma sampling quantification and molecular imaging with a microSPECT/CT system at different times. Radiolabeling efficiency was used to compare the encapsulation efficiency of hydrophilic and lipophilic molecules in lipomics and liposomes.

2. Results

2.1. Cloud Point Temperature (Cp)

Figure 1 presents the Cp for the different non-ionic surfactants used in the lipomic elaboration. The Cp measurement allowed us to obtain the temperature where the concentration of micelles was the highest at the interface, resulting in a stable micellar net that was apt to build the lipomics. Both the concentration and type of surfactants were evaluated; by keeping the concentration of ions in the medium constant, each surfactant had a different Cp. The analysis of Cp with the different surfactants determined the selection of Tween 80 for the elaboration of the lipomics, considering that a homogeneous surfactant solution with a high turbidity point (Cp) presents more stability. This temperature (47 °C) was also close to the transition temperature of the DSPC used in the formulation. The surfactants Tween 40 and 60 were discarded due to their low Cp in the concentration range needed to elaborate lipomics (0.5–6%w/w). Although Tween 20 has a high Cp (42 °C), it has the disadvantage of presenting a separation of phases in a short period of time after the lipomic preparation.

2.2. Taguchi’s Design

The orthogonal arrangement of Taguchi’s design resulted in sixteen different lipomic formulations prepared as a function of phospholipid, surfactant concentration, flow rate of isotonic saline infusion, and sonication time. Table 1 presents the sizes of the resultant lipomic structures for each formulation.
The results show that increments in the sonication time and flow rate reduces particle size; however, the variation in phospholipids and surfactant concentration is less conclusive. All formulations with diameters >1000 nm were discharged since particles larger than this size had low stability because of the separation of phases, coalescence between the suspended particles, and rapid elimination from the organism [7,8]. Only formulations 4, 8, and 12, with diameters <200 nm, were followed over a month by evaluating the particle size and zeta potential stability. The lipomic formulations with minor changes in these parameters were considered the most stable with a potential to be drug carriers.

2.3. Physicochemical Stability

Figure 2 presents the results of particle size and zeta potential stability after a month, indicating that formulations 4 and 8 are the most stable. These results show that the electrostatic forces between the particles do not change with time since there is no increase in particle size or Z potential, avoiding agglomeration, fusion, coalescence, and the aggregation phase. These formulations were studied through pseudo-ternary phase diagrams to obtain information on the effect of excipients in lipomic size as their proportions were modified.

2.4. Ternary Diagrams

Figure 3 presents the pseudo-ternary phase diagrams for formulations 4 and 8. Each point in the trajectory represents a change in the percentage of the lipomic excipients expressed in %w/w. For both surfactants and phospholipids, when modifying their proportions in a mixture, they tended to change the lipomic characteristics. Monitoring each component was vital for the location of specific points in each trajectory. In this way, it was possible to find specific conditions in which the mixture of components produced a system with the desired physicochemical characteristics, in this case, the lipomic size.
The lipomic hydrodynamic size and population distribution for each point was calculated through the size histogram obtained from a Zetasizer Analyzer 90 PLUS/BI-MAS. Table 2 shows the results for both trajectories.

2.5. Electron Microscopies

Figure 4 shows scanning microscopy pictures with morphological differences between both formulations. Lipomics from formulations 4.2 show some agglomeration of structures, (Picture 1) although the existence of isolated spherical particles is also observed (Pictures 2 and 3). Lipomics from formulation 8.2 mostly show spherical structures (Pictures 4–6). The average size measured in the images results in 86 ± 36 nm for lipomics in formulation 4.2 and 64 ± 19 nm in formulation 8.2, in agreement with the (hydrodynamic) size measured with the Zetasizer Analyzer (94 ± 10 and 73 ± 18 nm, respectively).
Figure 5 shows the microscopy images (SEM, TEM, and STEM) used to resolve the internal structure of lipomics from formulation 8.2; these were loaded with a hydrophilic contrast medium (uranyl acetate). The deformation was attributed to the break in lipomic osmolarity when adding uranyl acetate and the drying process to acquire the images. The TEM and STEM images show higher contrast regions, suggesting that the internal lipomic aqueous core is shared with micelles. No contrast medium (uranyl acetate) was used with SEM imaging.

2.6. Radiolabeling Results

Radiolabeling efficiency (RE) was used to compare the encapsulation efficiency of hydrophilic and lipophilic molecules in lipomics and liposomes. The BMEDA chelator used to carry 99mTc through the lipidic membrane was transformed to its hydrophilic or lipophilic form through pH manipulation (pH < 6 or >7, respectively).
The lipophilic conditions (pH > 7) and the osmotic gradient increase the passage of the 99mTc-2BMEDA complex through the lipid membrane of lipomics and liposomes. For lipomics, the micelles at the core can catch and store large amounts of this lipophilic 99mTc-complex, increasing the RE (Figure 6a,c). On the contrary, liposomes with their aqueous core repel the complex, pushing it out of the lipomic, reducing RE. In the case of liposomes with glucoheptonate (liposome GSH), GSH transforms the lipophilic complex into its hydrophilic form (99mTc-BMEDA-H+), causing it to be trapped inside the core, resulting in a high RE. Statistically, there is no difference in the RE between lipomics and liposome GSH, making the radiolabeling of lipomics more practical by not requiring glucoheptonate.
In hydrophilic conditions (pH < 6), lipomics show a greater uptake (Figure 6b) of the 99mTc-2BMEDA complex because of the osmotic gradient and the membrane’s flexibility with a low cholesterol concentration. Once inside, the hydrophilic 99mTc complex stays in the aqueous core surrounded by the micelles, preventing the complex from quickly leaving the core. Similarly, the hydrophilic 99mTc complex passes through the liposome membrane into the aqueous core; however, the complex can leave the core because of the osmotic gradient, reducing RE.
Figure 7 shows the in vitro stability in human serum of 99mTc lipomics with and without PEG over 24 h at a temperature of 37 °C and constant agitation. The determination of stability in vitro helps to predict the behavior of lipomics in the body. The stability of any drug carrier is critical since, if the system is unstable, the carrier’s content would be released, causing toxic effects or a rapid elimination from the body. The results show that stability is more significant when the lipomic is PEG-coated, because the steric barrier that it produces reduces the interaction with plasma proteins and opsonization.
In vivo pharmacokinetics of radiolabeling lipomics (formulation 8.2 with and without PEG) and “free” 99mTcO are presented in Figure 8, showing their differences. As compared with PEG lipomics, technetium is quickly removed from blood circulation.
Table 3 presents the pharmacokinetic parameters for radiolabeled lipomics and technetium, calculated using a two-compartment model. The pharmacokinetic parameters exhibit different behavior in the organism. In all three systems, it was observed that the half-life time in the central compartment (t1/2 α) was close to zero, which was corroborated by the half-life parameters in the peripheral compartment (t1/2 β) with a longer residence time. In addition, the lipomics’ interchange rate constant between compartments 1-2 (K12), with values significantly higher than those between compartments 2-1 (K21) and the elimination constant (K10), demonstrated that the flow of lipomics to the peripheral compartment was more significant than its return to blood circulation, indicating that the system was not eliminated, but was absorbed by the organs.
High 99mTcO and lipomics concentrations were observed in the peripheral compartment when comparing the volumes of distribution of compartments 1 and 2 (VD1 and VD2), where it was shown that VD2 was greater than that shown by VD1 with “free” 99mTcO being the most frequently captured by the peripheral compartment and in turn the one with the highest clearance (Cl). Clearance is a theoretical value that is associated with organ uptake.
Finally, the area under the curve (AUC0-t) represents the amount of drugs (i.e., 99mTc) present in circulating blood over time; here, the PEG lipomics had the highest AUC0-t, which means that it remained in the blood longer; however, this does not mean that it remains in the body the longest.

2.7. In Vivo Imaging Biodistribution

The following SPECT/CT images show the representative biodistribution of “free” 99mTcO4, 99mTc lipomics, and 99mTc-lipomics-PEG intravenously injected in healthy rats.
For 99mTcO4, the images were acquired at 1 and 3 h after administration because technetium is quickly removed from circulation after three hours, so imaging at 6 h was not considered. The metabolism of 99mTcO4 is mainly linked to mucous membranes and glands, and the gastrointestinal tract is the main compartment for the metabolization and elimination of this radionuclide [9,10]. Its biodistribution (Figure 9) shows a majority uptake in the stomach, coinciding with what is reported in the literature [11].
The lipomic systems that encapsulate 99mTcO4 show a different biodistribution attributed to the phospholipid bilayer; this bilayer membrane prevents technetium’s direct interaction with its natural receptors delaying its elimination from the body. When lipomics are manufactured without PEG, this presents a rapid accumulation in the liver, a common pathway for phospholipid metabolism, staying there for the following 6 h (Figure 10).
In contrast, PEG lipomics have a steric barrier that can keep the lipomics in circulation before metabolization through the liver and spleen. The images show a biodistribution primarily concentrated in the intestines and liver (Figure 11).
Figure 12 shows the percentage of activity in organs for each formulation; it was quantified from the images at different acquisition times (1, 3, and 6 h). Figure 13 shows the ex vivo biodistribution in different organs 3 h after injection.

3. Discussion

From a previous work [
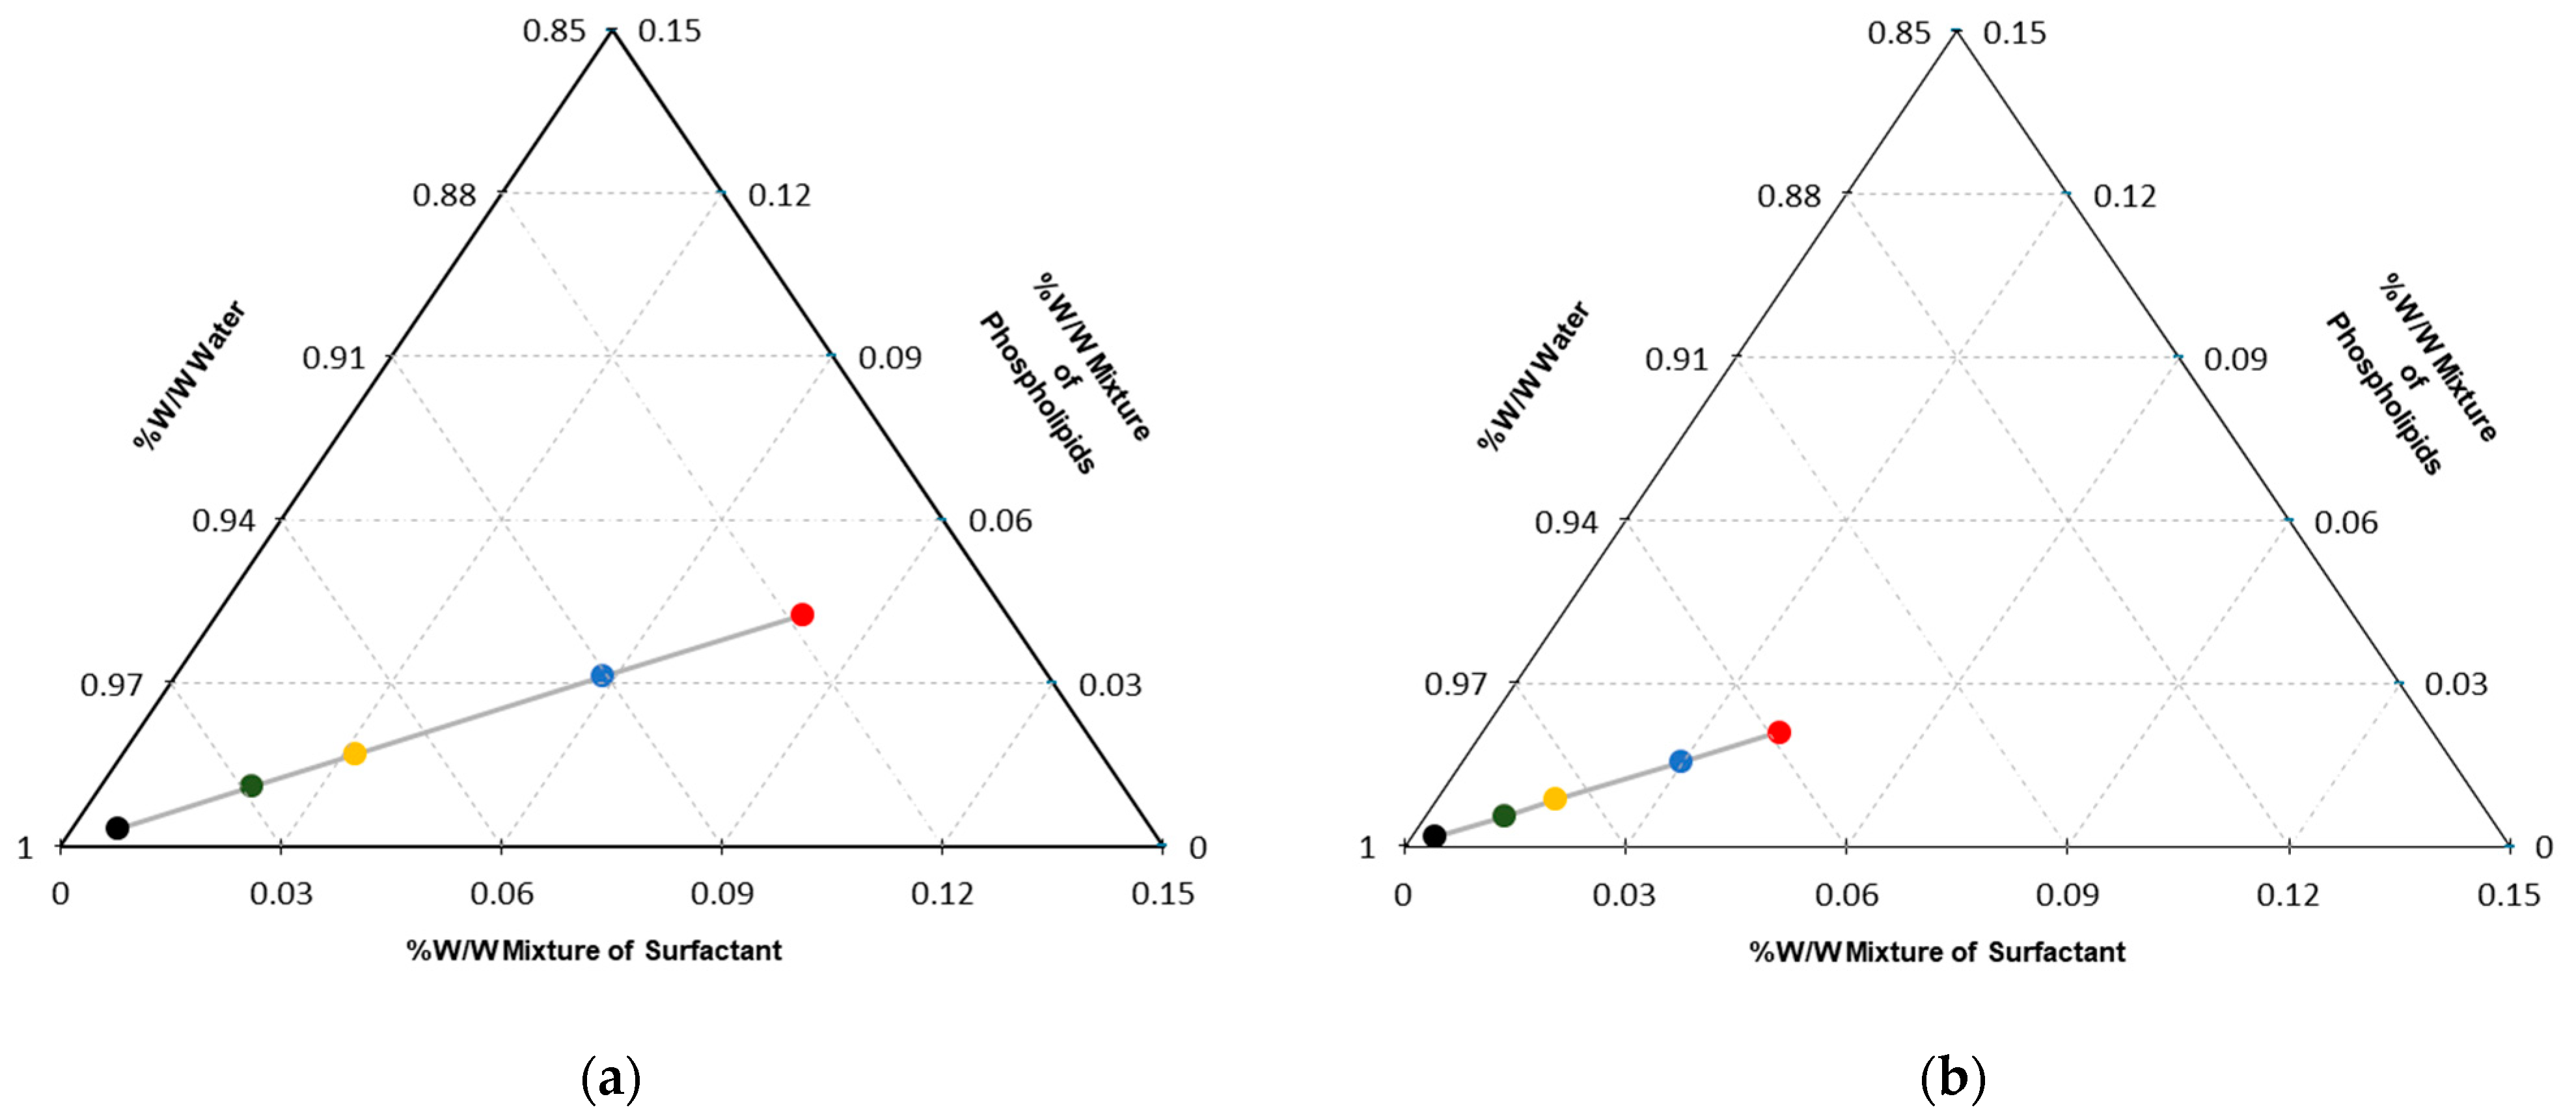
6], it was suggested that using a unique combination of physicochemical parameters, based on pseudo-ternary phase diagrams, and experimental conditions, using Taguchi’s design, lipomics can be formed reproducibly.
The Taguchi method optimizes experimental parameters to minimize variation before optimizing the design to hit target values for output parameters. The method uses unique orthogonal arrays to study all the design factors with a minimum number of experiments [12]. Pseudo-ternary diagrams are widely used because they make it easier to understand the behavior of a system in equilibrium and determine the compositions of the phases and relative quantities of each of them [13]. In this work, the ternary diagrams allowed us to define the trajectory points that resulted in systems with the potential for use as carriers of lipophilic and hydrophilic drugs. Each diagram contains specific points placed from the concentrations of each of the components in the system, defining zones where the concentrations of the excipients tend to behave in a specific way. Then, it was possible to define the regions of interest where it was very likely to find systems with defined characteristics (i.e., size and morphology).
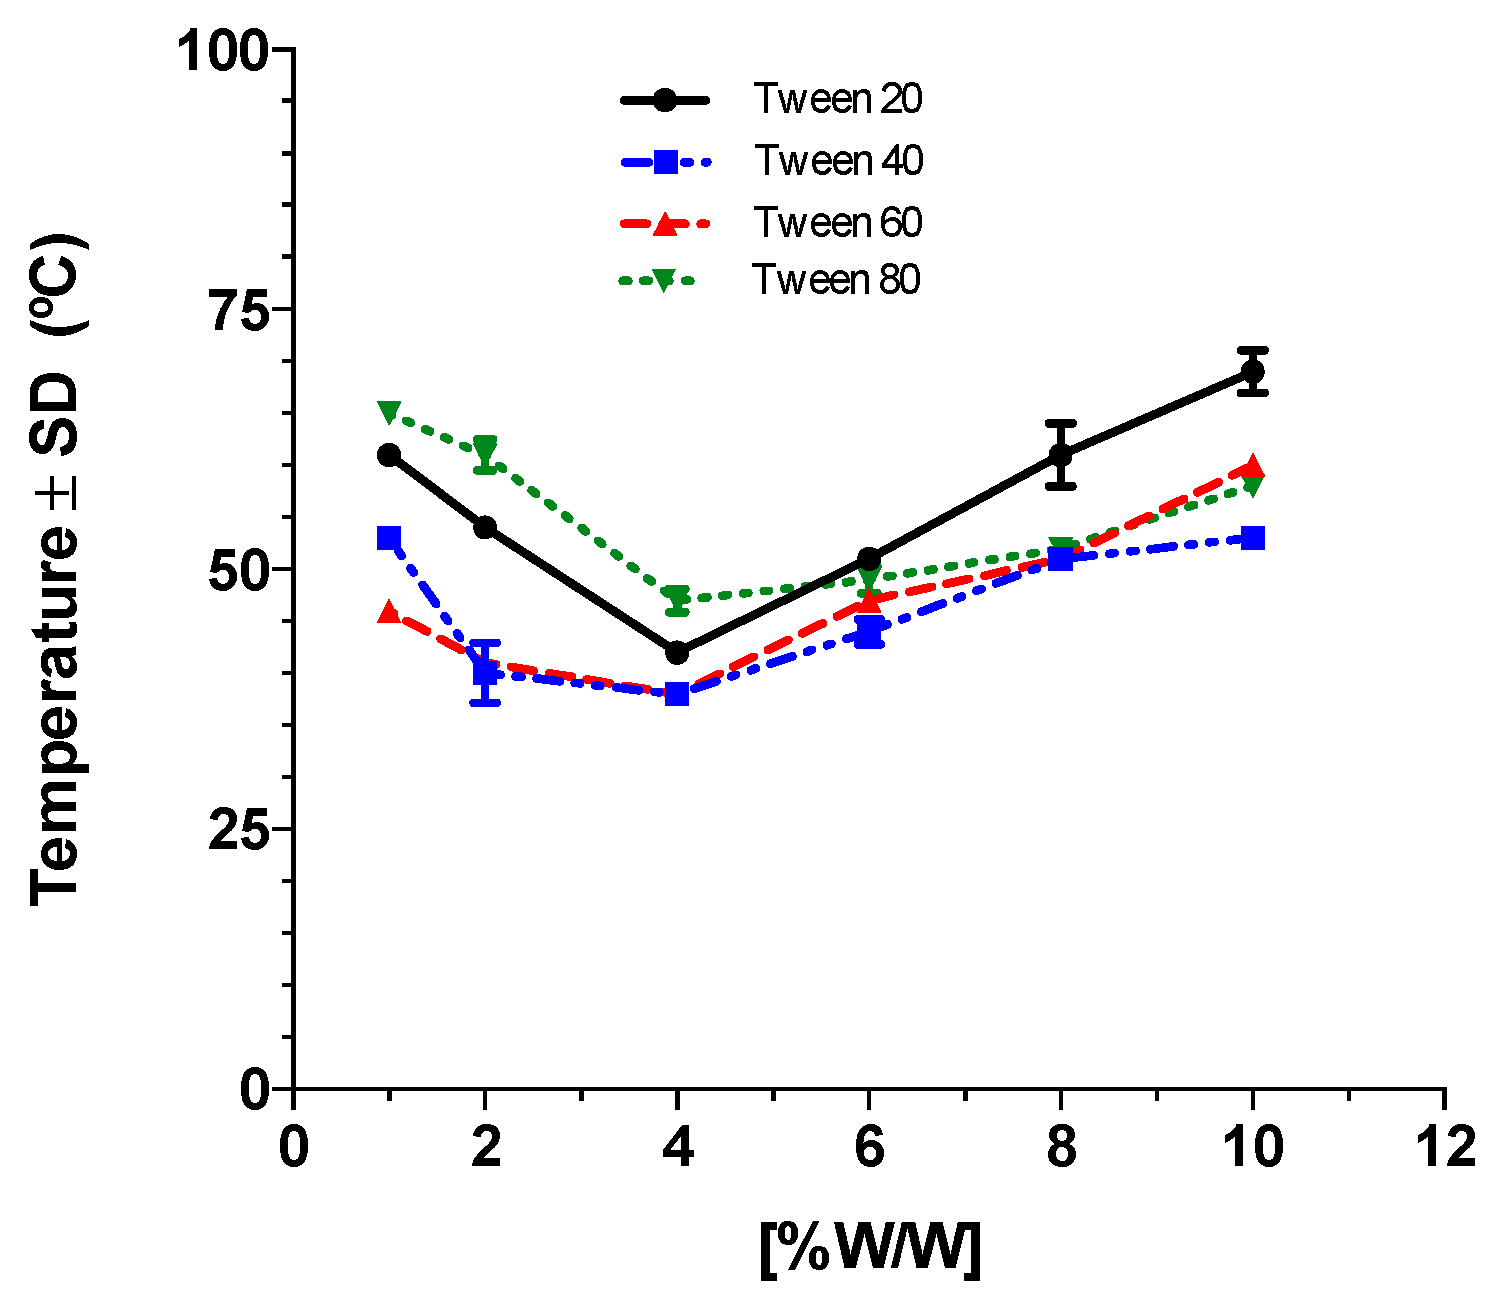
The surfactant’s cloud point (Cp) is an essential parameter in lipomic formation. When a surfactant reaches the Cp temperature, it forms a micellar network encapsulated by a lipid double bilayer of the phospholipids in the medium when the lipomic is assembled. The Cp mainly depends on surfactant concentration, its chemical structure (the extension of the carbon chain), and the concentration of ions in the medium. The surfactant concentration is directly related to the critical micellar concentration (CMC). By increasing the temperature, the CMC is increased, causing the formation of micelles. The non-ionic surfactants used in this work belonged to the family of ethoxylated surfactants; when the ethylene oxide units (hydrophilic portion) were increased and the carbon chain remained constant, the Cp increased. In contrast, by increasing the length of the carbon chain, the Cp decreased [14]. In this study, both concentrations and types of surfactants were modified, keeping the concentration of ions in the medium constant. Our analysis of Cp with the different surfactants determined the selection of Tween 80 for the elaboration of lipomics, considering that a homogeneous solution of surfactant with a high cloud point presents better stability.
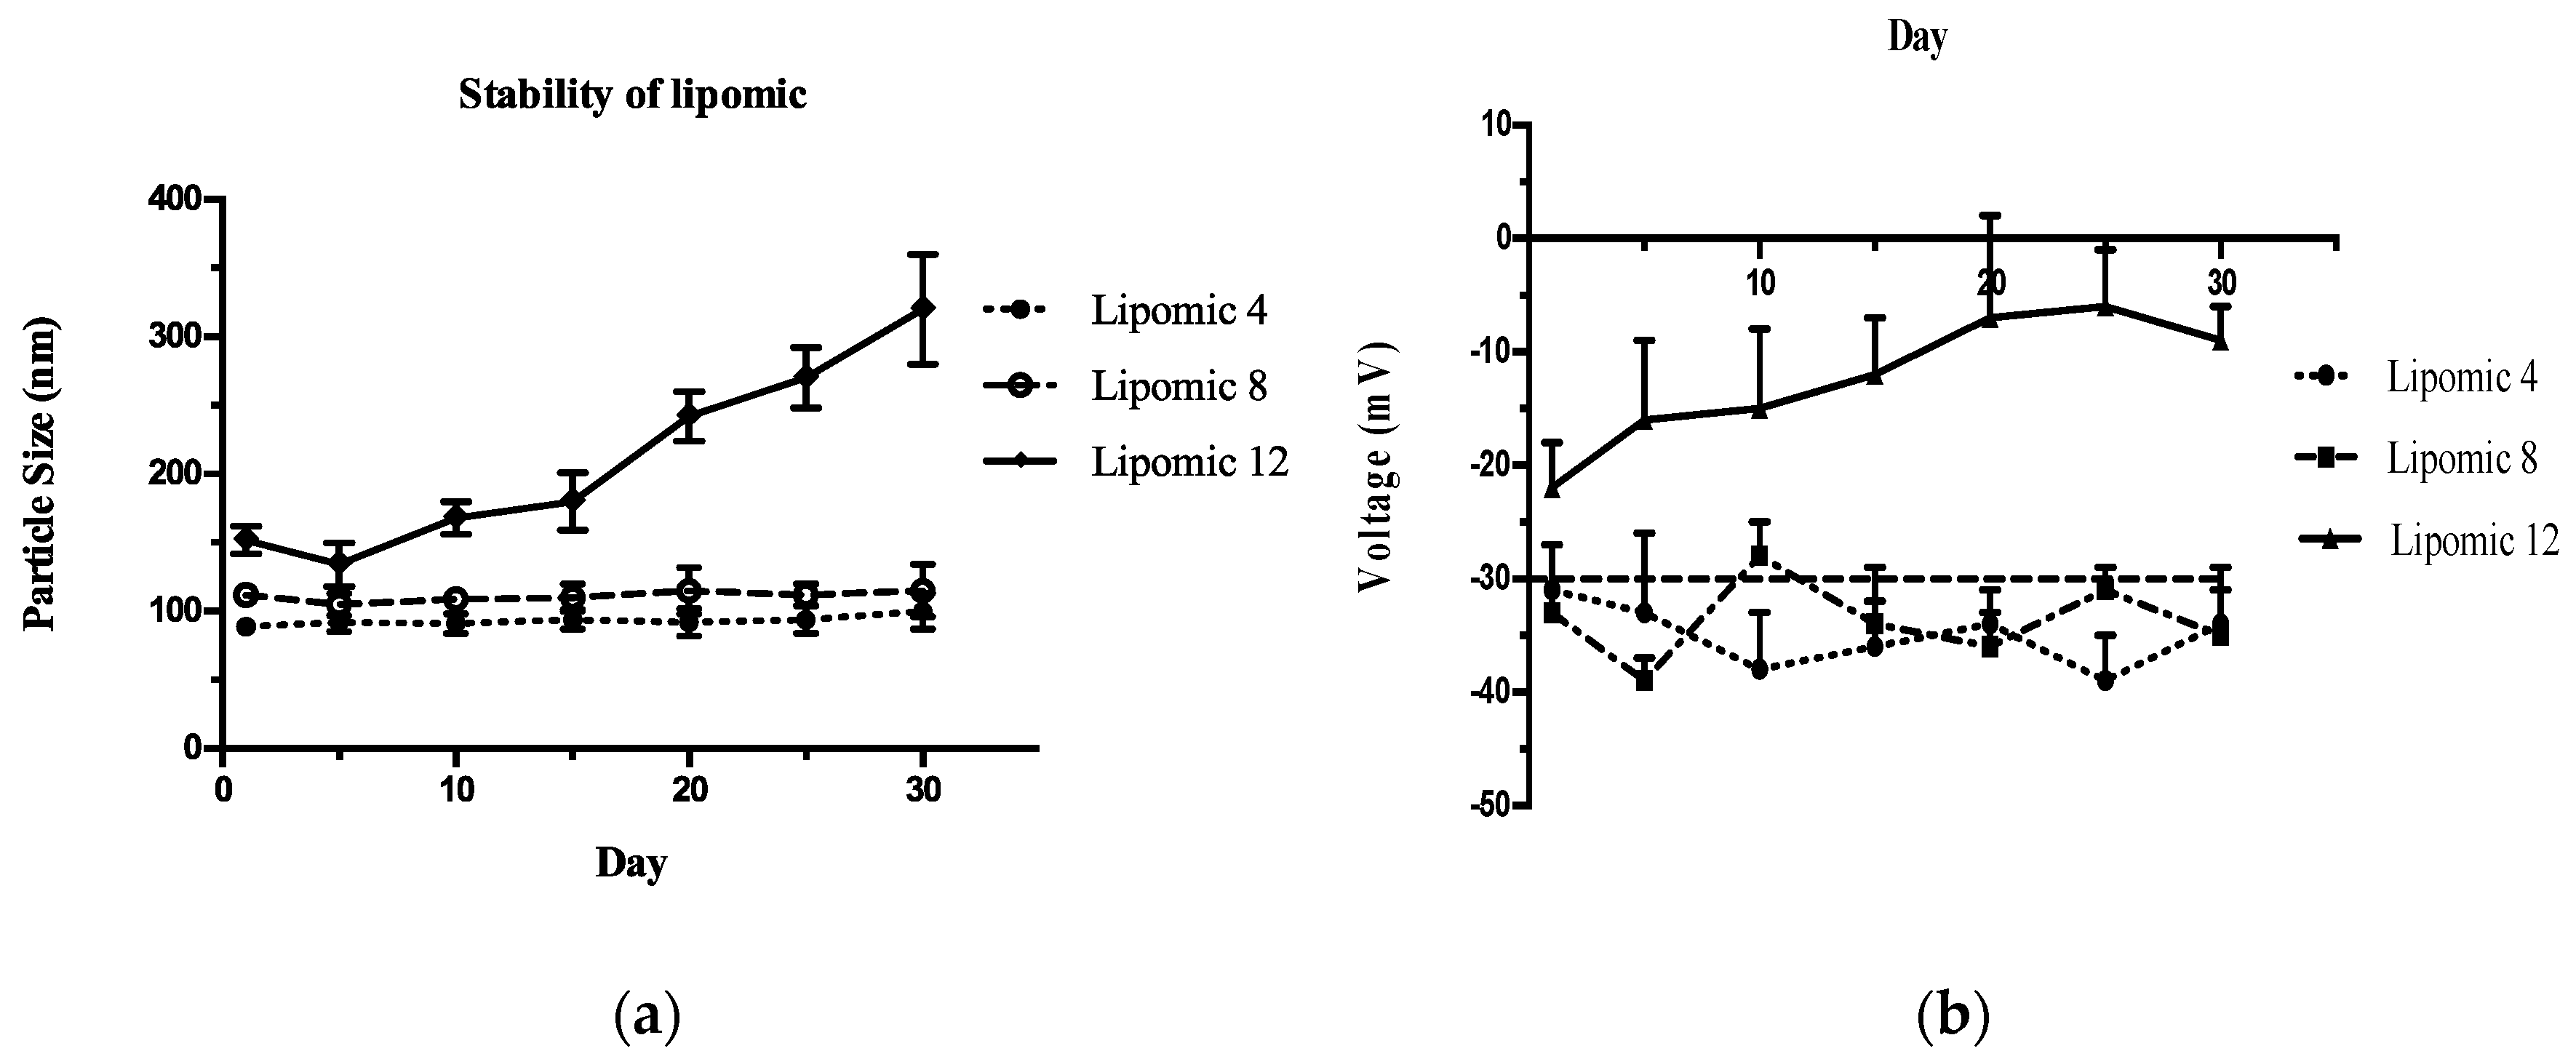
Colloidal systems, such as liposomes and lipomics, are considered thermodynamically unstable. The physical stability of these systems depends on several factors: temperature, stress during transport inside the organism, compatibility of excipients, particle size, and the Zeta potential of the system [15]. A colloidal system ceases to be considered stable when the separation of its phases is irreversible; the most stable systems are those where the forces of repulsion predominate among the suspended particles, thus avoiding the coalescence and flocculation of the particles [16,17]. The physicochemical evaluation studies implemented in this work indicated that formulations 8 and 4 showed the best stability for 30 days (Figure 2). It was considered that the electrostatic forces between the particles did not suffer from alterations because in none of the systems was an increase in particle size greater than 150 nm observed, and the Z potential was maintained at around −30 mV. Therefore, the particles’ agglomeration, fusion, coalescence, and precipitation were avoided.
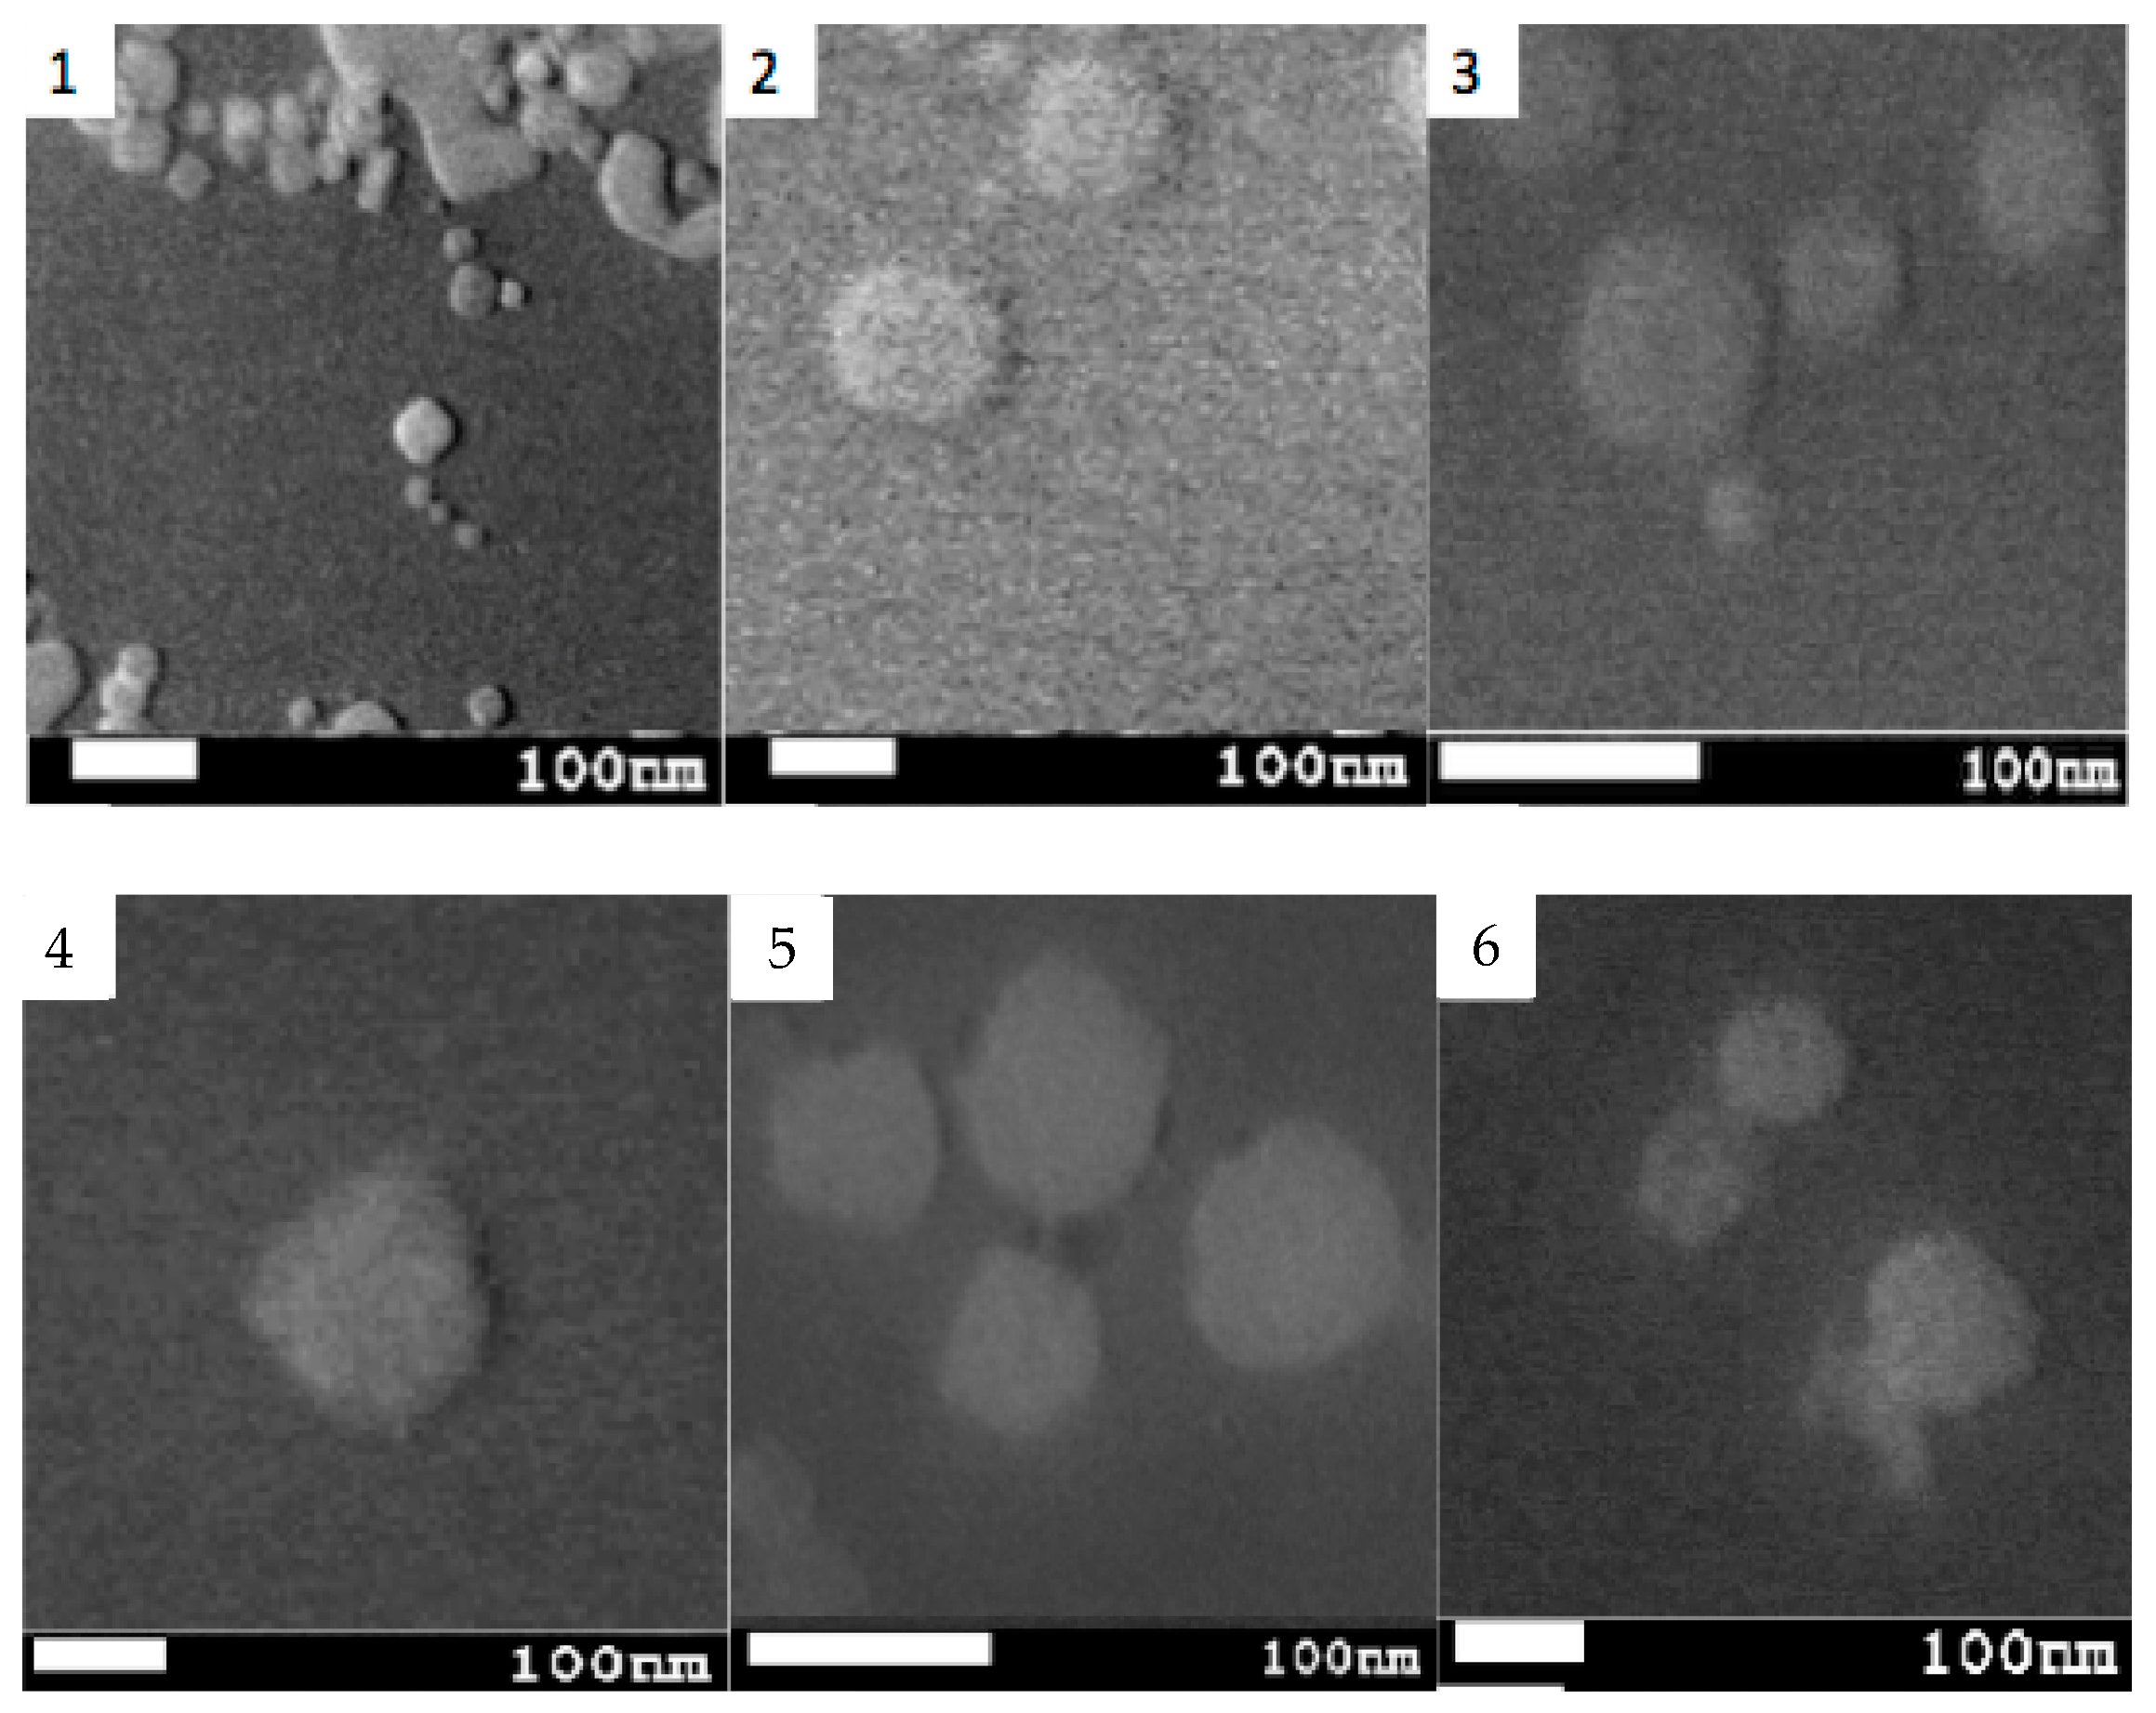
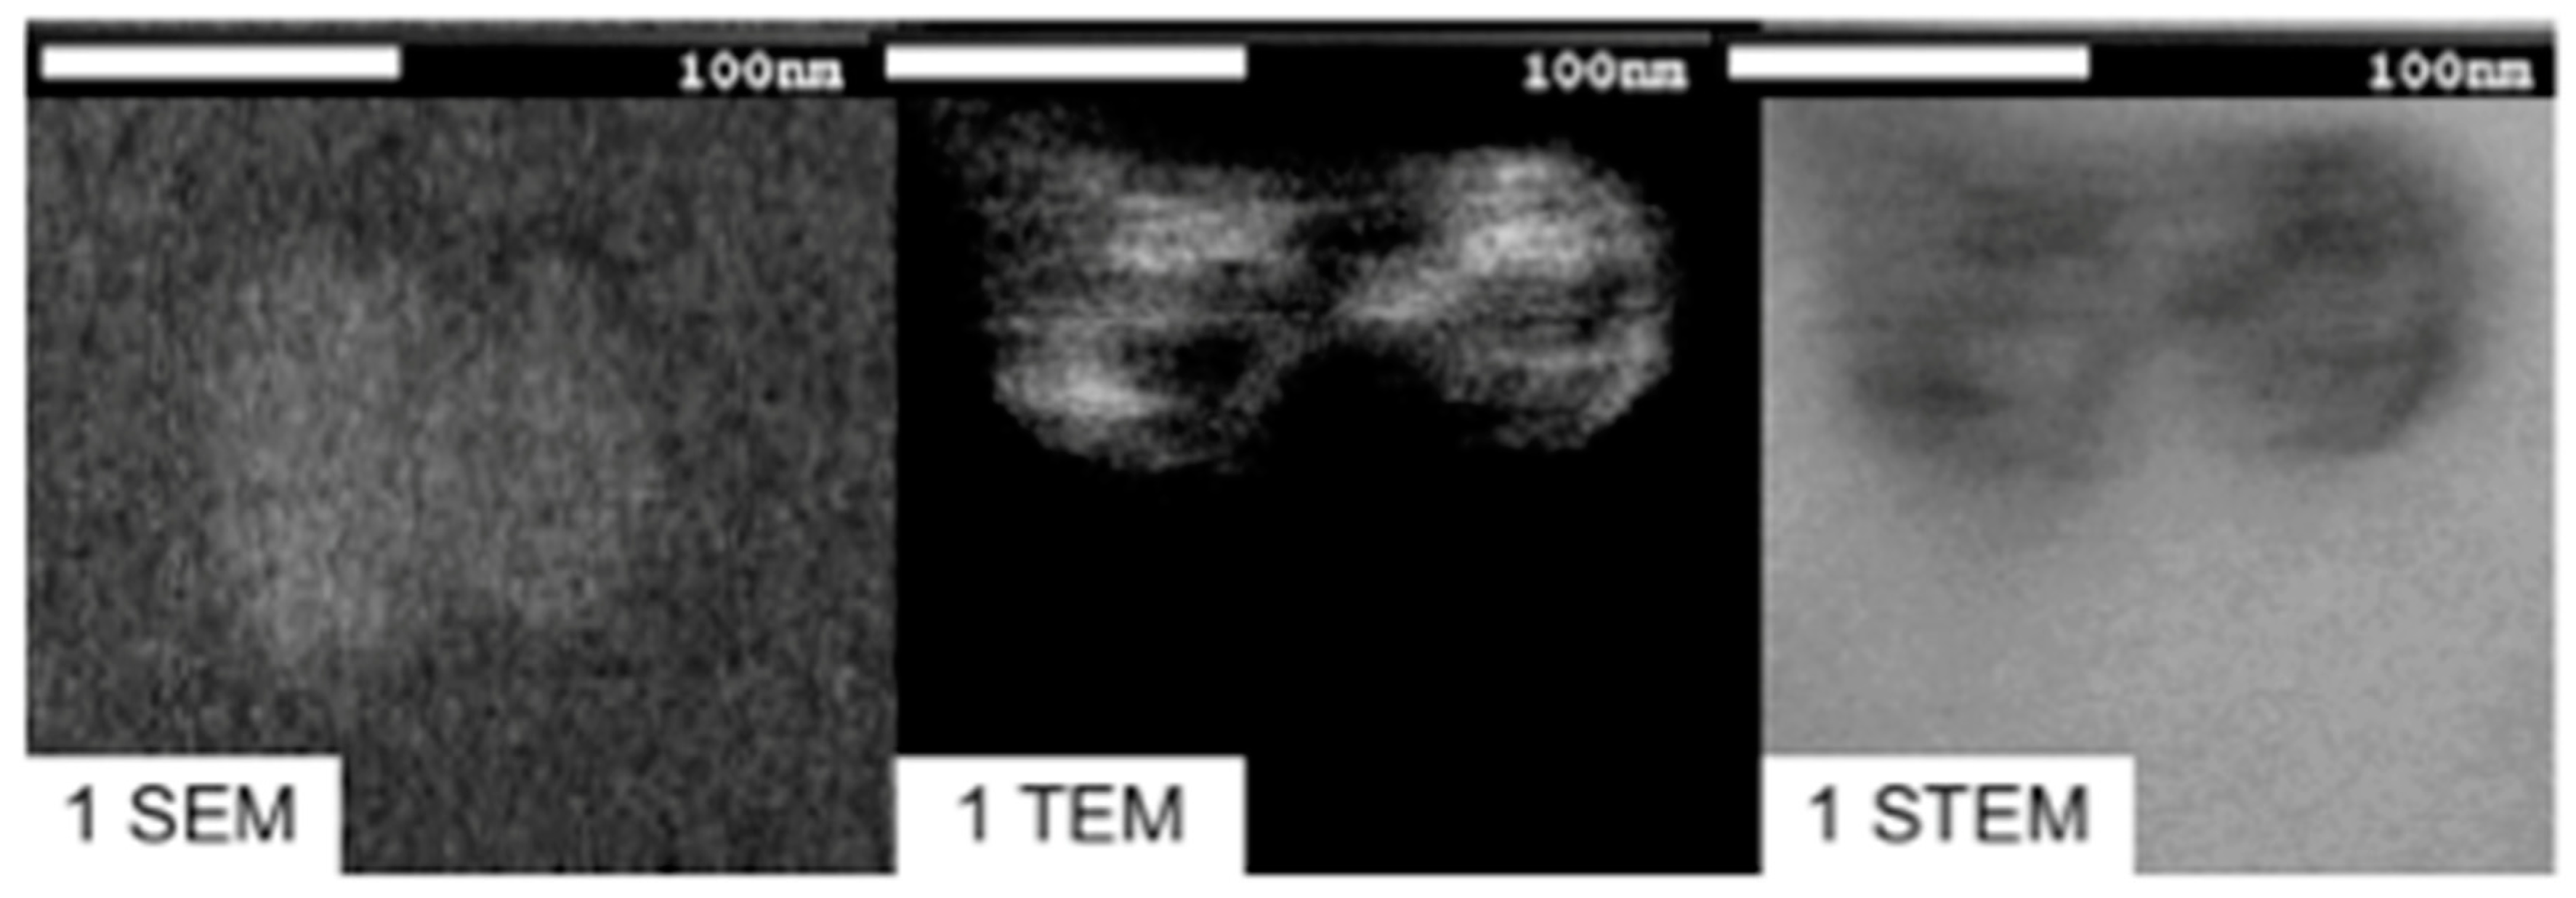
The shape and size of nanoparticles greatly influence their biodistribution and elimination from the organism [18]. Using SEM microscopy, it was possible to obtain images that allowed for the evaluation of these properties [19]. Spherical geometry and particle sizes around 100–200 nm are qualities that allow low detection rates by the immune system and, theoretically, a prolonged circulation time in the body [20]. With TEM/STEM microscopy, we sought to evaluate the internal structure of lipomics. Including a hydrophilic contrast medium in lipomics, such as uranyl acetate, highlights the hydrophilic regions inside. The electrons impinging on the uranyl acetate molecule are stopped, translating the image into regions with greater contrast and hydrophilic characteristics [21].
A second stage in this work was the radiolabeling process, reducing 99mTcO4 with SnCl2, which formed a stable octahedral complex [22]. The 
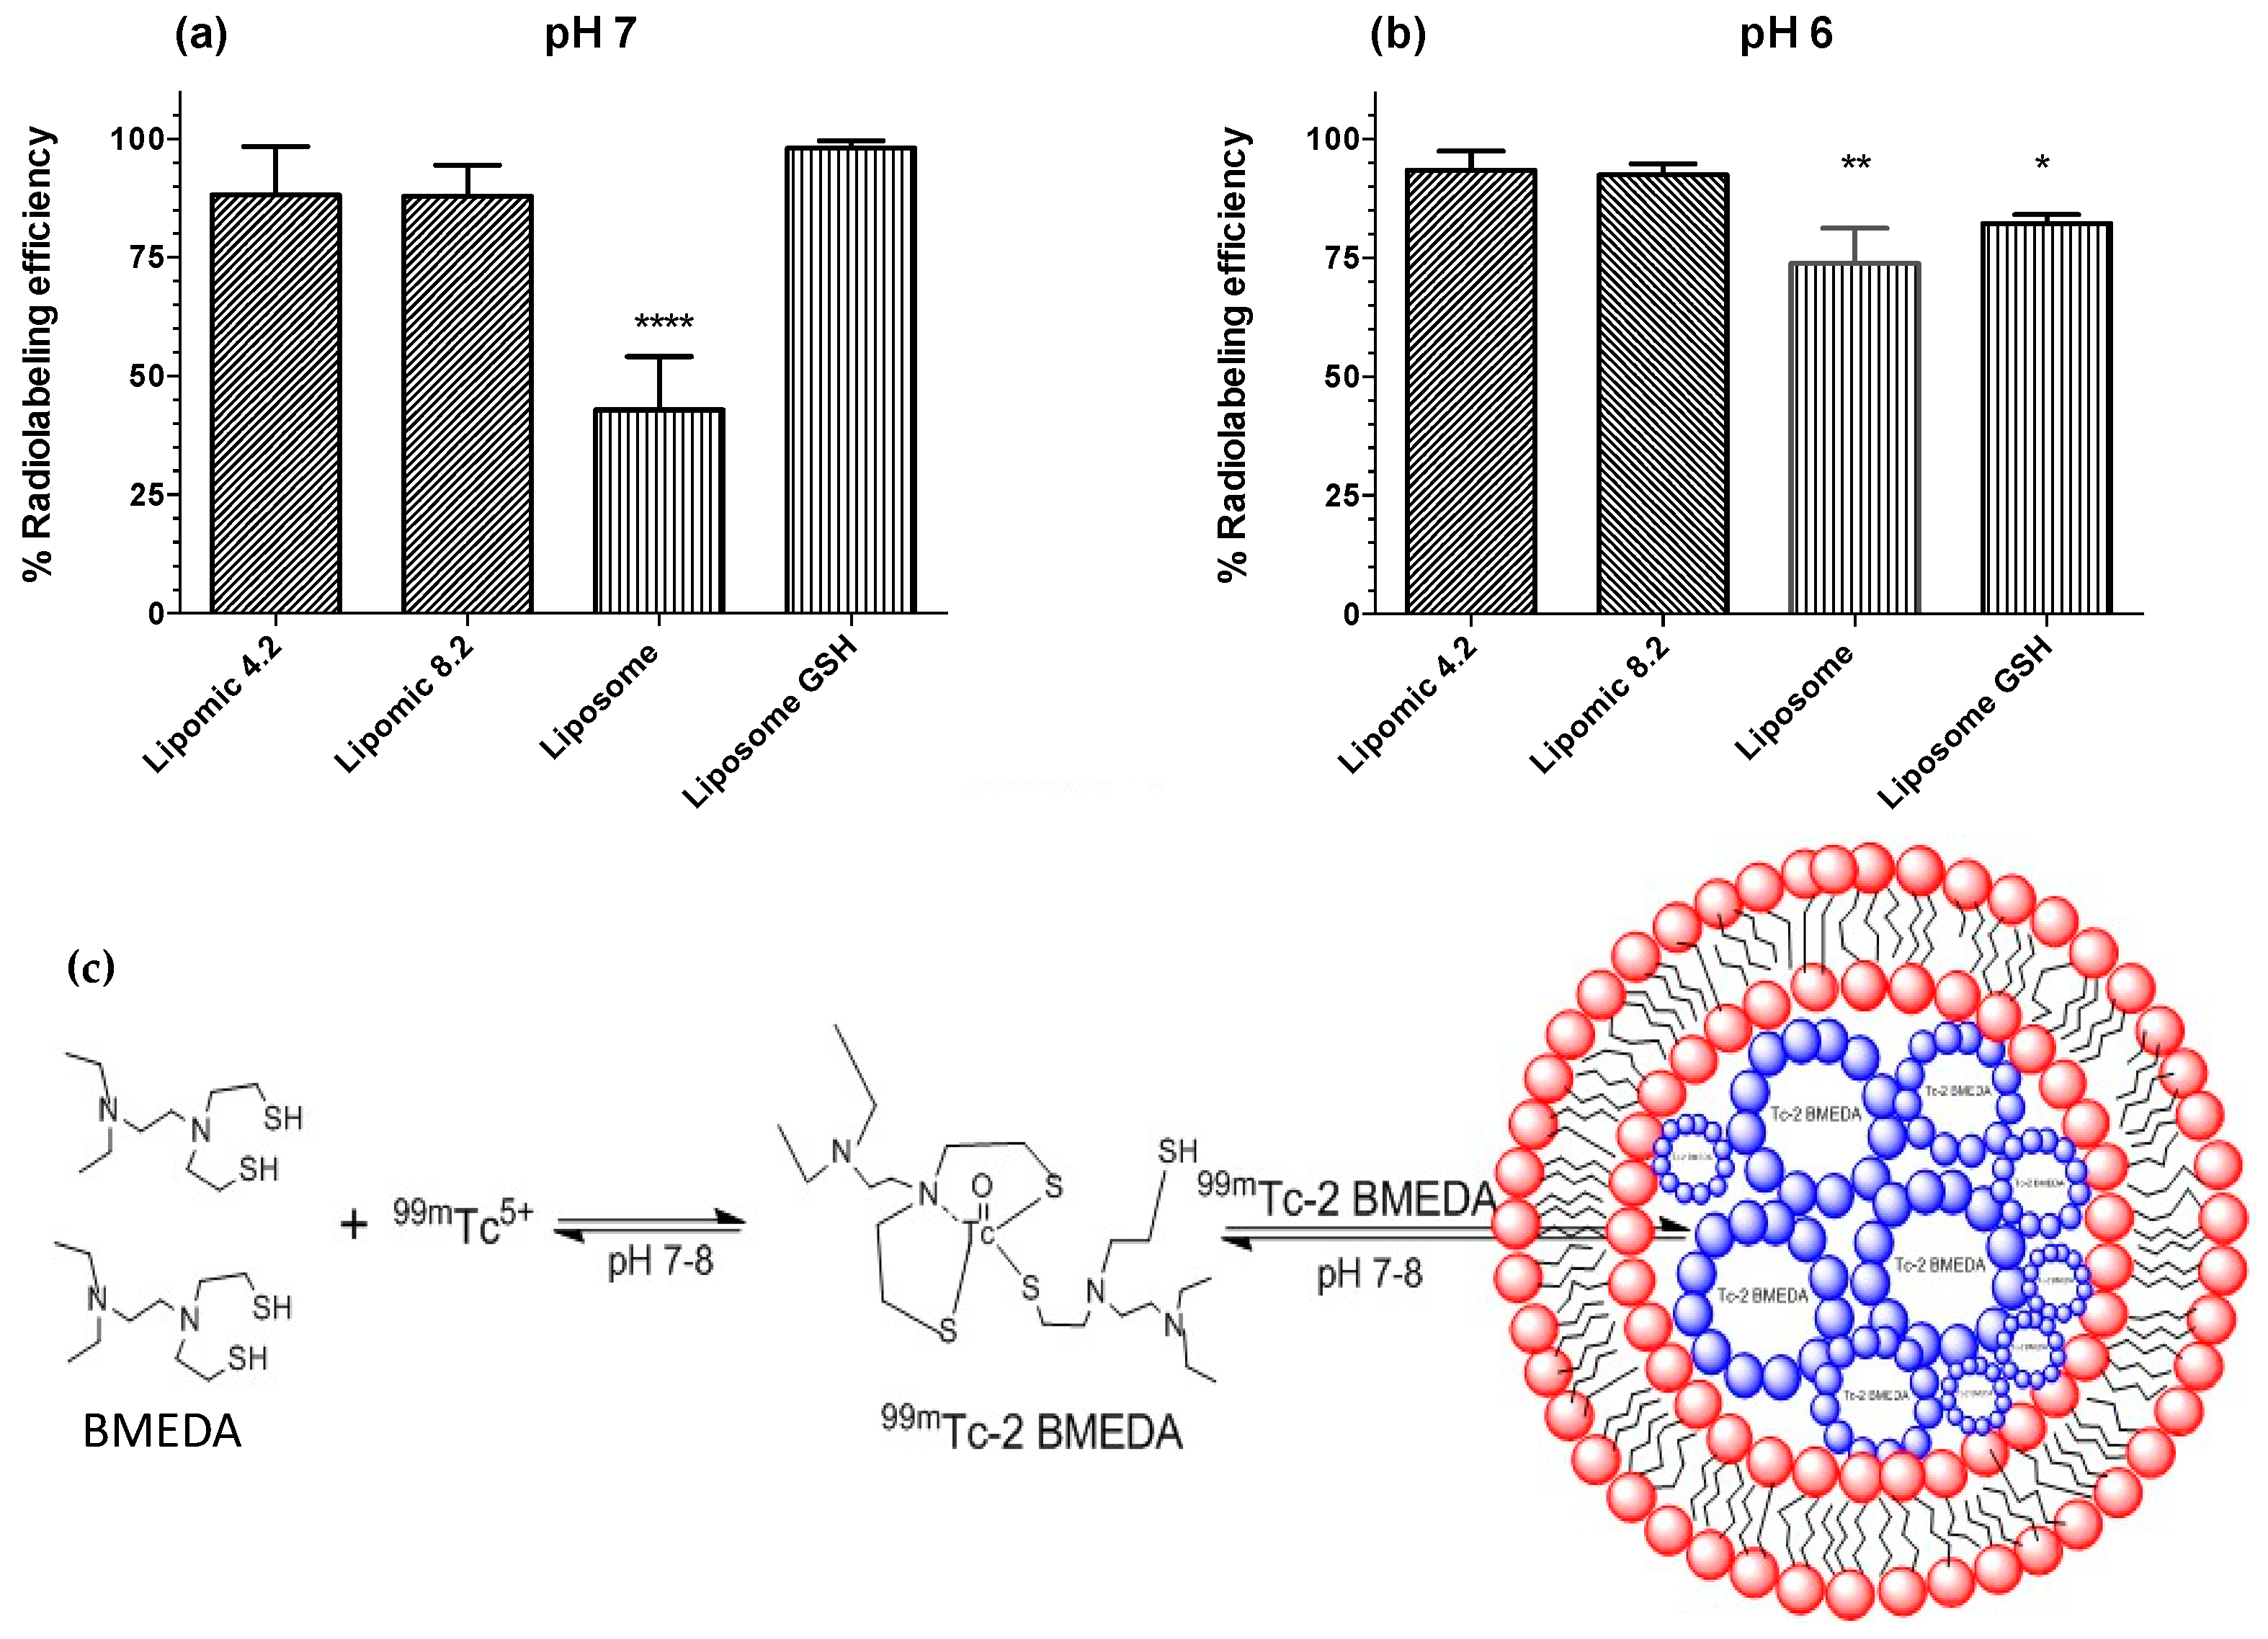
99mTc–2BMEDA complex has a complexation pattern “SNS/S” (Figure 6c) that is the nucleus of technetium attached on the one hand to two atoms of sulfur and one of nitrogen, and is also attached to another atom of sulfur belonging to a second molecule of BMEDA [23]. The result of the process produces a complex with a hydrophobic or hydrophilic character dependent on pH [24]. Radiolabeling procedures also allowed us to obtain information about the structure of lipomics, considering that a hydrophilic chelator will find it more challenging to cross the lipid bilayer without the help of a concentration gradient or carrier. When performing the experiments with a concentration gradient of glucoheptonate, it was observed that the radiolabeling efficiency of hydrophilic molecules for liposomes was above 85% (Figure 6a), observing a better efficiency in lipomics. This result suggests the presence of hydrophilic compartments within the lipomics. When the same chelator was modified to a pH 7–8, it acquired lipophilic properties, facilitating its passage through the lipid bilayer. In these conditions, lipomics and liposomes did not show statistically significant differences, since both systems could carry more than 90% of the 99mTc inside (Figure 6b). For lipomics, once the lipophilic complex of technetium entered through the lipid bilayer, the aqueous molecules inside drove the lipophilic molecules into the micelles, where they were trapped (Figure 6c). On the other hand, liposomes did not achieve an uptake greater than 50% in lipophilic conditions due to the repulsion of the lipophilic complex through its aqueous interior (Figure 6b). The results of the radiolabeling combined with the results of electronic microscopy suggest the existence of lipomic systems, also showing its hybrid nature, being able to “load” both hydrophilic and lipophilic compounds and being more efficient than liposomes by not requiring the use of glucoheptonate.
Solubility has a crucial role in the success of any drug candidate because low solubility not only causes problems for in vitro and in vivo assays, but also adds significant burdens to drug development. The delivery of hydrophobic chemotherapeutic drugs via the intravenous route remains a great challenge as these therapeutic molecules are associated with poor pharmacokinetics and bioavailability. In the present study, we obtained a nanocarrier-based biocompatible, non-toxic, and stable system, which can potentially address some of the problems associated with hydrophobic drug encapsulation. Pegylated lipomics as nanocarrier systems are promising for drug delivery; in addition to improving the pharmacokinetics of lipophilic drugs by internalizing them in the micelles core, the lipomics may allow specific a combination of drug delivery by inherent passive-targeting and active-targeting strategies.
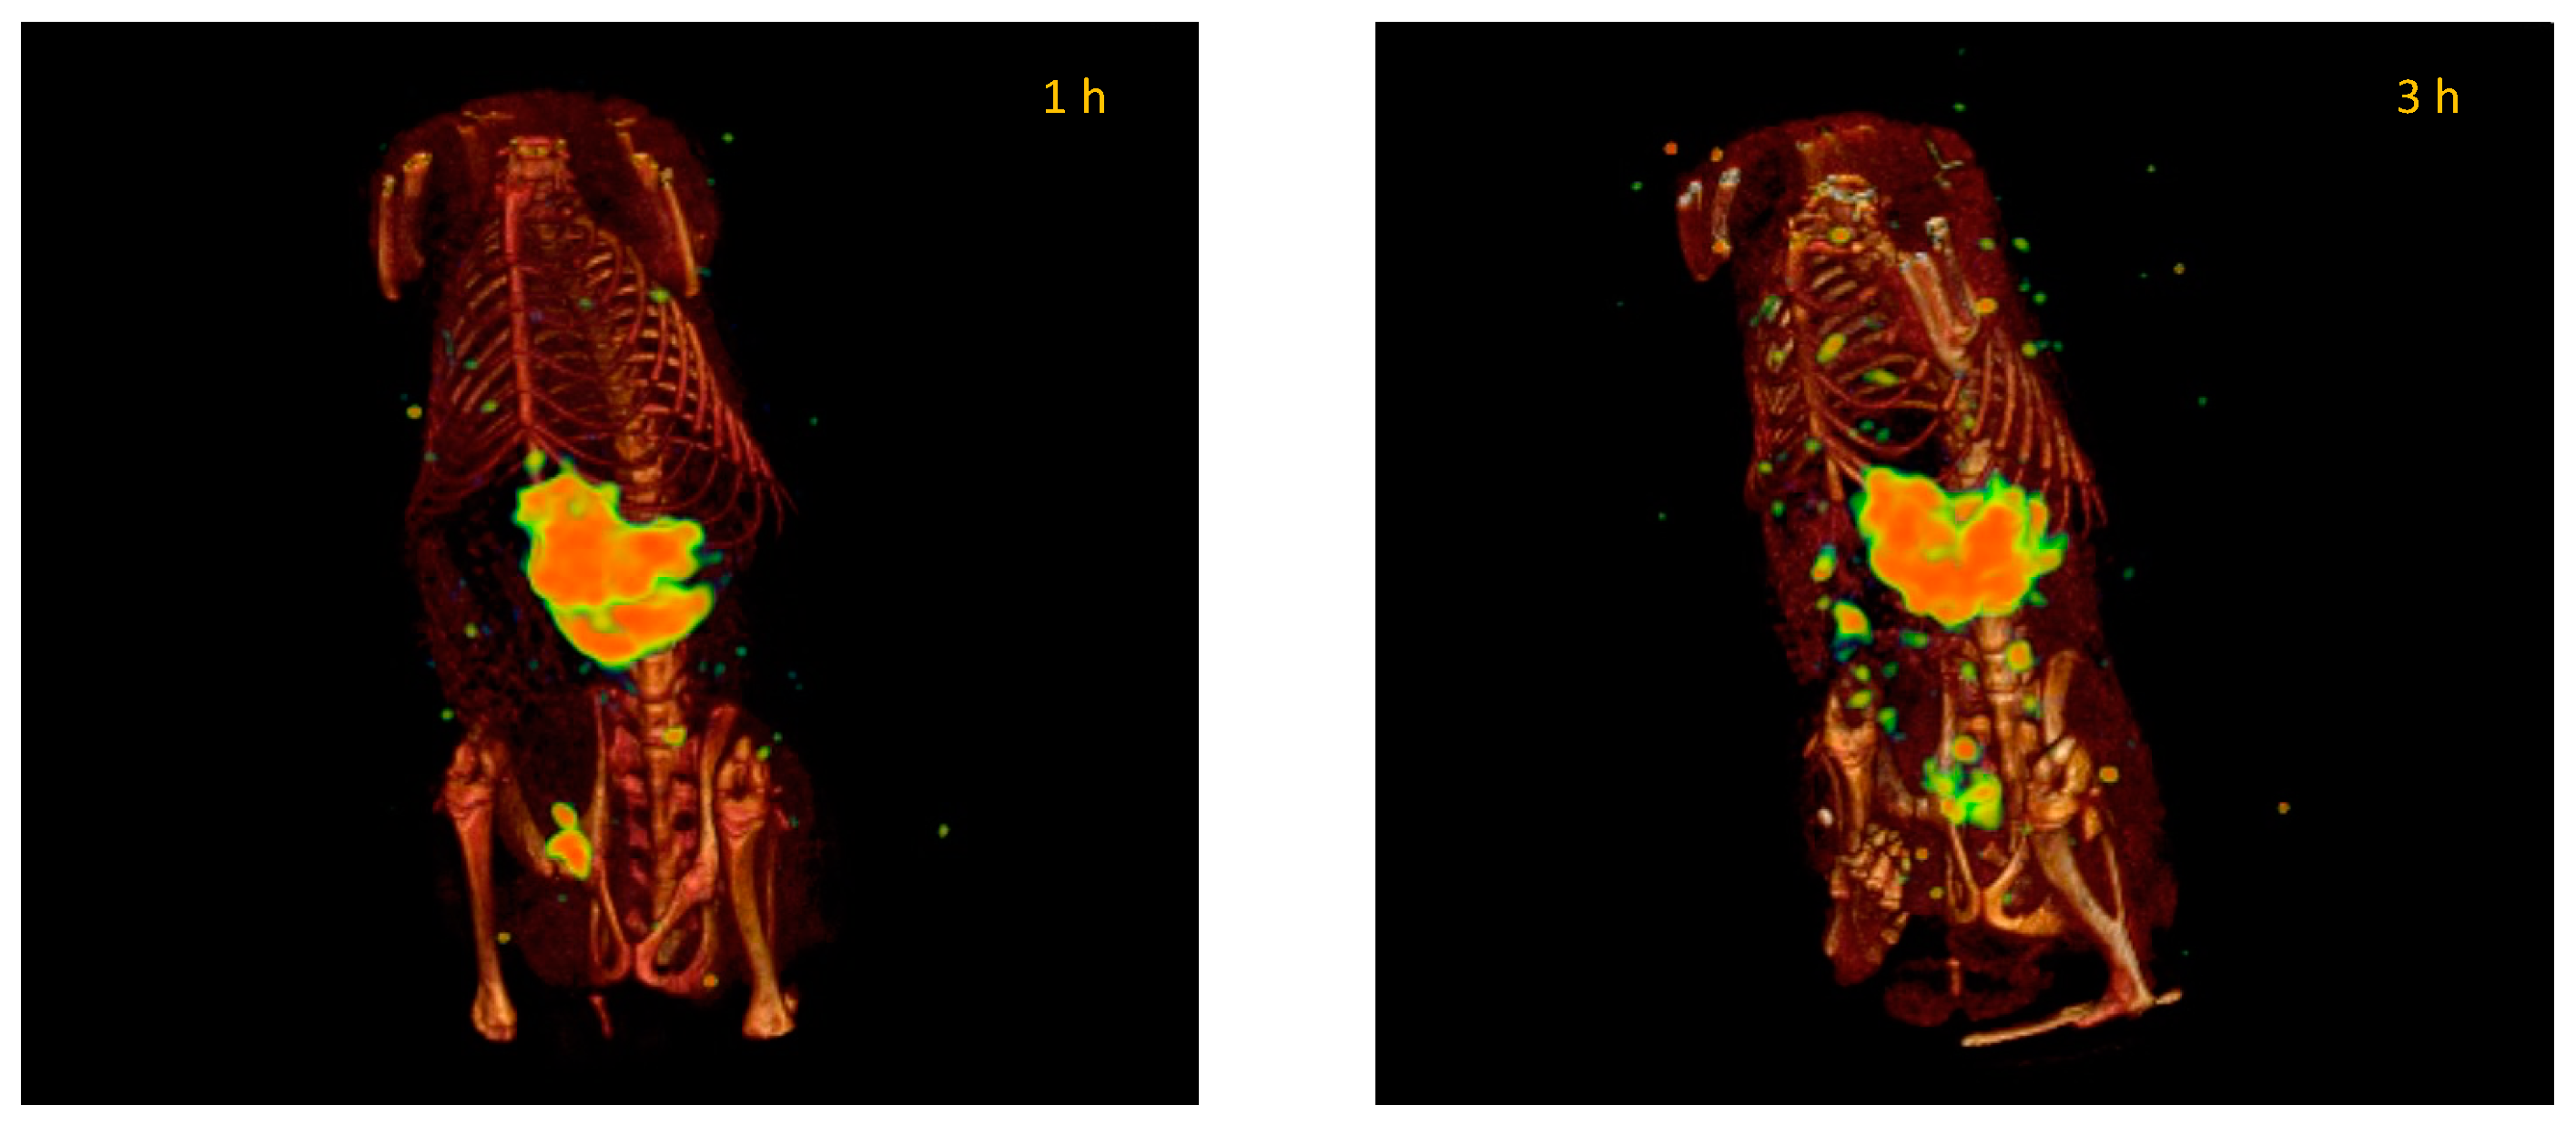
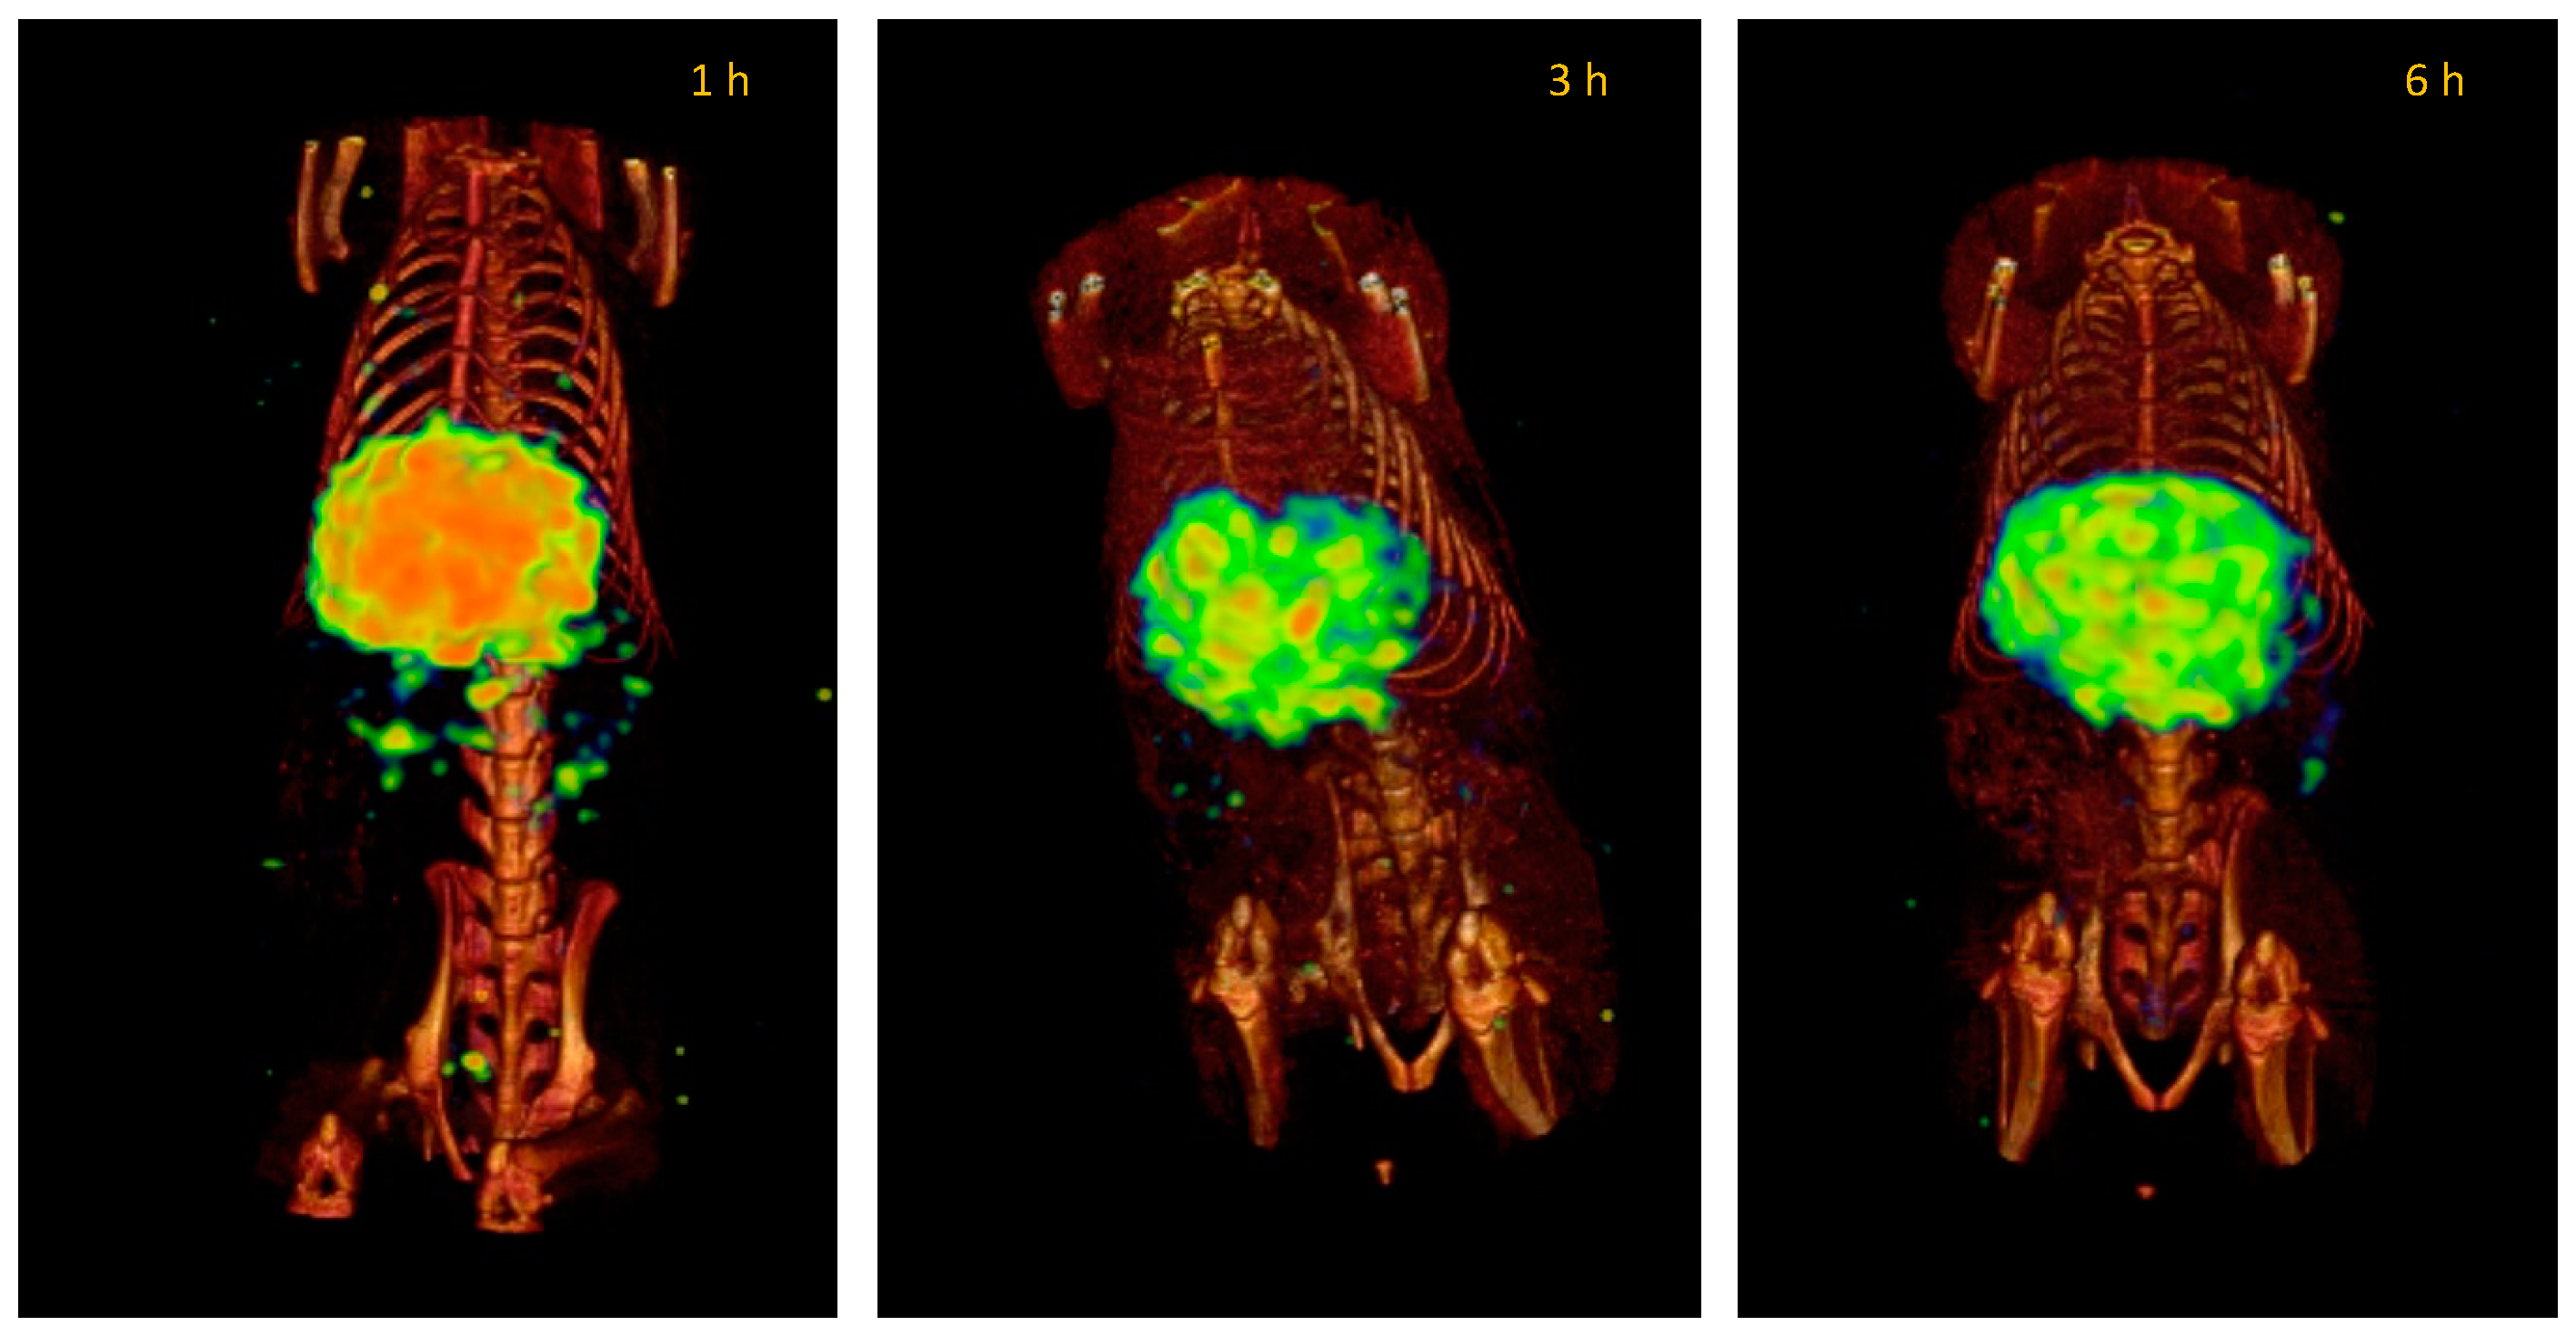
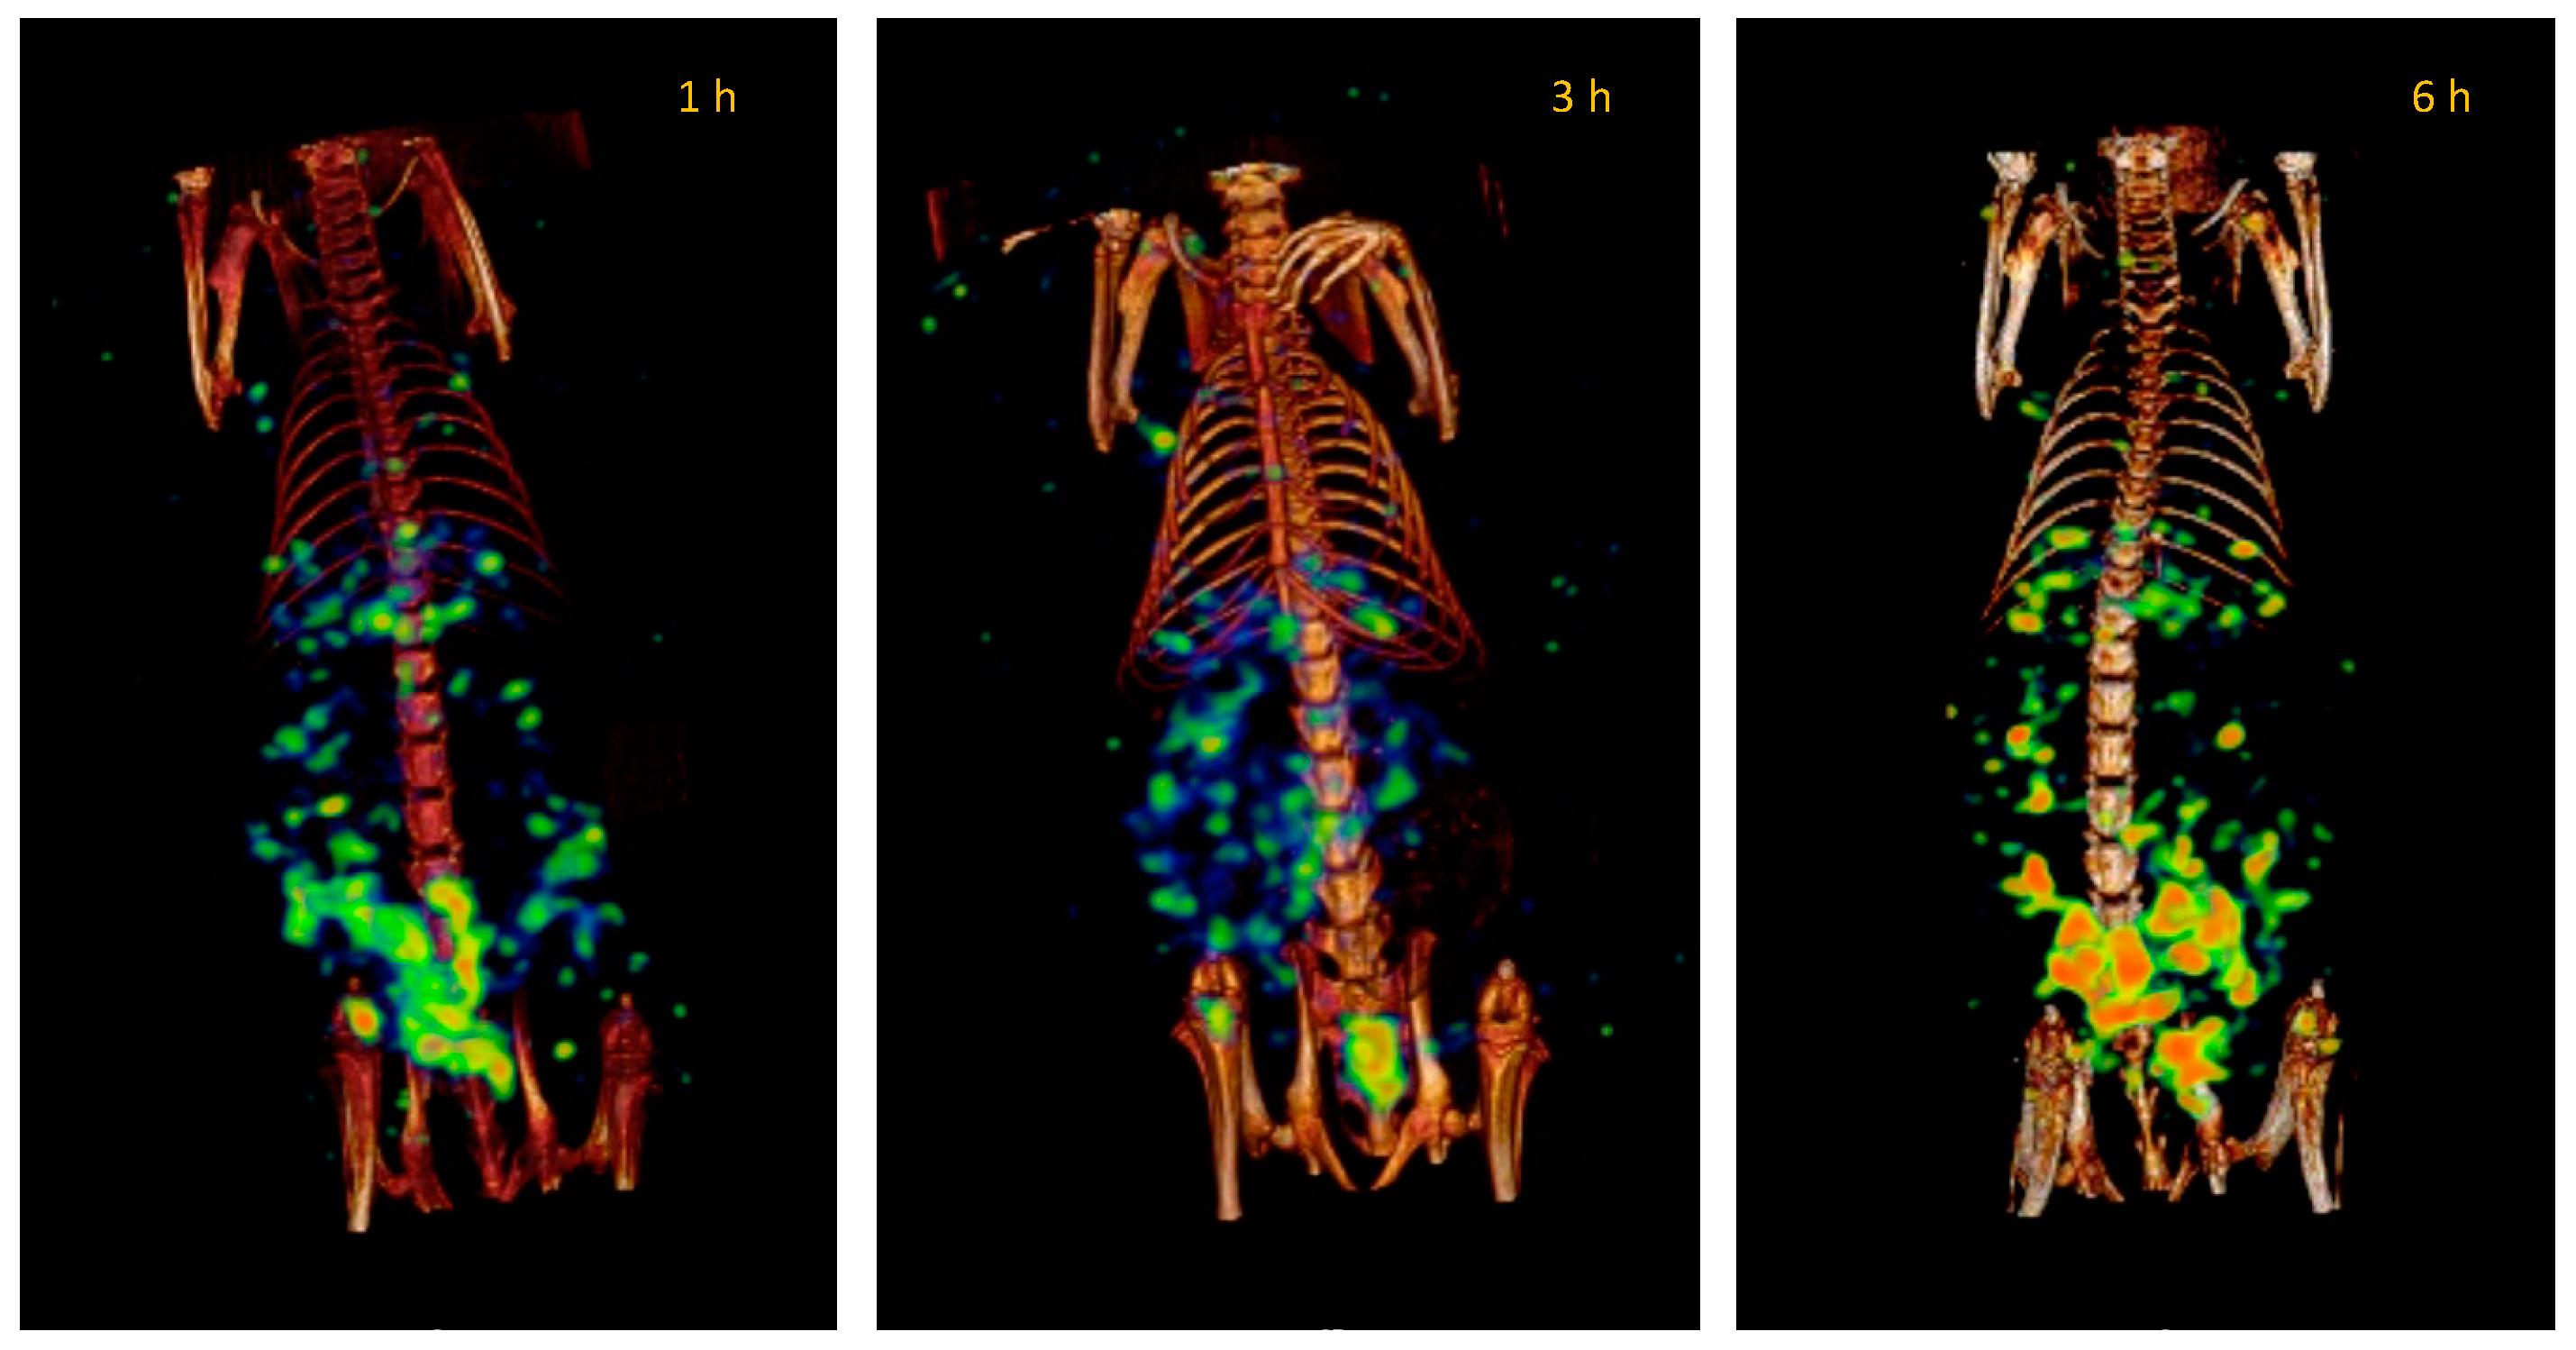
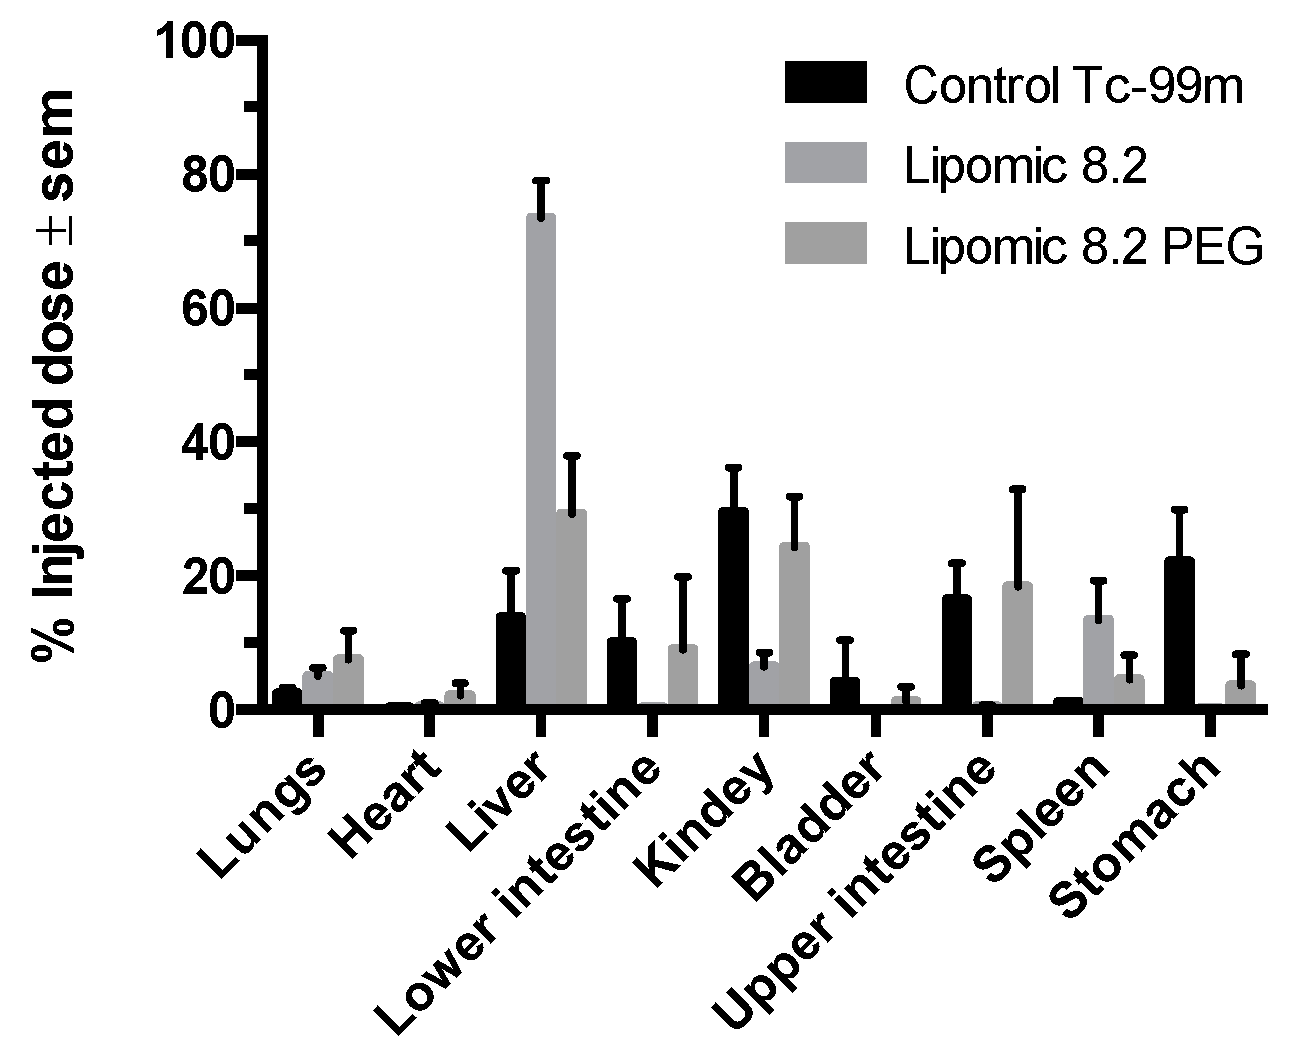
Plasma pharmacokinetics and molecular imaging studies present an overview of the kinetic behavior of systems within the organism. When comparing the biodistribution of “free” 99mTcO with radiolabeled lipomics, with and without PEG, pharmacokinetic differences are evident (Figure 9, Figure 10 and Figure 11). By not presenting a protective coating, such as PEG, the differences in the circulation time of 99mTcO and 99mTc lipomics are not statistically significant. Liposomes without this coating have shown circulation for approximately 90 min [25], matching our results (Figure 8, Table 3). The technetium, a free molecule smaller than lipomics, is quickly removed from circulation through the renal and glandular systems. On the other hand, pegylated lipomics accumulate in the liver and spleen, although a more heterogeneous biodistribution is observed in the intestines and stomach. Rapid metabolization in the liver and spleen may cause the release of 99mTcO- and, once free, it follows its normal metabolism pathway.
The potential of lipomics to carry both hydrophilic and lipophilic compounds needs to be evaluated with drugs commonly used in medical treatment, and cancer therapy, for example. The main limitation of anticancer drugs, such as taxanes (paclitaxel, docetaxel, and taxol), cisplatin, or gemcitabine is their lack of aqueous solubility, a magnified issue considering the need for its administration by intravenous infusions. Some solubilization strategies for these drugs include using surfactants and co-solvents that also result in adverse side effects [26]. The implemented procedures used here to elaborate lipomics offer a novel alternative that could minimize adverse effects; no solvents were used in the lipomic elaboration, and surfactants used to form micelles were encapsulated, avoiding its direct interaction that could induce side effects.
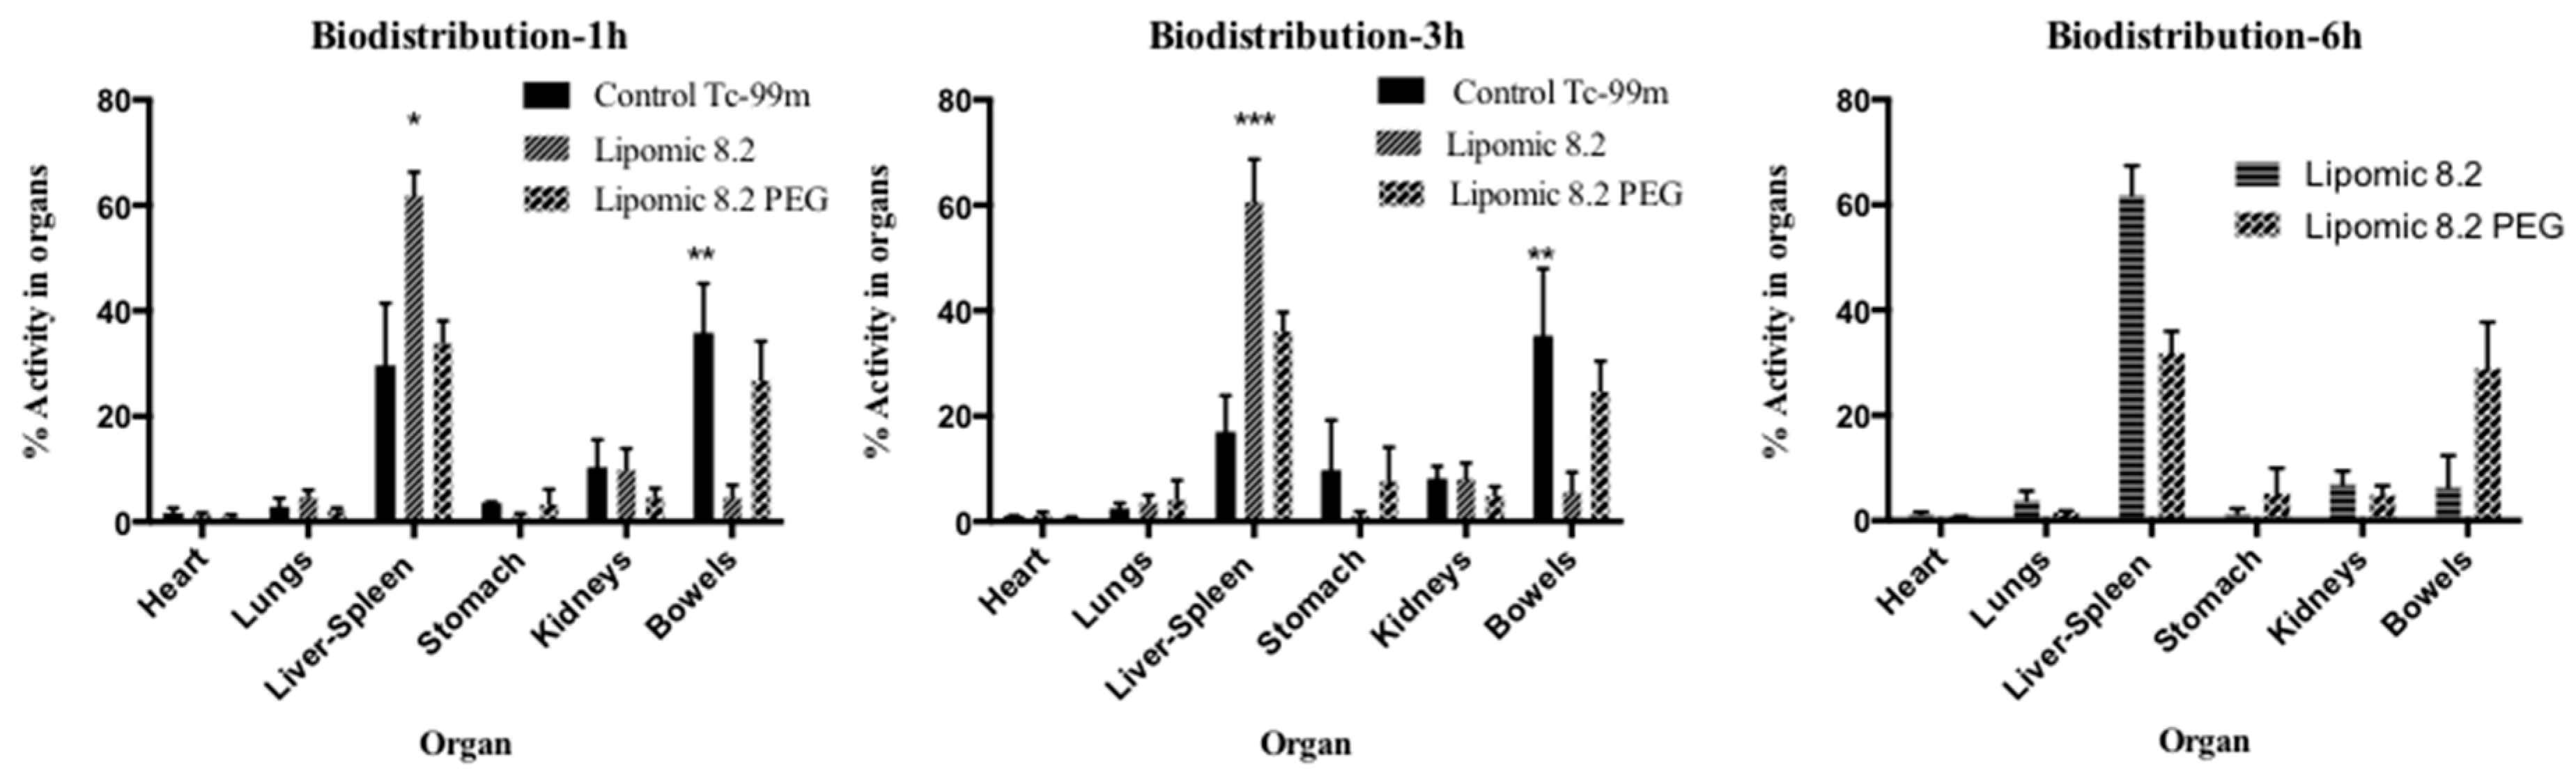
The quantitative analysis of biodistribution at 6 h (Figure 12 and Figure 13) indicated that non-pegylated lipomics accumulated almost exclusively in the liver, as it is the organ responsible for the metabolism of phospholipids. These lipomics could be used as carriers for drugs related to liver fibrosis, a distinct stage of chronic liver diseases that need novel treatments to block and reverse the underlying pathological process [27]. For example, silymarin and curcumin have promising effects for liver fibrosis; however, their poor bioavailability, water solubility, toxicity, and targeting efficiency limit their application [27,28]; their encapsulation in lipomics could help to reduce these limitations. Other drugs used for liver fibrosis treatment are under investigation, and nanocarriers, such as lipomics, offer a promising field of research to treat this disease. Notably, this carrier showed potential benefits similar to other carriers for poorly water-soluble drugs [26,29] that include improved pharmacokinetics and circulation half-life, passive targeting of the liver leading to improved treatments reducing systemic side effects, allowing the co-delivery of hydrophilic and lipophilic drug combinations in a single carrier, and the protection of drugs from quick degradation. As mentioned before, no solvents were used in its preparation, allowing us to minimize the toxic effects on the liver.

4. Materials and Methods

For the manufacturing of lipomics and liposomes, the following excipients were used: 1,2-Distearoyl-sn-Glycero-3-Phosphatidylcholine (DSPC) (Northern Lipids INC, Burnaby, BC, Canada), soy lecithin (Droguería Cosmopolitan, Ciudad de México, México), cholesterol (Chol) and N-(Carbonyl-Methoxypolyethylene glycol 2000)-Dystearoyl-Glycerophosphoethanolamine (DSPE-mPEG (2000) (T&T Scientific Corp, Knoxville, TN, USA), polyoxyethylenesorbitan monolaurate (Tween® 20), polyoxyethylene sorbite monopalmitate (Tween® 40), polyethylene glycol sorbitan monostearate (Tween® 60) and polyoxyethylenesorbitan monoeleate (Tween® 80), dextrose, glucohepptonic acid α−D-sodium salt (GSH), ammonium sulfate ((NH4)2SO4) (Sigma-Aldrich St. Louis, MO, USA), uranyl acetate (UO2(CH3COO)22H2O) (Specialty Chemistry of the Northwest, Sonora, Mexico), chloroform (CHCl3) (Reproquifin, Ecatepec de Morelos, Mexico), and methanol (CH3OH) (Honeywell Research Chemicals, Charlotte, NC, USA).
For the physicochemical evaluation, BI-ZR3 Zeta, a standard for potential (Brookhaven Instruments Corporation, USA); a particle-size reference standard made with NanospheresTM (Thermo Scientific, Waltham, MA, USA); potassium chloride (KCl); sodium chloride (NaCl); and ammonium ferrothiocyanate (NH4FeSCN) (Specialty Chemistry of the Northwest, Sonora, Mexico) were used.
In the radiolabeling, N,N-Bis(2-mercaptoethyl)-N′,N′-diethylenediamine (BMEDA), dimethylsulfoxide MB-grade (DMSO), tin chloride II (SnCl2) (Sigma-Aldrich St. Luis, MO, USA), nitrogen gas (PRAXAIR, Guildford, UK), hydrochloric acid (HCl) (Fermont, Monterrey, Mexico), acetic acid (CH3COOH) (Reproquifin, Ecatepec de Morelos, Mexico), and technetium pertechnetate (99mTcO) (MIYMSA, CdMx, México) were used.

4.1. Taguchi’s Experimental Design

Minitab software (Minitab Inc. Version 18) was used to design Taguchi’s experimental method. Four variables, (i) surfactant concentration; (ii) phospholipid; (iii) sonication time; and (iv) flow rate, with two levels of assessment (levels 1 and 2), were considered to measure the effect of particle size (Table 4). An orthogonal arrangement with sixteen possibilities was proposed (Table 5).

4.2. Determination of the Cloud Point (Cp)

Four non-ionic surfactants (Tween® 20, 40, 60, and 80) were used to determine the Cp; twelve solutions were elaborated at different concentrations in a weight-to-weight ratio (%w/w) in an isotonic saline solution (0.9% NaCl).
The Cp was determined with a homemade turbidimeter. This was created with an experimental setup consisting of a heating bracket (the grill) of one piece of copper and three 5 W resistors; a magnetic stirrer consisting of a motor with speed control by non-feedback PWM with a neodymium magnet; a vial holder; a thermocouple type K; an LED (the emitter) (5 W, 475 nm wavelength); a detector with a photodiode; and microcontroller to perform measurements and control the system. The equipment was validated with standard measurements before its use.
A vial with a non-ionic surfactant sample was placed on the stand and in contact with the grill. Then, agitation and temperature measurements were initiated. The LED (emitter) turned on and off with a square signal of 500 Hz. A trans-impedance amplifier supported the photodiode (receiver), and the voltage at its output was measured with the microcontroller. The first harmonic amplitude was obtained as a measure related to light intensity. The measurement of the light sensor at 30 °C was considered the baseline for determining the change in turbidity. The turbidity point was considered when there was a change of −3 dB from the initial measurement on the light sensor. The temperature at this point was recorded as the Cp.

4.3. Elaboration of Lipomics

Empty Lipomics

The lipomics were prepared with a mixture of non-ionic surfactants (Tween 20, 40, 60, or 80) and phospholipids (DSPC, Chol, PEG-200) in a molar ratio of (DSPC/Tween/Chol/PEG-200) 60:30:5:5 mol. This mixture was placed in a ball flask, where it was homogenized using a magnetic stirring grill with moderate heating for about an hour; during this time, a volume of isotonic saline (NaCl 0.9%) was added by an infusion pump (baby-B). Subsequently, the ball flask was placed in a rotavapor (Buchi r-3, Switzerland) at 120 rpm for 1 h with sonication and at the temperature of the Cp of the non-ionic surfactant used.

4.4. Elaboration of Liposomes

4.4.1. Empty Liposomes

In a sterile glass jar, the phospholipids (DSPC/Chol/PEG-200) were placed in a molar ratio of 60:35:5 mol, respectively. The phospholipid mixture was dissolved in 15 mL of a chloroform–methanol mixture in a 2:1 ratio. This solution was added, by slow drip, in 10 mL of sterile deionized water at 60 °C. The mixture was transferred to a ball flask and held for an hour of stirring at 120 rpm in a rotavapor (Buchi r-3, Flawil, Switzerland). Subsequently, the ball flask was placed inside a desiccator for 24 h to remove the remains of the solvents.

4.4.2. Manufacture of Liposomes Loaded with Glucoheptanate

The same methodology previously described was used, but by replacing the 10 mL of deionized water with a solution of sodium glucoheptanate (GSH) with a concentration of 1 mg/mL, dissolved in a solution of ammonium sulfate ((NH4)2SO4) of 300 mM. At the end of the process, the liposomes were eluted in a PD-10 column (pH 7.4), previously balanced with a PBS solution.

4.5. Physicochemical Evaluation

4.5.1. Ternary Diagrams

For elaborating the pseudo-ternary phase diagrams, OriginPro software (OriginLab Corporation., Northampton, MA, USA) was used to visualize the variability in the proportion of components along each trajectory.

4.5.2. Particle Size and Z Potential

Dynamic Light-Scattering Spectrophotometry (DLS) determined the particle size and Z potential using Zetasizer Analyzer 90 PLUS/BI-MAS equipment (Brookhaven Instruments Corporation, Holtsville, NY, USA).
A total of 5 μL of polystyrene nanospheres were used as a reference standard (Duke Scientific, Palo Alto, CA, USA) dispersed in approximately 2 mL of KCl 10 mM, previously filtered (Millipore filter of 0.22 μm) to verify the proper functioning of the equipment. For sizing (hydrodynamic diameter), 10 μL samples of the lipomics diluted in approximately 2 mL of KCl 10 mM were used.
The Zeta potential was determined using a palladium electrode with a clear four-sided acrylic cell. As a standard, BI-ZR3 Zeta was used in a previously filtered KCl 1 mM solution (Millipore filter of 0.22). The measurement was performed with 100 μL of sample diluted in 1.5 mL of KCl 1 mM.

4.5.3. Quantification of Phospholipids

The quantification of the phospholipids was performed with Stewart’s method [30]. Briefly, 20 μL of lipomics or liposome samples were dried and reconstituted with chloroform (1mL); ammonium ferrothiocyanate (1 mL) was added and the mixture was shaken vigorously followed by centrifugation at 4 °C, 3000 rpm for 3 min (Centrifuge 5702R rotor #A-4–38, Eppendorf AG, Germany). The absorbance of the chloroform phase was measured with a UV-Vis DUO 530 spectrophotometer (Beckman Coulter, Brea, CA, USA) at a wavelength of 480 nm. A calibration curve (Abs vs. phospholipid concentration (mg/mL)), created with known concentrations of a solution of DSPC in chloroform, was used for quantification.

4.5.4. Physicochemical Stability

All lipomic solutions were stored in conical tubes (Thermo Fisher Scientific) at 4 °C; from these samples, an aliquot was obtained every 5 days, and the Zeta potential and particle size were measured to evaluate their stability for 30 days.

4.5.5. STEM, SEM, and TEM Microscopies

Microscopy techniques were applied only to lipomic formulations with high stability over 30 days. Briefly, a dilution (1:100) was made of each sample, then a drop (~50 μL) was placed on a copper grid coated with 400-mesh carbon film and allowed to dry for 5 min. Then, the sample was stained with 2% uranyl acetate solution allowed to be absorbed by the lipomics. Subsequently, the samples were placed in an Ultra-High Resolution Scanning Electron Microscope JSM-7800F (Institute of Physics, UNAM). TEM and STEM techniques (electron beam at 30 kV) evaluated the morphology and size. No contrast medium (uranyl acetate) was used with SEM imaging.

4.6. Radiolabeling

4.6.1. Preparation of BMEDA Kits for Radiolabeling

Two kits were prepared to implement radiolabeling. Kit 1 (to radiolabel lipomics) was prepared with 70 μL of BMEDA at a concentration of 0.5 mg/mL dissolved in dimethyl sulfoxide (DMSO) and 840 μL SnCl2 with a concentration of 10 mg/mL dissolved in HCl 0.1 M. Kit 2 (to radiolabel liposomes) contained the same components as Kit 1, plus 875 μL of GSH with a concentration of 50 mg/mL dissolved in 10% acetic acid v/v. The kits were vigorously stirred and degassed with nitrogen (N2) for 15 min. The final volume of each kit was divided into 11 Eppendorf tubes (Thermo Fisher Scientific). These tubes were frozen with liquid nitrogen and subjected to lyophilization (FreeZone 2.5, Labconco, Fort Scott, KS, USA). The freeze-dried samples (BMEDA kits) were stored under vacuum conditions in a desiccator until later use.

4.6.2. Radiolabeling of Liposomes and Lipomics

BMEDA kits were resuspended in 5 mL of isotonic saline (NaCl 0.9%) and subsequently degassed for 15 min with N2. Then, HCl 1 M was added until a pH of 2 was obtained. From the above solution, an aliquot of 1 mL was obtained and placed in an Eppendorf tube, followed by adding 185 MBq (5 mCi) of technetium pertechnetate (99mTcO); the mixture was vigorously stirred for 30 min. Later, the pH was modified by adding NaOH 1 M until reaching a value of 6 or 7, depending on the sample.
For radiolabeling, a volume of lipomics or liposomes, equivalent to 30 μmol of phospholipids (~0.5 mL), was added to 99mTc-2BMEDA Kits 1 or 2, respectively, and incubated at 39 °C for 1 h at 300 rpm. Radiolabeling efficiency (RE) was estimated by instant thin-layer chromatography on silica-impregnated glass-fiber sheets (iTLC-SG) (Agilent Technologies, Santa Clara, CA, USA). Two microliters of RIC were spotted on 10 cm strips of the chromatography sheet paper; isotonic saline was used as the mobile phase. The strips were cut in half, and the radioactivity in each segment was measured using a well-type gamma counter (Ludlum 2200, Sweetwater, TX, USA). The %RE was calculated as:
%RE = 100 × [B1/(T1 + B1)]
where B1 and T1 represent the radioactivity (cps) measured at the bottom and top iTLC-SG segments, respectively.

4.6.3. In Vitro Radiolabeling Stability

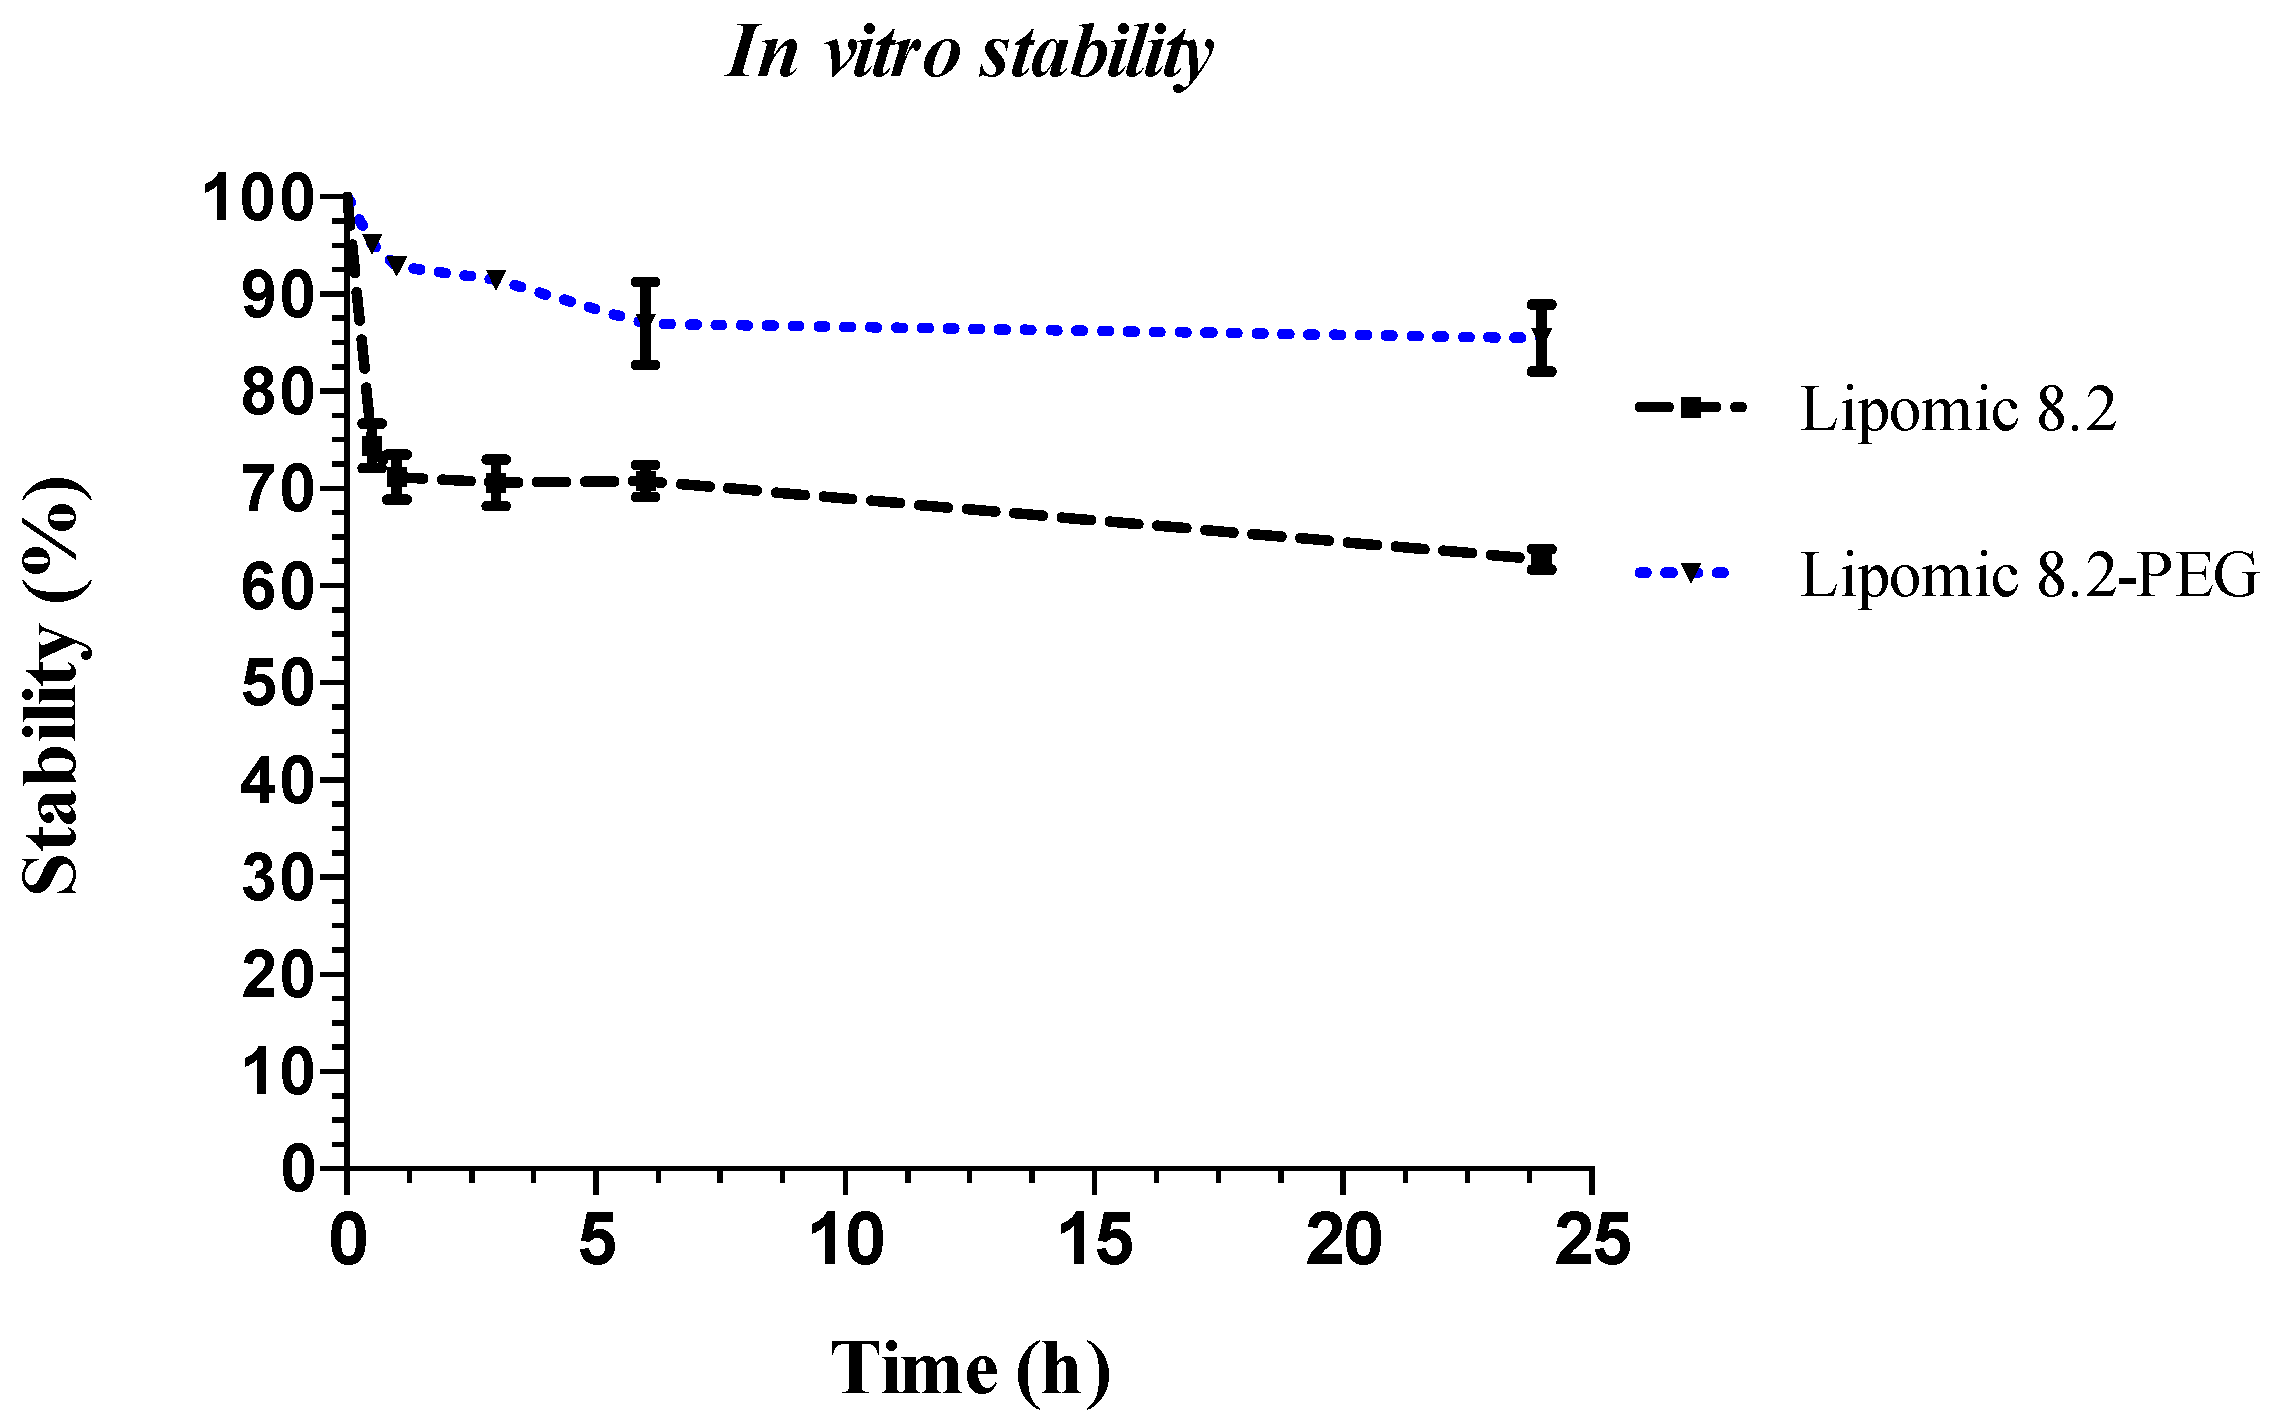
An aliquot of 20 μL of radiolabeled lipomics was obtained and added to 250 μL of human serum. Subsequently, the mixture was incubated in a dry bath at 37 °C with a constant stirring of 300 rpm (Multi-Therm, Thermo Fisher). Aliquots of 2.5 μL were obtained at 0, 0.5, 1, 3, 6, 12, and 24 h; %RE was measured as previously described.

4.7. Pharmacokinetic Evaluation

4.7.1. Animals

Healthy male Wistar rats (6–8 weeks old) were obtained from the UNAM’s Medical School animal facility (Mexico City). The animals were kept in a pathogen-free environment and fed with autoclaved food and water ad libitum with photoperiod day/night 12/12, at a temperature of 22 °C and humidity of 40%. The procedures for the care and use of the animals were approved by the local Institutional Scientific and Ethics Committees at INCan (017/027/IBI)(CEI/1147/17), and all applicable governmental regulations (NOM-062-ZOO-1999, Ministry of Agriculture, Mexico City, Mexico) were followed. The guidelines from the Guide for the Care and Use of Laboratory Animals of the National Institute of Health (NIH, Bethesda, MD, USA) [31] were also followed. All efforts were made to minimize animal suffering and reduce the number of animals used in the experiments.

4.7.2. Blood Pharmacokinetics and Biodistribution Studies of Rats

The rats were organized into three groups (n = 5). The control group was administered intravenously with 250 μCi of 99mTcO, while experimental groups were intravenously injected with 300 μCi of 99mTc-lipomics or 99mTc-lipomics-PEG. Twenty microliters of blood drawn from the tail was collected at different times (min. to hours). The sample’s radioactivity was immediately measured on the well gamma counter (Ludlum 2200, Sweetwater, TX, USA). A graph of blood activity concentration (μCi/mL) against time was created, and the pharmacokinetic parameters were obtained from the calculation of a bicompartmental model. Some animals were sacrificed at 3 h, and the organs of interest were removed (spleen, heart, stomach, liver, small intestine, large intestine, lungs, kidneys, and bladder); these organs were weighed, and significant portions of the tissue were taken to quantify the activity in them.

4.7.3. Image Acquisition and Analysis

Imaging studies were performed at 1, 3, and 6 h after injection to observe the biodistribution of 99mTcO, 99mTc-lipomics, and 99mTc-lipomics-PEG in the body. A microPET/SPECT/CT imaging system (Albira ARS, Bruker, Valencia, Spain) was used. During imaging, the rats were anesthetized using a mixture of oxygen/isoflurane at 3%. SPECT scans using a pinhole collimator were performed with 30 projections per detector at 60 s/projections. CT scans were performed with 600 projections (tube voltage 45 kV and 0.4 mA). SPECT images were reconstructed with Albira’s reconstruction software based on the ordered subsets expectation–maximization (OSEM) routine (three iterations).
The percentage of activity at some specific time t (%A(t)) in the site of interest (organs) was calculated from the images as the ratio of the detected counts in the organ and the total number of counts detected in the whole body at baseline (A0), multiplied by 100 (%A(t) = Aorgan(t)/A0 × 100). A volume of interest (VOI) was drawn around the organ and the entire body on the images using PMODE software (PMOD Technologies LLC, Zurich, Switzerland) to determine the number of counts held. A vial with 5 μCi of 99mTcO was imaged and used to correlate counts in the VOIs with organ activity. Counts associated with the VOIs were corrected for radioactive decay with the image acquisition time.

4.8. Statistical Analysis

Values are reported as mean values ± standard deviation. Statistical analysis was performed using a one-way analysis of variance (ANOVA) on Prism 8 software (GraphPad Software, San Diego, CA, USA). The significance was determined at p < 0.05.

5. Conclusions

The poor aqueous solubility of drugs has been a serious limitation in clinical practice, mainly in the development of anti-cancer compounds that are regularly rejected because of their low solubility and high systemic toxicity. The higher dosing of many current chemo-drugs is also limited by the toxicity of high concentrations of surfactants/co-solvents used to solubilize the drugs. In this context, the lipomics elaborated in this work presented the potential to carry poorly water-soluble compounds offering additional advantages, such as the co-delivery of hydrophilic and lipophilic drugs, avoiding the use of solvents in its preparation. The system also showed an improved biodistribution and pharmacokinetics that will help to reduce systemic toxicity and protection of drugs from rapid degradation.
The implementation of the Taguchi method and ternary diagrams allowed for the development of a reproducible technique for the elaboration of lipomics. In addition, the physicochemical characterization of the lipomic demonstrated concrete evidence of the existence of the proposed structure. We intend to improve lipomics as a hybrid system to carry poorly water-soluble anticancer drugs and optimize the use of active-targeting strategies that will improve treatments.

Author Contributions

Conceptualization, L.A.M., C.J.-O. and D.R.-H.; methodology, D.R.-H., C.J.-O., V.I.-S., P.A.F.-R., J.O.-N., Y.G.-G. and L.A.M.; formal analysis, L.A.M. and D.R.-H.; investigation, L.A.M., C.J.-O. and D.R.-H.; resources, L.A.M. and J.O.-N.; writing—original draft preparation, L.A.M. and D.R.-H.; writing—review and editing, L.A.M.; supervision, L.A.M. and C.J.-O.; project administration, L.A.M.; funding acquisition, L.A.M. and J.O.-N. All authors have read and agreed to the published version of the manuscript.

Funding

This research was funded by CONACyT México (grant number: 1717349), PAPIIT-UNAM (grant number: IN104919), and institutional resources provided by the Instituto Nacional de Cancerología, México.

Institutional Review Board Statement

The study was conducted in accordance with the guidelines approved by the Institutional Scientific and Ethics Committees at INCan (017/027/IBI), (CEI/1147/17) approved in 2017.

Informed Consent Statement

Not applicable.

Data Availability Statement

Data are contained within the article.

Acknowledgments

The authors thank Elena Arechaga, from the Departamento de Ciencias Naturales, UAM-Cuajimalpa, for the academic support to perform lipomics characterization.

Conflicts of Interest

The authors declare no conflict of interest. The funders had no role in the design of the study; in the collection, analyses, or interpretation of data; in the writing of the manuscript, or in the decision to publish the results.

References

  1. Wang, N.; Cheng, X.; Li, N.; Wang, H.; Chen, H. Nanocarriers and Their Loading Strategies. Adv. Healthc. Mater. 2019, 8, 1801002. [Google Scholar] [CrossRef] [PubMed]
  2. Torchilin, V.P. Targeted pharmaceutical nanocarriers for cancer therapy and imaging. AAPS J. 2007, 9, 128–147. [Google Scholar] [CrossRef] [PubMed] [Green Version]
  3. Yingchoncharoen, P.; Kalinowski, D.S.; Richardson, D.R. Lipid-Based Drug Delivery Systems in Cancer Therapy: What Is Available and What Is Yet to Come. Pharmacol. Rev. 2016, 68, 701–787. [Google Scholar] [CrossRef] [PubMed] [Green Version]
  4. Da Silva, F.L.O.; Marques, M.B.F.; Kato, K.C.; Carneiro, G. Nanonization techniques to overcome poor water-solubility with drugs. Expert Opin. Drug Discov. 2020, 15, 853–864. [Google Scholar] [CrossRef] [PubMed]
  5. Wakaskar, R.R. General overview of lipid-polymer hybrid nanoparticles, dendrimers, micelles, liposomes, spongosomes and cubosomes. J. Drug Target. 2018, 26, 311–318. [Google Scholar] [CrossRef] [PubMed]
  6. Juárez-Osornio, C.; Gracia-Fadrique, J. Structures similar to lipid emulsions and liposomes. Dipalmitoylphosphatidylcholine, cholesterol, Tween 20-Span 20 or Tween 80-Span 80 in aqueous media. J. Liposome Res. 2017, 27, 139–150. [Google Scholar] [CrossRef] [PubMed]
  7. Oyewumi, M.O. Nano-microparticles as immune adjuvants: Correlating particle sizes and the resultant immune responses. Vaccines 2010, 9, 1095–1107. [Google Scholar] [CrossRef] [Green Version]
  8. Monteiro, N.; Martins, A.; Reis, R.L.; Neves, N.M. Liposomes in tissue engineering and regenerative medicine. J. R. Soc. Interface 2014, 11, 20140459. [Google Scholar] [CrossRef] [Green Version]
  9. Bennink, R.J.; van den Elzen, B.D.; Kuiken, S.D.; Boeckxstaens, G.E. Noninvasive measurement of gastric accommodation by means of pertechnetate SPECT: Limiting radiation dose without losing image quality. J. Nucl. Med. 2004, 45, 147–152. [Google Scholar]
  10. Caglar, M.; Tuncel, M.; Alpar, R. Scintigraphic evaluation of salivary gland dysfunction in patients with thyroid cancer after radioiodine treatment. Clin. Nucl. Med. 2002, 27, 767–771. [Google Scholar] [CrossRef]
  11. Franken, P.R.; Guglielmi, J.; Vanhove, C.; Koulibaly, M.; Defrise, M.; Darcourt, J.; Pourcher, T. Distribution and dynamics of (99m)Tc-pertechnetate uptake in the thyroid and other organs assessed by single-photon emission computed tomography in living mice. Thyroid 2010, 20, 519–526. [Google Scholar] [CrossRef] [Green Version]
  12. Peter, W. Design of Experiments via Taguchi Methods—Orthogonal Arrays. In Chemical Process Dynamics and Controls; LibreTexts, UC: Davis, CA, USA, 2022; Available online: https://eng.libretexts.org/@go/page/22674 (accessed on 21 April 2022).
  13. Cisternas, L.A. Diagramas de Fases y su Aplicación, 1st ed.; Editorial Reverté S.A.: Barcelona, Spain, 2009; Volume 1, pp. 17–67. [Google Scholar]
  14. Mukherjee, P.; Padhan, S.K.; Dash, S.; Patel, S.; Mishra, B.K. Clouding behaviour in surfactant systems. Adv. Colloid Interface Sci. 2011, 162, 59–79. [Google Scholar] [CrossRef] [PubMed]
  15. Tadros, T. Application of rheology for assessment and prediction of the long-term physical stability of emulsions. Adv. Colloid Interface Sci. 2004, 108–109, 227–258. [Google Scholar] [CrossRef] [PubMed]
  16. Ivanov, I.B.; Kralchevsky, P.A. Stability of emulsions under equilibrium and dynamic conditions. Colloids Surf. A Physicochem. Eng. Asp. 1997, 128, 155–175. [Google Scholar] [CrossRef]
  17. Gao, X.; Lowry, G.V. Progress towards standardized and validated characterizations for measuring physicochemical properties of manufactured nanomaterials relevant to nano health and safety risks. NanoImpact 2018, 9, 14–30. [Google Scholar] [CrossRef]
  18. Decuzzi, P.; Godin, B.; Tanaka, T.; Lee, S.Y.; Chiappini, C.; Liu, X.; Ferrari, M. Size and shape effects in the biodistribution of intravascularly injected particles. J. Control Release. 2010, 141, 320–327. [Google Scholar] [CrossRef]
  19. Bibi, S.; Kaur, R.; Henriksen-Lacey, M.; McNeil, S.E.; Wilkhu, J.; Lattmann, E.; Christensen, D.; Mohammed, A.R.; Perrie, Y. Microscopy imaging of liposomes: From coverslips to environmental SEM. Int. J. Pharm. 2011, 417, 138–150. [Google Scholar] [CrossRef] [PubMed]
  20. Duan, X.; Li, Y. Physicochemical characteristics of nanoparticles affect circulation, biodistribution, cellular internalization, and trafficking. Small 2013, 9, 1521–1532. [Google Scholar] [CrossRef]
  21. Hargreaves, W.R.; Deamer, D.W. Liposomes from ionic, single-chain amphiphiles. Biochemistry 1978, 17, 3759–3768. [Google Scholar] [CrossRef]
  22. de Kieviet, W. Technetium radiopharmaceuticals: Chemical characterization and tissue distribution of Tc-glucoheptonate using Tc-99m and carrier Tc-99. J. Nucl. Med. 1981, 22, 703–709. [Google Scholar]
  23. Bao, A.; Goins, B.; Klipper, R.; Negrete, G.; Mahindaratne, M.; Phillips, W.T. A novel liposome radiolabeling method using 99mTc-“SNS/S” complexes: In vitro and in vivo evaluation. J. Pharm. Sci. 2003, 92, 1893–1904. [Google Scholar] [CrossRef] [PubMed]
  24. Chang, Y.J.; Chang, C.H.; Chang, T.J.; Yu, C.Y.; Chen, L.C.; Jan, M.L.; Luo, T.Y.; Lee, T.W.; Ting, G. Biodistribution, pharmacokinetics and microSPECT/CT imaging of 188Re-BMEDA-liposome in a C26 murine colon carcinoma solid tumor animal model. Anticancer Res. 2007, 27, 2217–2225. [Google Scholar] [PubMed]
  25. Wu, N.Z.; Da, D.; Rudoll, T.L.; Needham, D.; Whorton, A.R.; Dewhirst, M.W. Increased microvascular permeability contributes to preferential accumulation of Stealth liposomes in tumor tissue. Cancer Res. 1993, 53, 3765–3770. [Google Scholar] [PubMed]
  26. Narvekar, M.; Xue, H.Y.; Eoh, J.Y.; Wong, H.L. Nanocarrier for poorly water-soluble anticancer drugs--barriers of translation and solutions. AAPS PharmSciTech. 2014, 15, 822–833. [Google Scholar] [CrossRef] [PubMed]
  27. Gu, L.; Zhang, F.; Wu, J.; Zhuge, Y. Nanotechnology in Drug Delivery for Liver Fibrosis. Front. Mol. Biosci. 2022, 8, 804396. [Google Scholar] [CrossRef]
  28. Ezhilarasan, D.; Sokal, E.; Najimi, M. Hepatic Fibrosis: It Is Time to Go with Hepatic Stellate Cell-specific Therapeutic Targets. Hepatobiliary Pancreat. Dis. Int. 2018, 17, 192–197. [Google Scholar] [CrossRef]
  29. Kazi, K.M.; Mandal, A.S.; Biswas, N.; Guha, A.; Chatterjee, S.; Behera, M.; Kuotsu, K. Niosome: A future of targeted drug delivery systems. J. Adv. Pharm. Technol. Res. 2010, 1, 374–380. [Google Scholar] [CrossRef] [Green Version]
  30. Stewart, J.C. Colorimetric determination of phospholipids with ammonium ferrothiocyanate. Anal. Biochem. 1980, 104, 10–14. [Google Scholar] [CrossRef]
  31. National Research Council (US) Committee for the Update of the Guide for the Care and Use of Laboratory Animals. Guide for the Care and Use of Laboratory Animals, 8th ed.; National Academies Press (US): Washington, DC, USA, 2011. Available online: https://www.ncbi.nlm.nih.gov/books/NBK54050/ (accessed on 7 June 2022).
Figure 1. Determination of Cp for the different surfactants. Each point measurement was performed in triplicate.
Pharmaceutics 14 01651 g001
Figure 2. The evaluation of particle size and Z potential for one month, shown for formulations 4, 8, and 12. (a) The variations in particle size and (b) Z potential.
Pharmaceutics 14 01651 g002
Figure 3. Pseudo-ternary phase diagrams: (a) the trajectories for formulation 4 and (b) formulation 8.
Pharmaceutics 14 01651 g003
Figure 4. SEM images illustrating the lipomics’ size and morphology from (top) formulations 4.2 and (bottom) 8.2. Scale-bar is equivalent to 100 nm.
Pharmaceutics 14 01651 g004
Figure 5. SEM, TEM, and STEM images of a sample of lipomics from formulation 8.2 loaded with uranyl acetate.
Pharmaceutics 14 01651 g005
Figure 6. Radiolabeling efficiency of lipomics and liposomes as a function of pH to compare the encapsulation efficiency of lipophilic and hydrophilic molecules. (a) In lipophilic conditions (pH 7), (****) is statistically different from Lipomics 4.2 and 8.2, and liposome GSH. (b) In hydrophilic conditions (pH 6), (*) and (**) are statistically different from Lipomics 4.2 and 8.2. (c) The figure illustrates the encapsulation of lipophilic molecules (i.e., 99mTc-2 BMEDA) in the micelles (blue structures in the figure) contained by lipomics.
Pharmaceutics 14 01651 g006
Figure 7. In vitro stability in serum of 99mTc lipomics (formulation 8.2). The graph plots the mean value +/− standard deviation of three repetitions.
Pharmaceutics 14 01651 g007
Figure 8. Plasma pharmacokinetics between 99mTcO and lipomics with and without PEG. The average of four repetitions ± standard deviation is reported.
Pharmaceutics 14 01651 g008
Figure 9. Representative SPECT/CT images of the 99mTcO4 biodistribution in healthy rats at 1 and 3 h after injection. The accumulation mainly occurs in the stomach. Images are from the same rat.
Pharmaceutics 14 01651 g009
Figure 10. Representative SPECT/CT images of the lipomics’ biodistribution at 1, 3, and 6 h after injection in healthy rats. The accumulation mainly occurs in the liver. Images are from the same rat.
Pharmaceutics 14 01651 g010
Figure 11. Representative SPECT/CT images of the PEG lipomics’ biodistribution at 1, 3, and 6 h after injection in healthy rats. Images are from the same rat.
Pharmaceutics 14 01651 g011
Figure 12. Uptake of 99mTcO4, lipomics, and PEG lipomics as the percentage of activity present in each organ quantified from the images. The asterisks (*, **, ***) indicate statistical differences (p < 0.05) from the other groups.
Pharmaceutics 14 01651 g012
Figure 13. Biodistribution of 99mTcO4, lipomics, and PEG lipomics as the percentage of injected dose (injected activity per organ weight) quantified after the animal sacrifice (n = 3–5), 3 h after injection.
Pharmaceutics 14 01651 g013
Table 1. Hydrodynamic diameter size and polydispersity index for lipomics from each formulation. Values represent the average and standard deviation of three independent experiments.
FormulationSize (nm) ± SDPI ± SD
Lipomic 1658 ± 920.40 ± 0.05
Lipomic 2326 ± 370.25 ± 0.03
Lipomic 3395 ± 230.20 ± 0.01
Lipomic 489 ± 160.12 ± 0.01
Lipomic 52778 ± 360.46 ± 0.1
Lipomic 61170 ± 430.33 ± 0.09
Lipomic 72778 ± 560.14 ± 0.02
Lipomic 8127 ± 150.19 ± 0.02
Lipomic 99990 ± 520.55 ± 0.015
Lipomic 101840 ± 670.24 ± 0.08
Lipomic 112779 ± 940.38 ± 0.07
Lipomic 12158 ± 460.13 ± 0.01
Lipomic 1311,495 ± 1390.57 ± 0.02
Lipomic 14936 ± 520.35 ± 0.02
Lipomic 151266 ± 400.20 ± 0.03
Lipomic 16230 ± 410.16 ± 0.02
The polydispersity index (PI) measures the homogeneity of the sample regarding diameter. A value of 0.0 represents an entirely homogeneous sample, while a value of 1.0 represents an entirely heterogeneous sample.
Table 2. Hydrodynamic size distribution of lipomics obtained from the formulations elaborated with the different proportions (%w/w) of excipients.
%Population Distribution
LipomicSize Particle (nm) ± SD50–200 nm>200 nm
4.1 Pharmaceutics 14 01651 i00187 ± 318911
4.2 Pharmaceutics 14 01651 i00294 ± 101000
4.3 Pharmaceutics 14 01651 i00385 ± 316931
4.4 Pharmaceutics 14 01651 i00488 ± 398812
4.5 Pharmaceutics 14 01651 i00586 ± 198812
8.1 Pharmaceutics 14 01651 i00689 ± 496931
8.2 Pharmaceutics 14 01651 i00773 ± 18973
8.3 Pharmaceutics 14 01651 i00876 ± 248416
8.4 Pharmaceutics 14 01651 i00973 ± 276634
8.5 Pharmaceutics 14 01651 i01082 ± 648020
Formulations 4.2 and 8.2, with size distribution close to 100% in population distribution (50–200 nm), were selected for electron microscopy analysis to evaluate the size and shape of the lipomics.
Table 3. Pharmacokinetic parameters of “free” 99mTcO, 99mTc lipomics, and 99mTc-lipomics-PEG, calculated from a two-compartment model.
Parameter 99mTcO4LipomicLipomic-PEG
t1/2 β (h)2.2 ± 0.43.3 ± 0.13.5 ± 0.3
t1/2 α (h)0.1 ± 0.050.5 ± 0.040.2 ± 0.03
K21 (h−1)2.7 ± 0.40.7 ± 0.060.6 ± 0.2
K12 (h−1)3.5 ± 0.76.7 ± 0.612.2 ± 2.3
K10 (h−1)1.5 ± 0.30.9 ± 0.030.6 ± 0.6
VD1 (mL)9.1 ± 1.76.5 ± 2.27.6 ± 1.3
VD2 (mL)13.6 ± 2–516.1 ± 3.417.5 ± 2.6
Cl (mL/h)18 ± 3.329.3 ± 1.8 *31.8 ± 1.1
ABC 0-inf (µci·h)/mL7.8 ± 0.610.3 ± 0.411.70 ± 0.8 *
The data correspond to the average (n = 5) ± standard deviation. (*) indicates a statistically significant difference from the other groups.
Table 4. Variables and levels of assessment.
VariableLevel 1Level 2
Surfactant conc. (%w/w)4.158.30
PhospholipidDSPCLecithin
Sonication time (min)3060
Flow rate (mL/min)0.330.16
Table 5. Taguchi’s experimental design.
FormulationPhospholipidSurfactantFlow RateSonication Time
Lipomic 11111
Lipomic 21112
Lipomic 31121
Lipomic 41122
Lipomic 51211
Lipomic 61212
Lipomic 71221
Lipomic 81222
Lipomic 92111
Lipomic 102112
Lipomic 112121
Lipomic 122122
Lipomic 132211
Lipomic 142212
Lipomic 152221
Lipomic 162222
Publisher’s Note: MDPI stays neutral with regard to jurisdictional claims in published maps and institutional affiliations.

