
Drug-Induced Immune Thrombocytopenia Toxicity Prediction Based on Machine Learning

 , and
, and
Abstract
:1. Introduction
2. Materials and Methods
2.1. Data Collection and Preparation
2.2. Molecular Feature Calculation
2.3. Machine Learning-Based Methods
2.4. Evaluation Metrics
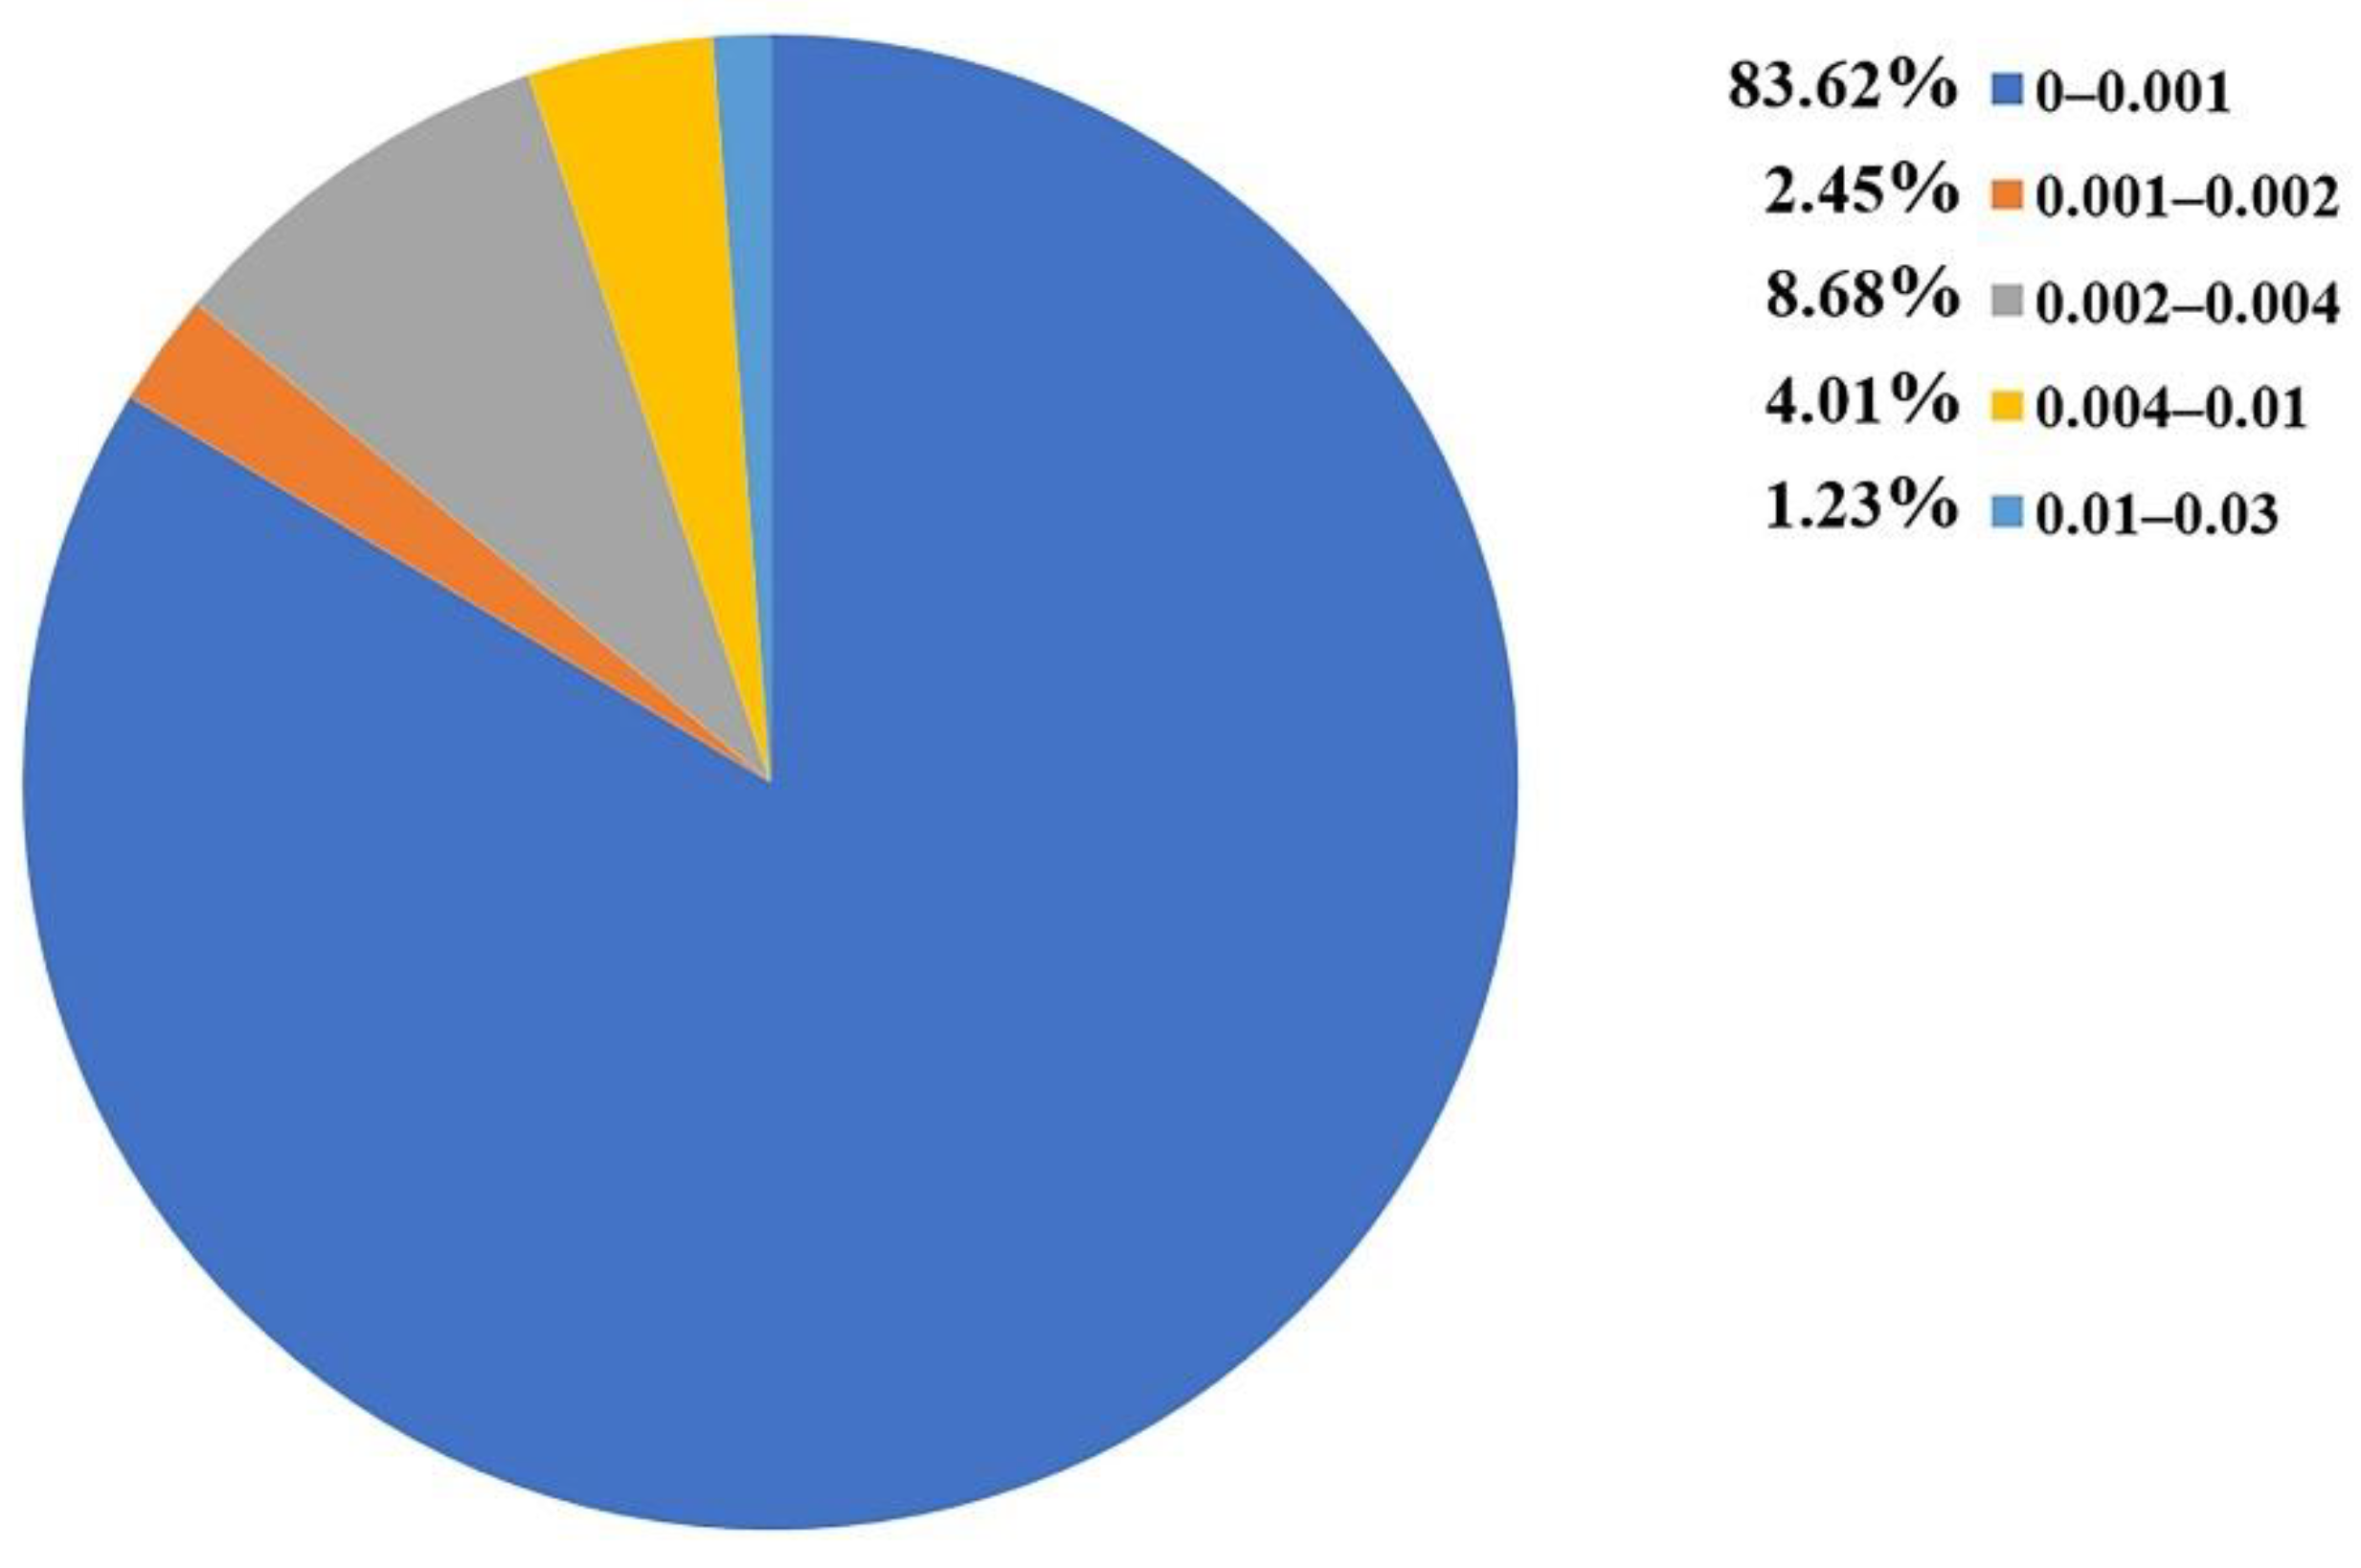
2.5. Applicability Domain Definition
2.6. Structural Alerts Analysis
3. Results and Discussion
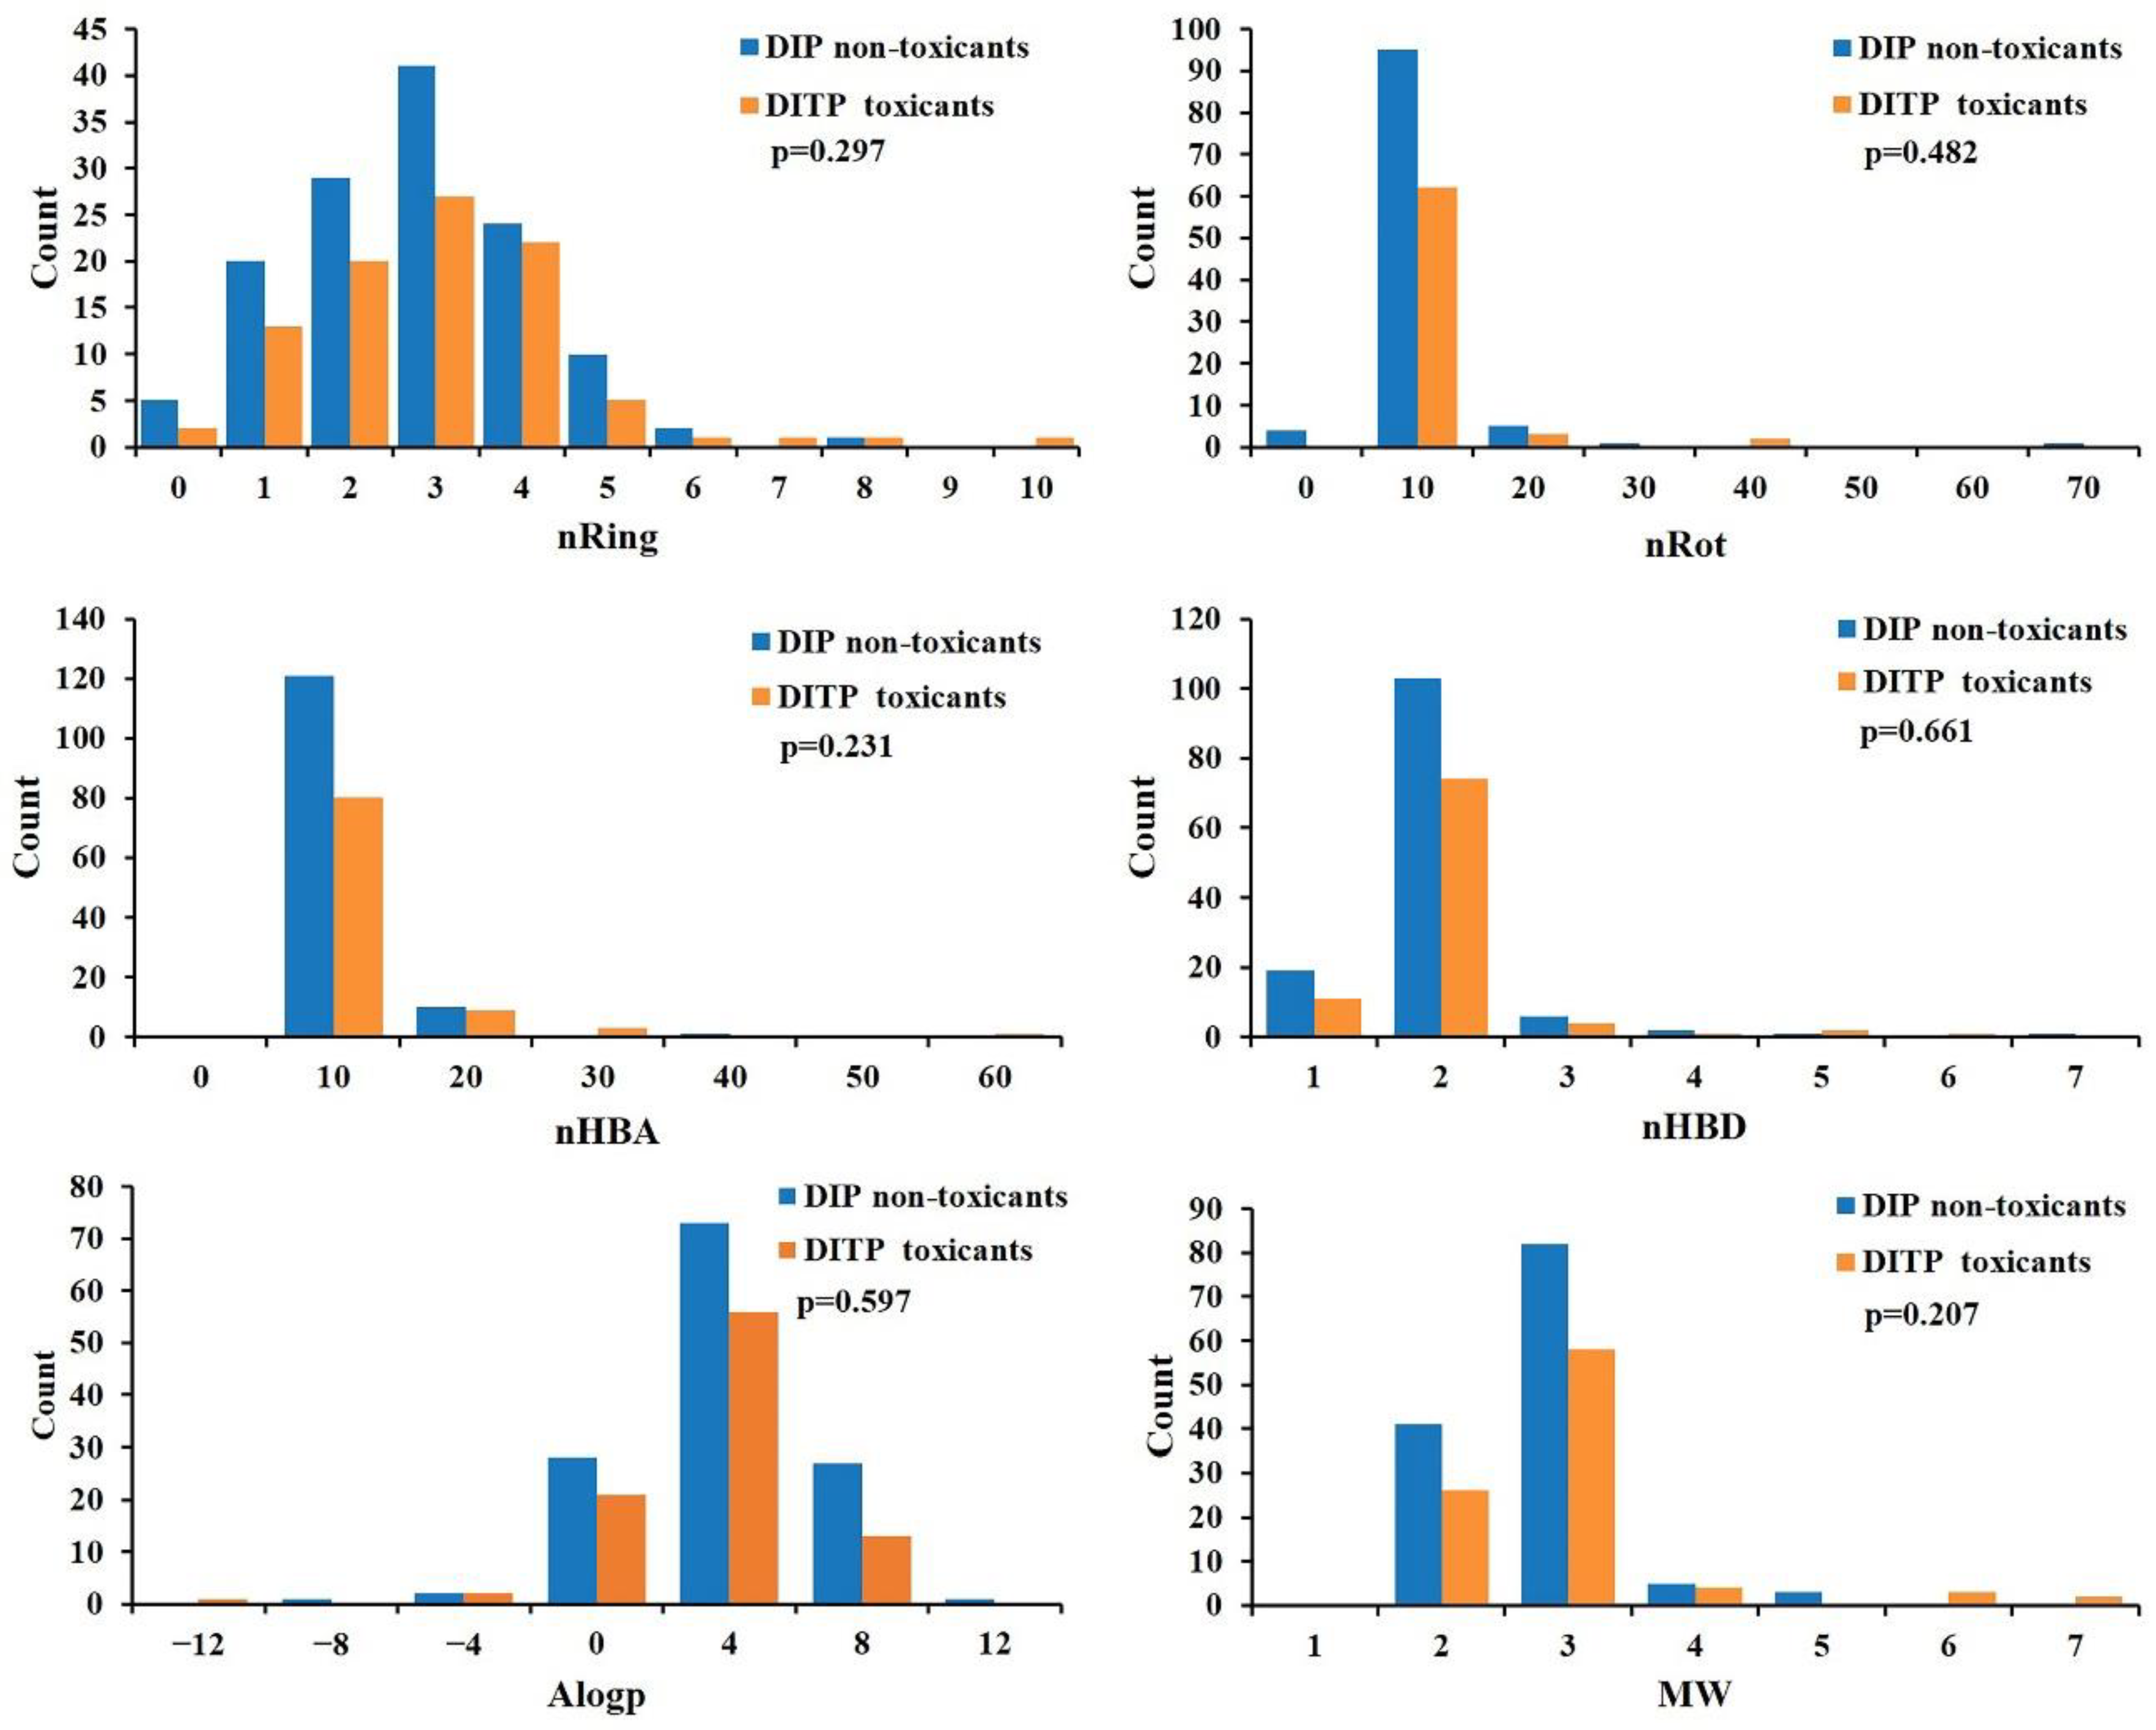
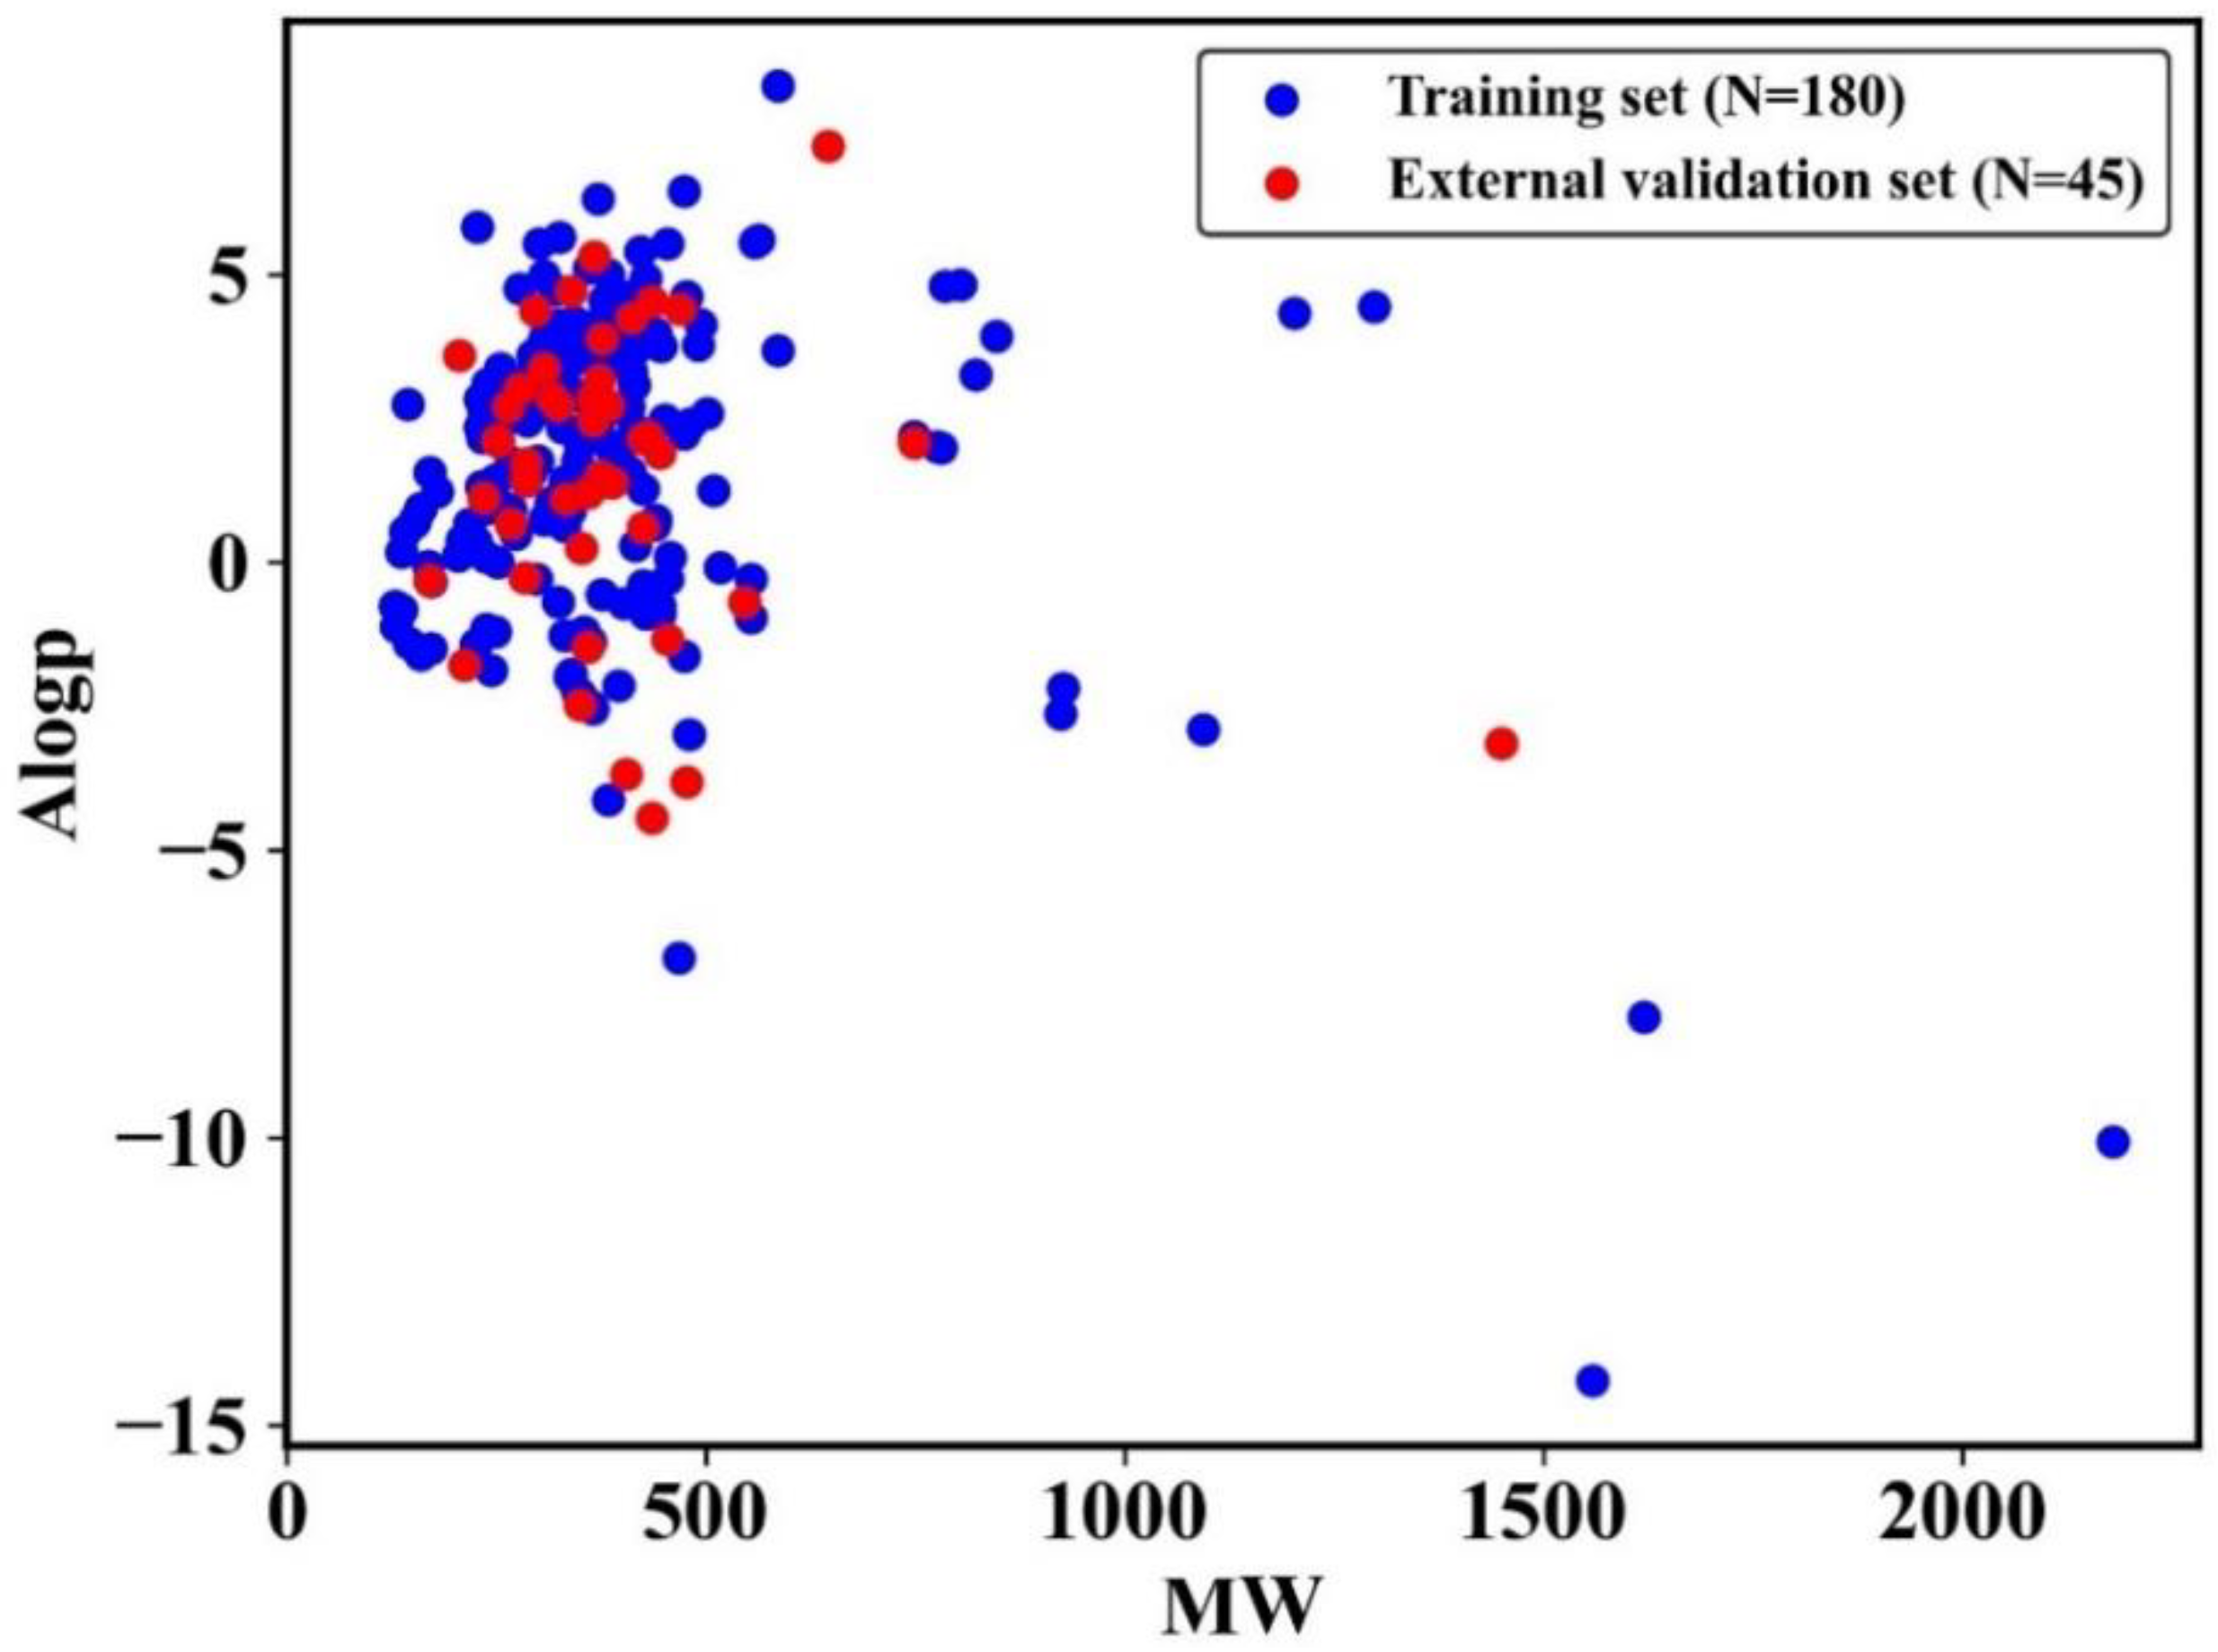
3.1. Dataset Analysis
3.2. Development of DITP Toxicant Prediction Models
3.3. Verification of Prediction Models on External Validation Set
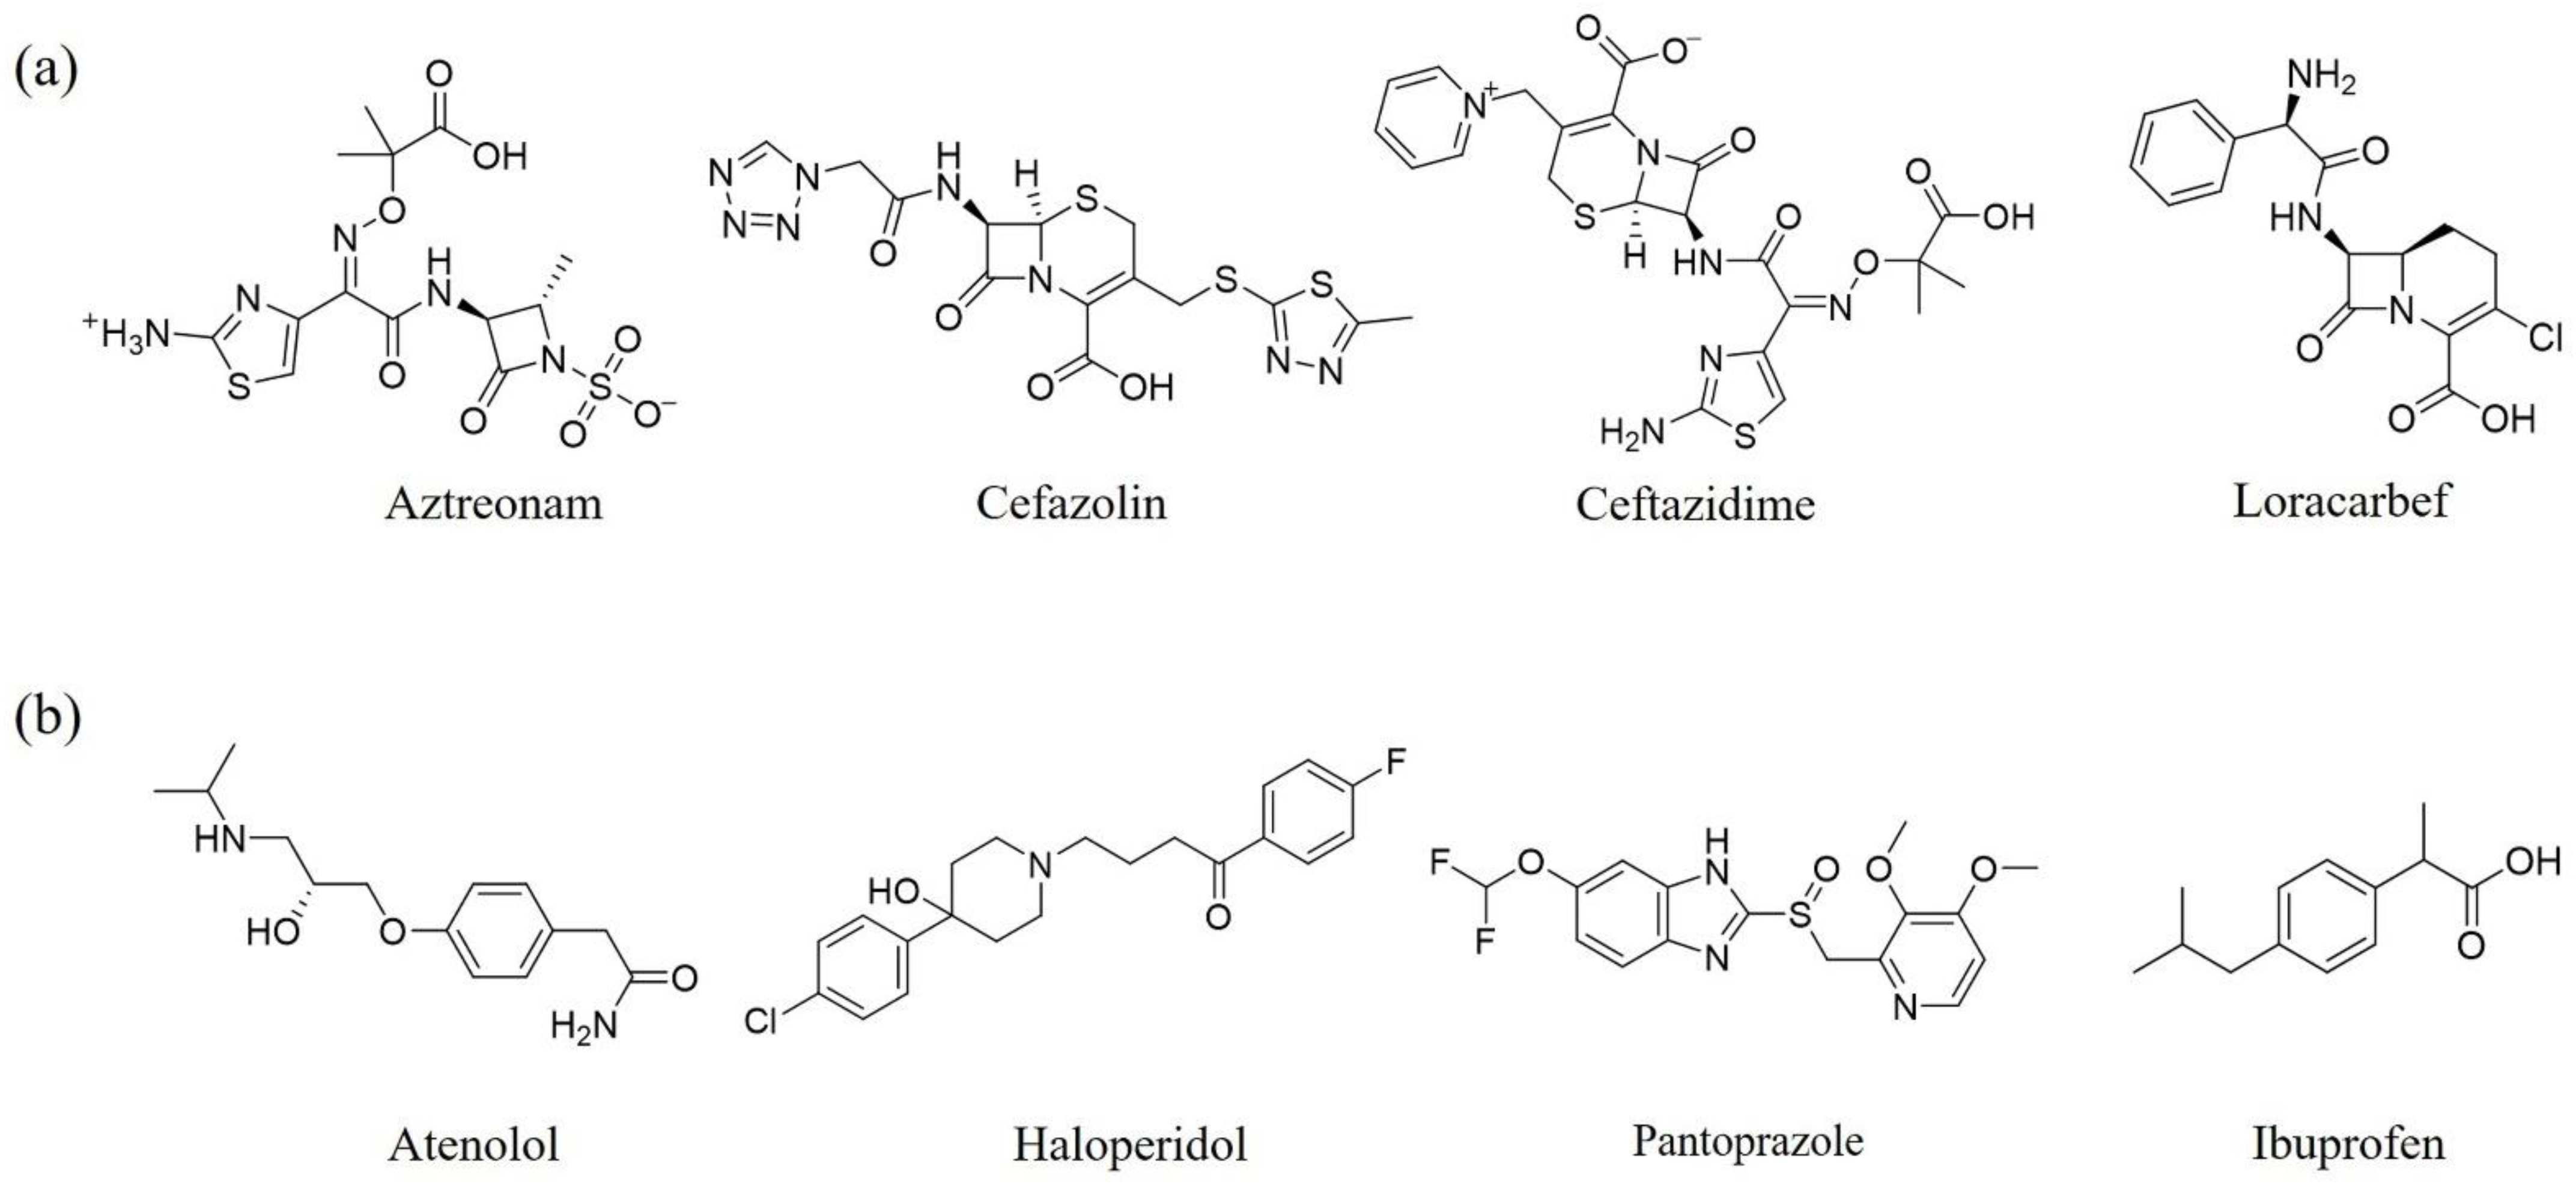
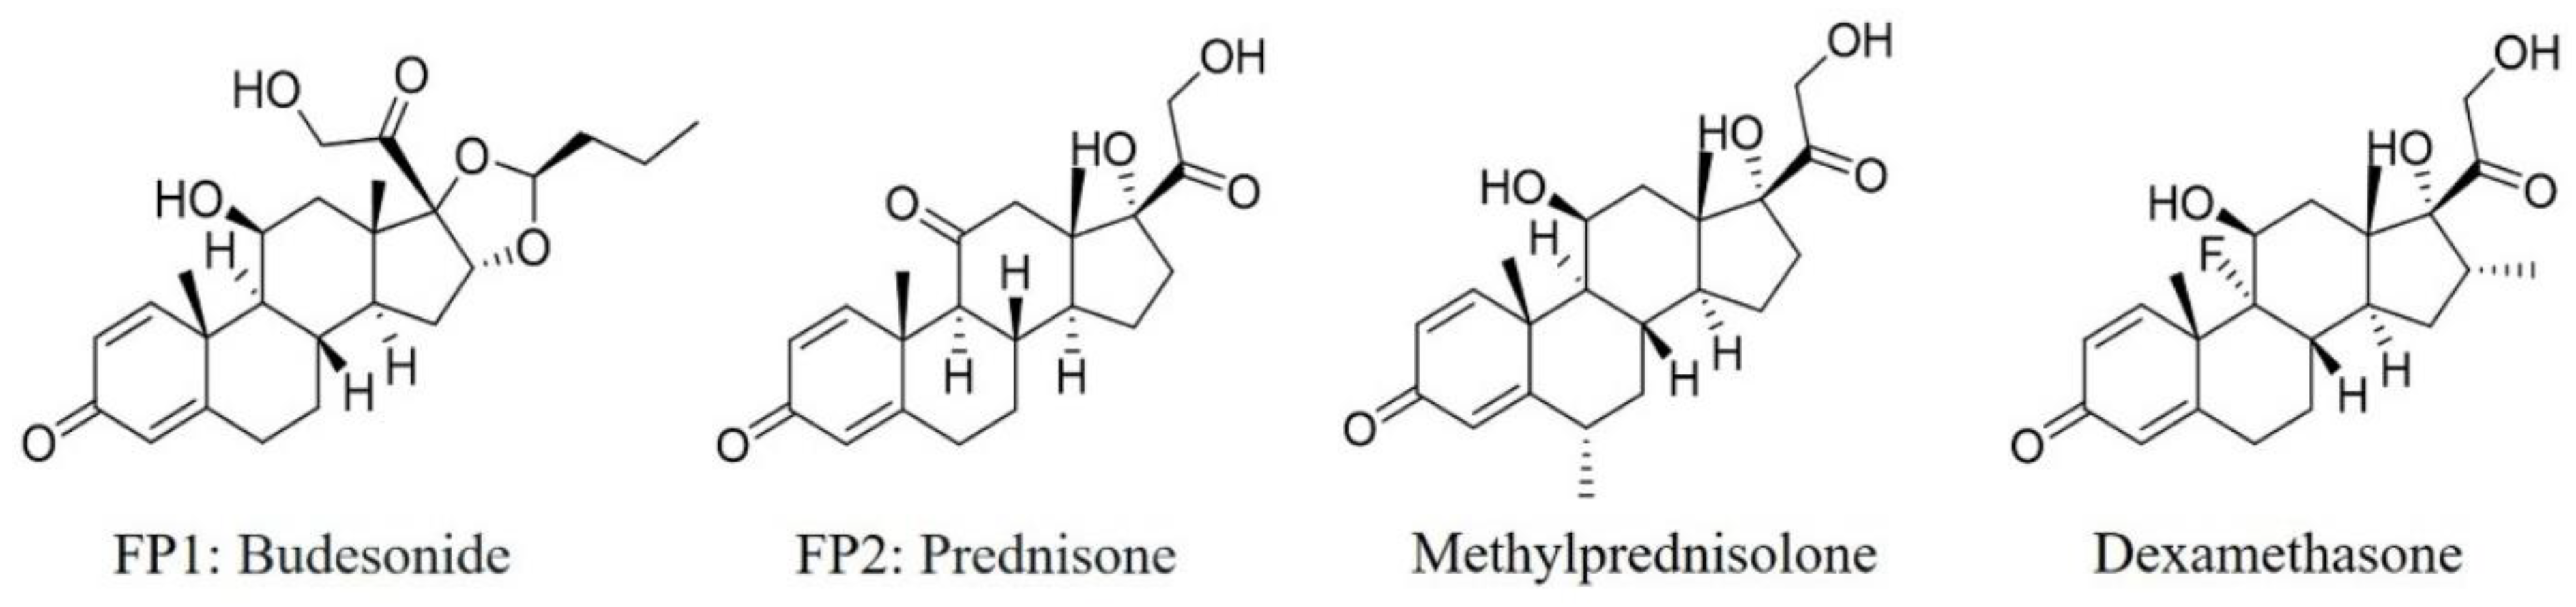
3.4. Misclassified Compounds Analysis
3.5. Identification of SAs to DITP Toxicity
4. Conclusions
Supplementary Materials
Author Contributions
Funding
Institutional Review Board Statement
Informed Consent Statement
Data Availability Statement
Conflicts of Interest
References
- Aster, R.H.; Bougie, D.W. Drug-induced immune thrombocytopenia. N. Engl. J. Med. 2007, 357, 580–587. [Google Scholar] [CrossRef] [Green Version]
- Arnold, D.M.; Kukaswadia, S.; Nazi, I.; Esmail, A.; Dewar, L.; Smith, J.W.; Warkentin, T.E.; Kelton, J.G. A systematic evaluation of laboratory testing for drug-induced immune thrombocytopenia. J. Thromb. Haemost. 2013, 11, 169–176. [Google Scholar] [CrossRef] [Green Version]
- Vayne, C.; Guéry, E.-A.; Rollin, J.; Baglo, T.; Petermann, R.; Gruel, Y. Pathophysiology and diagnosis of drug-induced immune thrombocytopenia. J. Clin. Med. 2020, 9, 2212. [Google Scholar] [CrossRef] [PubMed]
- Bakchoul, T.; Marini, I. Drug-associated thrombocytopenia. Hematol.-Am. Soc. Hematol. Educ. Program 2018, 2018, 576–583. [Google Scholar] [CrossRef] [PubMed] [Green Version]
- George, J.N.; Aster, R.H. Drug-induced thrombocytopenia: Pathogenesis, evaluation, and management. Hematol.-Am. Soc. Hematol. Educ. Program 2009, 2009, 153–158. [Google Scholar] [CrossRef] [PubMed] [Green Version]
- Narayanan, P.K.; Henry, S.; Li, N. Drug-induced thrombocytopenia: Mechanisms and relevance in preclinical safety assessment. Curr. Opin. Toxicol. 2019, 17, 23–30. [Google Scholar] [CrossRef]
- Arnold, D.M.; Curtis, B.R.; Bakchoul, T. Recommendations for standardization of laboratory testing for drug-induced immune thrombocytopenia: Communication from the SSC of the ISTH. J. Thromb. Haemost. 2015, 13, 676–678. [Google Scholar] [CrossRef] [Green Version]
- Van den Bemt, P.M.L.A.; Meyboom, R.H.B.; Egberts, A.C.G. Drug-induced immune thrombocytopenia. Drug Saf. 2004, 27, 1243–1252. [Google Scholar] [CrossRef] [Green Version]
- Curtis, B.R. Drug-induced immune thrombocytopenia: Incidence, clinical features, laboratory testing, and pathogenic mechanisms. Immunohematology 2014, 30, 55–65. [Google Scholar] [CrossRef]
- Maltarollo, V.G.; Gertrudes, J.C.; Oliveira, P.R.; Honorio, K.M. Applying machine learning techniques for ADME-Tox prediction: A review. Expert Opin. Drug Metab. Toxicol. 2015, 11, 259–271. [Google Scholar] [CrossRef]
- Korotcov, A.; Tkachenko, V.; Russo, D.P.; Ekins, S. Comparison of deep learning with multiple machine learning methods and metrics using diverse drug discovery data sets. Mol. Pharm. 2017, 14, 4462–4475. [Google Scholar] [CrossRef] [PubMed]
- Vo, A.H.; Van Vleet, T.R.; Gupta, R.R.; Liguori, M.J.; Rao, M.S. An overview of machine learning and big data for drug toxicity evaluation. Chem. Res. Toxicol. 2020, 33, 20–37. [Google Scholar] [CrossRef] [PubMed]
- Raies, A.B.; Bajic, V.B. In silico toxicology: Computational methods for the prediction of chemical toxicity. WIREs Comput. Mol. Sci. 2016, 6, 147–172. [Google Scholar] [CrossRef] [Green Version]
- Mansouri, K.; Cariello, N.F.; Korotcov, A.; Tkachenko, V.; Grulke, C.M.; Sprankle, C.S.; Allen, D.; Casey, W.M.; Kleinstreuer, N.C.; Williams, A.J. Open-source QSAR models for pKa prediction using multiple machine learning approaches. J. Cheminform. 2019, 11, 60. [Google Scholar] [CrossRef] [PubMed]
- He, S.; Ye, T.; Wang, R.; Zhang, C.; Zhang, X.; Sun, G.; Sun, X. An in silico model for predicting drug-induced hepatotoxicity. Int. J. Mol. Sci. 2019, 20, 1897. [Google Scholar] [CrossRef] [PubMed] [Green Version]
- Jaganathan, K.; Tayara, H.; Chong, K.T. Prediction of drug-induced liver toxicity using SVM and optimal descriptor sets. Int. J. Mol. Sci. 2021, 22, 8073. [Google Scholar] [CrossRef] [PubMed]
- Mitta, A.; Curtis, B.R.; Reese, J.A.; George, J.N. Drug-induced thrombocytopenia: 2019 update of clinical and laboratory data. Am. J. Hematol. 2019, 94, E76–E78. [Google Scholar] [CrossRef] [Green Version]
- Park, D.J.; Park, M.W.; Lee, H.; Kim, Y.J.; Kim, Y.; Park, Y.H. Development of machine learning model for diagnostic disease prediction based on laboratory tests. Sci. Rep. 2021, 11, 7567. [Google Scholar] [CrossRef]
- Yap, C.W. PaDEL-descriptor: An open source software to calculate molecular descriptors and fingerprints. J. Comput. Chem. 2011, 32, 1466–1474. [Google Scholar] [CrossRef]
- Zhang, C.; Zhou, Y.; Gu, S.; Wu, Z.; Wu, W.; Liu, C.; Wang, K.; Liu, G.; Li, W.; Lee, P.W.; et al. In silico prediction of hERG potassium channel blockage by chemical category approaches. Toxicol. Res. 2016, 5, 570–582. [Google Scholar] [CrossRef] [Green Version]
- Wang, Y.-W.; Huang, L.; Jiang, S.-W.; Li, K.; Zou, J.; Yang, S.-Y. CapsCarcino: A novel sparse data deep learning tool for predicting carcinogens. Food Chem. Toxicol. 2020, 135, 110921. [Google Scholar] [CrossRef] [PubMed]
- Zhu, J.; Wang, J.; Yu, H.; Li, Y.; Hou, T. Recent developments of in silico predictions of oral bioavailability. Comb. Chem. High Throughput Screen. 2011, 14, 362–374. [Google Scholar] [CrossRef]
- Russo, D.P.; Zorn, K.M.; Clark, A.M.; Zhu, H.; Ekins, S. Comparing multiple machine learning algorithms and metrics for estrogen receptor Binding Prediction. Mol. Pharm. 2018, 15, 4361–4370. [Google Scholar] [CrossRef] [PubMed]
- Siramshetty, V.B.; Nguyen, D.T.; Martinez, N.J.; Southall, N.T.; Simeonov, A.; Zakharov, A.V. Critical assessment of artificial intelligence methods for prediction of hERG channel inhibition in the “big data” era. J. Chem. Inf. Model. 2020, 60, 6007–6019. [Google Scholar] [CrossRef] [PubMed]
- Boyles, F.; Deane, C.M.; Morris, G.M. Learning from the ligand: Using ligand-based features to improve binding affinity prediction. Bioinformatics 2020, 36, 758–764. [Google Scholar] [CrossRef] [PubMed]
- Norinder, U.; Naveja, J.J.; Lopez-Lopez, E.; Mucs, D.; Medina-Franco, J.L. Conformal prediction of HDAC inhibitors. SAR QSAR Environ. Res. 2019, 30, 265–277. [Google Scholar] [CrossRef]
- Su, S.; Yang, Y.; Gan, H.; Zheng, S.; Gu, F.; Zhao, C.; Xu, J. Predicting the feasibility of copper(I)-catalyzed alkyne-azide cycloaddition reactions using a recurrent neural network with a self-attention mechanism. J. Chem. Inf. Model. 2020, 60, 1165–1174. [Google Scholar] [CrossRef]
- Bertoni, M.; Duran-Frigola, M.; Badia, I.M.P.; Pauls, E.; Orozco-Ruiz, M.; Guitart-Pla, O.; Alcalde, V.; Diaz, V.M.; Berenguer-Llergo, A.; Brun-Heath, I.; et al. Bioactivity descriptors for uncharacterized chemical compounds. Nat. Commun. 2021, 12, 3932. [Google Scholar] [CrossRef]
- Danishuddin; Khan, A.U. Descriptors and their selection methods in QSAR analysis: Paradigm for drug design. Drug Discov. Today 2016, 21, 1291–1302. [Google Scholar] [CrossRef]
- Byvatov, E.; Schneider, G. Support vector machine applications in bioinformatics. Appl. Bioinform. 2003, 2, 67–77. [Google Scholar]
- Guo, G.; Wang, H.; Bell, D.; Bi, Y.; Greer, K. KNN model-based approach in classification. Lect. Notes Comput. Sci. 2003, 2888, 986–996. [Google Scholar] [CrossRef]
- Svetnik, V.; Liaw, A.; Tong, C.; Culberson, J.C.; Sheridan, R.P.; Feuston, B.P. Random forest: A classification and regression tool for compound classification and QSAR modeling. J. Chem. Inf. Comput. Sci. 2003, 43, 1947–1958. [Google Scholar] [CrossRef] [PubMed]
- Watson, P. Naïve bayes classification using 2D pharmacophore feature triplet vectors. J. Chem. Inf. Model. 2008, 48, 166–178. [Google Scholar] [CrossRef] [PubMed]
- Jain, A.K.; Mao, J.; Mohiuddin, K. Artificial neural networks: A tutorial. Computertomographie 1996, 29, 31–44. [Google Scholar] [CrossRef] [Green Version]
- Freund, Y. Boosting a weak learning algorithm by majority. Inform. Comput. 1995, 121, 256–285. [Google Scholar] [CrossRef]
- Chen, T.; Guestrin, C. XGBoost: A scalable tree boosting system. In Proceedings of the 22nd ACM SIGKDD International Conference on Knowledge Discovery and Data Mining, San Francisco, CA, USA, 13–17 August 2016; pp. 785–794. [Google Scholar]
- Pedregosa, F.; Varoquaux, G.; Gramfort, A.; Michel, V.; Thirion, B. Scikit-learn: Machine learning in Python. J. Mach. Learn. Res. 2011, 12, 2825–2830. [Google Scholar]
- Chawla, N.V.; Bowyer, K.W.; Hall, L.O.; Kegelmeyer, W.P. SMOTE: Synthetic minority over-sampling technique. J. Artif. Intell. Res. 2002, 16, 321–357. [Google Scholar] [CrossRef]
- Wang, Z.; Yang, H.; Wu, Z.; Wang, T.; Li, W.; Tang, Y.; Liu, G. In silico prediction of blood-brain barrier permeability of compounds by machine learning and resampling methods. ChemMedChem 2018, 13, 2189–2201. [Google Scholar] [CrossRef]
- Wei, J.; Lu, Z.; Qiu, K.; Li, P.; Sun, H. Predicting drug risk level from adverse drug reactions using SMOTE and machine learning approaches. IEEE Access 2020, 8, 185761–185775. [Google Scholar] [CrossRef]
- Redkar, S.; Mondal, S.; Joseph, A.; Hareesha, K.S. A machine learning approach for drug-target interaction prediction using wrapper feature selection and class balancing. Mol. Inform. 2020, 39, e1900062. [Google Scholar] [CrossRef]
- He, Y.; Guo, H.; Diao, L.; Chen, Y.; Zhu, J.; Fernando, H.C.; Gonzalez Rivas, D.; Qi, H.; Dai, C.; Tang, X.; et al. Artificial intelligence in cancer NOG/PDX models—Prediction of driver gene matching in lung cancer. Engineering 2021. [Google Scholar] [CrossRef]
- Lemaitre, G.; Nogueira, F.; Aridas, C.K. Imbalanced-learn: A Python toolbox to tackle the curse of imbalanced datasets in machine learning. J. Mach. Learn. Res. 2017, 18, 559–563. [Google Scholar]
- Ling, C.X.; Huang, J.; Zhang, H. AUC: A better measure than accuracy in comparing learning algorithms. In Proceedings of the Conference of the Canadian Society for Computational Studies of Intelligence, Berlin/Heidelberg, Germany, 18–21 May 2003; pp. 329–341. [Google Scholar]
- Cheng, F.; Ikenaga, Y.; Zhou, Y.; Yu, Y.; Li, W.; Shen, J.; Du, Z.; Chen, L.; Xu, C.; Liu, G.; et al. In silico assessment of chemical biodegradability. J. Chem. Inf. Model. 2012, 52, 655–669. [Google Scholar] [CrossRef] [PubMed]
- Jiang, C.; Yang, H.; Di, P.; Li, W.; Tang, Y.; Liu, G. In silico prediction of chemical reproductive toxicity using machine learning. J. Appl. Toxicol. 2019, 39, 844–854. [Google Scholar] [CrossRef] [PubMed]
- Sahigara, F.; Mansouri, K.; Ballabio, D.; Mauri, A.; Consonni, V.; Todeschini, R. Comparison of different approaches to define the applicability domain of QSAR models. Molecules 2012, 17, 4791–4810. [Google Scholar] [CrossRef] [Green Version]
- Cui, X.; Liu, J.; Zhang, J.; Wu, Q.; Li, X. In silico prediction of drug-induced rhabdomyolysis with machine-learning models and structural alerts. J. Appl. Toxicol. 2019, 39, 1224–1232. [Google Scholar] [CrossRef]
- Klekota, J.; Roth, F.P. Chemical substructures that enrich for biological activity. Bioinformatics 2008, 24, 2518–2525. [Google Scholar] [CrossRef]
- Jiang, D.; Lei, T.; Wang, Z.; Shen, C.; Cao, D.; Hou, T. ADMET evaluation in drug discovery. 20. Prediction of breast cancer resistance protein inhibition through machine learning. J. Cheminform. 2020, 12, 16. [Google Scholar] [CrossRef] [Green Version]
- Singh, H.; Singh, S.; Singla, D.; Agarwal, S.M.; Raghava, G.P.S. QSAR based model for discriminating EGFR inhibitors and non-inhibitors using Random forest. Biol. Direct 2015, 10, 10. [Google Scholar] [CrossRef] [Green Version]
- Su, B.-H.; Tu, Y.-S.; Lin, C.; Shao, C.-Y.; Lin, O.-A.; Tseng, Y.J. Rule-based prediction models of cytochrome P450 inhibition. J. Chem. Inf. Model. 2015, 55, 1426–1434. [Google Scholar] [CrossRef]
- Zhang, C.; Cheng, F.; Li, W.; Liu, G.; Lee, P.W.; Tang, Y. In silico prediction of drug induced liver toxicity using substructure pattern recognition method. Mol. Inform. 2016, 35, 136–144. [Google Scholar] [CrossRef] [PubMed]
- Hua, Y.; Shi, Y.; Cui, X.; Li, X. In silico prediction of chemical-induced hematotoxicity with machine learning and deep learning methods. Mol. Divers. 2021, 25, 1585–1596. [Google Scholar] [CrossRef] [PubMed]


| Training Set | External Validation Set | Sum | |
|---|---|---|---|
| Toxicants | 75 | 18 | 93 |
| Non-toxicants | 105 | 27 | 132 |
| Total | 180 | 45 | 225 |
| Model | Molecular Features | SE (%) | SP (%) | ACC (%) | MCC | AUC |
|---|---|---|---|---|---|---|
| k-NN | RDMD + PubChem | 69.0 ± 2.3 | 56.6 ± 2.1 | 62.7 ± 1.0 | 0.261 ± 0.022 | 0.628 ± 0.011 |
| k-NN | 10MD + PubChem | 66.9 ± 2.0 | 57.2 ± 2.4 | 61.8 ± 1.7 | 0.243 ± 0.031 | 0.621 ± 0.016 |
| XGBoost | CCMD + KPFP | 61.9 ± 2.7 | 61.4 ± 3.3 | 61.1 ± 1.2 | 0.233 ± 0.025 | 0.617 ± 0.013 |
| XGBoost | CCMD + MACCS | 64.2 ± 2.7 | 58.3 ± 2.1 | 60.7 ± 0.8 | 0.226 ± 0.023 | 0.613 ± 0.011 |
| XGBoost | CCMD + PubChem | 61.0 ± 1.1 | 61.5 ± 2.1 | 60.8 ± 0.9 | 0.226 ± 0.021 | 0.612 ± 0.010 |
| Model | SE (%) | SP (%) | ACC (%) | MCC | AUC |
|---|---|---|---|---|---|
| k-NN-10MD | 66.1 ± 1.6 | 56.2 ± 3.0 | 61.0 ± 1.9 | 0.224 ± 0.035 | 0.612 ± 0.018 |
| k-NN-RDMD | 47.6 ± 2.6 | 67.0 ±2.8 | 56.9 ± 1.5 | 0.150 ± 0.034 | 0.573 ± 0.016 |
| k-NN-PubChem | 66.9 ± 2.5 | 56.0 ± 2.0 | 61.2 ±1.3 | 0.231 ± 0.027 | 0.614 ± 0.014 |
| XGBoost-CCMD | 60.5 ± 3.2 | 60.1 ± 2.8 | 60.2 ± 2.0 | 0.207 ± 0.039 | 0.603 ± 0.019 |
| XGBoost-PubChem | 57.5 ± 3.7 | 62.1 ± 5.5 | 59.4 ± 1.7 | 0.196 ± 0.031 | 0.598 ±0.016 |
| XGBoost-KPFP | 57.1 ± 2.5 | 60.8 ± 3.0 | 58.1 ± 2.2 | 0.180 ± 0.046 | 0.589 ± 0.023 |
| XGBoost-MACCS | 53.9 ± 2.5 | 62.1 ± 2.7 | 57.8 ± 1.2 | 0.162 ± 0.031 | 0.580 ± 0.015 |
| Model | Molecular Features | SE (%) | SP (%) | ACC (%) | MCC | AUC |
|---|---|---|---|---|---|---|
| k-NN | RDMD + PubChem | 83.3 | 70.4 | 75.6 | 0.526 | 0.769 |
| XGBoost | CCMD + KPFP | 66.7 | 85.2 | 77.8 | 0.531 | 0.759 |
| k-NN | 10MD + PubChem | 83.3 | 63.0 | 71.1 | 0.456 | 0.731 |
| XGBoost | CCMD + PubChem | 61.1 | 85.2 | 75.6 | 0.481 | 0.731 |
| XGBoost | CCMD + MACCS | 61.1 | 81.5 | 73.3 | 0.436 | 0.713 |
| Consensus model | / | 61.1 | 85.2 | 75.6 | 0.481 | 0.731 |
| Inside | Outside | AD Coverage (%) | |||
|---|---|---|---|---|---|
| P | N | P | N | ||
| Training set | 75 | 105 | 0 | 0 | 100 |
| External validation set | 18 | 27 | 4 | 0 | 91.1 |
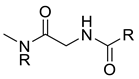
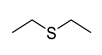
| Structure | IG | Freq _P | Freq _N | Representative Structure |
|---|---|---|---|---|
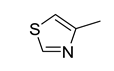 | 0.0170 | 2.12 | 0.21 | 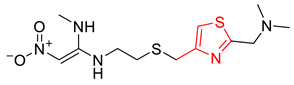 |
 | 0.0259 | 1.84 | 0.41 | 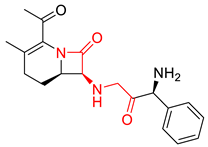 |
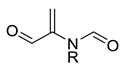 | 0.0123 | 1.73 | 0.49 | 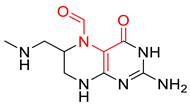 |
 | 0.0138 | 1.66 | 0.54 | 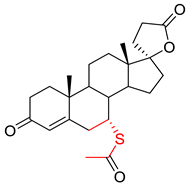 |
 | 0.0073 | 1.61 | 0.57 | 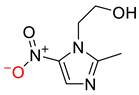 |
Publisher’s Note: MDPI stays neutral with regard to jurisdictional claims in published maps and institutional affiliations. |
© 2022 by the authors. Licensee MDPI, Basel, Switzerland. This article is an open access article distributed under the terms and conditions of the Creative Commons Attribution (CC BY) license (https://creativecommons.org/licenses/by/4.0/).
Share and Cite
Wang, B.; Tan, X.; Guo, J.; Xiao, T.; Jiao, Y.; Zhao, J.; Wu, J.; Wang, Y. Drug-Induced Immune Thrombocytopenia Toxicity Prediction Based on Machine Learning. Pharmaceutics 2022, 14, 943. https://doi.org/10.3390/pharmaceutics14050943
Wang B, Tan X, Guo J, Xiao T, Jiao Y, Zhao J, Wu J, Wang Y. Drug-Induced Immune Thrombocytopenia Toxicity Prediction Based on Machine Learning. Pharmaceutics. 2022; 14(5):943. https://doi.org/10.3390/pharmaceutics14050943
Chicago/Turabian StyleWang, Binyou, Xiaoqiu Tan, Jianmin Guo, Ting Xiao, Yan Jiao, Junlin Zhao, Jianming Wu, and Yiwei Wang. 2022. "Drug-Induced Immune Thrombocytopenia Toxicity Prediction Based on Machine Learning" Pharmaceutics 14, no. 5: 943. https://doi.org/10.3390/pharmaceutics14050943
APA StyleWang, B., Tan, X., Guo, J., Xiao, T., Jiao, Y., Zhao, J., Wu, J., & Wang, Y. (2022). Drug-Induced Immune Thrombocytopenia Toxicity Prediction Based on Machine Learning. Pharmaceutics, 14(5), 943. https://doi.org/10.3390/pharmaceutics14050943