
Targeting Peptide, Fluorescent Reagent Modified Magnetic Liposomes Coated with Rapamycin Target Early Atherosclerotic Plaque and Therapy

 , and
, and 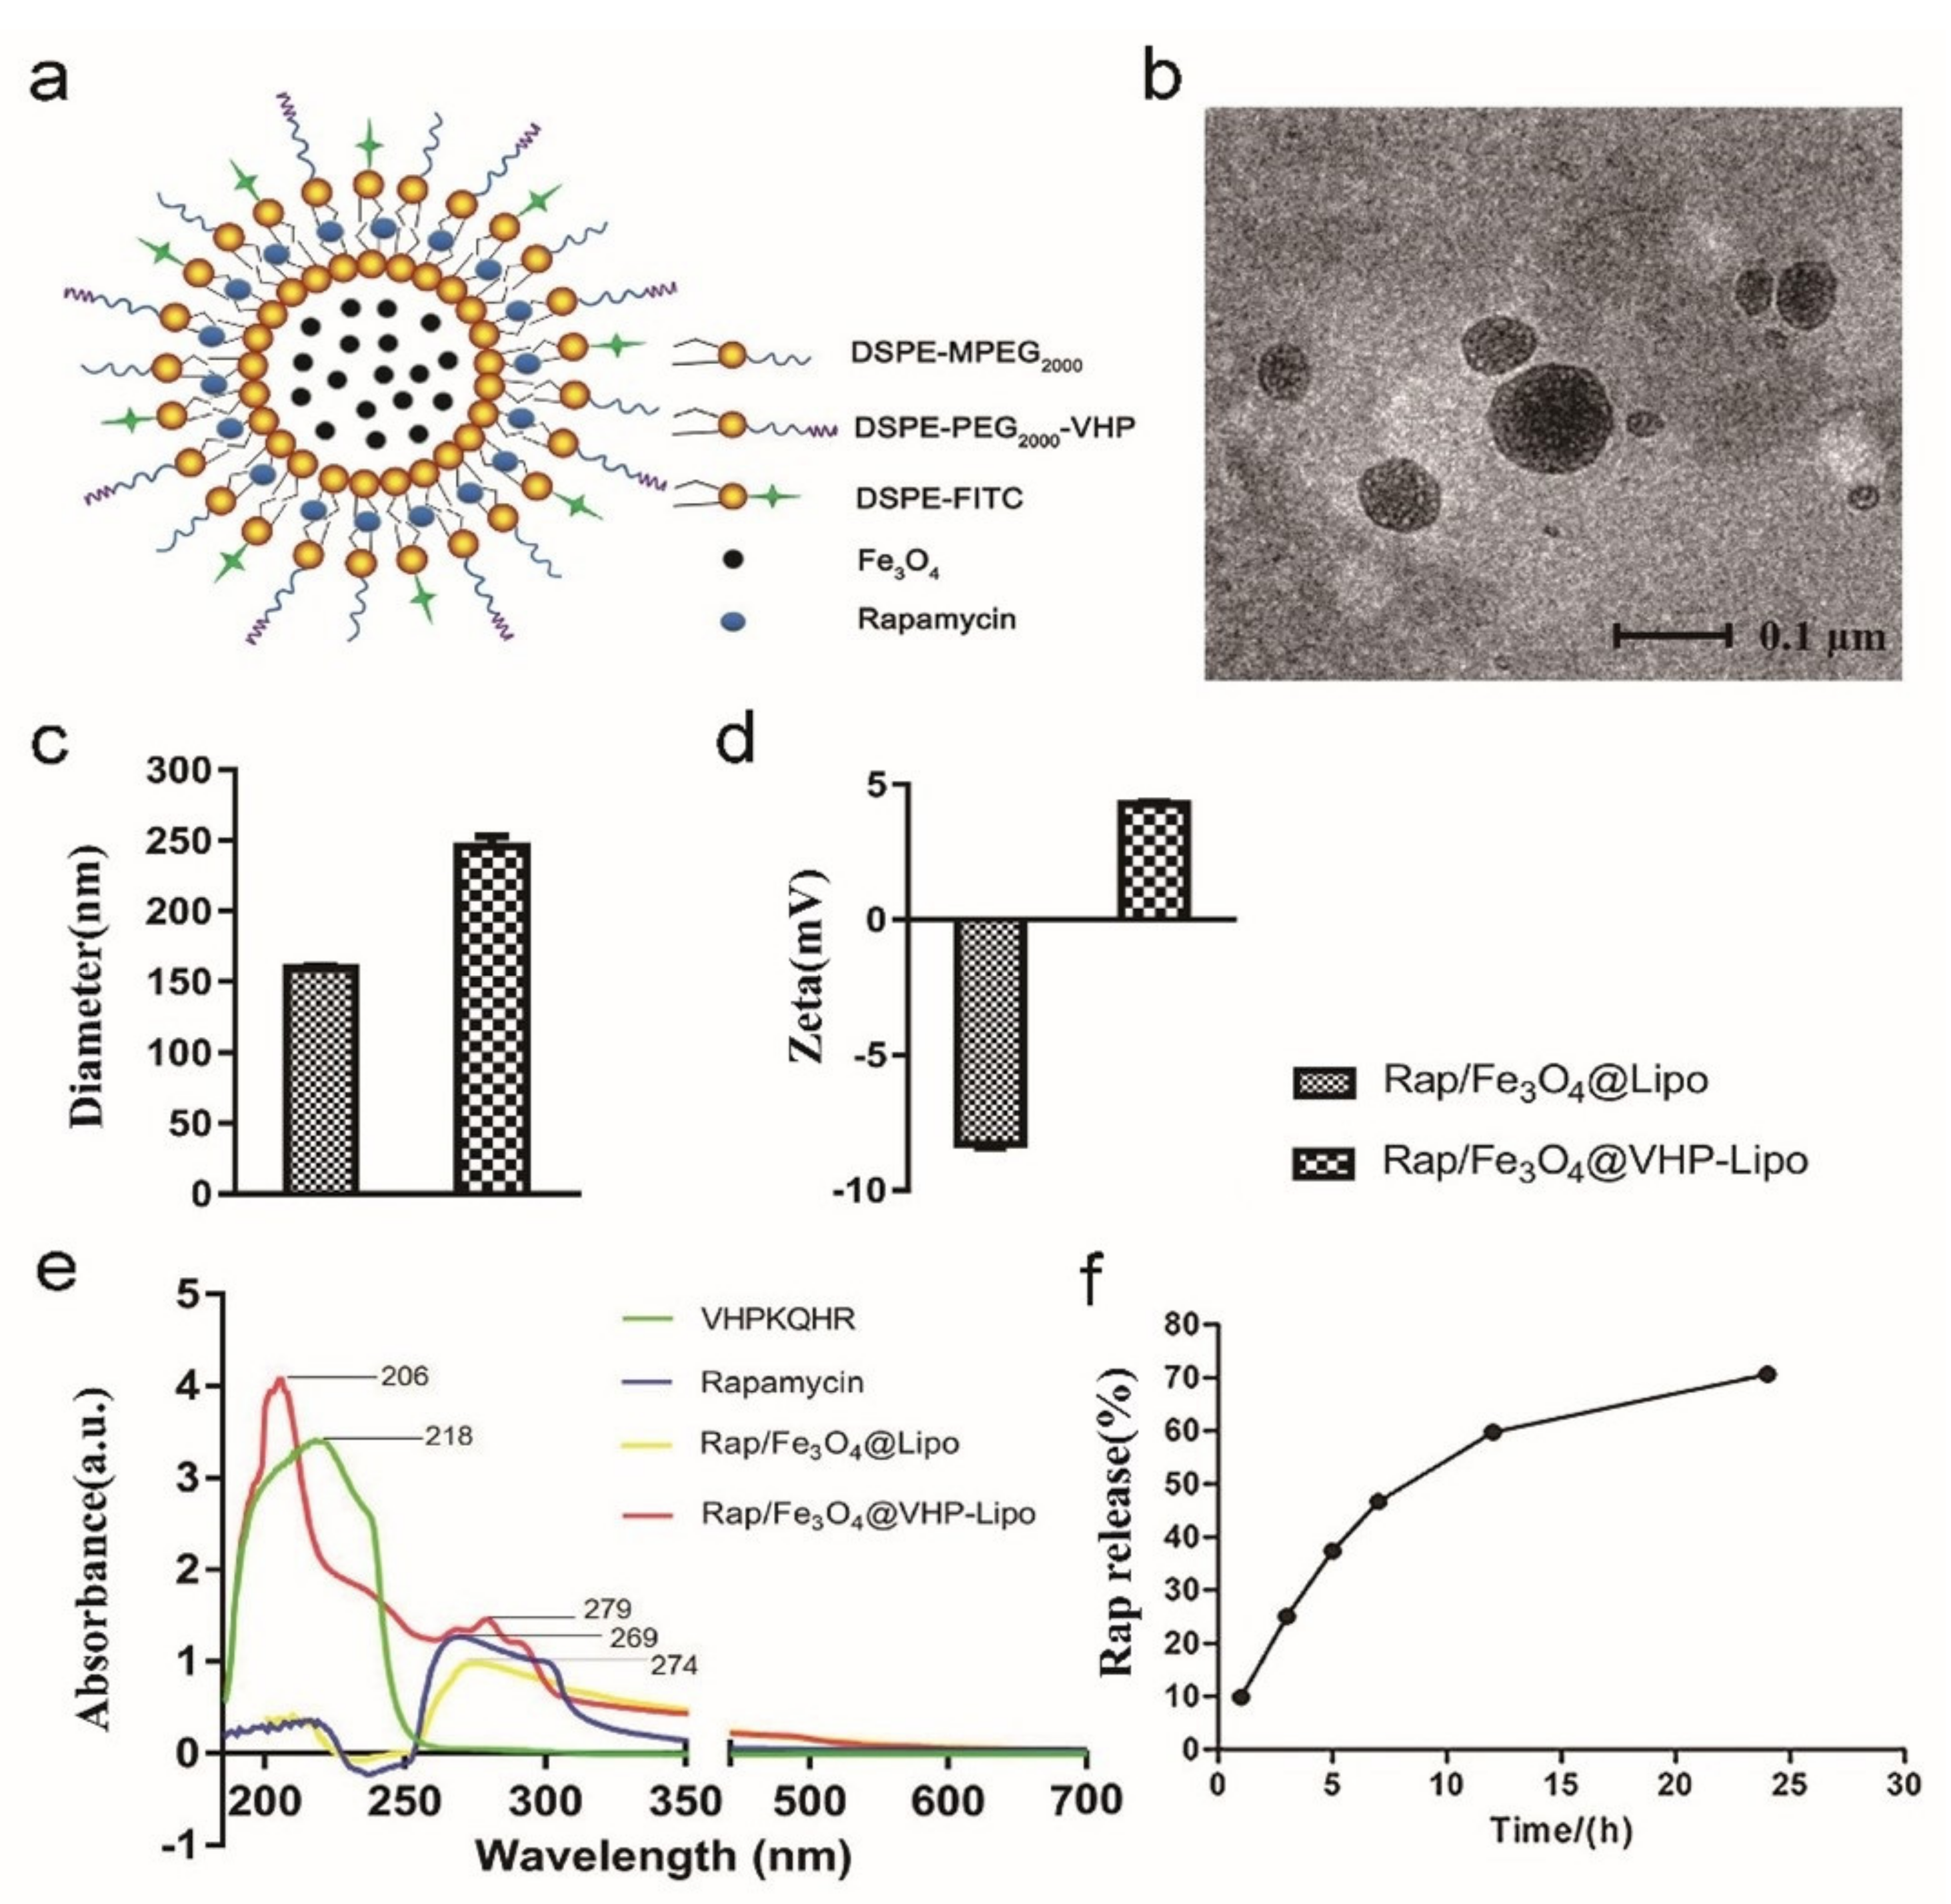
Abstract
:1. Introduction
2. Materials and Methods
2.1. Synthesis of Liposomes
2.1.1. Drug information
2.1.2. Synthesis of Rap/Fe3O4@Lipo
2.1.3. Synthesis of DSPE-PEG2000-VHP
2.1.4. Synthesis of Rap/Fe3O4@VHP-Lipo
2.2. Characterization of Nanoparticles
2.3. Drug Loading and Release
2.4. Cell Culture and Viability Assay
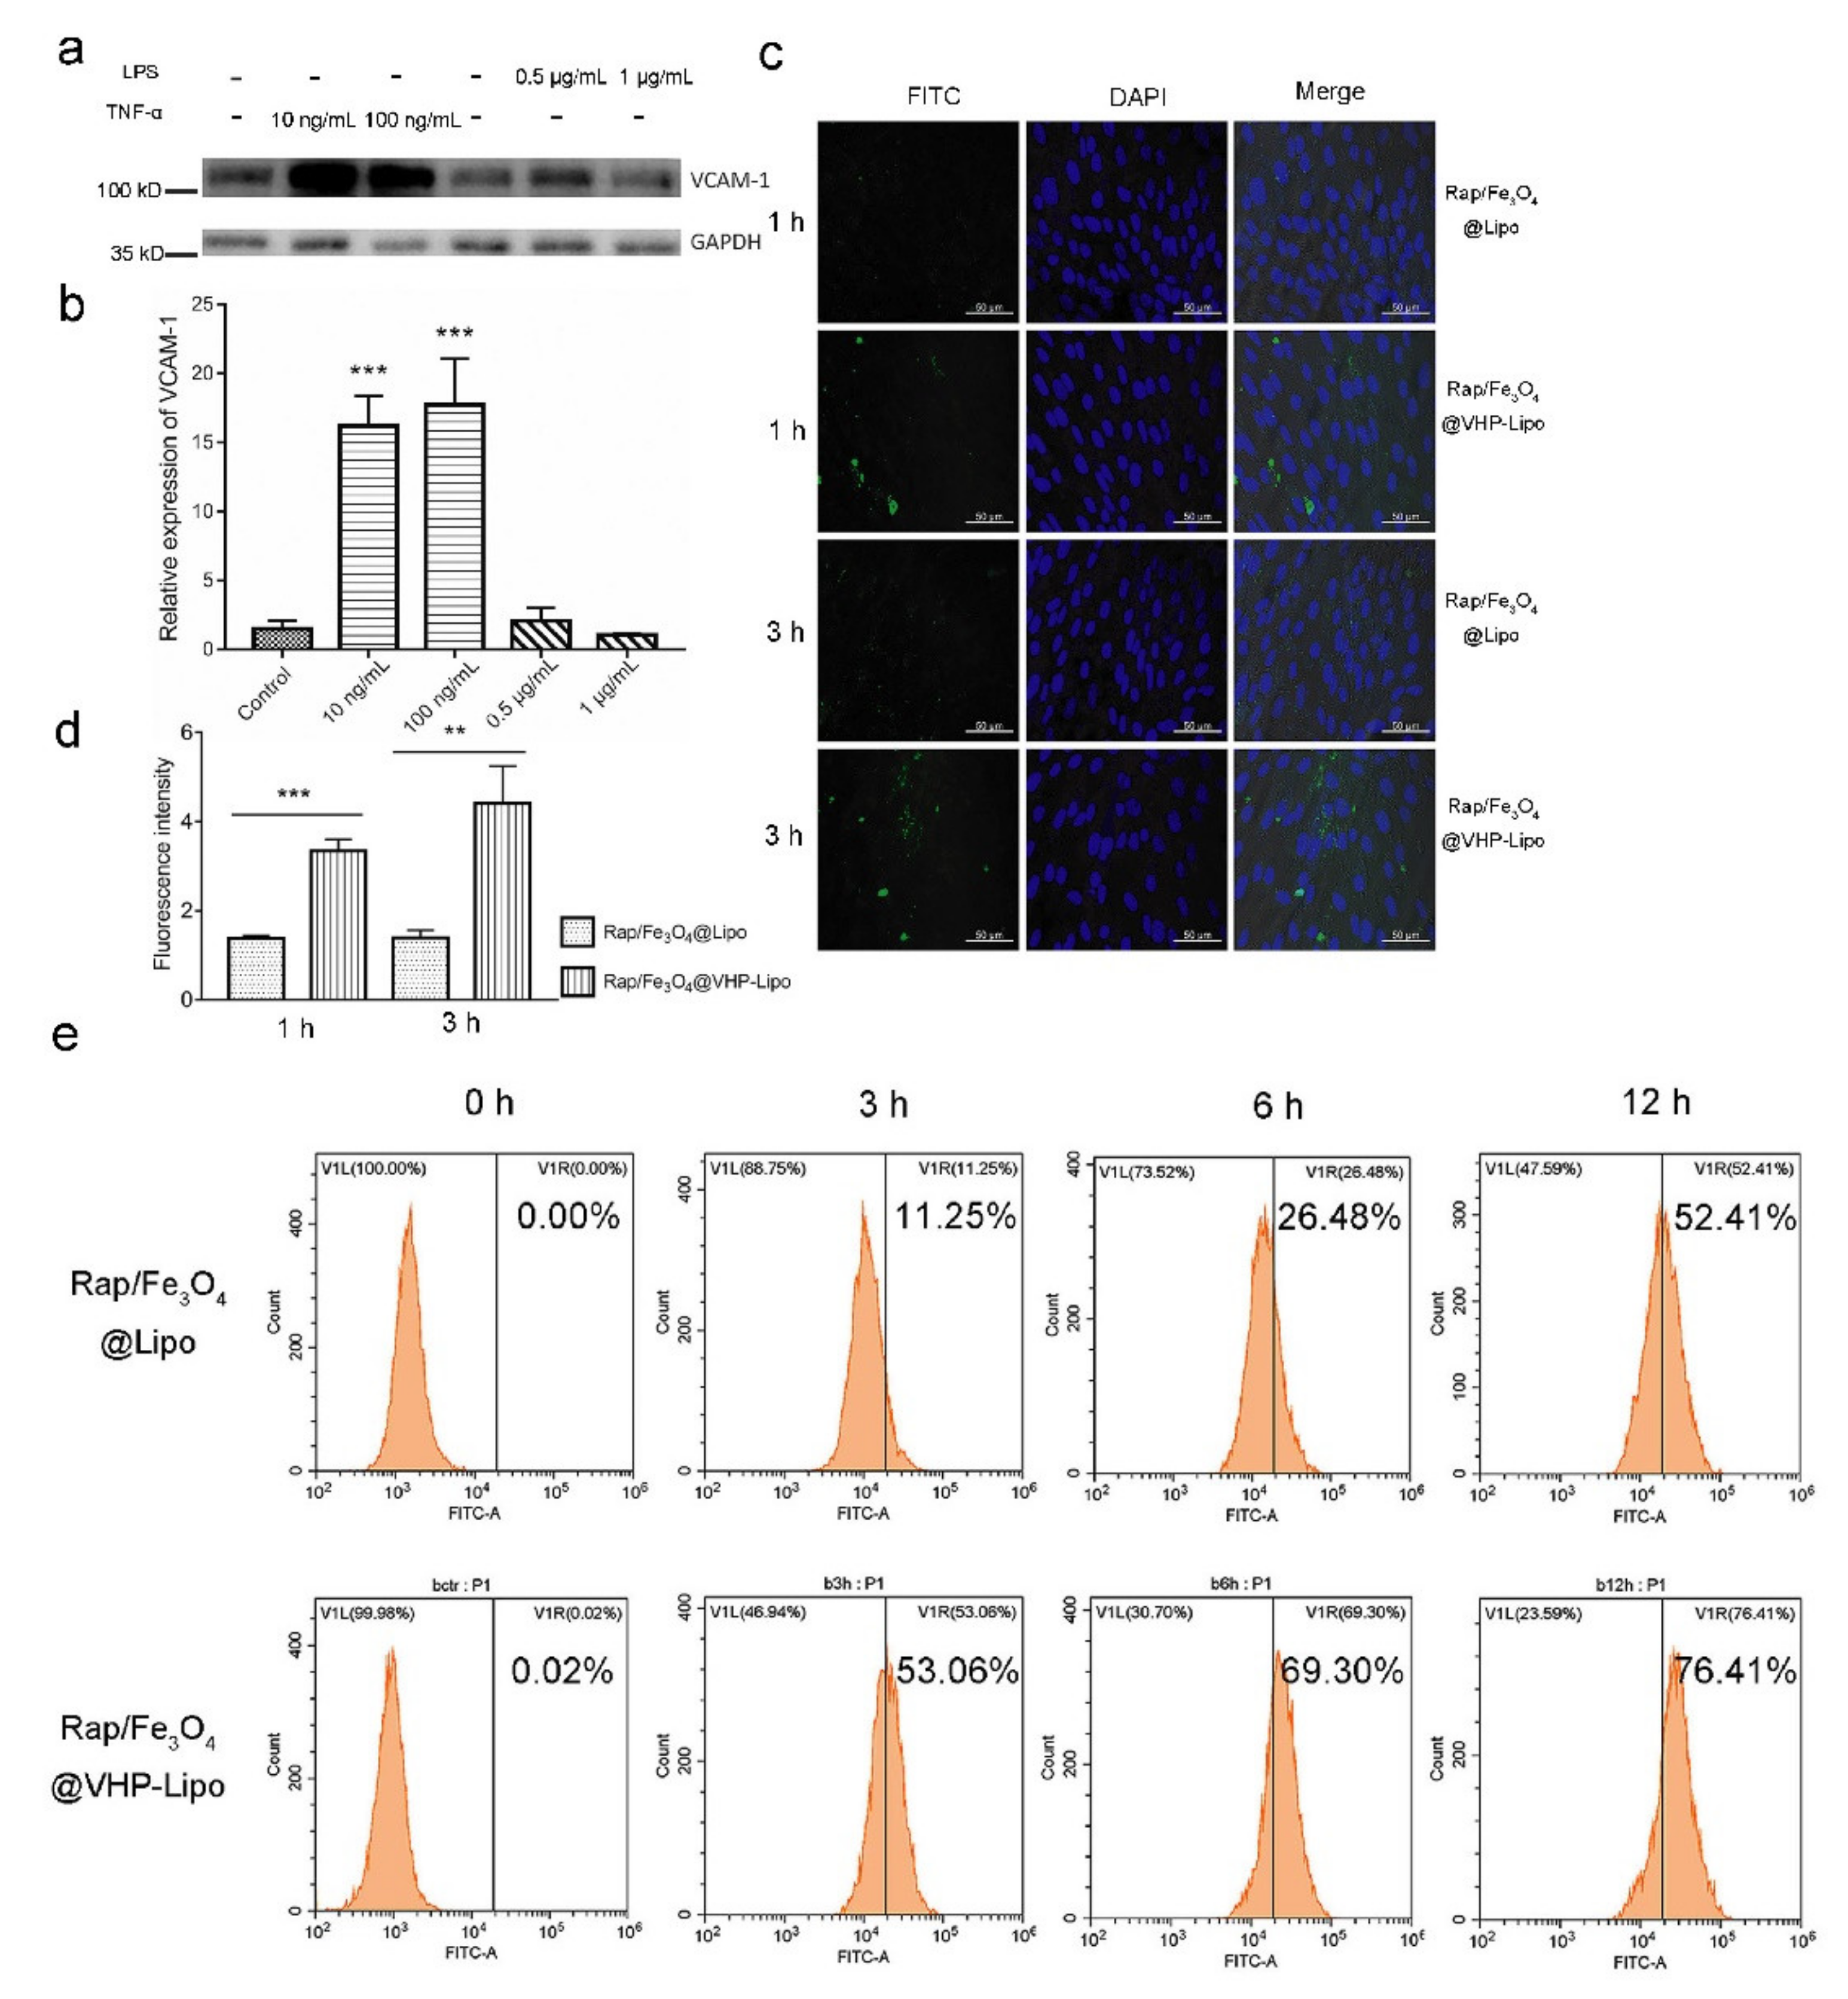
2.5. Western Blot
2.6. Flow Cytometry Analysis
2.7. Confocal Microscopy Imaging
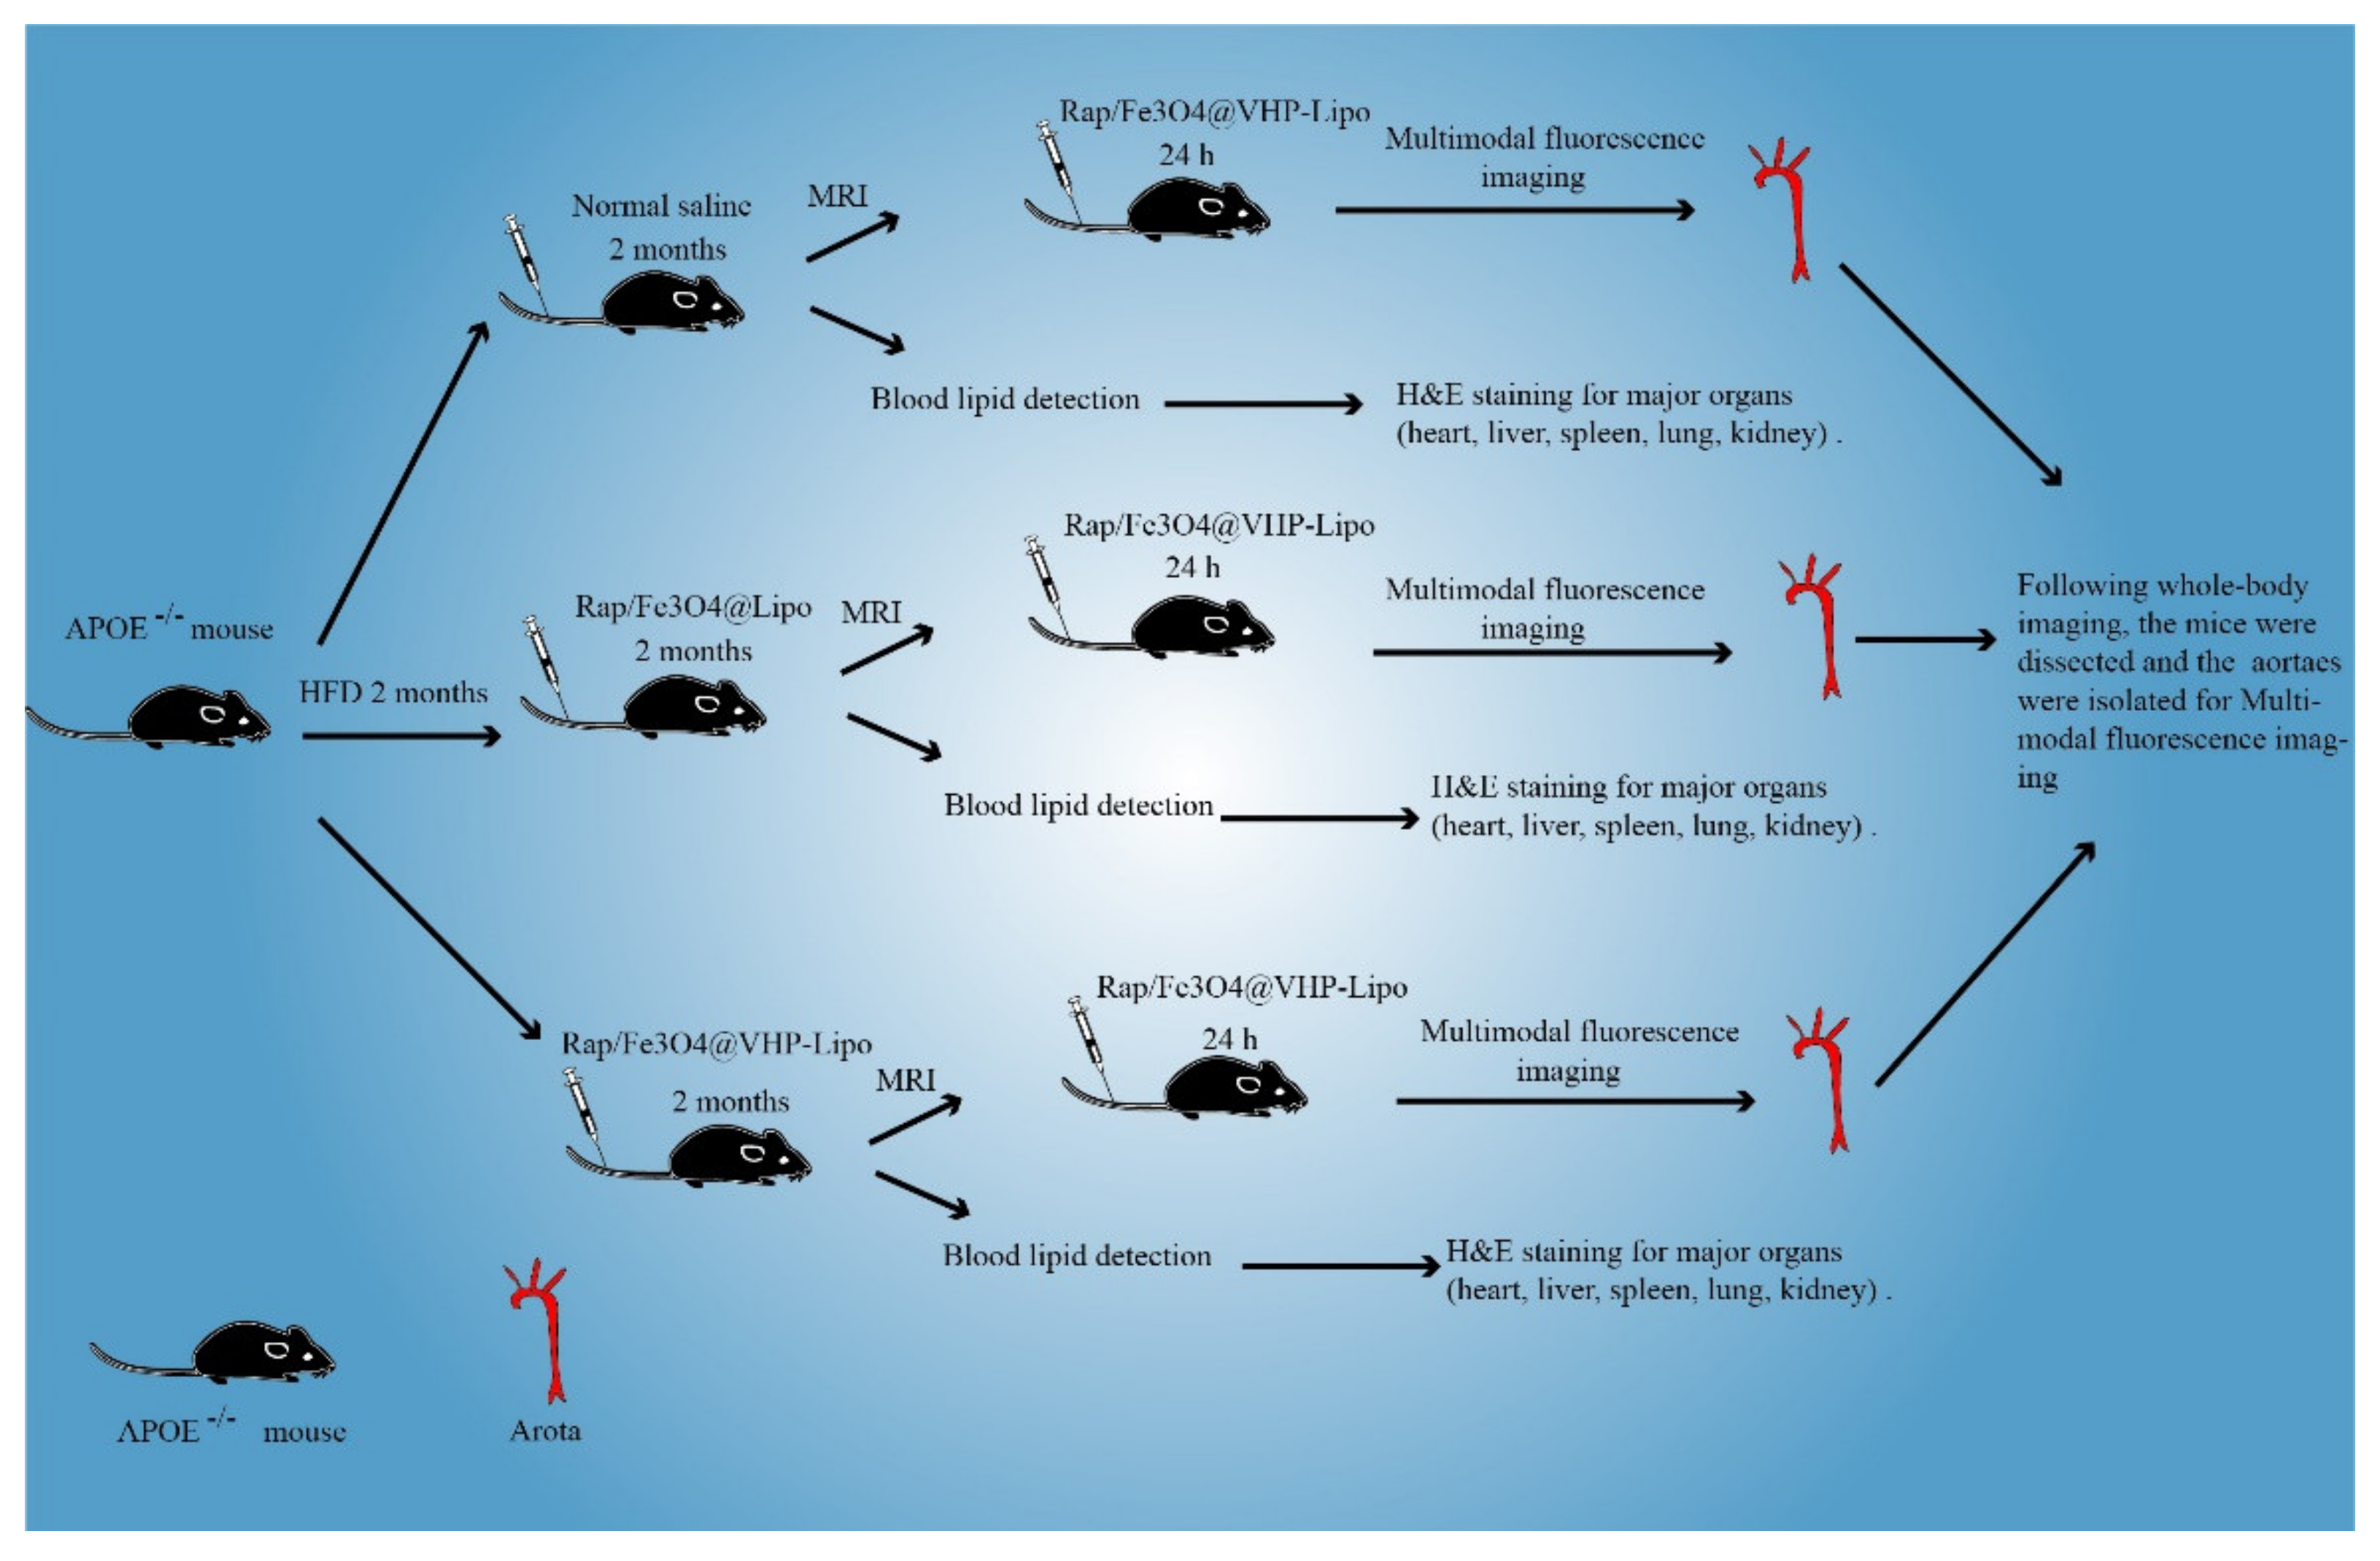
2.8. Establishment and Therapy of Atherosclerosis Model Mice
2.9. Magnetic Resonance Imaging
2.10. Fluorescence Imaging
2.11. Histological Examination
2.12. Pharmacokinetic Test of Rapamycin in Mice
2.13. Blood Biochemical Analysis
2.14. Data Analysis
3. Results
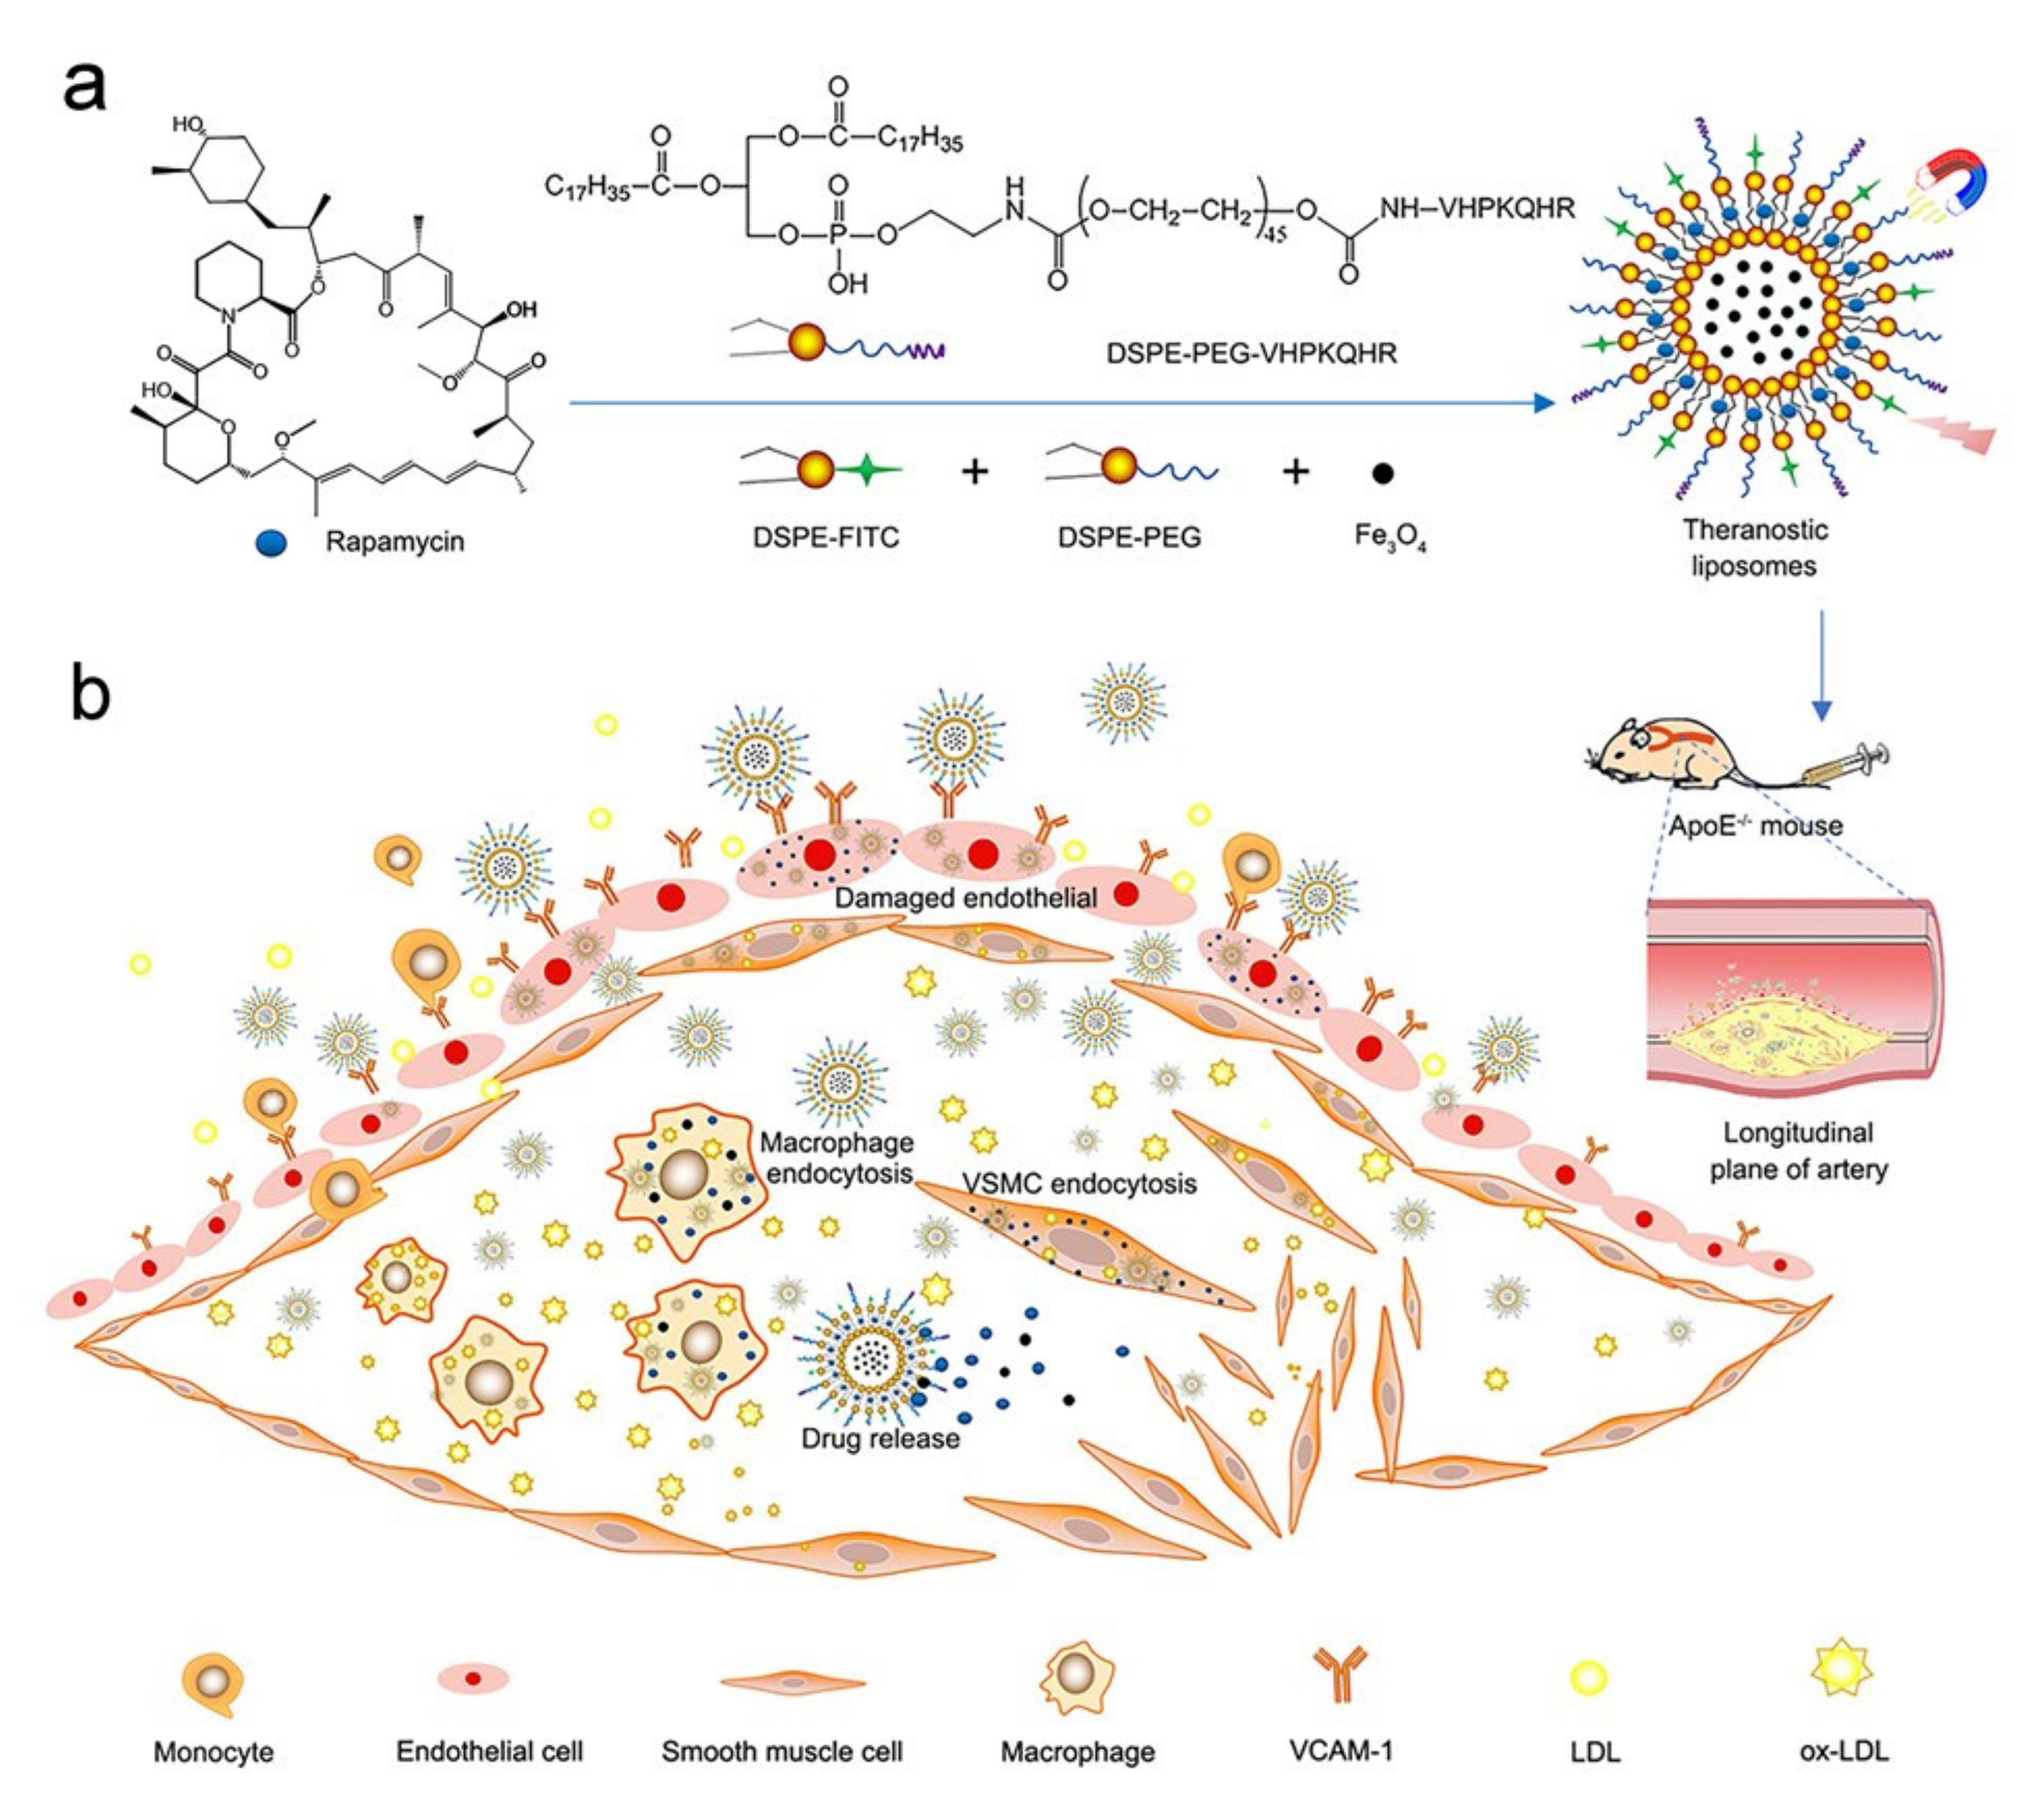
3.1. Synthesis and Characterization of Rap/Fe3O4@VHP-Lipo
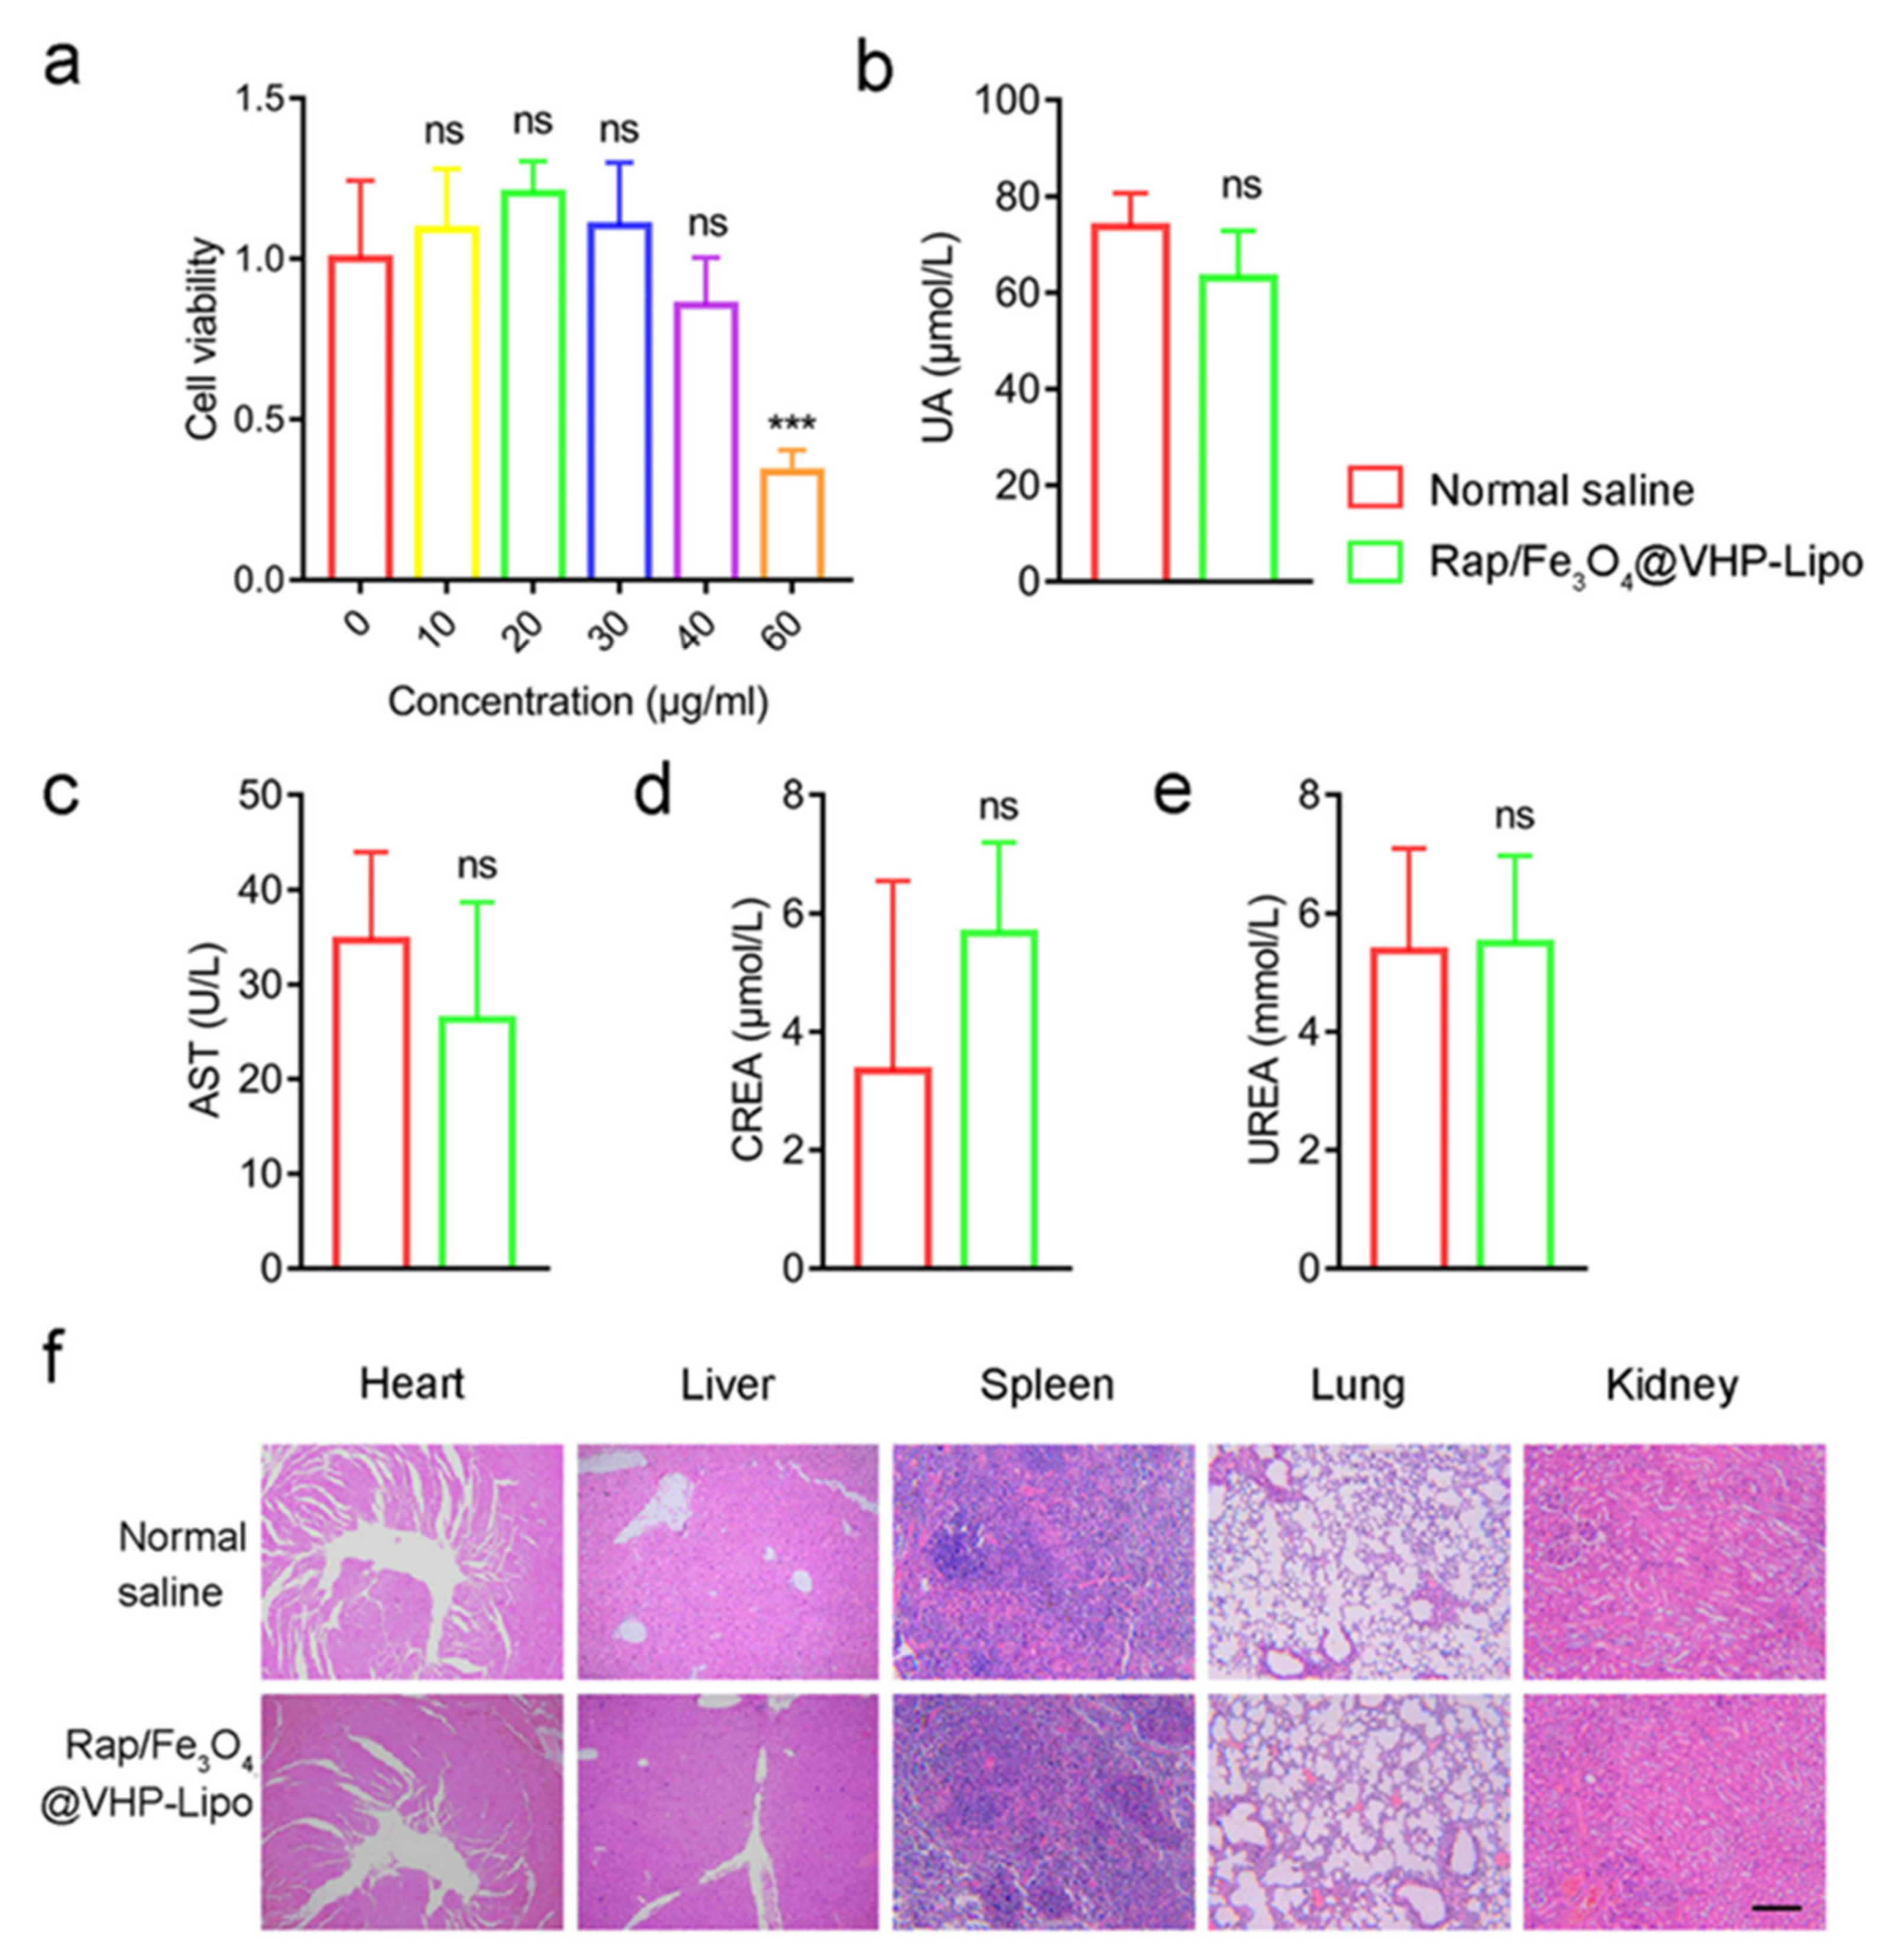
3.2. Toxicity of Rap/Fe3O4@VHP-Lipo
3.3. Toxicity of Rap/Fe3O4@VHP-Lipo
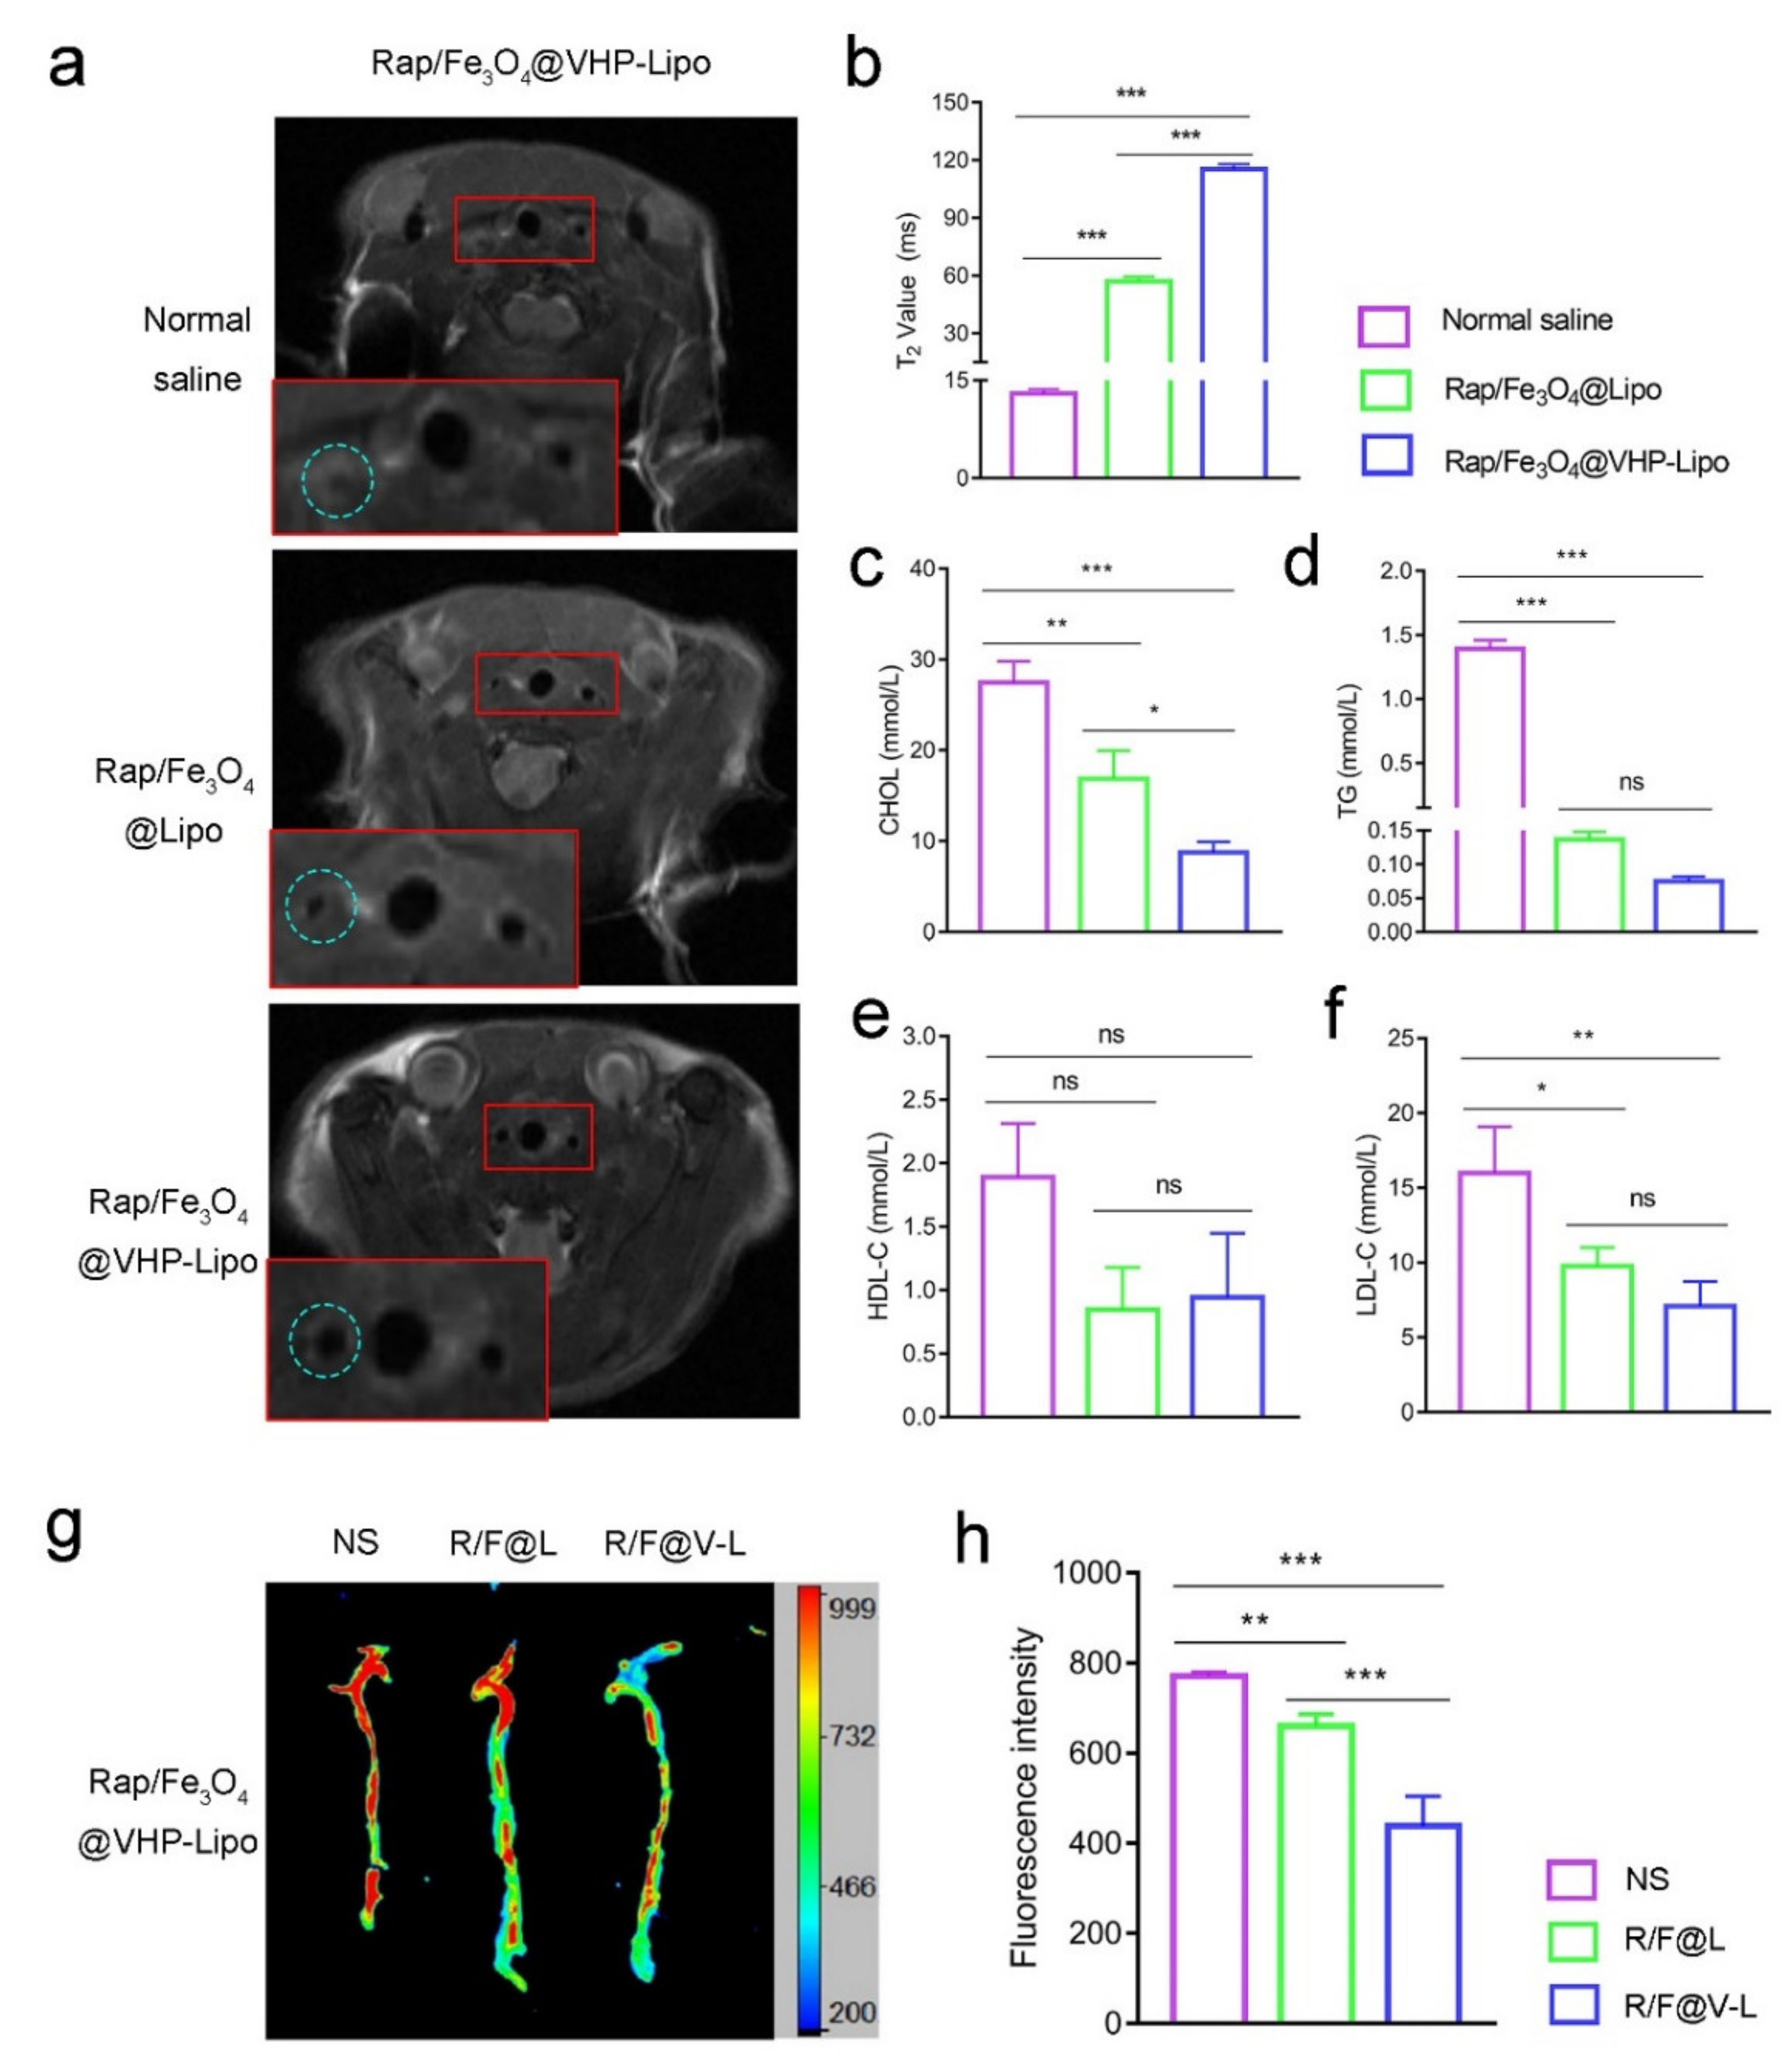
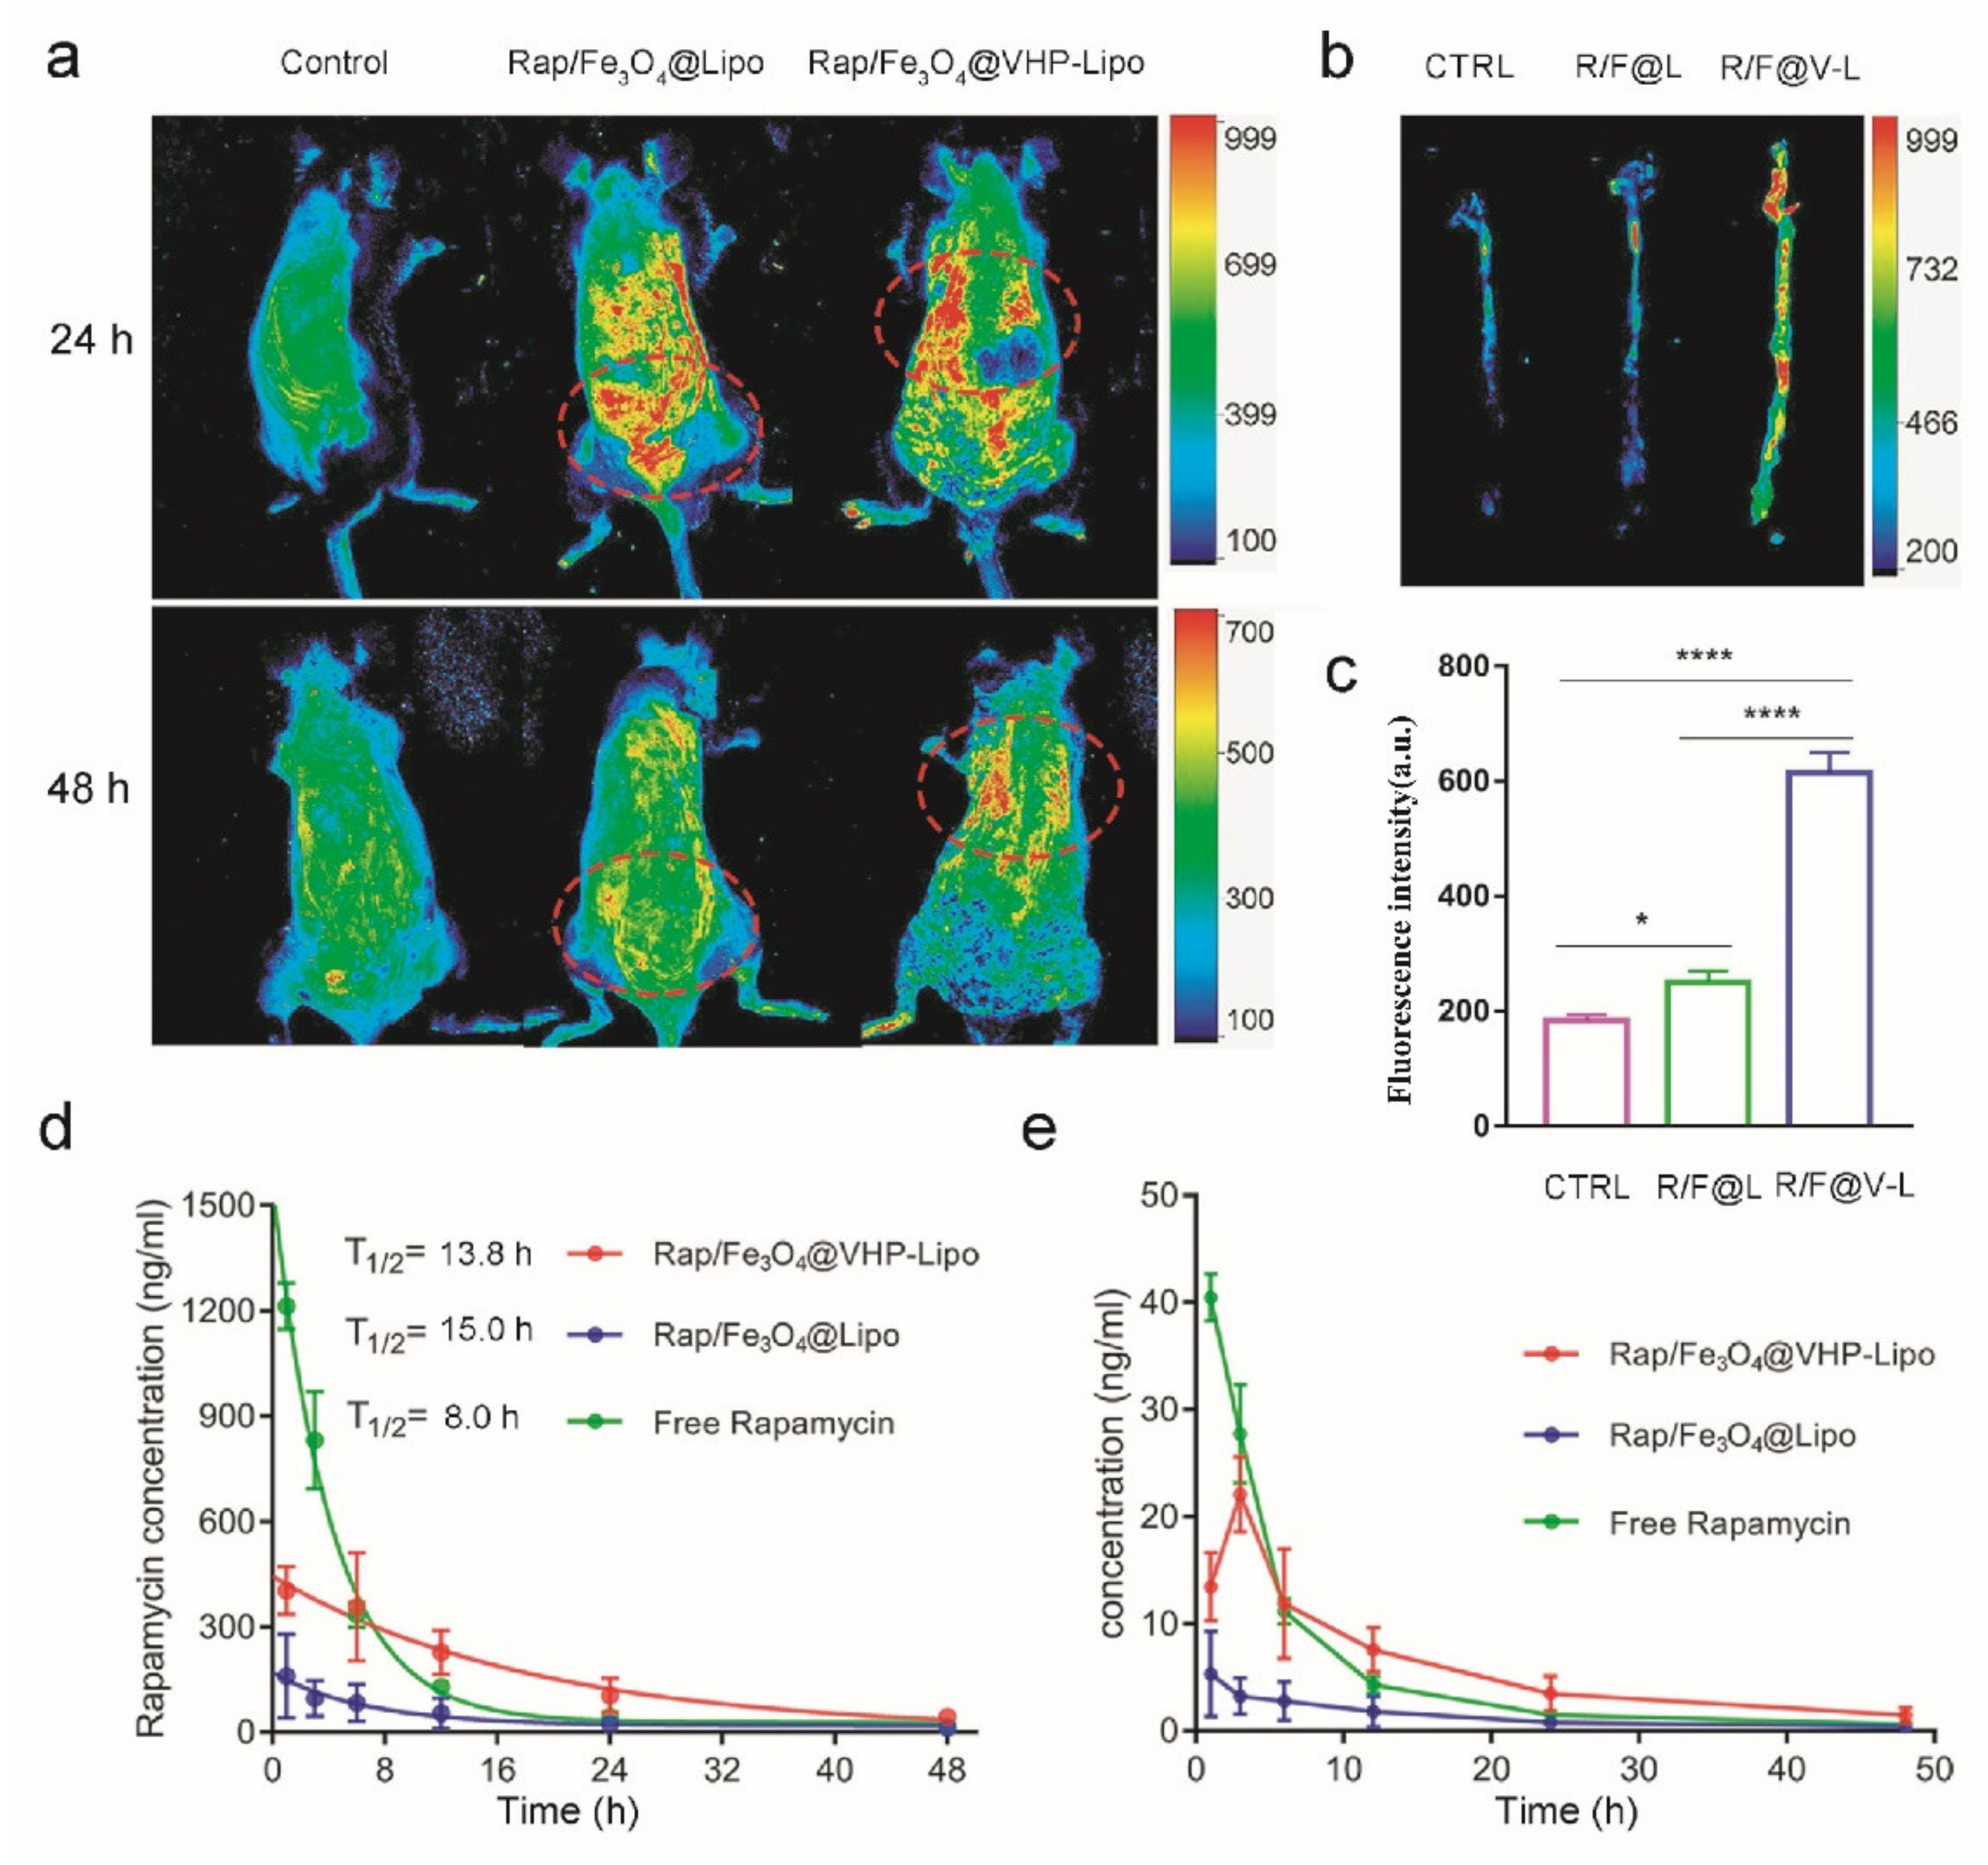
3.4. Targeting Effect and Prolonged Circulation Time of Rap/Fe3O4@VHP-Lipo In Vivo
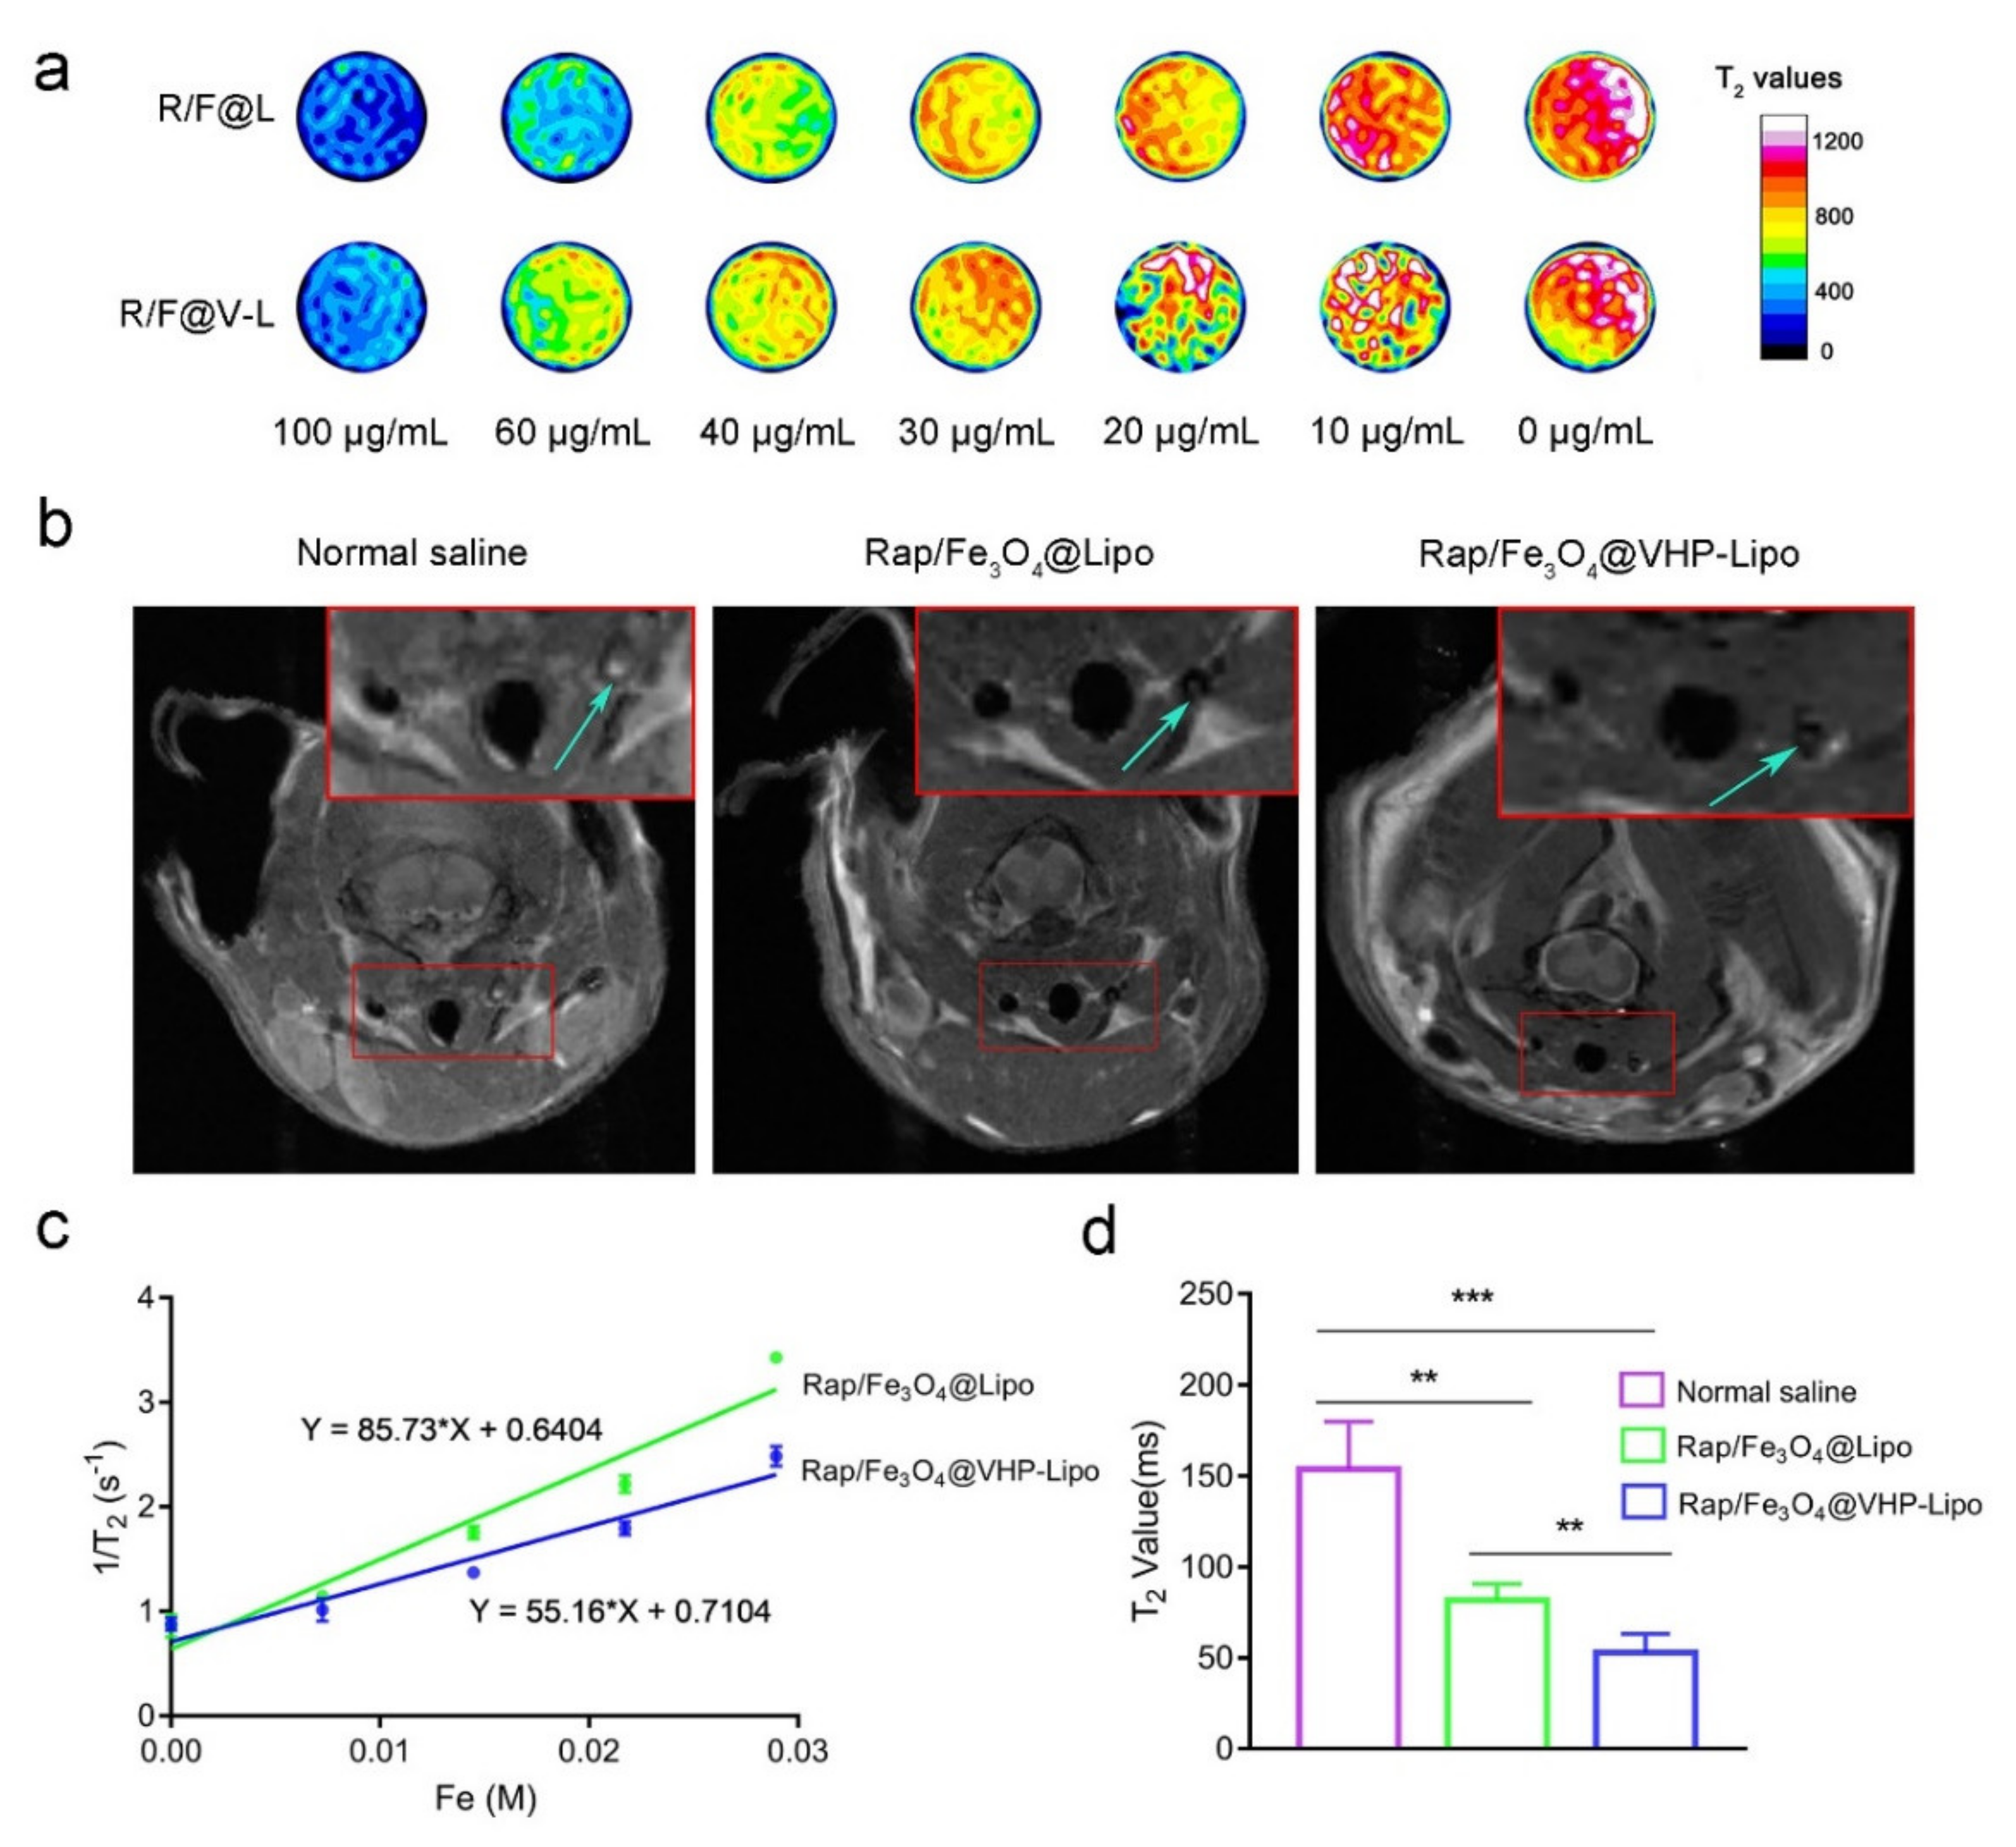
3.5. MRI Effect of Rap/Fe3O4@Lipo (No Targeting Peptide) and Rap/Fe3O4@VHP-Lipo In Vivo and Ex Vivo
3.6. Effect of Rap/Fe3O4@VHP-Lipo in Therapizing Atherosclerosis
4. Discussion
5. Conclusions
Supplementary Materials
Author Contributions
Funding
Institutional Review Board Statement
Informed Consent Statement
Data Availability Statement
Conflicts of Interest
Abbreviations
| AS | Atherosclerosis |
| AST | Aspartate transaminase |
| AP | Ammonium persulphate |
| ApoE | Apolipoprotein E |
| BSA | Bovine serum albumin |
| CCK-8 | Cell Counting Kit-8 |
| CREA | Creatinine |
| CT | Computer tomography |
| CHOL | Total cholesterol |
| DAPI | 4,6-diamino-2-phenylindole |
| DLS | Dynamic light scattering |
| DSPE | Distearoyl phosphoethanolamine |
| EPR | Enhanced permeability and retention effect |
| EE | Encapsulation efficiency |
| FDA | Food and Drug Administration |
| FITC | Fluorescein isothiocyanate |
| FOV | Field of view |
| HDL-C | High-density lipoprotein cholesterol |
| HPLC | High-performance liquid chromatography |
| H&E | Hematoxylin and eosin staining |
| HFD | High-fat diet |
| ICG | Indocyanine green |
| ICAM-1 | Intercellular cell adhesion molecule-1 |
| MAECs | Mouse aortic endothelial cells |
| NIRF | Near-infrared fluorescence |
| NPs | Nanoparticles |
| Rap | Rapamycin |
| Lipo | Liposome |
| LDL-C | Low-density lipoprotein cholesterol |
| UREA | Urea nitrogen |
| UV-Vis | Ultraviolet visible spectroscopy |
| TEM | Transmission electron microscope |
| TR | Repetition time |
| ROI | Region of interest |
| LPS | Lipopolysaccharides |
| TNF-α | Tumor necrosis factor-α |
| TG | Triglycerides |
| TC | Total cholesterol |
| VCAM-1 | Vascular cell adhesion molecule-1 |
| VHPKQHR | Val-His-Pro-Lys-Gln-His-Arg |
| ox-LDL | Oxidized low-density lipoprotein |
| PBS | Phosphate buffer |
| PET | Positron emission computed Tomography |
| PVDF | Polyvinylidene fluoride |
| Tris | Trishydroxymethylaminomethane |
| VLA-4 | Very late antigen-4 |
| USPIO | Ultrafine superparamagnetic iron oxide |
| UA | Uric acid |
| PEG | Polyethylene glycol |
| PVDF | Polyvinylidene fluoride |
| LOX-1 | Oxidized low-density lipoprotein receptor-1 |
| VSMC | Vascular smooth muscle cell |
| mTOR | Mammalian target of rapamycin |
| HFD | High-fat diet |
| MRI | Magnetic resonance imaging |
| LC–MS | Liquid chromatography–mass spectrometry |
| HPLC | High-performance liquid chromatography |
| Rap | Rapamycin |
| Rap/Fe3O4@-Lipo | Magnetic liposomes coated with Rap |
| Rap/Fe3O4@VHP-Lipo | VHPKQHR-modified magnetic liposomes coated with Rap |
| ROI | Region of interest |
| SDS-PAGE | Sodium dodecyl sulfate polyacrylamide gel electrophoresis |
References
- Ross, R. Atherosclerosis—An inflammatory disease. N. Engl. J. Med. 1999, 340, 115–126. [Google Scholar] [CrossRef] [PubMed]
- Kasikara, C.; Doran, A.C.; Cai, B.; Tabas, I. The role of non-resolving inflammation in atherosclerosis. J. Clin. Investig. 2018, 128, 2713–2723. [Google Scholar] [CrossRef] [PubMed] [Green Version]
- Nafisa, A.; Gray, S.G.; Cao, Y.; Wang, T.; Xu, S.; Wattoo, F.H.; Barras, M.; Cohen, N.; Kamato, D.; Little, P.J. Endothelial function and dysfunction: Impact of metformin. Pharmacol. Ther. 2018, 192, 150–162. [Google Scholar] [CrossRef] [PubMed] [Green Version]
- Koelwyn, G.J.; Corr, E.M.; Erbay, E.; Moore, K.J. Regulation of macrophage immunometabolism in atherosclerosis. Nat. Immunol. 2018, 19, 526–537. [Google Scholar] [CrossRef] [Green Version]
- Wu, S.; Xu, H.; Peng, J.; Wang, C.; Jin, Y.; Liu, K.; Sun, H.; Qin, J. Potent anti-inflammatory effect of dioscin mediated by suppression of TNF-alpha-induced VCAM-1, ICAM-1and EL expression via the NF-kappaB pathway. Biochimie 2015, 110, 62–72. [Google Scholar] [CrossRef]
- Iiyama, K.; Hajra, L.; Iiyama, M.; Li, H.; DiChiara, M.; Medoff, B.D.; Cybulsky, M.I. Patterns of vascular cell adhesion molecule-1 and intercellular adhesion molecule-1 expression in rabbit and mouse atherosclerotic lesions and at sites predisposed to lesion formation. Circ. Res. 1999, 85, 199–207. [Google Scholar] [CrossRef]
- Trpkovic, A.; Resanovic, I.; Stanimirovic, J.; Radak, D.; Mousa, S.A.; Cenic-Milosevic, D.; Jevremovic, D.; Isenovic, E.R. Oxidized low-density lipoprotein as a biomarker of cardiovascular diseases. Crit. Rev. Clin. Lab. Sci. 2015, 52, 70–85. [Google Scholar] [CrossRef]
- Nahrendorf, M.; Jaffer, F.A.; Kelly, K.A.; Sosnovik, D.E.; Aikawa, E.; Libby, P.; Weissleder, R. Noninvasive vascular cell adhesion molecule-1 imaging identifies inflammatory activation of cells in atherosclerosis. Circulation 2006, 114, 1504–1511. [Google Scholar] [CrossRef] [Green Version]
- Byrne, J.D.; Betancourt, T.; Brannon-Peppas, L. Active targeting schemes for nanoparticle systems in cancer therapeutics. Adv. Drug Deliv. Rev. 2008, 60, 1615–1626. [Google Scholar] [CrossRef]
- Craik, D.J.; Fairlie, D.P.; Liras, S.; Price, D. The future of peptide-based drugs. Chem. Biol. Drug Des. 2013, 81, 136–147. [Google Scholar] [CrossRef]
- Kelly, K.A.; Nahrendorf, M.; Yu, A.M.; Reynolds, F.; Weissleder, R. In vivo phage display selection yields atherosclerotic plaque targeted peptides for imaging. Mol. Imaging Biol. 2006, 8, 201–207. [Google Scholar] [CrossRef]
- Haeri, A.; Osouli, M.; Bayat, F.; Alavi, S.; Dadashzadeh, S. Nanomedicine approaches for sirolimus delivery: A review of pharmaceutical properties and preclinical studies. Artif. Cells Nanomed. Biotechnol. 2018, 46, 1–14. [Google Scholar] [CrossRef] [Green Version]
- Dilnawaz, F.; Acharya, S.; Sahoo, S.K. Recent trends of nanomedicinal approaches in clinics. Int. J. Pharm. 2018, 538, 263–278. [Google Scholar] [CrossRef]
- Xu, H.; Paxton, J.W.; Wu, Z. Development of Long-Circulating pH-Sensitive Liposomes to Circumvent Gemcitabine Resistance in Pancreatic Cancer Cells. Pharm. Res. 2016, 33, 1628–1637. [Google Scholar] [CrossRef]
- Liu, Y.; Wang, J.; Zhang, J.; Marbach, S.; Xu, W.; Zhu, L. Targeting Tumor-Associated Macrophages by MMP2-Sensitive Apoptotic Body-Mimicking Nanoparticles. ACS Appl. Mater. Interfaces 2020, 12, 52402–52414. [Google Scholar] [CrossRef]
- Vaidya, B.; Nayak, M.K.; Dash, D.; Agrawal, G.P.; Vyas, S.P. Development and characterization of highly selective target-sensitive liposomes for the delivery of streptokinase: In vitro/in vivo studies. Drug Deliv. 2016, 23, 801–807. [Google Scholar] [CrossRef]
- Dandekar, M.P.; Peng, T.; McPherson, D.D.; Quevedo, J.; Soares, J.C.; Huang, S.L. Intravenous infusion of xenon-containing liposomes generates rapid antidepressant-like effects. Prog. Neuropsychopharmacol. Biol. Psychiatry 2018, 86, 140–149. [Google Scholar] [CrossRef]
- Thamphiwatana, S.; Gao, W.; Pornpattananangkul, D.; Zhang, Q.; Fu, V.; Li, J.; Li, J.; Obonyo, M.; Zhang, L. Phospholipase A2-responsive antibiotic delivery via nanoparticle-stabilized liposomes for the treatment of bacterial infection. J. Mater. Chem. B 2014, 2, 8201–8207. [Google Scholar] [CrossRef] [Green Version]
- Zhai, Y.; He, X.; Li, Y.; Han, R.; Ma, Y.; Gao, P.; Qian, Z.; Gu, Y.; Li, S. A splenic-targeted versatile antigen courier: iPSC wrapped in coalescent erythrocyte-liposome as tumor nanovaccine. Sci. Adv. 2021, 7, eabi6326. [Google Scholar] [CrossRef]
- Delgado, V.; Popescu, B.A.; Plein, S.; Achenbach, S.; Knuuti, J.; Bax, J.J. The Year in Cardiology 2018: Imaging. Eur. Heart J. 2019, 40, 508–517. [Google Scholar] [CrossRef]
- Fayad, Z.A.; Swirski, F.K.; Calcagno, C.; Robbins, C.S.; Mulder, W.; Kovacic, J.C. Monocyte and Macrophage Dynamics in the Cardiovascular System: JACC Macrophage in CVD Series (Part 3). J. Am. Coll. Cardiol. 2018, 72, 2198–2212. [Google Scholar] [CrossRef]
- DeMaria, A.N.; Narula, J.; Mahmud, E.; Tsimikas, S. Imaging vulnerable plaque by ultrasound. J. Am. Coll. Cardiol. 2006, 47, C32–C39. [Google Scholar] [CrossRef] [Green Version]
- Lohofer, F.; Buchholz, R.; Glinzer, A.; Huber, K.; Haas, H.; Kaissis, G.; Feuchtinger, A.; Aichler, M.; Sporns, P.B.; Holtke, C.; et al. Mass Spectrometry Imaging of atherosclerosis-affine Gadofluorine following Magnetic Resonance Imaging. Sci. Rep. 2020, 10, 79. [Google Scholar] [CrossRef]
- Sanz, J.; Fayad, Z.A. Imaging of atherosclerotic cardiovascular disease. Nature 2008, 451, 953–957. [Google Scholar] [CrossRef]
- Hu, H. Recent Advances of Bioresponsive Nano-Sized Contrast Agents for Ultra-High-Field Magnetic Resonance Imaging. Front. Chem. 2020, 8, 203. [Google Scholar] [CrossRef] [Green Version]
- Jiang, T.; Zhang, C.; Zheng, X.; Xu, X.; Xie, X.; Liu, H.; Liu, S. Noninvasively characterizing the different alphavbeta3 expression patterns in lung cancers with RGD-USPIO using a clinical 3.0T MR scanner. Int. J. Nanomed. 2009, 4, 241–249. [Google Scholar] [CrossRef] [Green Version]
- Lobatto, M.E.; Calcagno, C.; Millon, A.; Senders, M.L.; Fay, F.; Robson, P.M.; Ramachandran, S.; Binderup, T.; Paridaans, M.P.; Sensarn, S.; et al. Atherosclerotic plaque targeting mechanism of long-circulating nanoparticles established by multimodal imaging. ACS Nano 2015, 9, 1837–1847. [Google Scholar] [CrossRef] [Green Version]
- Gautier, E.L.; Huby, T.; Witztum, J.L.; Ouzilleau, B.; Miller, E.R.; Saint-Charles, F.; Aucouturier, P.; Chapman, M.J.; Lesnik, P. Macrophage apoptosis exerts divergent effects on atherogenesis as a function of lesion stage. Circulation 2009, 119, 1795–1804. [Google Scholar] [CrossRef] [Green Version]
- Luo, Y.; Yang, J.; Yan, Y.; Li, J.; Shen, M.; Zhang, G.; Mignani, S.; Shi, X. RGD-functionalized ultrasmall iron oxide nanoparticles for targeted T(1)-weighted MR imaging of gliomas. Nanoscale 2015, 7, 14538–14546. [Google Scholar] [CrossRef]
- Xu, X.; Yang, B.; Wang, D.; Zhu, Y.; Miao, X.; Yang, W. The Chemical Composition of Brazilian Green Propolis and Its Protective Effects on Mouse Aortic Endothelial Cells against Inflammatory Injury. Molecules 2020, 25, 4612. [Google Scholar] [CrossRef]
- Felmeden, D.C.; Lip, G.Y. Endothelial function and its assessment. Expert. Opin. Investig. Drugs 2005, 14, 1319–1336. [Google Scholar] [CrossRef] [PubMed]
- Fan, X.; Chen, X.; Feng, Q.; Peng, K.; Wu, Q.; Passerini, A.G.; Simon, S.I.; Sun, C. Downregulation of GATA6 in mTOR-inhibited human aortic endothelial cells: Effects on TNF-alpha-induced VCAM-1 expression and monocytic cell adhesion. Am. J. Physiol. Heart Circ. Physiol. 2019, 316, H408–H420. [Google Scholar] [CrossRef] [PubMed]
- Yan, R.; van Meurs, M.; Popa, E.R.; Jongman, R.M.; Zwiers, P.J.; Niemarkt, A.E.; Kuiper, T.; Kamps, J.A.; Heeringa, P.; Zijlstra, J.G.; et al. Endothelial Interferon Regulatory Factor 1 Regulates Lipopolysaccharide-Induced VCAM-1 Expression Independent of NFkappaB. J. Innate Immun. 2017, 9, 546–560. [Google Scholar] [CrossRef] [PubMed]
- Zhang, L.; Tian, X.Y.; Chan, C.K.W.; Bai, Q.; Cheng, C.K.; Chen, F.M.; Cheung, M.S.H.; Yin, B.; Yang, H.; Yung, W.Y.; et al. Promoting the Delivery of Nanoparticles to Atherosclerotic Plaques by DNA Coating. ACS Appl. Mater. Interfaces 2019, 11, 13888–13904. [Google Scholar] [CrossRef]
- Sanchez-Gaytan, B.L.; Fay, F.; Lobatto, M.E.; Tang, J.; Ouimet, M.; Kim, Y.; van der Staay, S.E.; van Rijs, S.M.; Priem, B.; Zhang, L.; et al. HDL-mimetic PLGA nanoparticle to target atherosclerosis plaque macrophages. Bioconjug. Chem. 2015, 26, 443–451. [Google Scholar] [CrossRef] [Green Version]
- Ouyang, G.; Vuckovic, D.; Pawliszyn, J. Nondestructive sampling of living systems using in vivo solid-phase microextraction. Chem. Rev. 2011, 111, 2784–2814. [Google Scholar] [CrossRef]
- Calin, M.; Stan, D.; Schlesinger, M.; Simion, V.; Deleanu, M.; Constantinescu, C.A.; Gan, A.M.; Pirvulescu, M.M.; Butoi, E.; Manduteanu, I.; et al. VCAM-1 directed target-sensitive liposomes carrying CCR2 antagonists bind to activated endothelium and reduce adhesion and transmigration of monocytes. Eur. J. Pharm. Biopharm. 2015, 89, 18–29. [Google Scholar] [CrossRef]
- Deng, L.; Ke, X.; He, Z.; Yang, D.; Gong, H.; Zhang, Y.; Jing, X.; Yao, J.; Chen, J. A MSLN-targeted multifunctional nanoimmunoliposome for MRI and targeting therapy in pancreatic cancer. Int. J. Nanomed. 2012, 7, 5053–5065. [Google Scholar] [CrossRef] [Green Version]
- Manea, S.A.; Vlad, M.L.; Rebleanu, D.; Lazar, A.G.; Fenyo, I.M.; Calin, M.; Simionescu, M.; Manea, A. Detection of Vascular Reactive Oxygen Species in Experimental Atherosclerosis by High-Resolution Near-Infrared Fluorescence Imaging Using VCAM-1-Targeted Liposomes Entrapping a Fluorogenic Redox-Sensitive Probe. Oxid. Med. Cell Longev. 2021, 2021, 6685612. [Google Scholar] [CrossRef]
- Narita, Y.; Shimizu, K.; Ikemoto, K.; Uchino, R.; Kosugi, M.; Maess, M.B.; Magata, Y.; Oku, N.; Ogawa, M. Macrophage-targeted, enzyme-triggered fluorescence switch-on system for detection of embolism-vulnerable atherosclerotic plaques. J. Control. Release 2019, 302, 105–115. [Google Scholar] [CrossRef]
- Gholizadeh, S.; Visweswaran, G.R.R.; Storm, G.; Hennink, W.E.; Kamps, J.; Kok, R.J. E-selectin targeted immunoliposomes for rapamycin delivery to activated endothelial cells. Int. J. Pharm. 2018, 548, 759–770. [Google Scholar] [CrossRef]
- Boada, C.; Zinger, A.; Tsao, C.; Zhao, P.; Martinez, J.O.; Hartman, K.; Naoi, T.; Sukhoveshin, R.; Sushnitha, M.; Molinaro, R.; et al. Rapamycin-Loaded Biomimetic Nanoparticles Reverse Vascular Inflammation. Circ. Res. 2020, 126, 25–37. [Google Scholar] [CrossRef]
- Song, E.J.; Ahn, S.; Min, S.K.; Ha, J.; Oh, G.T. Combined application of rapamycin and atorvastatin improves lipid metabolism in apolipoprotein E-deficient mice with chronic kidney disease. BMB Rep. 2021, 54, 170–175. [Google Scholar] [CrossRef]
- Zhu, G.; Hom, J.; Li, Y.; Jiang, B.; Rodriguez, F.; Fleischmann, D.; Saloner, D.; Porcu, M.; Zhang, Y.; Saba, L.; et al. Carotid plaque imaging and the risk of atherosclerotic cardiovascular disease. Cardiovasc. Diagn. Ther. 2020, 10, 1048–1067. [Google Scholar] [CrossRef]
- Carr, J.A.; Franke, D.; Caram, J.R.; Perkinson, C.F.; Saif, M.; Askoxylakis, V.; Datta, M.; Fukumura, D.; Jain, R.K.; Bawendi, M.G.; et al. Shortwave infrared fluorescence imaging with the clinically approved near-infrared dye indocyanine green. Proc. Natl. Acad. Sci. USA 2018, 115, 4465–4470. [Google Scholar] [CrossRef] [Green Version]


Publisher’s Note: MDPI stays neutral with regard to jurisdictional claims in published maps and institutional affiliations. |
© 2022 by the authors. Licensee MDPI, Basel, Switzerland. This article is an open access article distributed under the terms and conditions of the Creative Commons Attribution (CC BY) license (https://creativecommons.org/licenses/by/4.0/).
Share and Cite
Huang, C.; Huang, W.; Zhang, L.; Zhang, C.; Zhou, C.; Wei, W.; Li, Y.; Zhou, Q.; Chen, W.; Tang, Y. Targeting Peptide, Fluorescent Reagent Modified Magnetic Liposomes Coated with Rapamycin Target Early Atherosclerotic Plaque and Therapy. Pharmaceutics 2022, 14, 1083. https://doi.org/10.3390/pharmaceutics14051083
Huang C, Huang W, Zhang L, Zhang C, Zhou C, Wei W, Li Y, Zhou Q, Chen W, Tang Y. Targeting Peptide, Fluorescent Reagent Modified Magnetic Liposomes Coated with Rapamycin Target Early Atherosclerotic Plaque and Therapy. Pharmaceutics. 2022; 14(5):1083. https://doi.org/10.3390/pharmaceutics14051083
Chicago/Turabian StyleHuang, Chen, Wentao Huang, Lifen Zhang, Chunyu Zhang, Chengqian Zhou, Wei Wei, Yongsheng Li, Quan Zhou, Wenli Chen, and Yukuan Tang. 2022. "Targeting Peptide, Fluorescent Reagent Modified Magnetic Liposomes Coated with Rapamycin Target Early Atherosclerotic Plaque and Therapy" Pharmaceutics 14, no. 5: 1083. https://doi.org/10.3390/pharmaceutics14051083
APA StyleHuang, C., Huang, W., Zhang, L., Zhang, C., Zhou, C., Wei, W., Li, Y., Zhou, Q., Chen, W., & Tang, Y. (2022). Targeting Peptide, Fluorescent Reagent Modified Magnetic Liposomes Coated with Rapamycin Target Early Atherosclerotic Plaque and Therapy. Pharmaceutics, 14(5), 1083. https://doi.org/10.3390/pharmaceutics14051083