
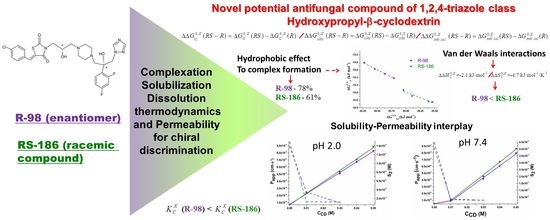
Chiral Recognition R- and RS- of New Antifungal: Complexation/Solubilization/Dissolution Thermodynamics and Permeability Assay


Abstract
:
1. Introduction
2. Materials and Methods
2.1. Materials
2.2. Methods
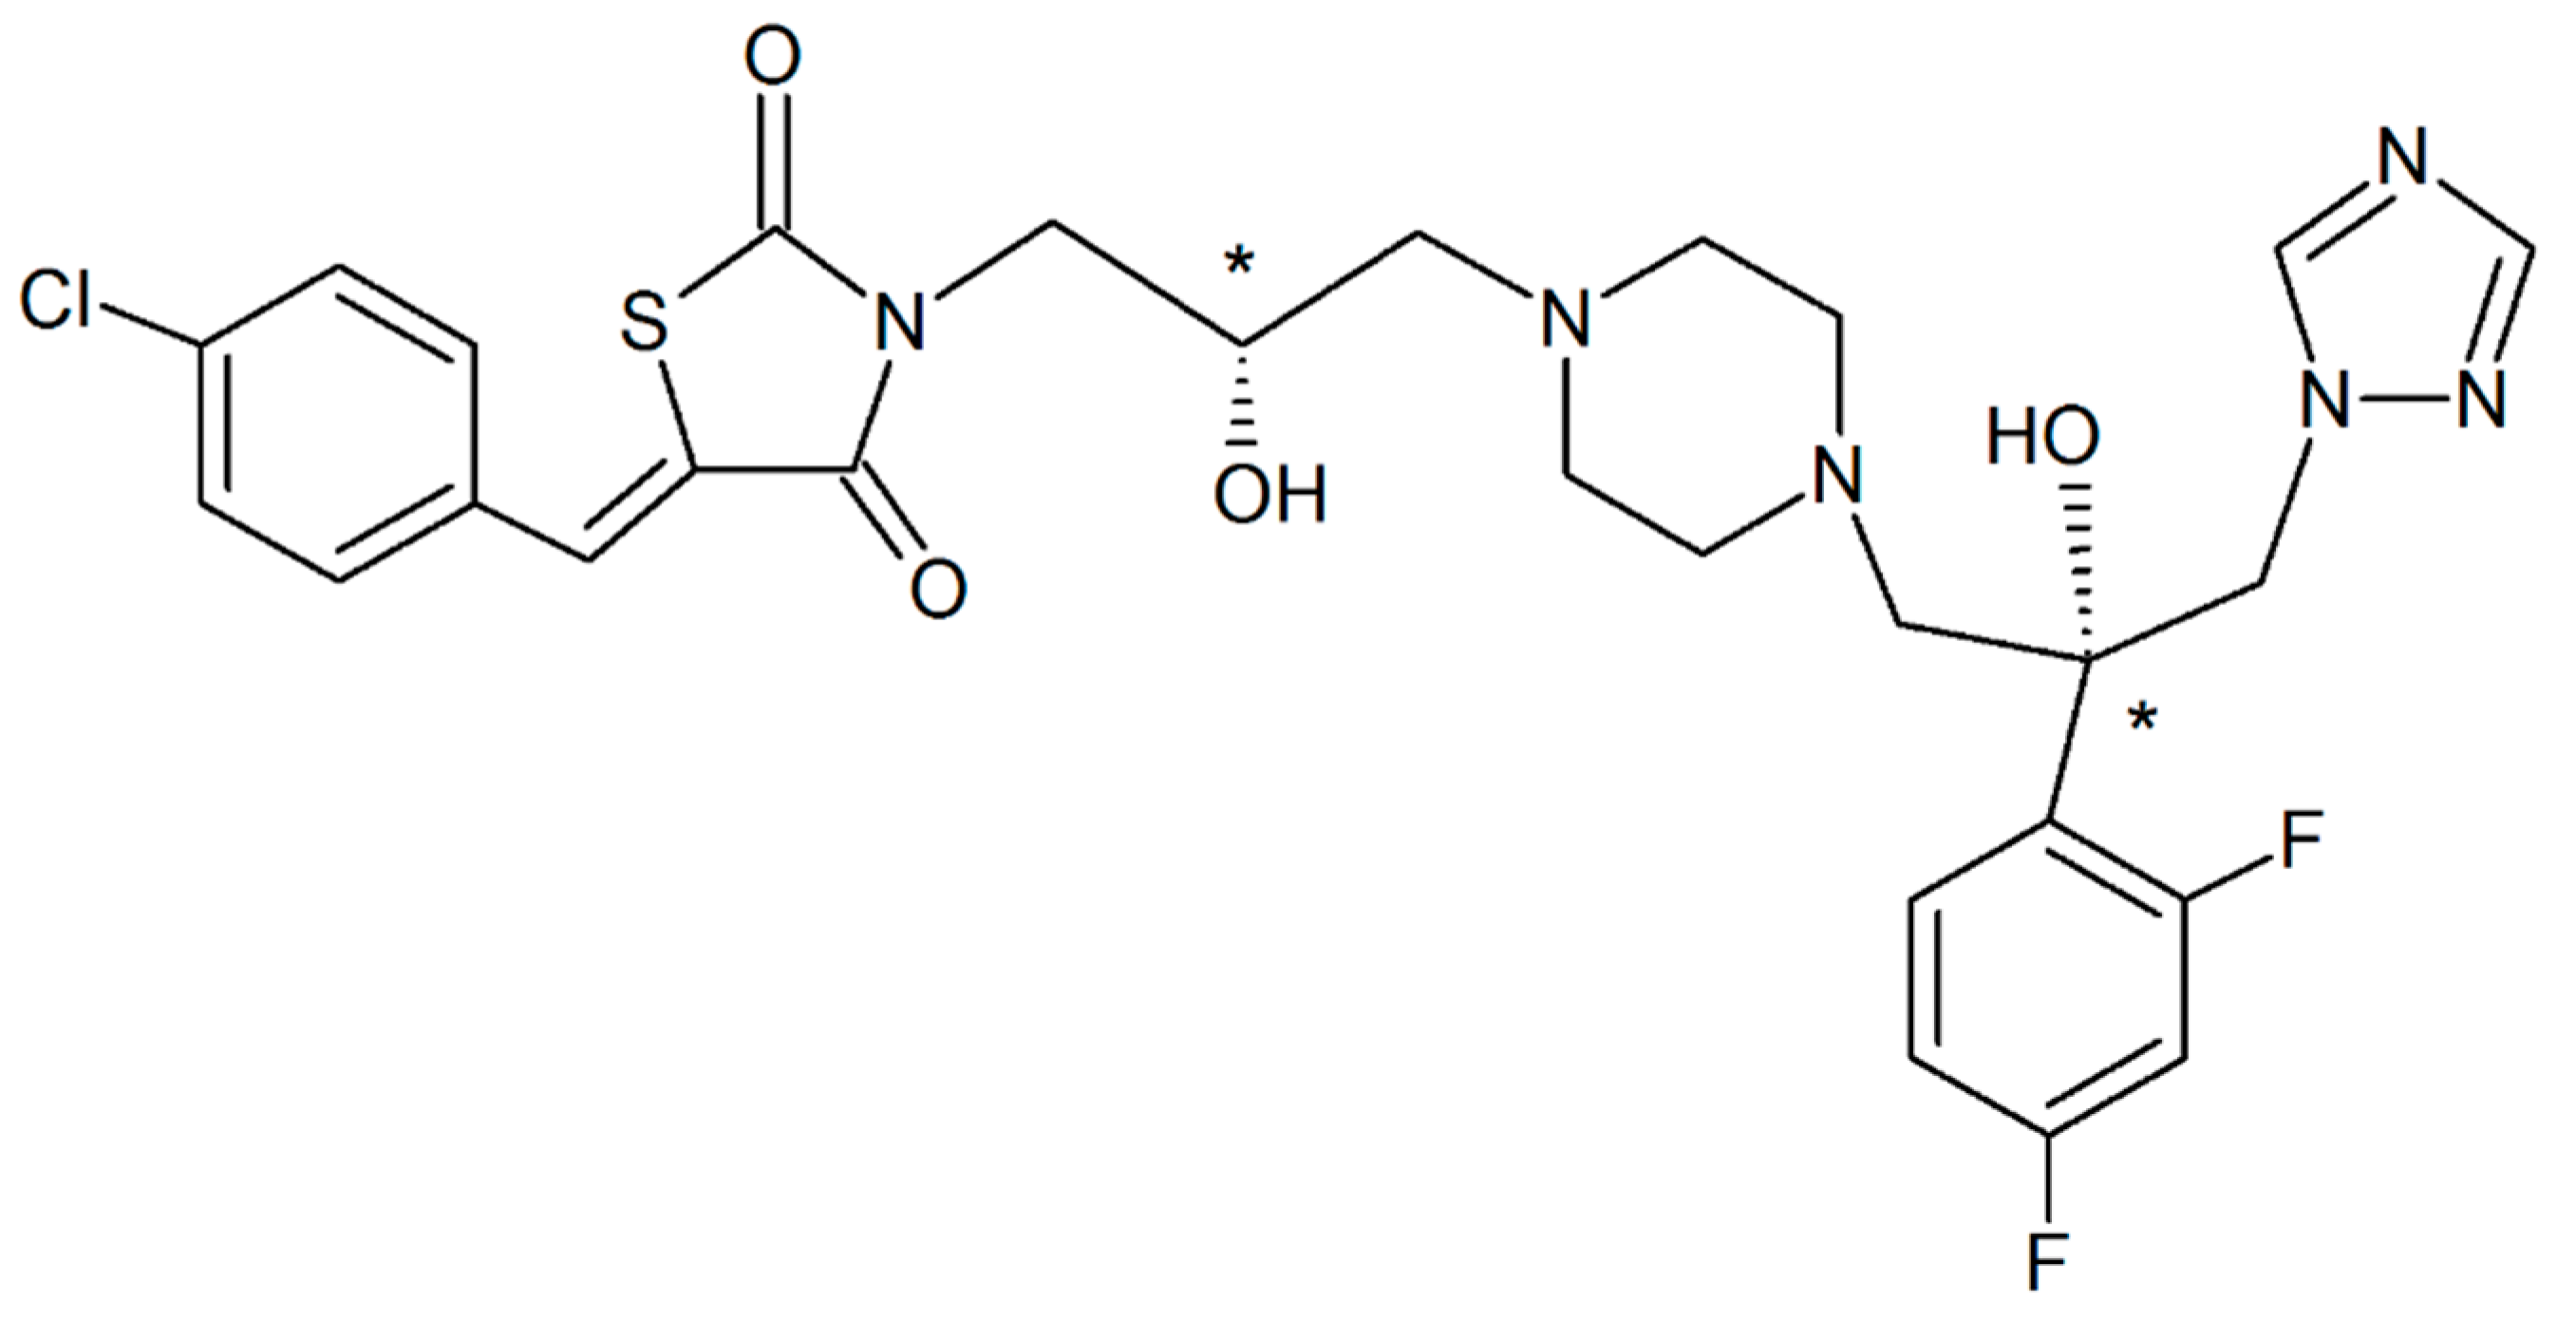
2.2.1. Synthesis
2.2.2. Powder X-ray Diffraction (PXRD)
2.2.3. UV-Vis Spectrophotometry
2.2.4. Phase Solubility Studies
2.2.5. Complexation Parameters Determination
2.2.6. In Vitro Permeability Assay
3. Theoretical Section
4. Results
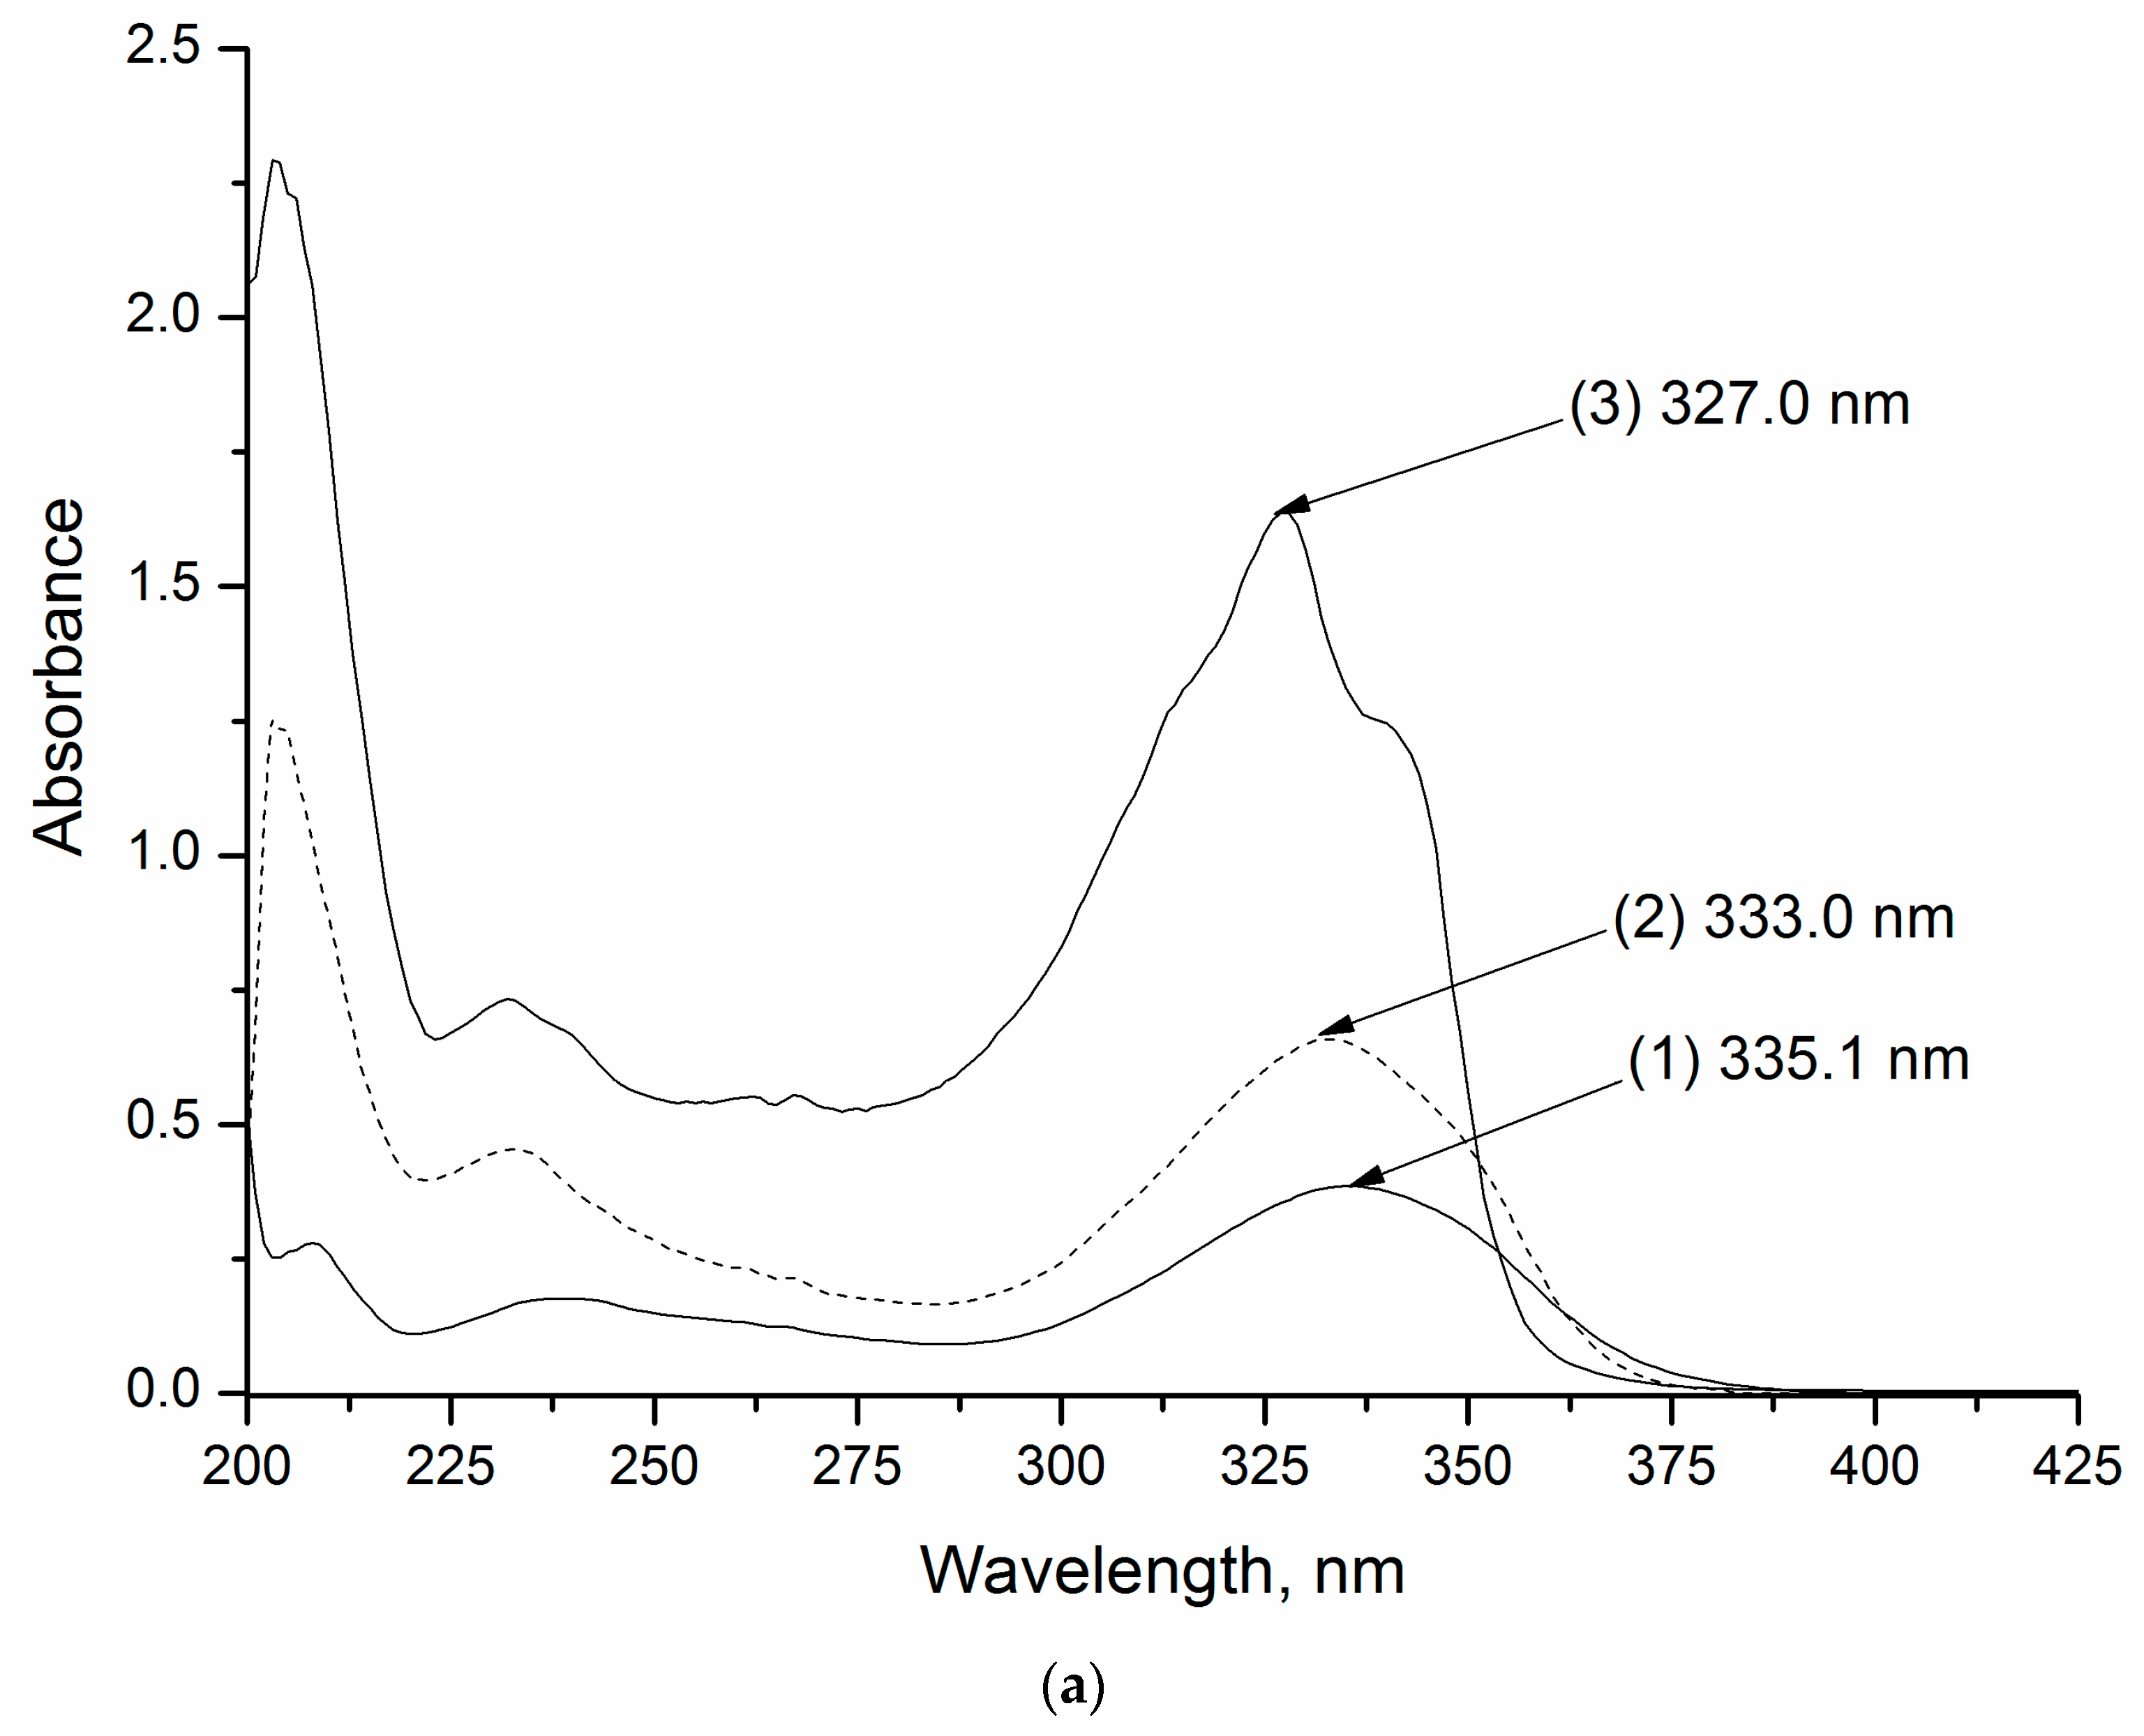
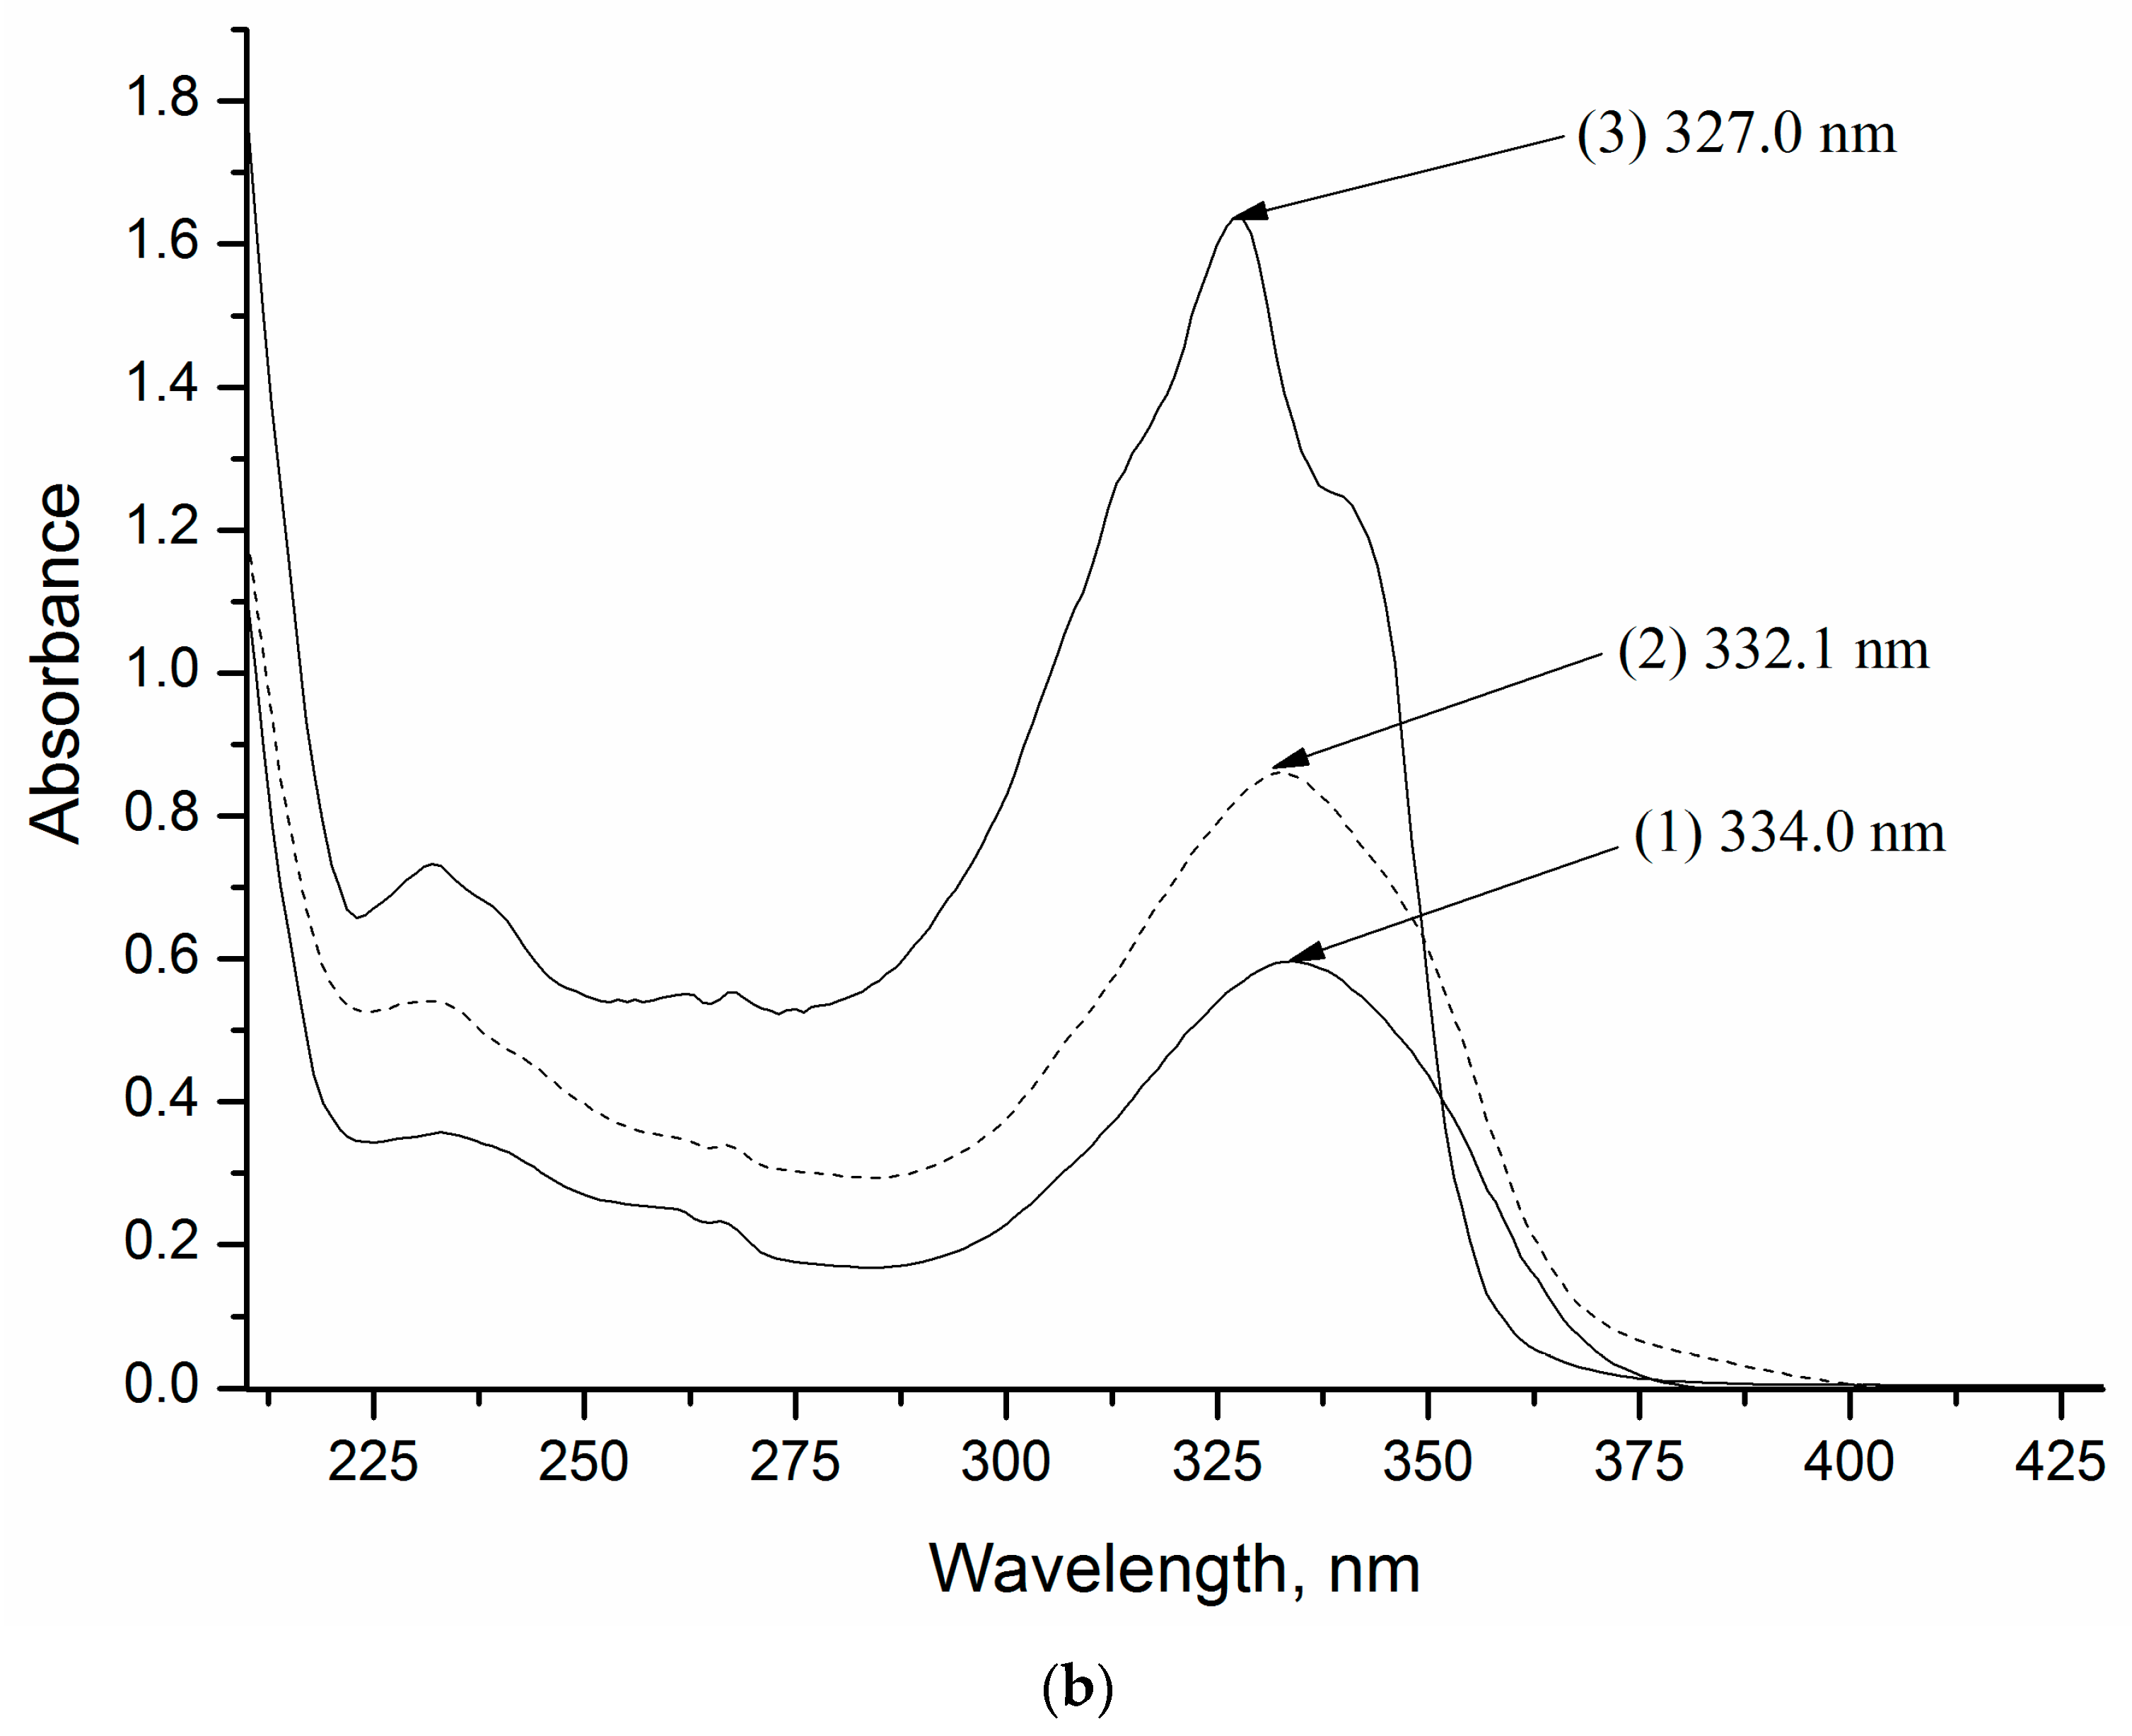
4.1. UV–Vis Spectroscopy
4.2. Solubility Studies
4.3. Stability of R-98/RS-186 Complexes with HP-β-Cyclodextrin in pH 2.0 Buffer Solution
4.4. Complexation Efficiency of 2-HP-β-CD towards R-98/RS-186, Effect of pH
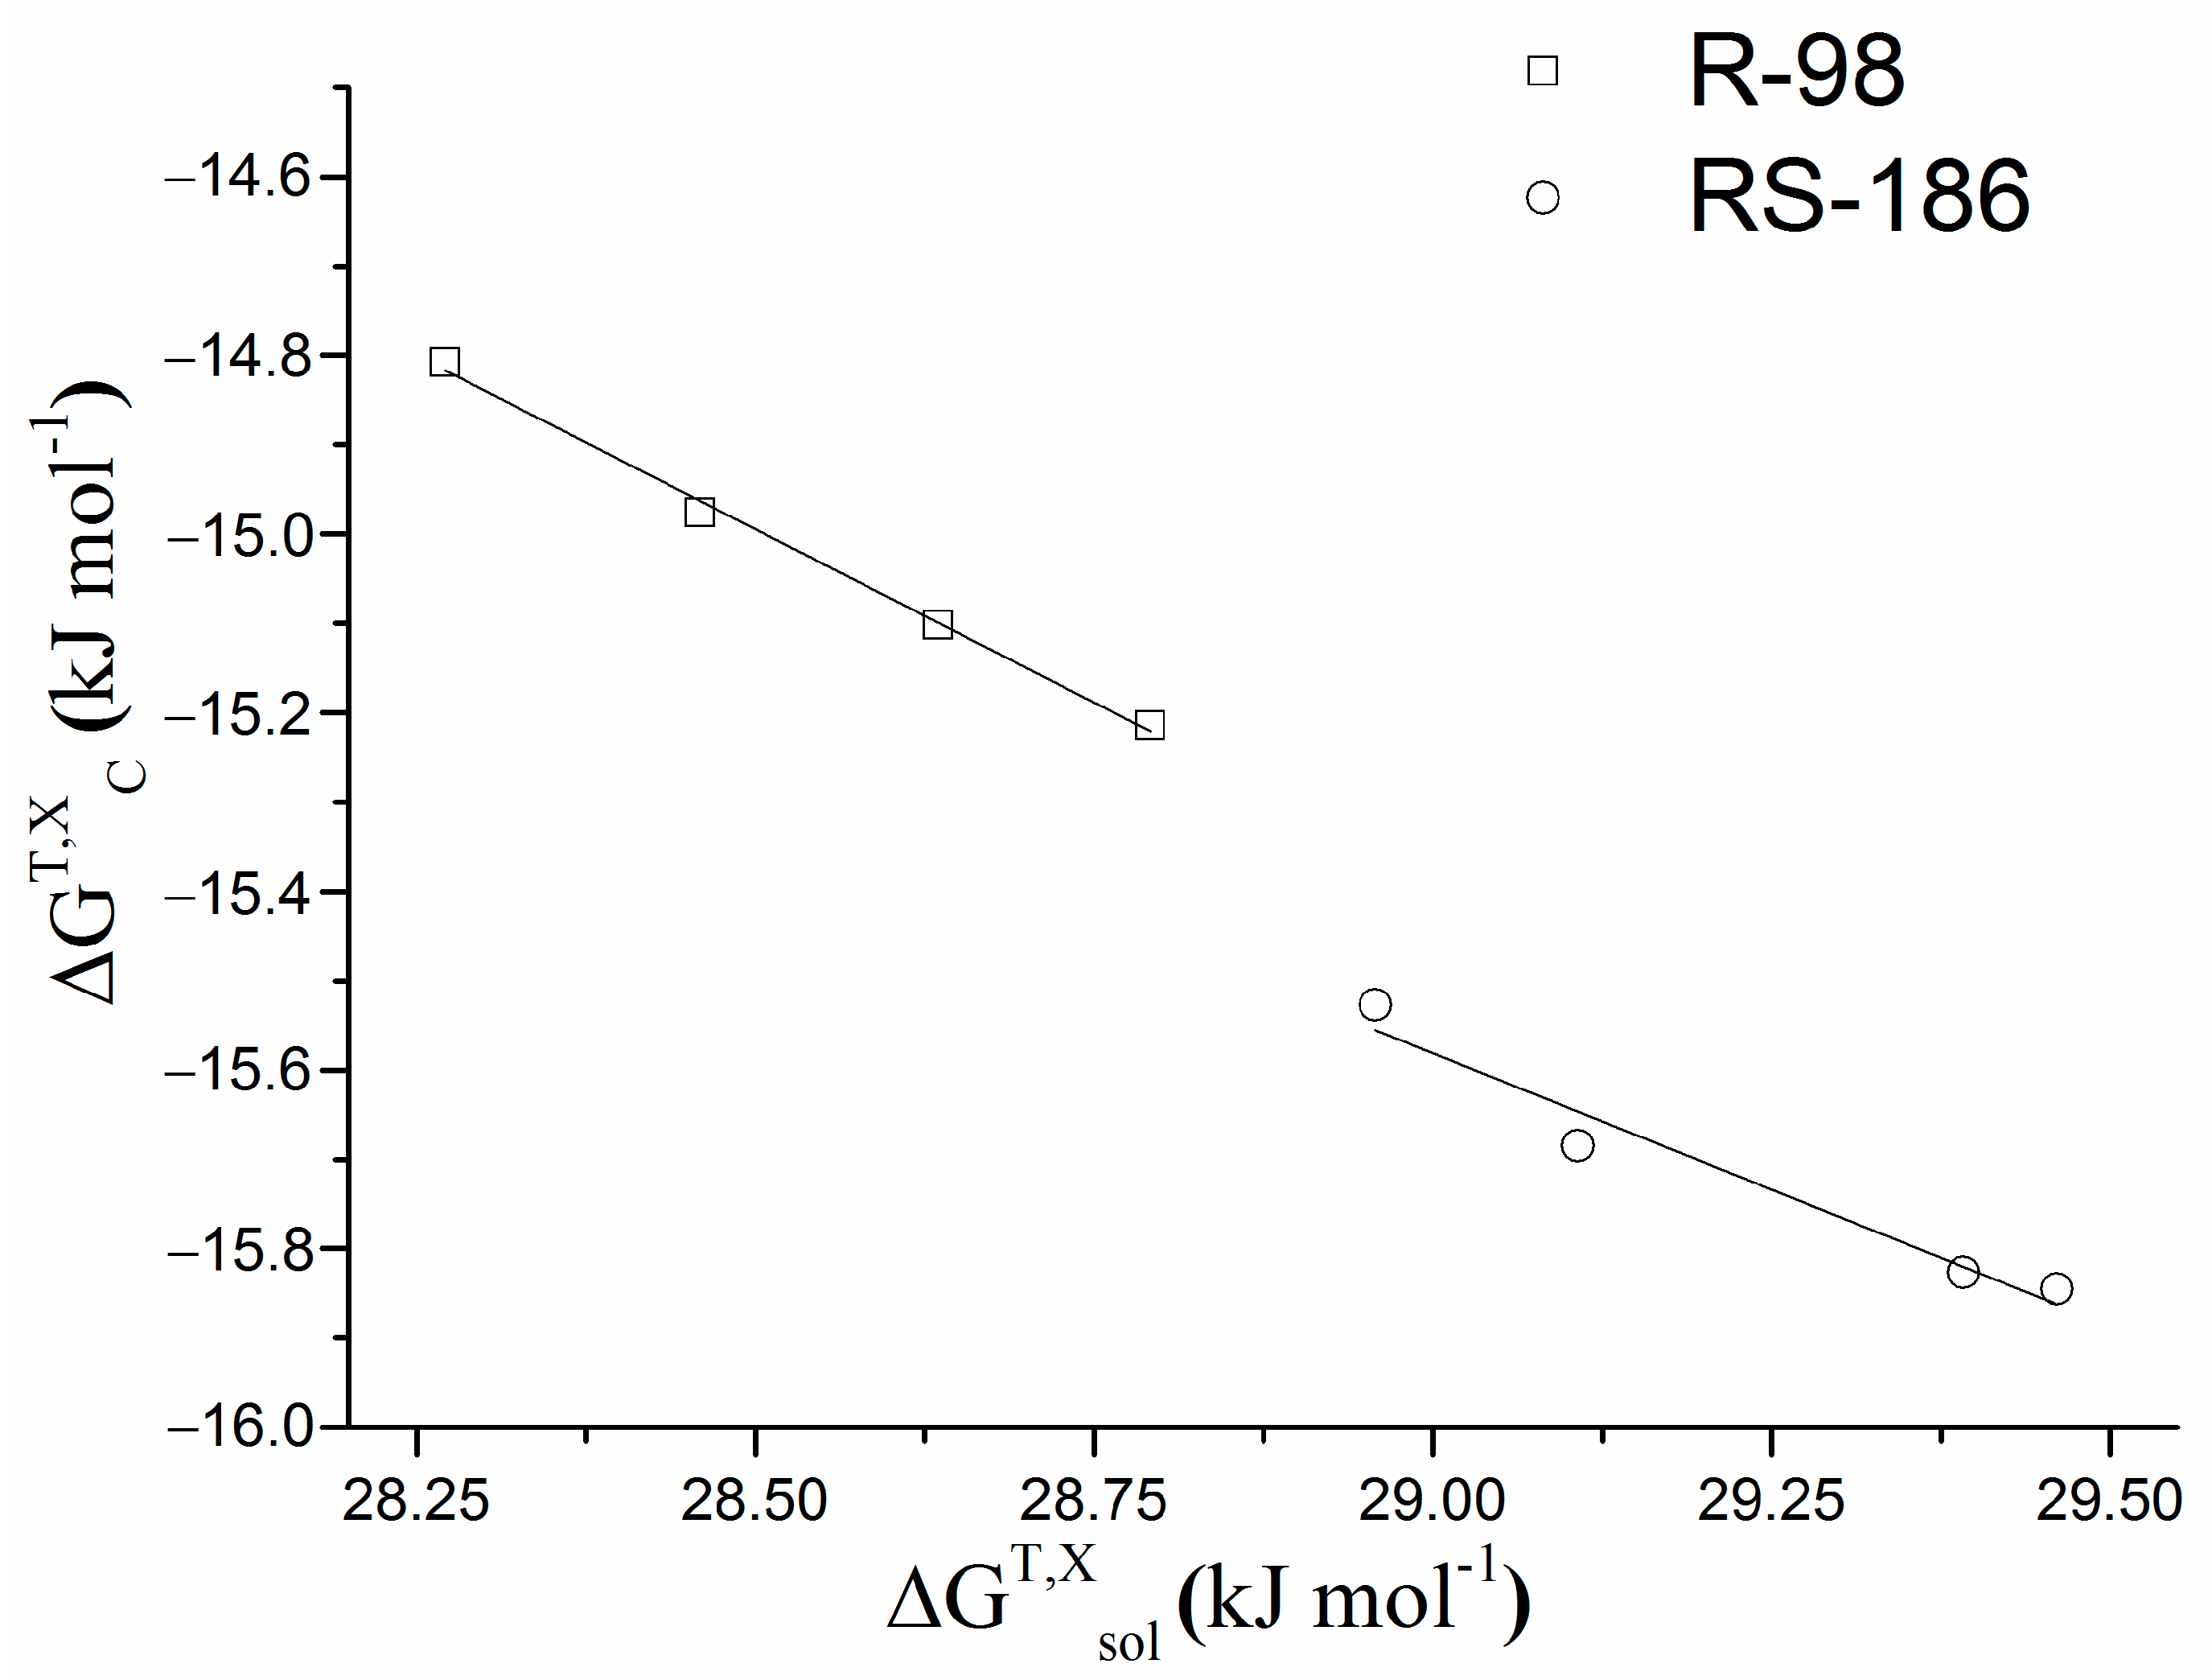
4.5. Thermodynamics of Complexation, Solubilization and Inherent Dissolution Processes for Chiral Discrimination
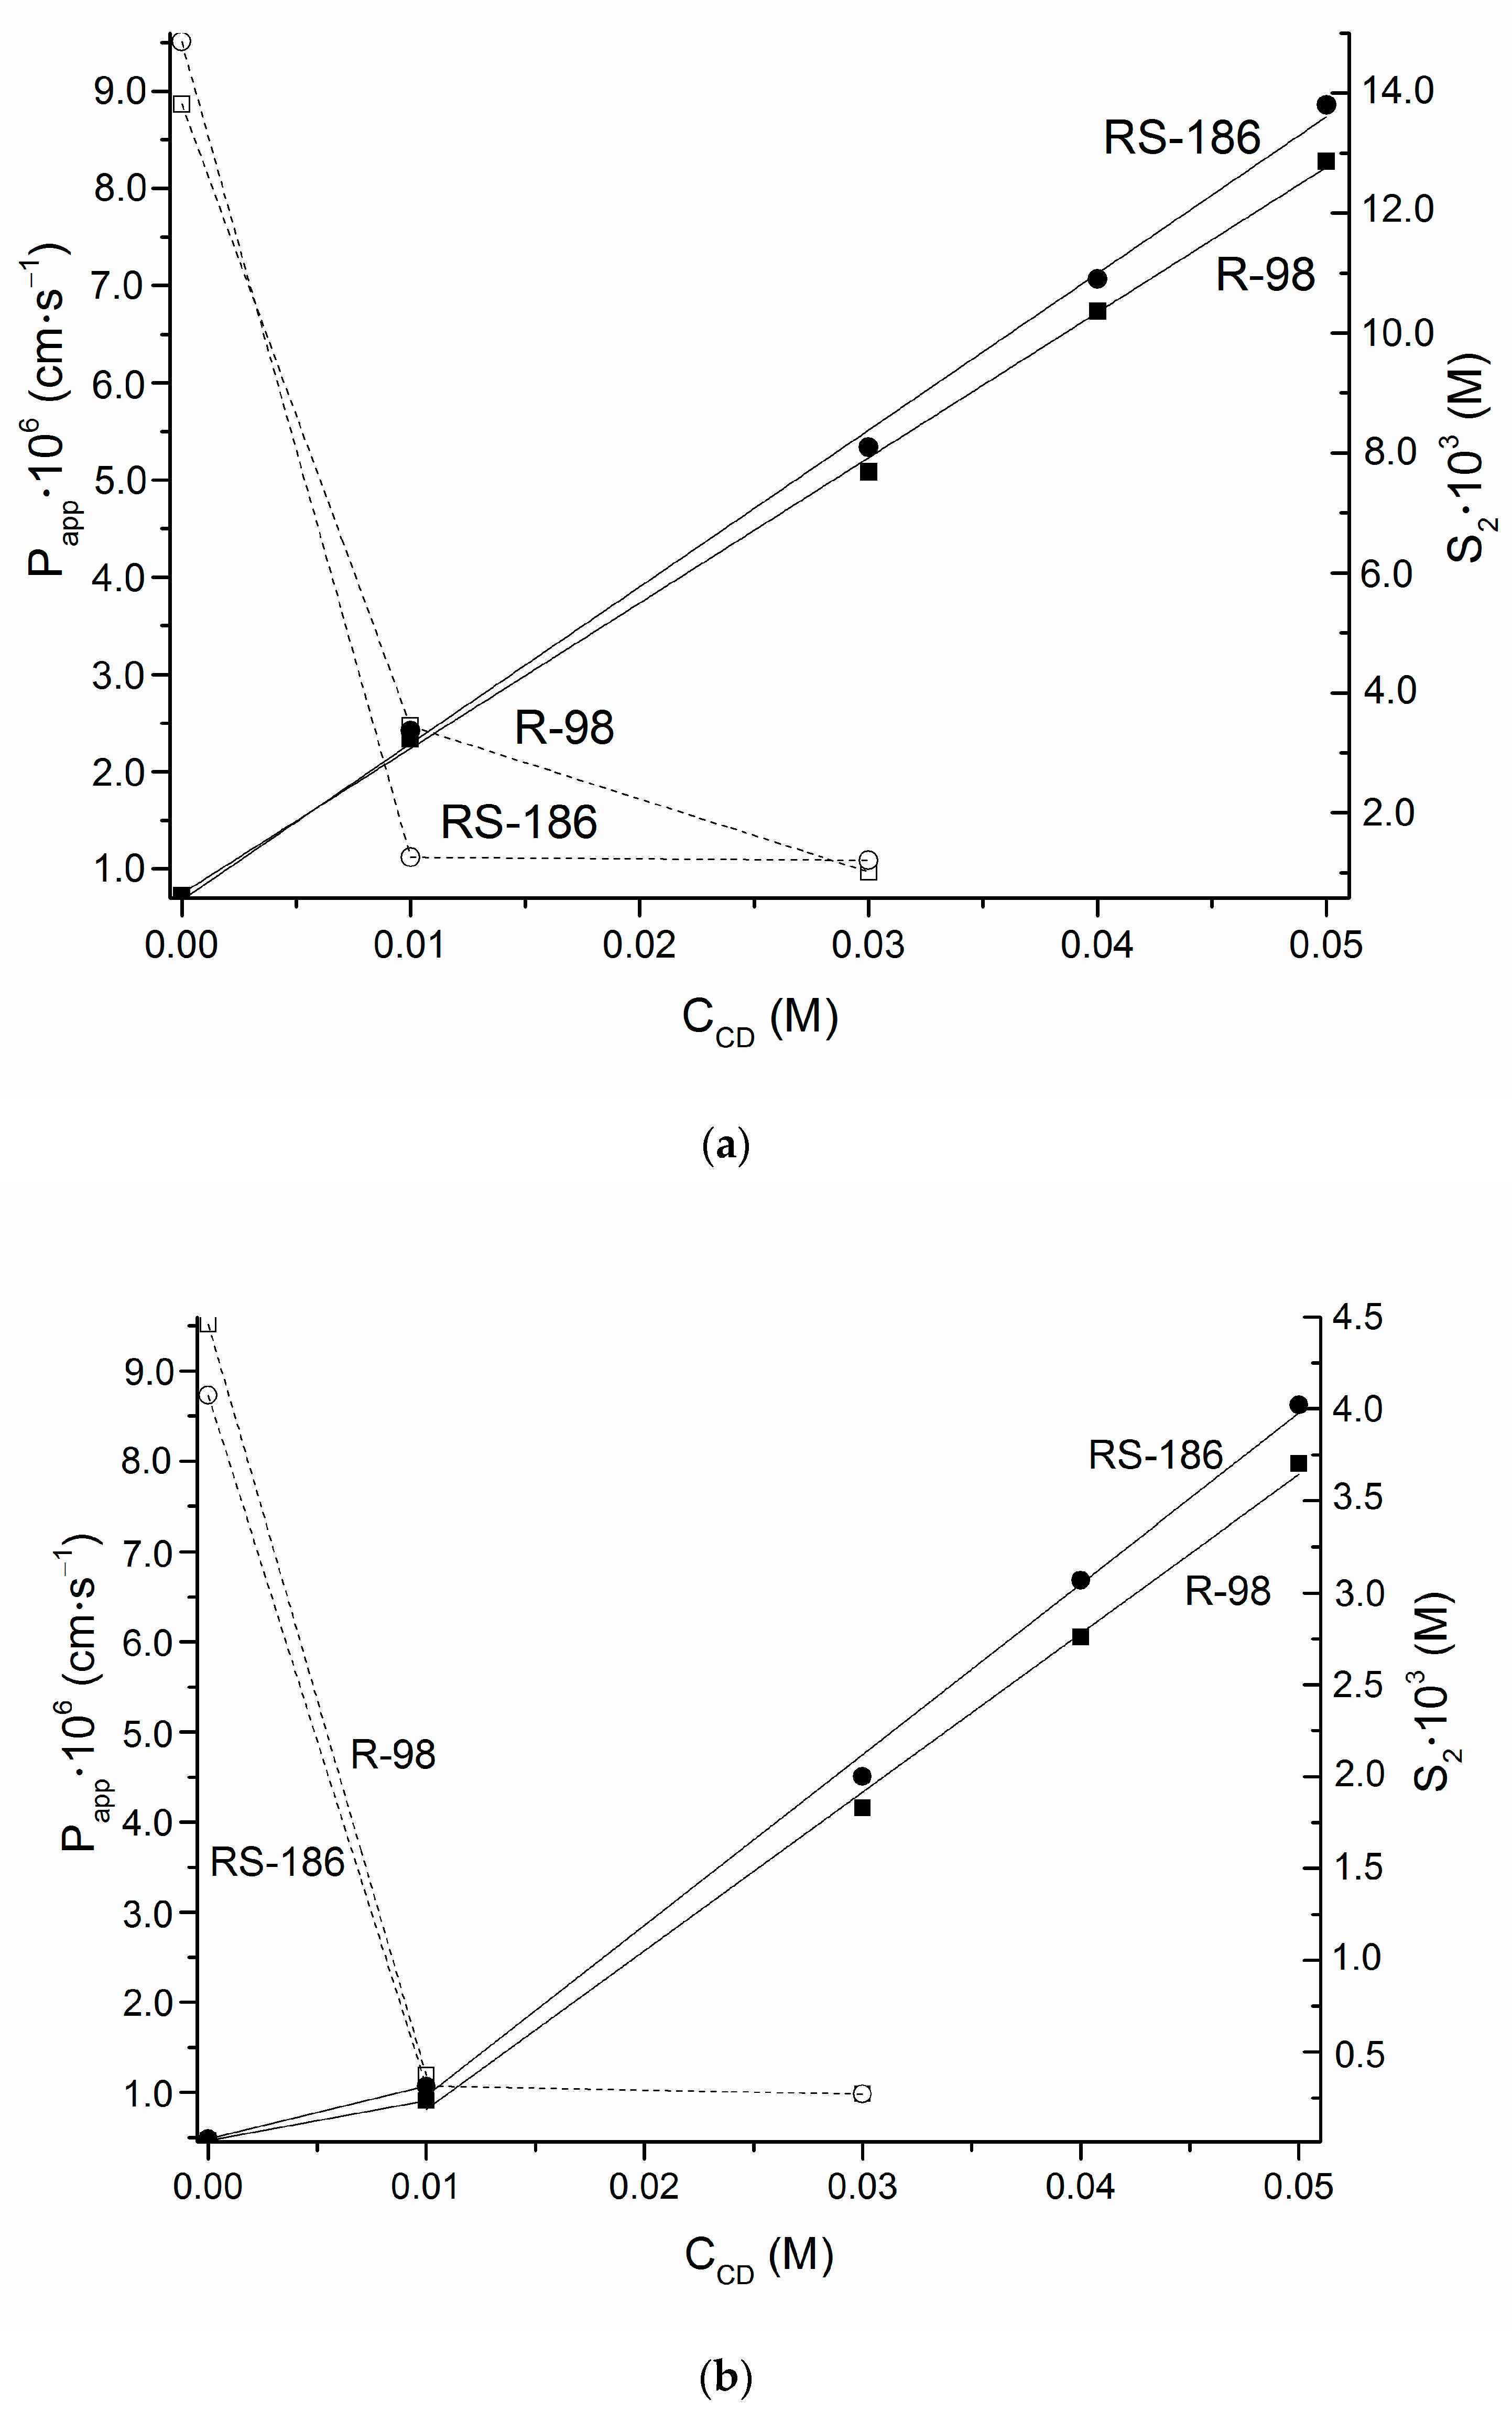
4.6. Enantioselective Membrane Permeability through the PermeaPad Barrier
5. Conclusions
Supplementary Materials
Author Contributions
Funding
Institutional Review Board Statement
Informed Consent Statement
Data Availability Statement
Acknowledgments
Conflicts of Interest
References
- Tucker, G.T.; Lennard, M.W. Enantiomer specific pharmacokinetics. Pharmacol. Ther. 1990, 45, 309–329. [Google Scholar] [CrossRef]
- Francotte, E.; Lindner, W. Chirality in Drug Research; Wiley-VCH: Weinheim, Germany, 2006. [Google Scholar]
- Maier, N.M.; Franco, P.; Lindner, W. Separation of enantiomers: Needs, challenges, perspectives. J. Chromatogr. A 2001, 906, 3–33. [Google Scholar] [CrossRef]
- Roy, S.D.; Chatterjee, D.J.; Manoukian, E.; Divo, A. Permeability of pure enantiomers of ketorolac through human cadaver skin. J. Pharm. Sci. 1995, 84, 987–990. [Google Scholar] [CrossRef]
- Tian, Y.; He, Y.; Hu, H.; Wang, L.; Zeng, S. Determination of the enantioselectivity of six chiral aryloxy aminopropanol drugs transport across Caco-2 cell monolayers. Acta Pharm. Sin. B 2012, 2, 168–173. [Google Scholar] [CrossRef] [Green Version]
- Salgado, A.; Chankvetadze, B. Applications of nuclear magnetic resonance spectroscopy for the understanding of enantiomer separation mechanisms in capillary electrophoresis. J. Chromatogr. A 2016, 1467, 95–144. [Google Scholar] [CrossRef]
- Trozanowicz, M. Enantioselective electrochemical sensors and biosensors: A mini-Review. Electrochem. Commun. 2014, 38, 47–52. [Google Scholar] [CrossRef]
- Schurig, V. Separation of enantiomers by gas chromatography. J. Chromatogr. A 2001, 906, 275–299. [Google Scholar] [CrossRef]
- Del Valle, E.M.M. Cyclodextrins and their uses: A review. Process. Biochem. 2004, 39, 1033–1046. [Google Scholar] [CrossRef]
- Chatziefthimiou, S.D.; Inclán, M.; Giastas, P.A.; Papakyriakou, K.; Yannakopoulou, K.; Mavridis, I.M. Molecular recognition of N-acetyltryptophan enantiomers by β-cyclodextrin. Beilstein J. Org. Chem. 2017, 13, 1572–1582. [Google Scholar] [CrossRef] [Green Version]
- Liu, W.; Zhang, Y.; Zhao, B. Structural studies for specific binding capacity of β-cyclodextrin with ibuprofen. J. Chin. Chem. Soc. 2012, 59, 1155–1158. [Google Scholar] [CrossRef]
- Rekharsky, M.; Inoue, Y. Chiral recognition thermodynamics of β-cyclodextrin: The thermodynamic origin of enantioselectivity and the enthalpy-entropy compensation effect. J. Am. Chem. Soc. 2000, 122, 4418–4435. [Google Scholar] [CrossRef]
- Li, W.; Zhao, L.; Zhang, H.; Chen, X.; Chen, S.; Zhu, Z.; Hong, Z. Enantioseparation of new triadimenol antifungal active compounds by electrokinetic chromatography and molecular modeling study of chiral recognition mechanisms. Electrophoresis 2014, 35, 2855–2862. [Google Scholar] [CrossRef]
- Wearley, L.; Antonacci, B.; Cacciapuoti, A.; Assenza, S.; Chaudry, I.; Eckhart, C.D.; Loebenberg, C.; Norris, R.; Parmegiani, J.; Sequeira, J.; et al. Relationship among physicochemical properties, skin permeability, and topical activity of the racemic compound and pure enantiomers of a new antifungal. Pharm. Res. 1993, 10, 136–140. [Google Scholar] [CrossRef]
- Higuchi, T.; Connors, K. Phase-solubility techniques. Adv. Anal. Chem. Instrum. 1965, 4, 117–212. [Google Scholar]
- Loftsson, T.; Hreinsdottir, D.; Masson, M. The complexation efficiency. J. Incl. Phenom. Macrocycl. Chem. 2007, 57, 545–552. [Google Scholar] [CrossRef]
- di Cagno, M.; Bauer-Brandl, A. Assay for Drug Permeability with Adjustable Biomimetic Properties. Danish Patent WO/2016/078667, 26 May 2016. [Google Scholar]
- di Cagno, M.; Bibi, H.A.; Bauer-Brandl, A. New biomimetic barrier Permeapad™ for efficient investigation of passive permeability of drugs. Eur. J. Pharm. Sci. 2015, 73, 29–34. [Google Scholar] [CrossRef]
- Volkova, T.V.; Perlovich, G.L. Comparative analysis of solubilization and complexation characteristics for new antifungal compound with cyclodextrins, Impact of cyclodextrins on distribution process. Eur. J. Pharm. Sci. 2020, 154, 105531. [Google Scholar] [CrossRef]
- Al Omari, M.M.; El-Barghouthi, M.I.; Zughul, M.B.; Davies, J.E.D.; Badwan, A.A. The role of drug hydrophobicity in β-cyclodextrin complexes. J. Mol. Liq. 2010, 155, 103–108. [Google Scholar] [CrossRef]
- Yonemochi, E.; Yoshihashi, Y.; Terada, K. Quantitative relationship between solubility, initial dissolution rate and heat of solution of chiral drugs. Pharm. Res. 2000, 17, 90–93. [Google Scholar] [CrossRef]
- Misiuk, W. Investigation of inclusion complex of HP-γ-cyclodextrin with ceftazidime. J. Mol. Liq. 2016, 224, 387–392. [Google Scholar] [CrossRef]
- Prema Rumari, J.; Allen Gnana Rai, G. Photophysical behaviour of p-dihydroxy benzenein different solvents, pH and α-cyclodextrin. Asian J. Chem. 2010, 22, 5057–5066. [Google Scholar]
- Friedel, R.A.; Orchin, M. Ultraviolet Spectra of Aromatic Compounds; Wiley: New York, NY, USA, 1951. [Google Scholar]
- Ghosh, S.; Mitra, A.K.; Pal, U.; Basu, S.; Saha, C. Evidence of two structurally related solvatochromic probes complexed with β-cyclodextrin by using spectroscopic methods. J. Mol. Struct. 2017, 1130, 810–817. [Google Scholar] [CrossRef]
- Volkova, T.V.; Levshin, I.B.; Perlovich, G.L. New antifungal compound: Solubility thermodynamics and partitioning processes in biologically relevant solvents. J. Mol. Liq. 2020, 310, 113148. [Google Scholar] [CrossRef]
- Anjana, M.N.; Joseph, J.; Nair, S.C. Solubility enhancement methods-a promising technology for poorly water soluble drugs. Int. J. Pharm. Sci. Rev. Res. 2013, 20, 127–134. [Google Scholar]
- El-Arini, S.K.; Giron, D.; Leuenberger, H. Solubility properties of racemic praziquantel and its enantiomers. Pharm. Dev. Technol. 1998, 3, 557–564. [Google Scholar] [CrossRef]
- Nerurkar, J.; Beach, J.W. Solubility of (±)-ibuprofen and S (+)-ibuprofen in the presence of cosolvents and cyclodextrins. Pharm. Dev. Technol. 2005, 10, 413–421. [Google Scholar] [CrossRef]
- Burger, A.; Koller, K.; Schiermeier, W.M. RS-ibuprofen and S-ibuprofen (dexibuprofen): Binary system and unusual solubility behavior. Eur. J. Pharm. Biopharm. 1996, 42, 142–147. [Google Scholar]
- Peters, J.; Neeskens, P.; Adriaensen, J.; Brewster, M. Alfaxalone: Effect of temperature on complexation with 2-hydroxypropyl-β-cyclodextrin. J. Incl. Phenom. Macrocycl. Chem. 2002, 44, 75–77. [Google Scholar] [CrossRef]
- Tommasini, S.; Raneri, D.; Ficarra, R.; Calabrò, M.L.; Stancanelli, R.; Ficarra, P. Improvement in solubility and dissolution rate of flavonoids by complexation with β-cyclodextrin. J. Pharm. Biomed. Anal. 2004, 35, 379–387. [Google Scholar] [CrossRef]
- Domańska, U.; Pelczarska, A.; Pobudkowska, A. Effect of 2-hydroxypropyl-β-cyclodextrin on solubility of sparingly soluble drug derivatives of anthranilic acid. Int. J. Mol. Sci. 2011, 12, 2383–2394. [Google Scholar] [CrossRef] [Green Version]
- Loftsson, T.; Hreinsdottir, D.; Masson, M. Evaluation of cyclodextrin solubilization of drugs. Int. J. Pharm. 2005, 302, 18–28. [Google Scholar] [CrossRef] [PubMed]
- Fernández-Ferreiro, A.; Fernández Bargiela, N.; Varela, M.S.; Martínez, M.G.; Pardo, M.; Ces, A.P.; Méndez, J.; Barcia, M.G.; Lamas, M.J.; Otero-Espinar, F. Cyclodextrin-polysaccharide-based, in situ-gelled system for ocular antifungal delivery. Beilstein J. Org. Chem. 2014, 10, 2903–2911. [Google Scholar] [CrossRef] [PubMed] [Green Version]
- Loftsson, T.; Másson, M.; Brewster, M.E. Self-association of cyclodextrins and cyclodextrin complexes. J. Pharm. Sci. 2004, 93, 1091–1099. [Google Scholar] [CrossRef] [PubMed]
- Okimoto, K.; Rajewski, R.A.; Uekama, K.; Jona, J.A.; Stella, V.J. The interaction of charged and uncharged drugs with neutral (2-HP-β-CD) and anionically charged (SBE7-β-CD) β-cyclodextrins. Pharm. Res. 1996, 13, 256–264. [Google Scholar] [CrossRef]
- Siafaka, P.I.; Okur, N.Ü.; Mone, M.; Giannakopoulou, S.; Er, S.; Pavlidou, E.; Karavas, E.; Bikiaris, D.N. Two different approaches for oral administration of voriconazole loaded formulations: Electrospun fibers versus β-cyclodextrin complexes. Int. J. Mol. Sci. 2016, 17, 282. [Google Scholar] [CrossRef]
- Szejtli, J. Cyclodextrin Technology; Boudeville, D.P., Ed.; Kluwer Academic Publishers: Norwell, MA, USA, 1988. [Google Scholar]
- Ventura, C.A.; Giannone, I.; Paolino, D.; Pistarà, V.; Corsaro, A.; Puglisi, G. Preparation of celecoxib-dimethyl-β-cyclodextrin inclusion complex: Characterization and in vitro permeation study. Eur. J. Med. Chem. 2005, 40, 624–631. [Google Scholar] [CrossRef]
- Roik, N.V.; Belyakova, L.A. Thermodynamic, IR spectral and X-ray diffraction studies of the “β-cyclodextrin-para-aminobenzoic acid” inclusion complex. J. Incl. Phenom. Macrocycl. Chem. 2010, 69, 315–319. [Google Scholar] [CrossRef]
- Rekharsky, M.V.; Innoue, Y. Complexation and chiral recognition thermodynamics of 6-amino-6-deoxy-beta-cyclodextrin with anionic, cationic, and neutral chiral guests: Counterbalance between van der Waals and Coulombic interactions. J. Am. Chem. Soc. 2002, 124, 813–826. [Google Scholar] [CrossRef]
- Brewster, M.E.; Loftsson, T. Cyclodextrins as pharmaceutical solubilizers. Adv. Drug Deliv. Rev. 2007, 59, 645–666. [Google Scholar] [CrossRef]
- Tabushi, I.; Kiyosuke, Y.; Sugimoto, T.; Yamamura, K. Approach to the aspects of driving force of inclusion by alpha-cyclodextrin. J. Am. Chem. Soc. 1978, 100, 916–919. [Google Scholar] [CrossRef]
- Rekharsky, M.V.; Inoue, Y. Complexation thermodynamics of cyclodextrins. Chem. Rev. 1998, 98, 1875–1917. [Google Scholar] [CrossRef] [PubMed]
- Van der Jagt, D.L.; Killian, F.L.; Bender, M.L. Cycloamyloses as enzyme models. Effects of inclusion complex formation on intramolecular participation. J. Am. Chem. Soc. 1970, 92, 1016–1022. [Google Scholar] [CrossRef] [PubMed]
- Perlovich, G.L.; Skara, M.; Bauer-Brandl, A. Driving forces and the influence of the buffer composition on the complexation reaction between ibuprofen and HPβ-CD. Eur. J. Pharm. Sci. 2003, 20, 197–200. [Google Scholar] [CrossRef]
- Molineux, P.; Frank, H.P. The interaction of polyvinylpyrrolidone with aromatic compounds in aqueous solution. Part I. Thermodynamics of the binding equilibria and interaction forces. J. Am. Chem. Soc. 1961, 83, 3169–3174. [Google Scholar] [CrossRef]
- Lipkowitz, K.B.; Raghothama, S.; Yang, J. Enantioselective binding of tryptophan by α-cyclodextrin. J. Am. Chem. Soc. 1992, 114, 1554. [Google Scholar] [CrossRef]
- Komiyama, M.; Bender, M.L. Importance of apolar binding in complex formation of cyclodextrins with adamantanecarboxylate. J. Am. Chem. Soc. 1978, 100, 2259–2260. [Google Scholar] [CrossRef]
- Miller, J.M.; Dahan, A. Predicting the solubility-permeability interplay when using cyclodextrins in solubility-enabling formulations: Model validation. Int. J. Pharm. 2012, 430, 388–391. [Google Scholar] [CrossRef]
- Volkova, T.V.; Simonova, O.R.; Levshin, I.B.; Perlovich, G.L. Physicochemical profile of new antifungal compound: pH-dependent solubility, distribution, permeability and ionization assay. J. Mol. Liq. 2021, 336, 116535. [Google Scholar] [CrossRef]
- Volkova, T.V.; Simonova, O.R.; Perlovich, G.L. Thiazolidine-2,4-dione derivative in 2-hydroxypropyl-β-cyclodextrin solutions: Complexation/solubilization, distribution and permeability. J. Mol. Liq. 2021, 333, 115931. [Google Scholar] [CrossRef]
- Avdeef, A.; Nielsen, P.E.; Tsinman, O. PAMPA—A drug absorption in vitro model: 11. Matching the in vivo unstirred water layer thickness by individual-well stirring in microtitre plates. Eur. J. Pharm. Sci. 2004, 22, 365–374. [Google Scholar] [CrossRef]
- Curatolo, W. Physical chemical properties of oral drug candidates in the discovery and exploratory development settings. Pharmaceut. Sci. Technol. Today 1998, 1, 387–393. [Google Scholar] [CrossRef]
- Lin, X.; Skolnik, S.; Chen, X.; Wang, J. Attenuation of intestinal absorption by major efflux transporters: Quantitative tools and strategies using a Caco-2 model. Drug Metab. Dispos. 2010, 39, 265–274. [Google Scholar] [CrossRef] [PubMed] [Green Version]
- Yee, S. In vitro permeability across Caco-2 cells (colonic) can predict in vivo (small intestinal) absorption in man-fact or myth. Pharm. Res. 1997, 14, 763–766. [Google Scholar] [CrossRef] [PubMed]
- Manning, T.J.; Wilkerson, K.; Holder, T.; Bartley, A.C.; Jackson, C.; Plummer, S.; Phillips, D.; Krajewski, L.; Wylie, G. Pharmacokinetic studies of a three-component complex that repurposes the front line antibiotic isoniazid against Mycobacterium tuberculosis. Tuberculosis 2017, 107, 149–155. [Google Scholar] [CrossRef] [PubMed]


M | pH 2.0 | pH 7.4 | ||||||
|---|---|---|---|---|---|---|---|---|
| 298.15 K | 303.15 K | 310.15 K | 313.15 K | 298.15 K | 303.15 K | 310.15 K | 313.15 K | |
| R-98 | ||||||||
| 0 | 0.62 ± 0.01 | 0.69 ± 0.02 | 0.83 ± 0.03 | 0.87 ± 0.03 | 0.18 ± 0.01 | 0.21 ± 0.01 | 0.25 ± 0.01 | 0.27 ± 0.01 |
| 0.01 | 3.23 ± 0.10 | 3.59 ± 0.11 | 4.12 ± 0.12 | 4.20 ± 0.11 | 2.35 ± 0.03 | 1.79 ± 0.04 | 1.42 ± 0.04 | 0.58 ± 0.02 |
| 0.03 | 7.68 ± 0.11 | 8.21 ± 0.21 | 8.86 ± 0.23 | 9.49 ± 0.25 | 18.30 ± 0.41 | 9.65 ± 0.28 | 4.43 ± 0.12 | 1.86 ± 0.04 |
| 0.04 | 10.36 ± 0.23 | 10.84 ± 0.30 | 12.50 ± 0.39 | 12.69 ± 0.41 | 27.60 ± 0.55 | 13.90 ± 0.41 | 6.07 ± 0.18 | 2.62 ± 0.07 |
| 0.05 | 12.86 ± 0.22 | 14.04 ± 0.41 | 15.72 ± 0.38 | 16.15 ± 0.44 | 37.00 ± 0.52 | 18.60 ± 0.33 | 8.08 ± 0.21 | 3.33 ± 0.08 |
| RS-186 | ||||||||
| 0 | 0.50 ± 0.01 | 0.54 ± 0.01 | 0.61 ± 0.02 | 0.69 ± 0.02 | 0.27 ± 0.01 | 0.30 ± 0.01 | 0.35 ± 0.01 | 0.37 ± 0.01 |
| 0.01 | 3.37 ± 0.08 | 3.40 ± 0.04 | 3.64 ± 0.04 | 3.97 ± 0.03 | 3.15 ± 0.02 | 2.74 ± 0.03 | 1.93 ± 0.03 | 1.37 ± 0.06 |
| 0.03 | 8.10 ± 0.22 | 8.37 ± 0.18 | 8.68 ± 0.19 | 9.30 ± 0.31 | 20.00 ± 0.32 | 10.60 ± 0.33 | 5.01 ± 0.05 | 2.50 ± 0.03 |
| 0.04 | 10.90 ± 0.31 | 11.20 ± 0.19 | 11.79 ± 0.33 | 12.90 ± 0.33 | 30.70 ± 0.51 | 15.60 ± 0.41 | 6.97 ± 0.08 | 3.20 ± 0.05 |
| 0.05 | 13.80 ± 0.40 | 14.20 ± 0.22 | 14.88 ± 0.24 | 15.90 ± 0.40 | 40.20 ± 0.58 | 20.10 ± 0.21 | 8.58 ± 0.08 | 3.65 ± 0.05 |
| T/K | CE/% | Molar Ratio (Drug:CD) | ||||
|---|---|---|---|---|---|---|
| pH 2.0 | pH 7.4 | pH 2.0 | pH 7.4 | pH 2.0 | pH 7.4 | |
| R-98 | ||||||
| 298.15 | 32.0 | 9.5 | 516.8 ± 51.1 | n.d. * | 1:4 | 1:11 |
| 303.15 | 35.5 | 4.4 | 506.6 ± 49.3 | n.d. | 1:4 | 1:24 |
| 310.15 | 40.7 | 1.7 | 493.6 ± 49.0 | n.d. | 1:3 | 1:60 |
| 313.15 | 42.7 | 0.7 | 486.9 ± 48.8 | n.d. | 1:3 | 1:145 |
| RS-186 | ||||||
| 298.15 | 35.4 | 10.3 | 708.9 ± 71.4 | n.d. | 1:4 | 1:10 |
| 303.15 | 36.9 | 4.6 | 688.0 ± 60.3 | n.d. | 1:4 | 1:23 |
| 310.15 | 39.1 | 1.7 | 646.7 ± 61.5 | n.d. | 1:3 | 1:59 |
| 313.15 | 43.2 | 0.6 | 623.6 ± 60.0 | n.d. | 1:3 | 1:171 |
kJ·mol−1 | kJ·mol−1 | kJ·mol−1 | kJ·mol−1 | kJ·mol−1 | kJ·mol−1 | kJ·mol−1 | kJ·mol−1 | kJ·mol−1 | |
|---|---|---|---|---|---|---|---|---|---|
| R-98 | |||||||||
| 392.9 ± 38.8 | −14.8 | −7.2 ± 0.8 | 7.6 ± 0.9 | −7.5 | 11.8 ± 0.1 | 19.3 ± 0.5 | 28.2 | 18.5 ± 0.8 | −9.7 ± 0.6 |
| RS-186 | |||||||||
| 525.2 ± 52.9 | −15.5 | −9.3 ± 1.3 | 6.2 ± 0.9 | −8.2 | 6.8 ± 1.5 | 15.0 ± 3.3 | 30.0 | 19.0 ± 2.2 | −11.0 ± 1.5 |
| Excess thermodynamic parameters | |||||||||
| b | e | e | c | e | e | d | e | e | |
| −0.7 | −2.1 | −1.4 | −0.7 | −5.0 | −4.3 | 1.8 | 0.5 | −1.3 | |
| CD Concentration/M | Donor Solution Concentration/M | Cumulative Amount Permeated/µM·cm−2 | / µM·cm−2·s−1 | |
|---|---|---|---|---|
| pH 2.0 | ||||
| R-98 | ||||
| 0 | 2.89 × 10⁻⁴ | 3.58 × 10⁻⁸ | 2.56 × 10⁻⁶ | (8.87 ± 0.42) × 10−6 |
| 0.01087 | 5.89 × 10⁻⁴ | 6.67 × 10⁻⁸ | 1.46 × 10⁻⁶ | (2.47 ± 0.19) × 10−6 |
| 0.02899 | 7.42 × 10⁻⁴ | 4.10 × 10⁻⁸ | 7.19 × 10⁻⁷ | (9.69 ± 0.29) × 10−7 |
| RS-186 | ||||
| 0 | 2.51 × 10⁻⁴ | 4.12 × 10⁻⁸ | 2.39 × 10⁻⁶ | (9.51 ± 0.48) × 10−6 |
| 0.01087 | 6.60 × 10⁻⁴ | 2.51 × 10⁻⁸ | 7.39 × 10⁻⁷ | (1.12 ± 0.09) × 10−6 |
| 0.02899 | 1.41 × 10⁻³ | 1.12 × 10⁻⁷ | 1.54 × 10⁻⁶ | (1.09 ± 0.11) × 10−6 |
| pH 7.4 | ||||
| R-98 | ||||
| 0 | 2.28 × 10⁻⁵ | 4.46 × 10⁻⁹ | 2.17 × 10⁻⁷ | (9.52 ± 0.63) × 10−6 |
| 0.01087 | 3.00 × 10⁻⁴ | 6.39 × 10⁻⁹ | 3.58 × 10⁻⁷ | (1.19 ± 0.06) × 10−6 |
| 0.02899 | 7.05 × 10⁻⁴ | 3.58 × 10⁻⁸ | 6.95 × 10⁻⁷ | (9.85 ± 0.30) × 10−7 |
| RS-186 | ||||
| 0 | 2.82 × 10⁻⁵ | 4.46 × 10⁻⁹ | 2.46 × 10⁻⁷ | (8.73 ± 0.68) × 10−6 |
| 0.01087 | 3.81 × 10⁻⁴ | 6.72 × 10⁻⁹ | 3.08 × 10⁻⁷ | (1.07 ± 0.06) × 10−7 |
| 0.02899 | 2.90 × 10⁻⁴ | 6.19 × 10⁻⁹ | 2.84 × 10⁻⁷ | (9.82 ± 0.49) × 10−7 |
Publisher’s Note: MDPI stays neutral with regard to jurisdictional claims in published maps and institutional affiliations. |
© 2022 by the authors. Licensee MDPI, Basel, Switzerland. This article is an open access article distributed under the terms and conditions of the Creative Commons Attribution (CC BY) license (https://creativecommons.org/licenses/by/4.0/).
Share and Cite
Volkova, T.V.; Simonova, O.R.; Levshin, I.B.; Perlovich, G.L. Chiral Recognition R- and RS- of New Antifungal: Complexation/Solubilization/Dissolution Thermodynamics and Permeability Assay. Pharmaceutics 2022, 14, 864. https://doi.org/10.3390/pharmaceutics14040864
Volkova TV, Simonova OR, Levshin IB, Perlovich GL. Chiral Recognition R- and RS- of New Antifungal: Complexation/Solubilization/Dissolution Thermodynamics and Permeability Assay. Pharmaceutics. 2022; 14(4):864. https://doi.org/10.3390/pharmaceutics14040864
Chicago/Turabian StyleVolkova, Tatyana V., Olga R. Simonova, Igor B. Levshin, and German L. Perlovich. 2022. "Chiral Recognition R- and RS- of New Antifungal: Complexation/Solubilization/Dissolution Thermodynamics and Permeability Assay" Pharmaceutics 14, no. 4: 864. https://doi.org/10.3390/pharmaceutics14040864
APA StyleVolkova, T. V., Simonova, O. R., Levshin, I. B., & Perlovich, G. L. (2022). Chiral Recognition R- and RS- of New Antifungal: Complexation/Solubilization/Dissolution Thermodynamics and Permeability Assay. Pharmaceutics, 14(4), 864. https://doi.org/10.3390/pharmaceutics14040864