
Sustained and Long-Term Release of Doxorubicin from PLGA Nanoparticles for Eliciting Anti-Tumor Immune Responses


 and
and 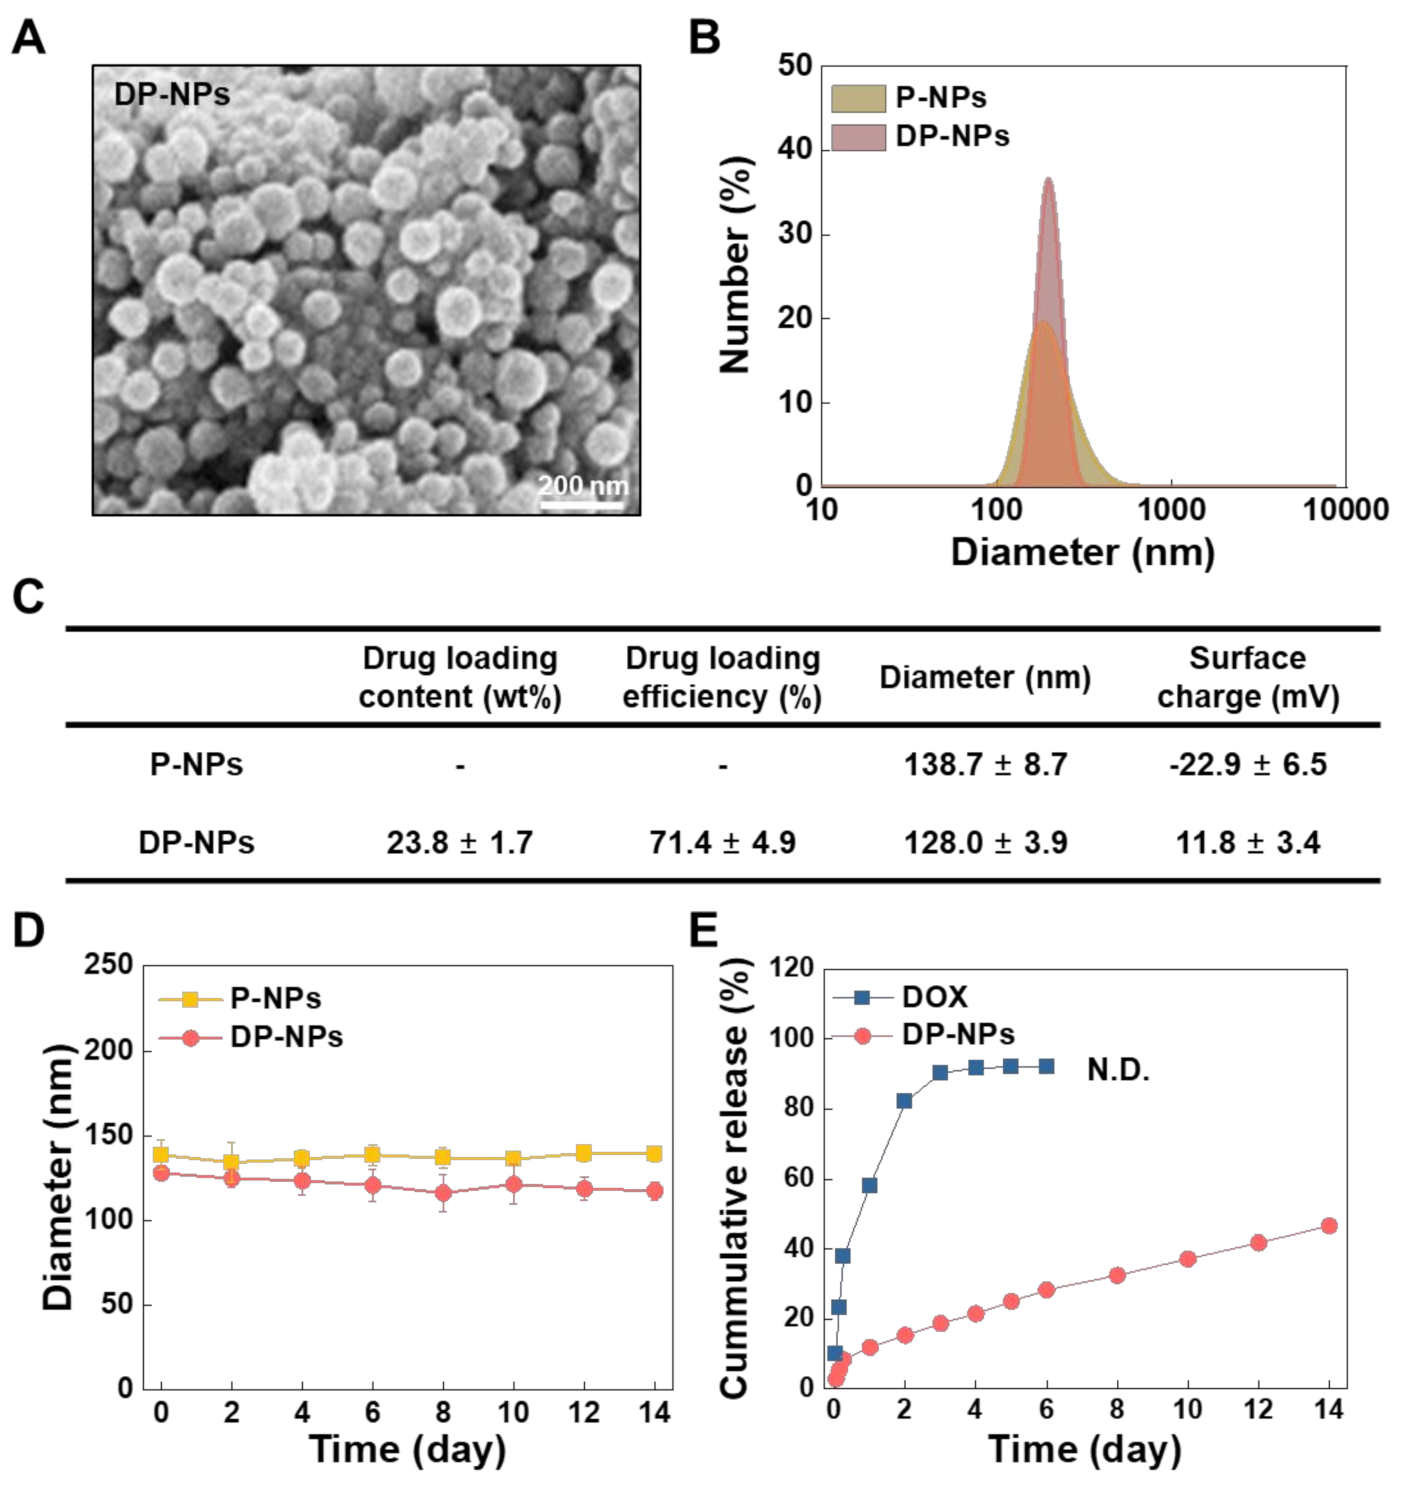
Abstract
:1. Introduction
2. Materials and Methods
2.1. Materials
2.2. Preparation of DP-NPs
2.3. In Vitro Formulation and Characterization of DP-NPs
2.4. In Vitro Cellular Uptake and Cytotoxicity
2.5. In Vitro Analysis of ICD-Associated DAMPs
2.6. In Vivo Drug Release Kinetics
2.7. In Vivo Tumor Growth Inhibition and Toxicity
2.8. In Vivo ICD-Associated DAMPs and Immune Cell Analysis
2.9. TUNEL Assay and H&E Staining
2.10. Statistical Analysis
3. Results and Discussion
3.1. Characterization of the DP-NPs
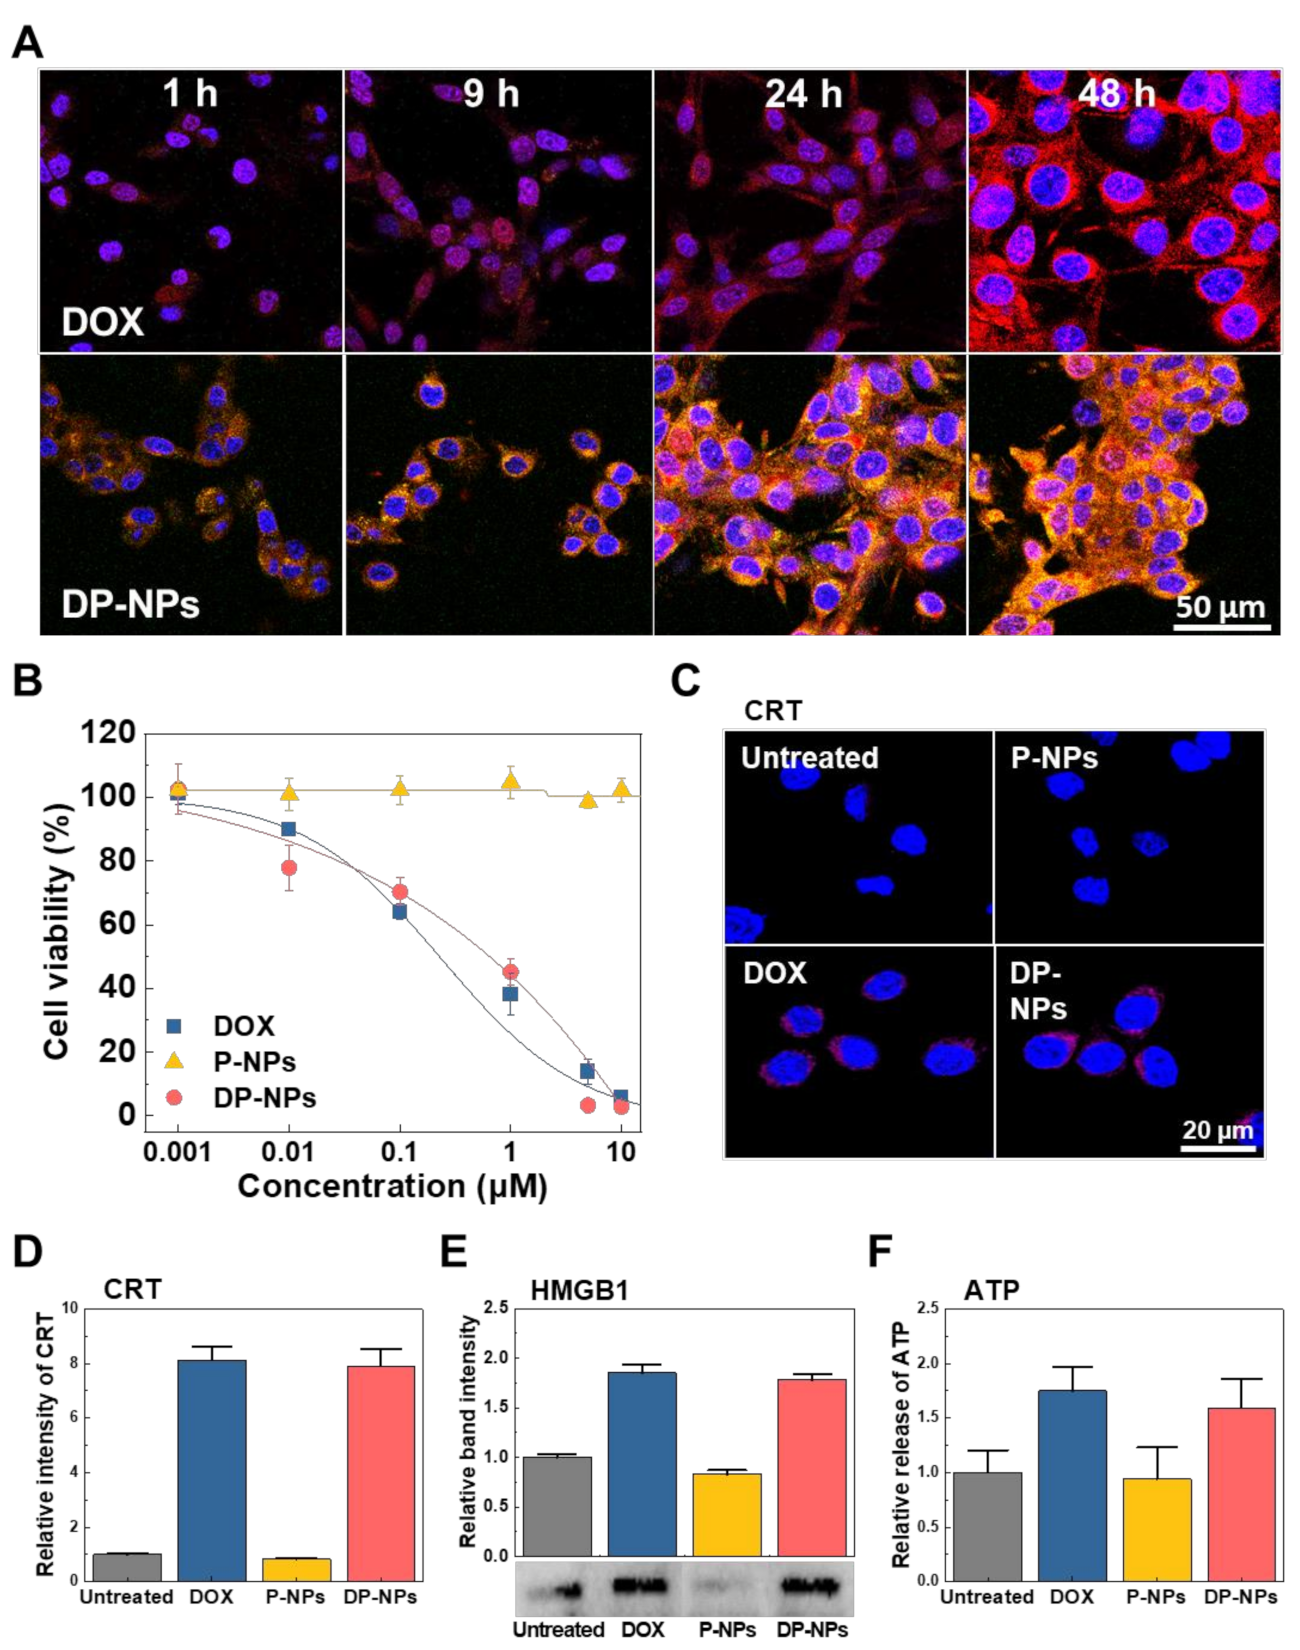
3.2. In Vitro Cellular Uptake, Cytotoxicity, and ICD of DP-NPs
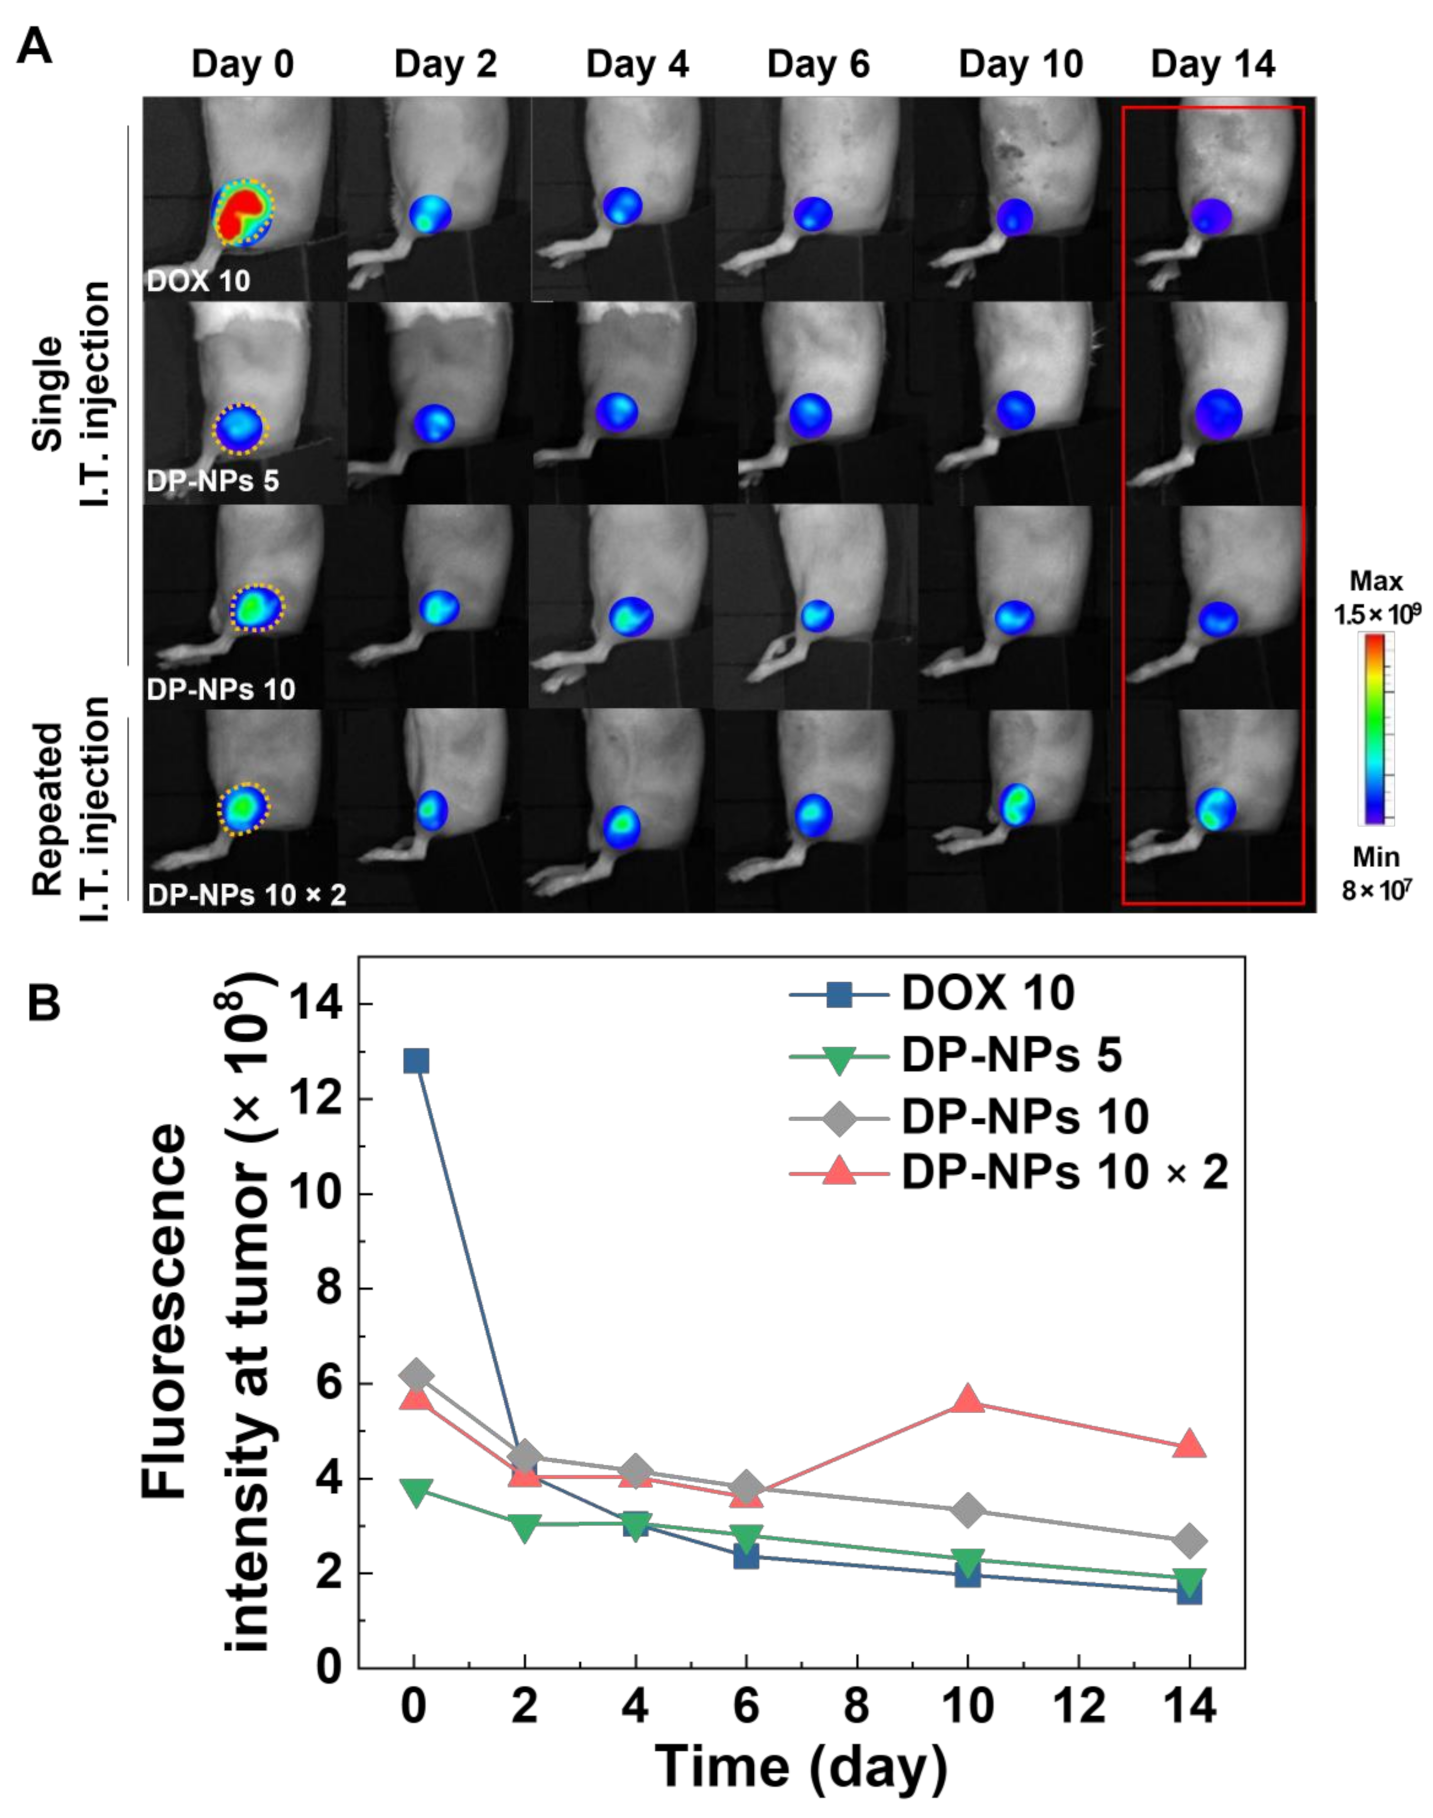
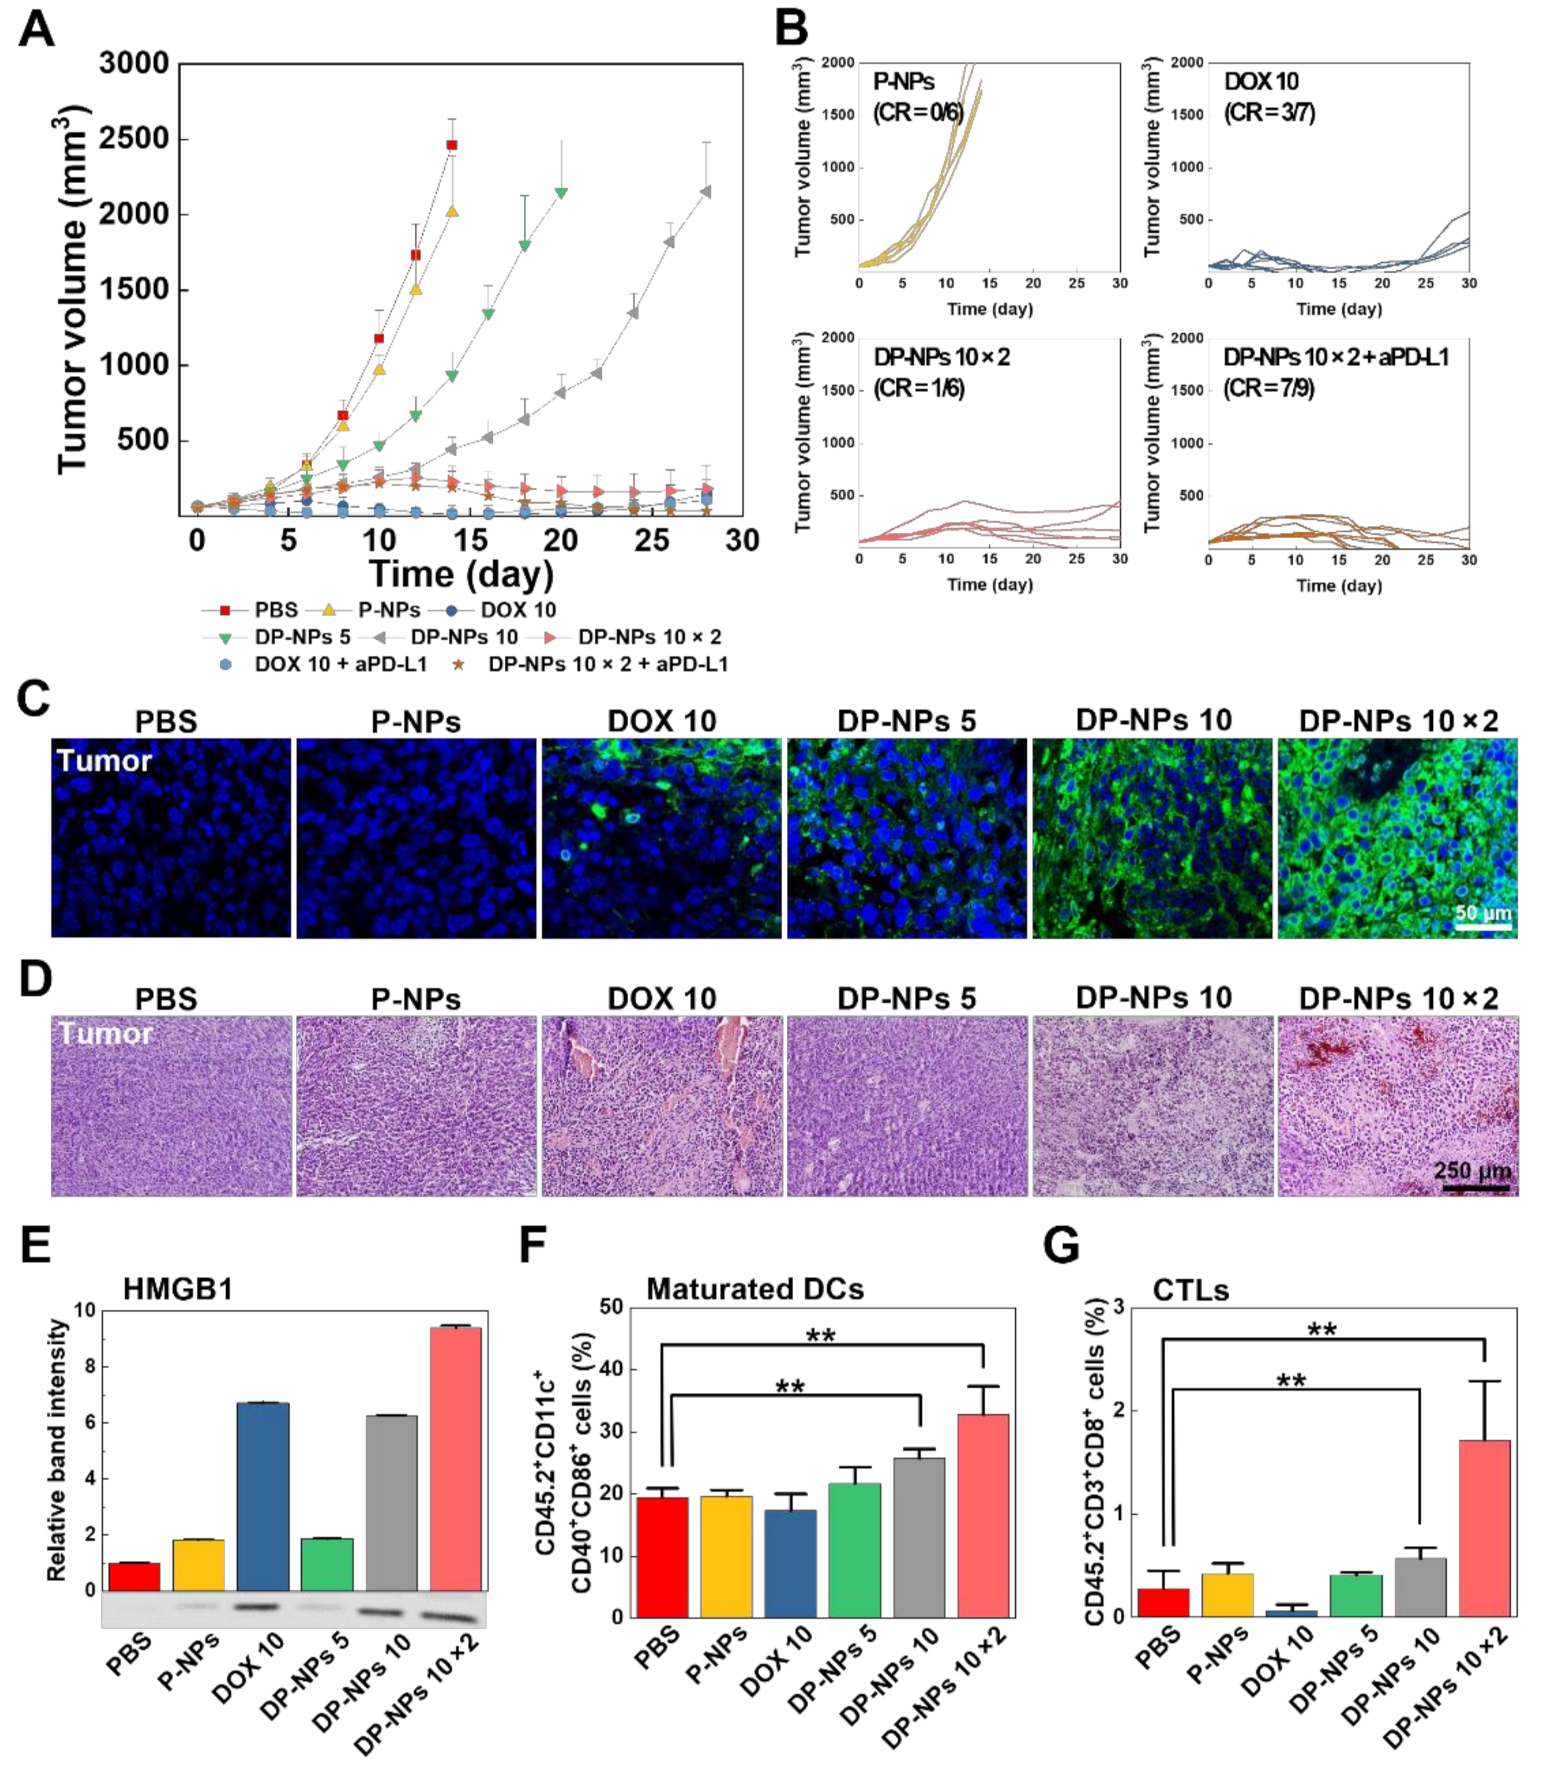
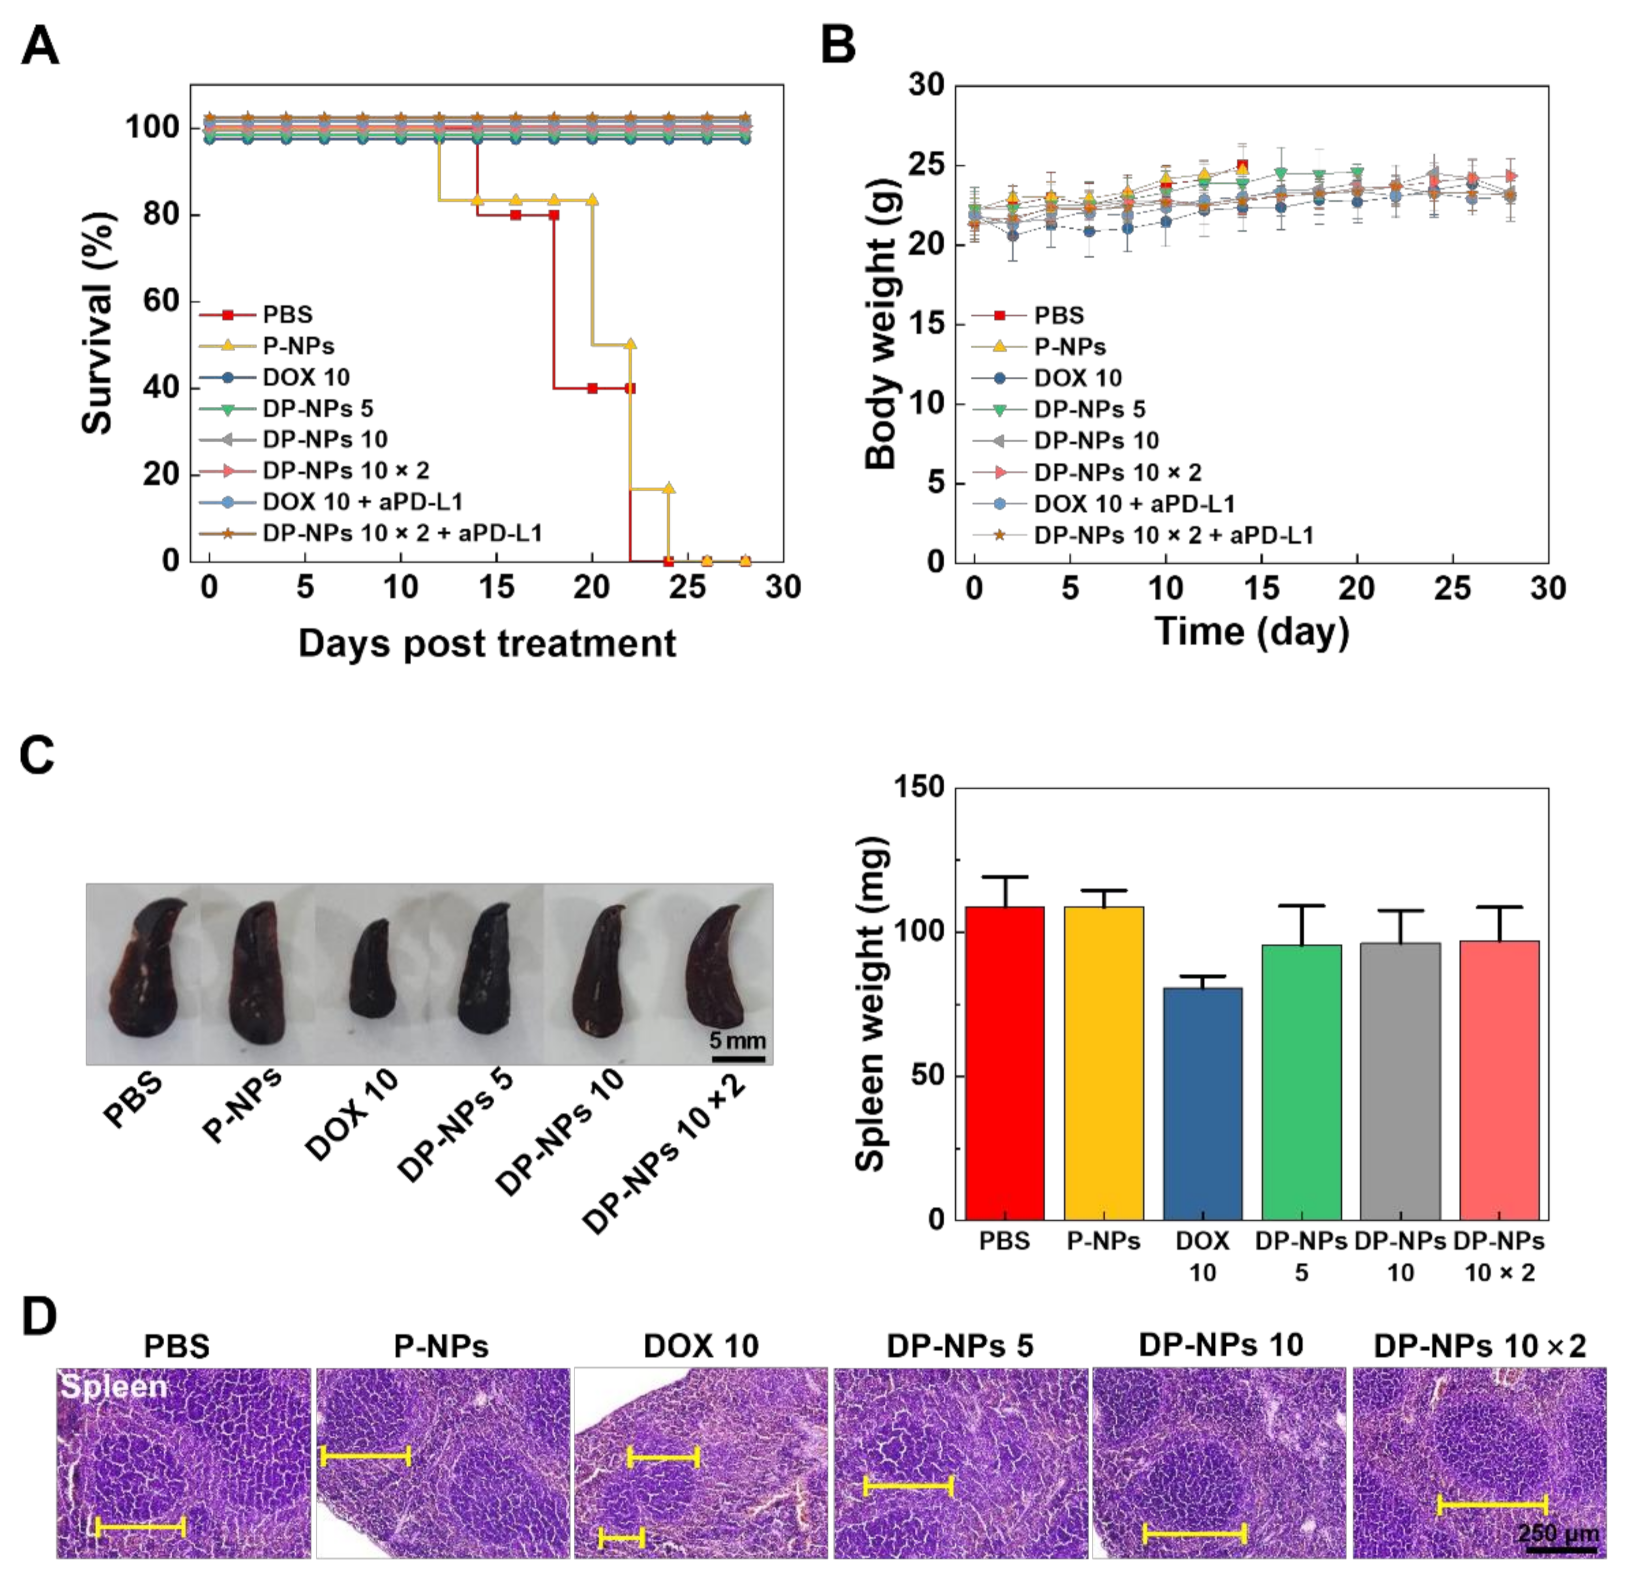
3.3. In Vivo Tumor Growth Inhibition by DP-NPs-Driven CIT
4. Conclusions
Supplementary Materials
Author Contributions
Funding
Institutional Review Board Statement
Informed Consent Statement
Data Availability Statement
Conflicts of Interest
References
- Green, D.R.; Ferguson, T.; Zitvogel, L.; Kroemer, G. Immunogenic and tolerogenic cell death. Nat. Rev. Immunol. 2009, 9, 353–363. [Google Scholar] [CrossRef] [PubMed]
- Kroemer, G.; Galluzzi, L.; Kepp, O.; Zitvogel, L. Immunogenic cell death in cancer therapy. Annu. Rev. Immunol. 2013, 31, 51–72. [Google Scholar] [CrossRef] [PubMed]
- Li, Y.; Liu, X.; Zhang, X.; Pan, W.; Li, N.; Tang, B. Immunogenic cell death inducers for enhanced cancer immunotherapy. Chem. Commun. 2021, 57, 12087–12097. [Google Scholar] [CrossRef] [PubMed]
- Krysko, D.V.; Garg, A.D.; Kaczmarek, A.; Krysko, O.; Agostinis, P.; Vandenabeele, P. Immunogenic cell death and DAMPs in cancer therapy. Nat. Rev. Cancer 2012, 12, 860–875. [Google Scholar] [CrossRef]
- Wang, Y.J.; Fletcher, R.; Yu, J.; Zhang, L. Immunogenic effects of chemotherapy-induced tumor cell death. Genes Dis. 2018, 5, 194–203. [Google Scholar] [CrossRef]
- Vanmeerbeek, I.; Sprooten, J.; De Ruysscher, D.; Tejpar, S.; Vandenberghe, P.; Fucikova, J.; Spisek, R.; Zitvogel, L.; Kroemer, G.; Galluzzi, L.; et al. Trial watch: Chemotherapy-induced immunogenic cell death in immuno-oncology. Oncoimmunology 2020, 9, 1703449. [Google Scholar] [CrossRef] [Green Version]
- Barry, K.C.; Hsu, J.; Broz, M.L.; Cueto, F.J.; Binnewies, M.; Combes, A.J.; Nelson, A.E.; Loo, K.; Kumar, R.; Rosenblum, M.D.; et al. A natural killer-dendritic cell axis defines checkpoint therapy-responsive tumor microenvironments. Nat. Med. 2018, 24, 1178–1191. [Google Scholar] [CrossRef]
- Chen, D.S.; Mellman, I. Oncology meets immunology: The cancer-immunity cycle. Immunity 2013, 39, 1–10. [Google Scholar] [CrossRef] [Green Version]
- Serrano-Del Valle, A.; Anel, A.; Naval, J.; Marzo, I. Immunogenic Cell Death and Immunotherapy of Multiple Myeloma. Front. Cell Dev. Biol. 2019, 7, 50. [Google Scholar] [CrossRef]
- Opzoomer, J.W.; Sosnowska, D.; Anstee, J.E.; Spicer, J.F.; Arnold, J.N. Cytotoxic Chemotherapy as an Immune Stimulus: A Molecular Perspective on Turning Up the Immunological Heat on Cancer. Front. Immunol. 2019, 10, 1654. [Google Scholar] [CrossRef] [Green Version]
- Senapati, S.; Mahanta, A.K.; Kumar, S.; Maiti, P. Controlled drug delivery vehicles for cancer treatment and their performance. Signal Transduct. Target. Ther. 2018, 3, 7. [Google Scholar] [CrossRef] [Green Version]
- Wei, G.; Wang, Y.; Yang, G.; Wang, Y.; Ju, R. Recent progress in nanomedicine for enhanced cancer chemotherapy. Theranostics 2021, 11, 6370–6392. [Google Scholar] [CrossRef]
- Gonzalez-Valdivieso, J.; Girotti, A.; Schneider, J.; Arias, F.J. Advanced nanomedicine and cancer: Challenges and opportunities in clinical translation. Int. J. Pharm. 2021, 599, 120438. [Google Scholar] [CrossRef]
- Wu, W.; Pu, Y.; Shi, J. Nanomedicine-enabled chemotherapy-based synergetic cancer treatments. J. Nanobiotechnology 2022, 20, 4. [Google Scholar] [CrossRef]
- Meng, F.; Wang, J.; Ping, Q.; Yeo, Y. Quantitative Assessment of Nanoparticle Biodistribution by Fluorescence Imaging, Revisited. ACS Nano 2018, 12, 6458–64681. [Google Scholar] [CrossRef]
- de Maar, J.S.; Sofias, A.M.; Porta Siegel, T.; Vreeken, R.J.; Moonen, C.; Bos, C.; Deckers, R. Spatial heterogeneity of nanomedicine investigated by multiscale imaging of the drug, the nanoparticle and the tumour environment. Theranostics 2020, 10, 1884–1909. [Google Scholar] [CrossRef]
- Brand, W.; Noorlander, C.W.; Giannakou, C.; De Jong, W.H.; Kooi, M.W.; Park, M.V.; Vandebriel, R.J.; Bosselaers, I.E.; Scholl, J.H.; Geertsma, R.E. Nanomedicinal products: A survey on specific toxicity and side effects. Int. J. Nanomed. 2017, 12, 6107–6129. [Google Scholar] [CrossRef]
- Giannakou, C.; Park, M.V.; de Jong, W.H.; van Loveren, H.; Vandebriel, R.J.; Geertsma, R.E. A comparison of immunotoxic effects of nanomedicinal products with regulatory immunotoxicity testing requirements. Int. J. Nanomed. 2016, 11, 2935–2952. [Google Scholar] [CrossRef] [Green Version]
- Shikanov, A.; Shikanov, S.; Vaisman, B.; Golenser, J.; Domb, A.J. Cisplatin tumor biodistribution and efficacy after intratumoral injection of a biodegradable extended release implant. Chemother Res. Pr. 2011, 2011, 175054. [Google Scholar] [CrossRef]
- Celikoglu, F.; Celikoglu, S.I.; Goldberg, E.P. Bronchoscopic intratumoral chemotherapy of lung cancer. Lung Cancer 2008, 61, 1–12. [Google Scholar] [CrossRef]
- Goldberg, E.P.; Hadba, A.R.; Almond, B.A.; Marotta, J.S. Intratumoral cancer chemotherapy and immunotherapy: Opportunities for nonsystemic preoperative drug delivery. J. Pharm. Pharm. 2002, 54, 159–180. [Google Scholar] [CrossRef]
- Liu, J.; Li, Z.; Zhao, D.; Feng, X.; Wang, C.; Li, D.; Ding, J. Immunogenic cell death-inducing chemotherapeutic nanoformulations potentiate combination chemoimmunotherapy. Mater. Des. 2021, 202, 109465. [Google Scholar] [CrossRef]
- Mastria, E.M.; Cai, L.Y.; Kan, M.J.; Li, X.; Schaal, J.L.; Fiering, S.; Gunn, M.D.; Dewhirst, M.W.; Nair, S.K.; Chilkoti, A. Nanoparticle formulation improves doxorubicin efficacy by enhancing host antitumor immunity. J. Control. Release 2018, 269, 364–373. [Google Scholar] [CrossRef]
- Gao, J.; Wang, W.-Q.; Pei, Q.; Lord, M.S.; Yu, H.-j. Engineering nanomedicines through boosting immunogenic cell death for improved cancer immunotherapy. Acta Pharmacol. Sin. 2020, 41, 986–994. [Google Scholar] [CrossRef]
- Ahmad, S.; Idris, R.A.M.; Hanaffi, W.N.W.; Perumal, K.; Boer, J.C.; Plebanski, M.; Jaafar, J.; Lim, J.K.; Mohamud, R. Cancer Nanomedicine and Immune System—Interactions and Challenges. Front. Nanotechnol. 2021, 3, 1–9. [Google Scholar] [CrossRef]
- Zhao, M.; Liu, M. New Avenues for Nanoparticle-Related Therapies. Nanoscale Res. Lett. 2018, 13, 136. [Google Scholar] [CrossRef] [Green Version]
- Maulhardt, H.A.; Hylle, L.; Frost, M.V.; Tornio, A.; Dafoe, S.; Drummond, L.; Quinn, D.I.; Kamat, A.M.; Dizerega, G.S. Local injection of submicron particle docetaxel is associated with tumor eradication, reduced systemic toxicity and an immunologic response in uro-oncologic xenografts. Cancers 2019, 11, 577. [Google Scholar] [CrossRef] [Green Version]
- Guerrouahen, B.S.; Maccalli, C.; Cugno, C.; Rutella, S.; Akporiaye, E.T. Reverting Immune Suppression to Enhance Cancer Immunotherapy. Front. Oncol. 2019, 9, 1554. [Google Scholar] [CrossRef] [Green Version]
- Somarribas Patterson, L.F.; Vardhana, S.A. Metabolic regulation of the cancer-immunity cycle. Trends Immunol. 2021, 42, 975–993. [Google Scholar] [CrossRef]
- Rivas, J.R.; Liu, Y.; Alhakeem, S.S.; Eckenrode, J.M.; Marti, F.; Collard, J.P.; Zhang, Y.; Shaaban, K.A.; Muthusamy, N.; Hildebrandt, G.C.; et al. Interleukin-10 suppression enhances T-cell antitumor immunity and responses to checkpoint blockade in chronic lymphocytic leukemia. Leukemia 2021, 35, 3188–3200. [Google Scholar] [CrossRef]
- Petitprez, F.; Meylan, M.; de Reynies, A.; Sautes-Fridman, C.; Fridman, W.H. The Tumor Microenvironment in the Response to Immune Checkpoint Blockade Therapies. Front. Immunol. 2020, 11, 784. [Google Scholar] [CrossRef] [PubMed]
- Zemek, R.M.; Chin, W.L.; Nowak, A.K.; Millward, M.J.; Lake, R.A.; Lesterhuis, W.J. Sensitizing the Tumor Microenvironment to Immune Checkpoint Therapy. Front. Immunol. 2020, 11, 223. [Google Scholar] [CrossRef] [PubMed] [Green Version]
- Fan, Q.; Chen, Z.; Wang, C.; Liu, Z. Toward biomaterials for enhancing immune checkpoint blockade therapy. Adv. Funct. Mater. 2018, 28, 1802540. [Google Scholar] [CrossRef]
- Jo, S.D.; Nam, G.-H.; Kwak, G.; Yang, Y.; Kwon, I.C. Harnessing designed nanoparticles: Current strategies and future perspectives in cancer immunotherapy. Nano Today 2017, 17, 23–37. [Google Scholar] [CrossRef]
- Fan, W.; Yung, B.; Huang, P.; Chen, X. Nanotechnology for Multimodal Synergistic Cancer Therapy. Chem. Rev. 2017, 117, 13566–13638. [Google Scholar] [CrossRef]
- Pfirschke, C.; Engblom, C.; Rickelt, S.; Cortez-Retamozo, V.; Garris, C.; Pucci, F.; Yamazaki, T.; Poirier-Colame, V.; Newton, A.; Redouane, Y.; et al. Immunogenic Chemotherapy Sensitizes Tumors to Checkpoint Blockade Therapy. Immunity 2016, 44, 343–354. [Google Scholar] [CrossRef] [Green Version]
- Kepp, O.; Zitvogel, L.; Kroemer, G. Clinical evidence that immunogenic cell death sensitizes to PD-1/PD-L1 blockade. Oncoimmunology 2019, 8, 1637188. [Google Scholar] [CrossRef]
- Swider, E.; Koshkina, O.; Tel, J.; Cruz, L.J.; de Vries, I.J.M.; Srinivas, M. Customizing poly(lactic-co-glycolic acid) particles for biomedical applications. Acta Biomater. 2018, 73, 38–51. [Google Scholar] [CrossRef]
- Kim, K.T.; Lee, J.Y.; Kim, D.D.; Yoon, I.S.; Cho, H.J. Recent Progress in the Development of Poly(lactic-co-glycolic acid)-Based Nanostructures for Cancer Imaging and Therapy. Pharmaceutics 2019, 11, 280. [Google Scholar] [CrossRef] [Green Version]
- Rezvantalab, S.; Drude, N.I.; Moraveji, M.K.; Guvener, N.; Koons, E.K.; Shi, Y.; Lammers, T.; Kiessling, F. PLGA-Based Nanoparticles in Cancer Treatment. Front. Pharm. 2018, 9, 1260. [Google Scholar] [CrossRef] [Green Version]
- Engineer, C.; Parikh, J.; Raval, A. Review on hydrolytic degradation behavior of biodegradable polymers from controlled drug delivery system. Trends Biomater. Artif. Organs 2011, 25, 79–85. [Google Scholar]
- Xu, Y.; Kim, C.S.; Saylor, D.M.; Koo, D. Polymer degradation and drug delivery in PLGA-based drug-polymer applications: A review of experiments and theories. J. Biomed. Mater. Res. B Appl. Biomater. 2017, 105, 1692–1716. [Google Scholar] [CrossRef]
- Choi, Y.; Yoon, H.Y.; Kim, J.; Yang, S.; Lee, J.; Choi, J.W.; Moon, Y.; Kim, J.; Lim, S.; Shim, M.K.; et al. Doxorubicin-Loaded PLGA Nanoparticles for Cancer Therapy: Molecular Weight Effect of PLGA in Doxorubicin Release for Controlling Immunogenic Cell Death. Pharmaceutics 2020, 12, 1165. [Google Scholar] [CrossRef]
- Jadapalli, J.K.; Wright, G.W.; Kain, V.; Sherwani, M.A.; Sonkar, R.; Yusuf, N.; Halade, G.V. Doxorubicin triggers splenic contraction and irreversible dysregulation of COX and LOX that alters the inflammation-resolution program in the myocardium. Am. J. Physiol. Heart Circ. Physiol. 2018, 315, 1091–1100. [Google Scholar] [CrossRef]
- Bailly, C.; Thuru, X.; Quesnel, B. Combined cytotoxic chemotherapy and immunotherapy of cancer: Modern times. NAR Cancer 2020, 2, 1. [Google Scholar] [CrossRef] [Green Version]
- Salas-Benito, D.; Perez-Gracia, J.L.; Ponz-Sarvise, M.; Rodriguez-Ruiz, M.E.; Martinez-Forero, I.; Castanon, E.; Lopez-Picazo, J.M.; Sanmamed, M.F.; Melero, I. Paradigms on Immunotherapy Combinations with Chemotherapy. Cancer Discov. 2021, 11, 1353–1367. [Google Scholar] [CrossRef]


Publisher’s Note: MDPI stays neutral with regard to jurisdictional claims in published maps and institutional affiliations. |
© 2022 by the authors. Licensee MDPI, Basel, Switzerland. This article is an open access article distributed under the terms and conditions of the Creative Commons Attribution (CC BY) license (https://creativecommons.org/licenses/by/4.0/).
Share and Cite
Kim, J.; Choi, Y.; Yang, S.; Lee, J.; Choi, J.; Moon, Y.; Kim, J.; Shim, N.; Cho, H.; Shim, M.K.; et al. Sustained and Long-Term Release of Doxorubicin from PLGA Nanoparticles for Eliciting Anti-Tumor Immune Responses. Pharmaceutics 2022, 14, 474. https://doi.org/10.3390/pharmaceutics14030474
Kim J, Choi Y, Yang S, Lee J, Choi J, Moon Y, Kim J, Shim N, Cho H, Shim MK, et al. Sustained and Long-Term Release of Doxorubicin from PLGA Nanoparticles for Eliciting Anti-Tumor Immune Responses. Pharmaceutics. 2022; 14(3):474. https://doi.org/10.3390/pharmaceutics14030474
Chicago/Turabian StyleKim, Jeongrae, Yongwhan Choi, Suah Yang, Jaewan Lee, Jiwoong Choi, Yujeong Moon, Jinseong Kim, Nayeon Shim, Hanhee Cho, Man Kyu Shim, and et al. 2022. "Sustained and Long-Term Release of Doxorubicin from PLGA Nanoparticles for Eliciting Anti-Tumor Immune Responses" Pharmaceutics 14, no. 3: 474. https://doi.org/10.3390/pharmaceutics14030474
APA StyleKim, J., Choi, Y., Yang, S., Lee, J., Choi, J., Moon, Y., Kim, J., Shim, N., Cho, H., Shim, M. K., Jeon, S., Lim, D.-K., Yoon, H. Y., & Kim, K. (2022). Sustained and Long-Term Release of Doxorubicin from PLGA Nanoparticles for Eliciting Anti-Tumor Immune Responses. Pharmaceutics, 14(3), 474. https://doi.org/10.3390/pharmaceutics14030474