
The Influence of Selected Factors on the Aqueous Cryptotanshinone Solubility


Abstract
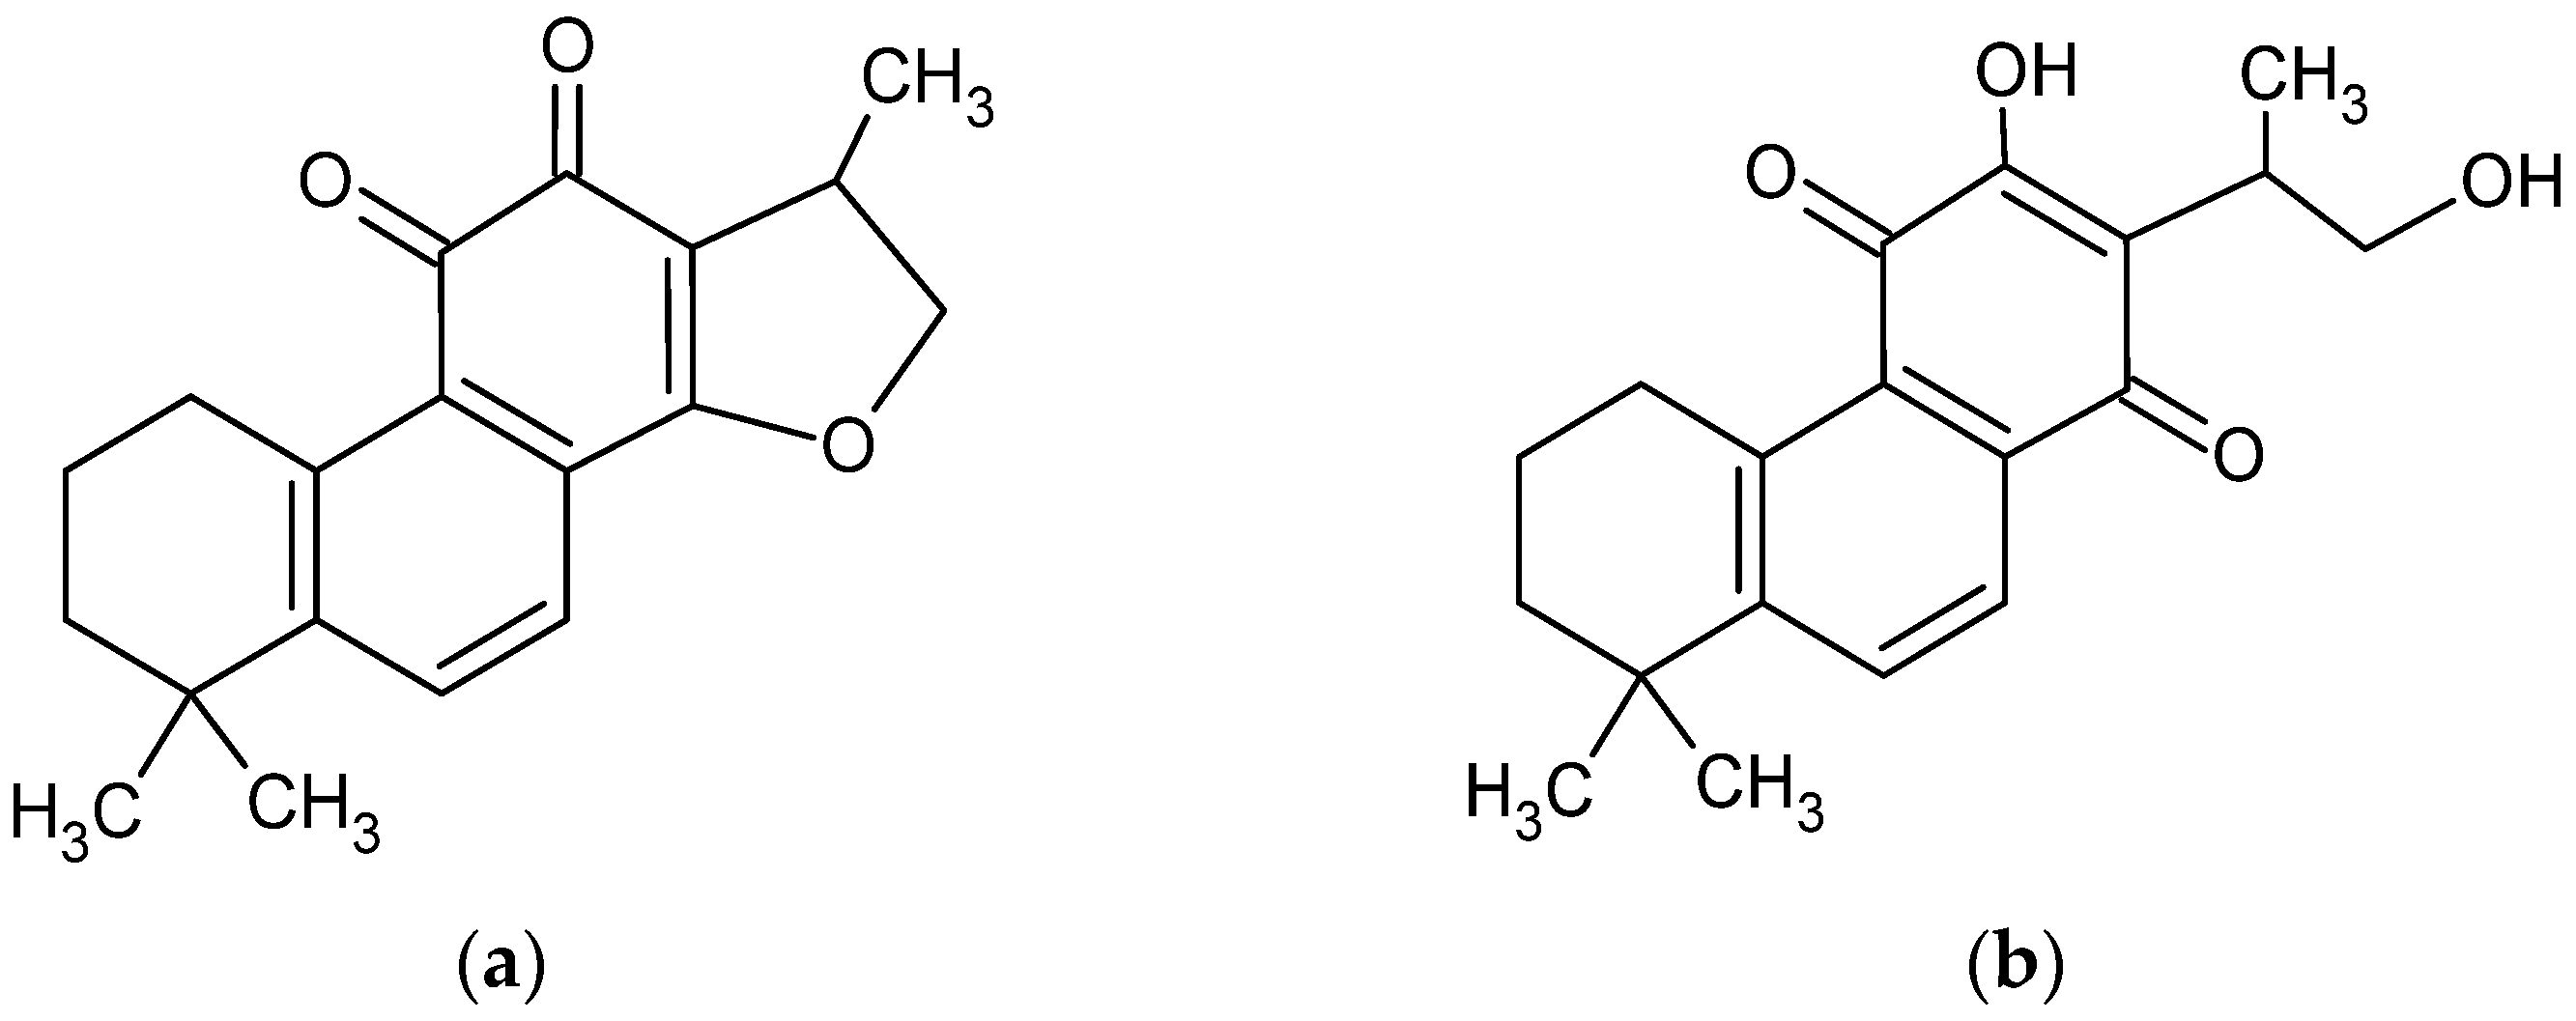
1. Introduction
2. Materials and Methods
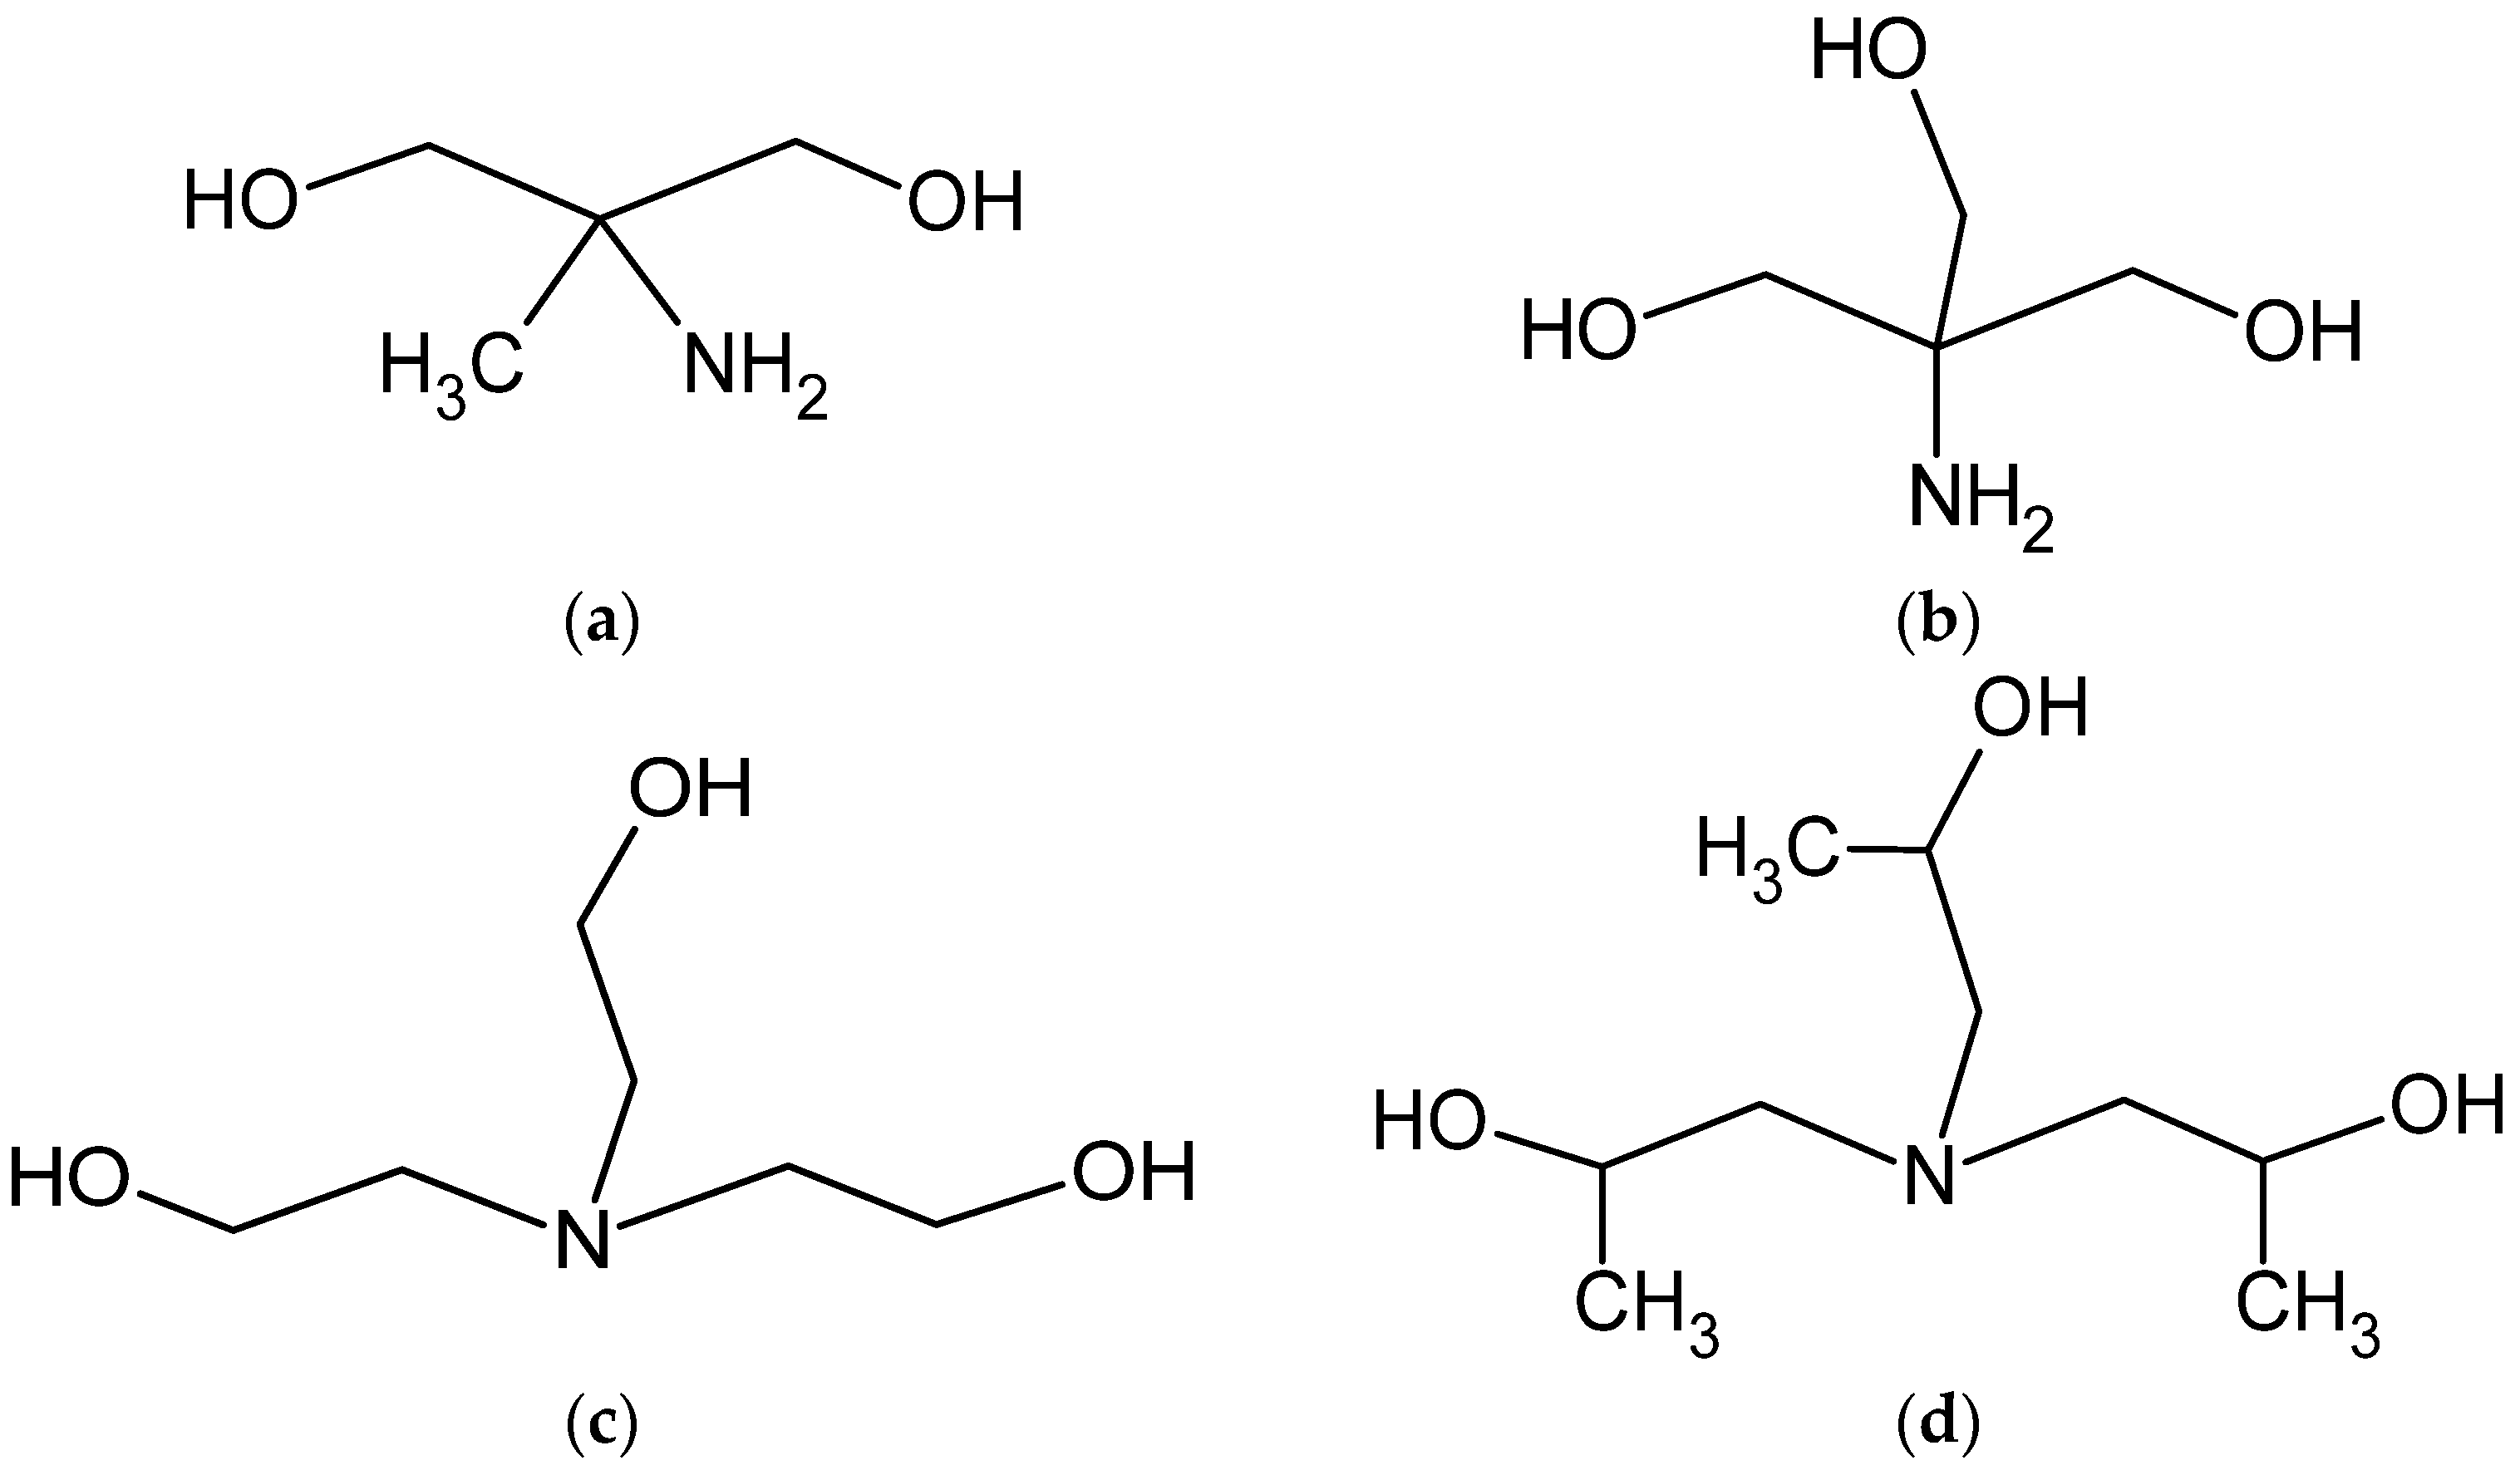
2.1. Materials
2.2. Preliminary Evaluation of the CT Solubility Performance in Various Solvents
2.3. Absorbance Studies of CT in Varied Alkaline Solvents
2.4. Potentiometric and Conductometric Studies
2.5. HPLC Analysis
3. Results
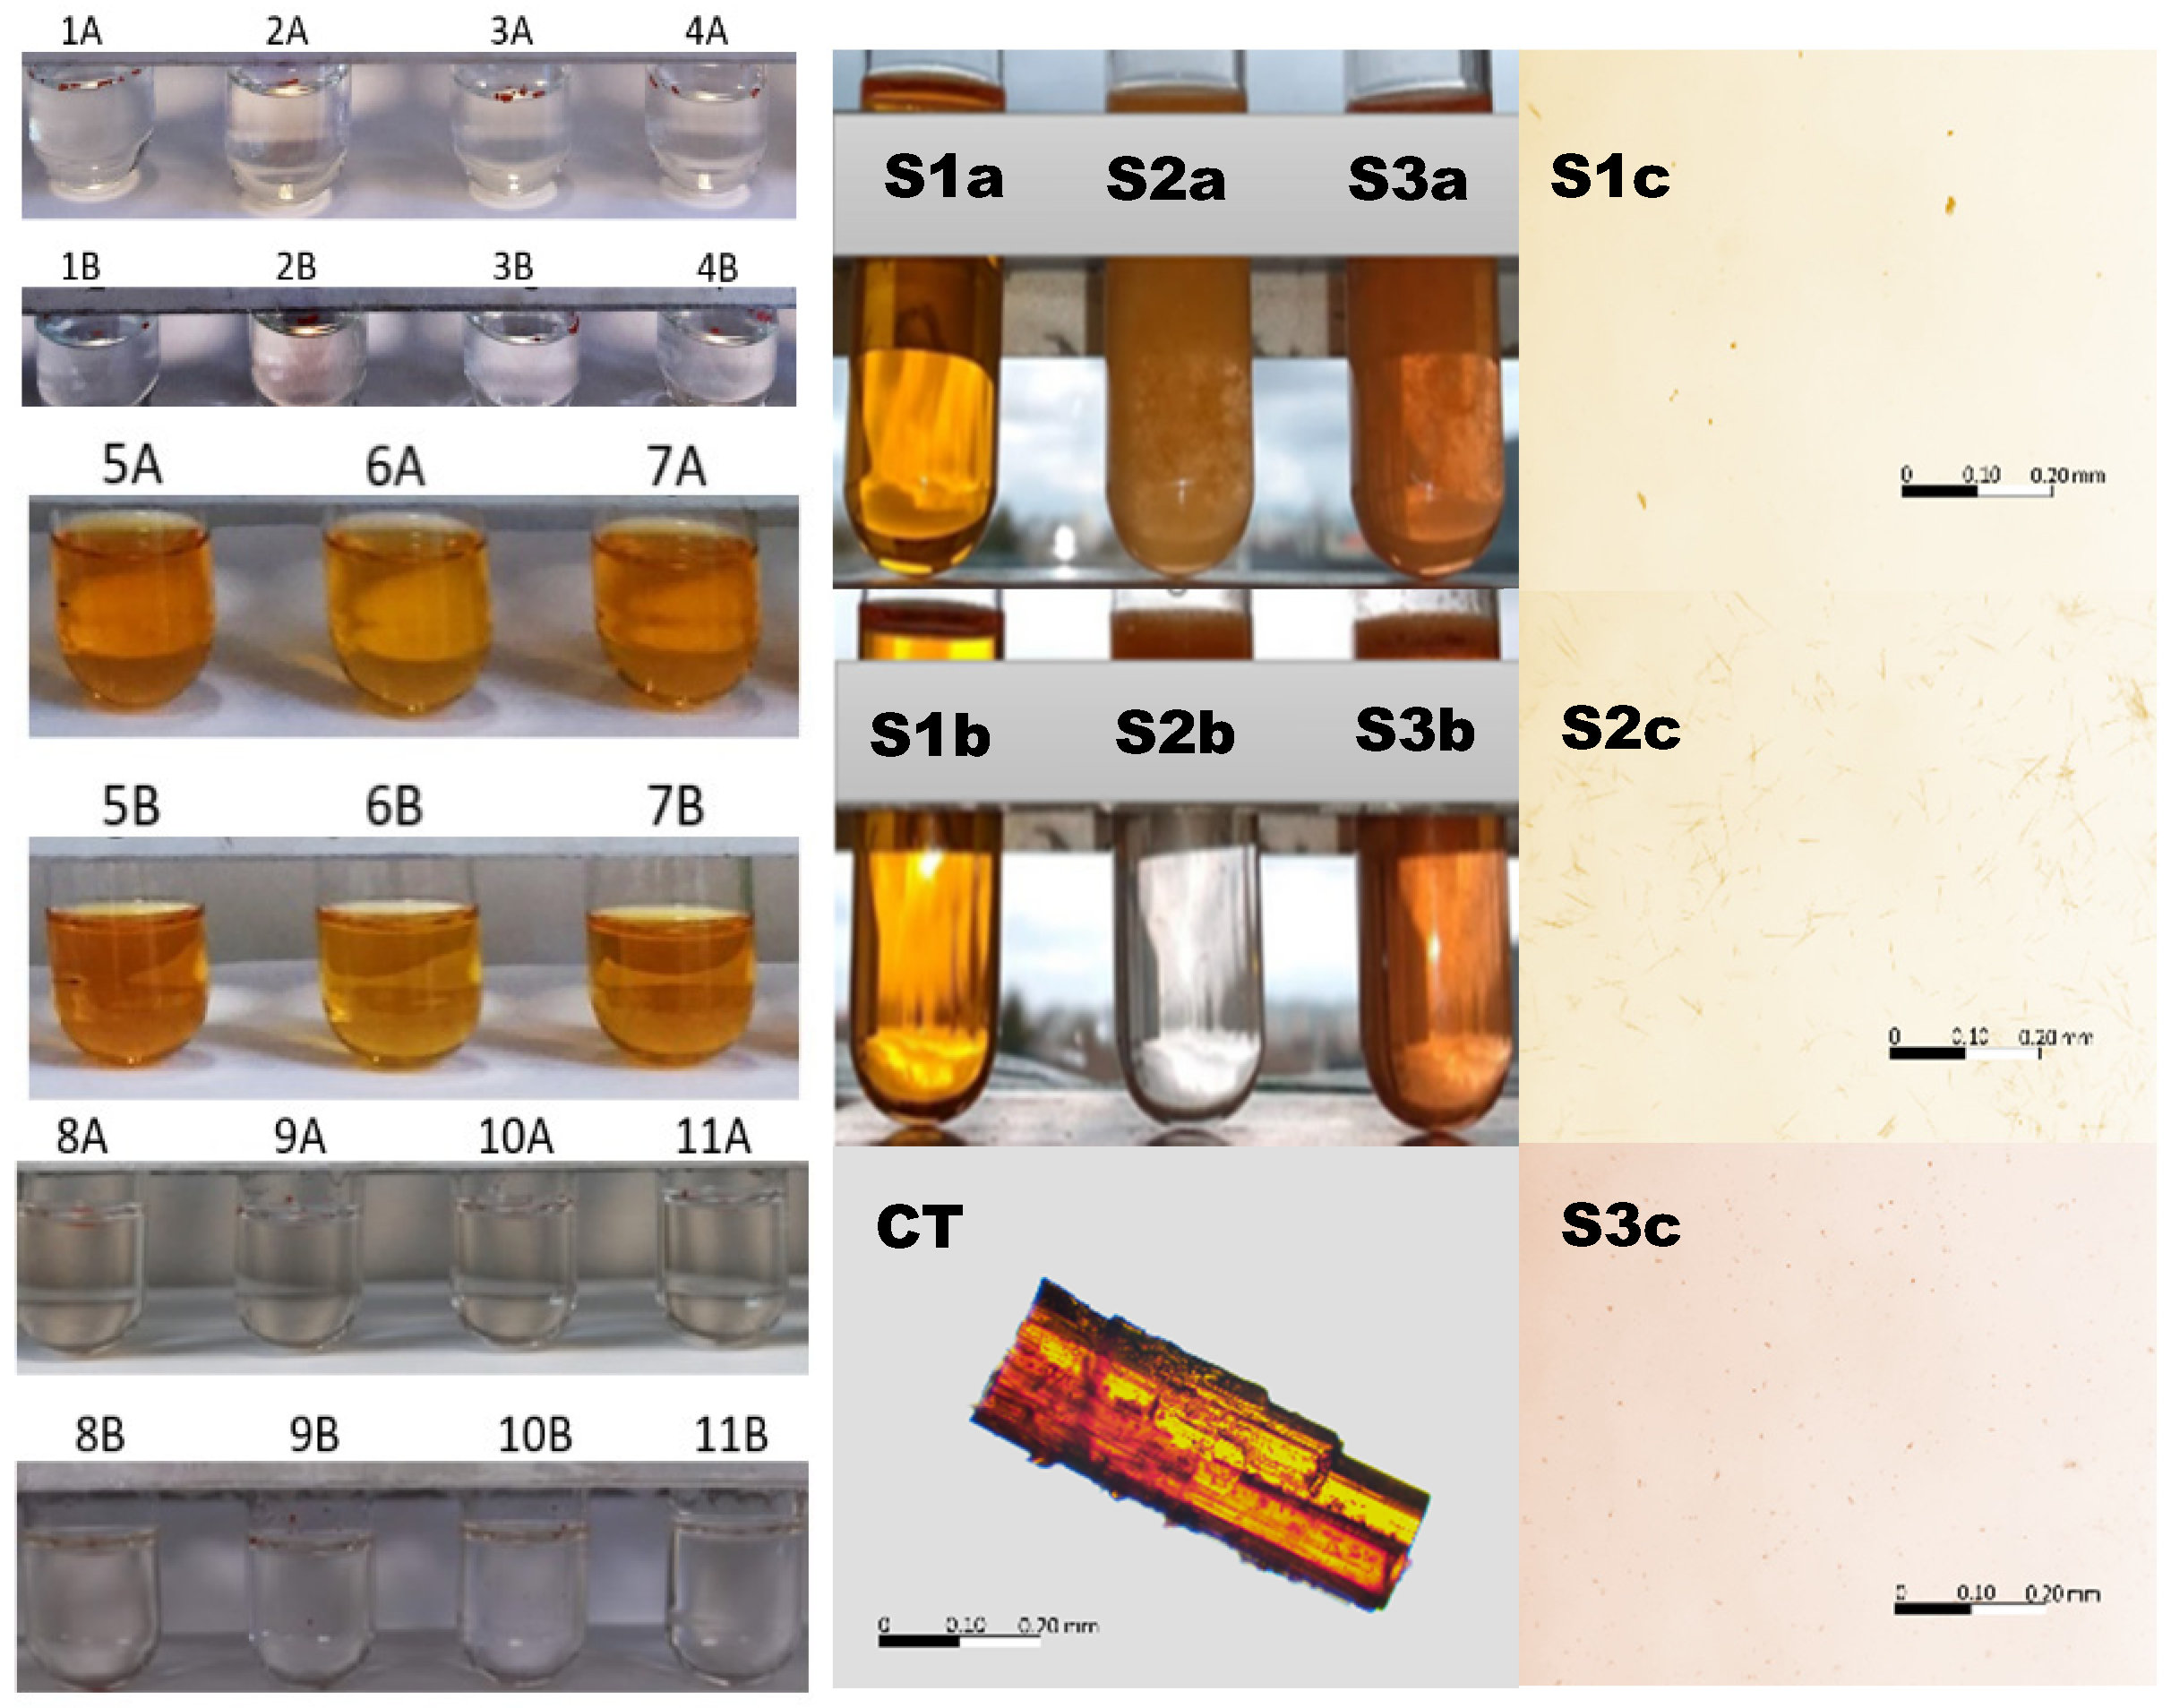
3.1. Visual Appearance of CT–Solvent Systems
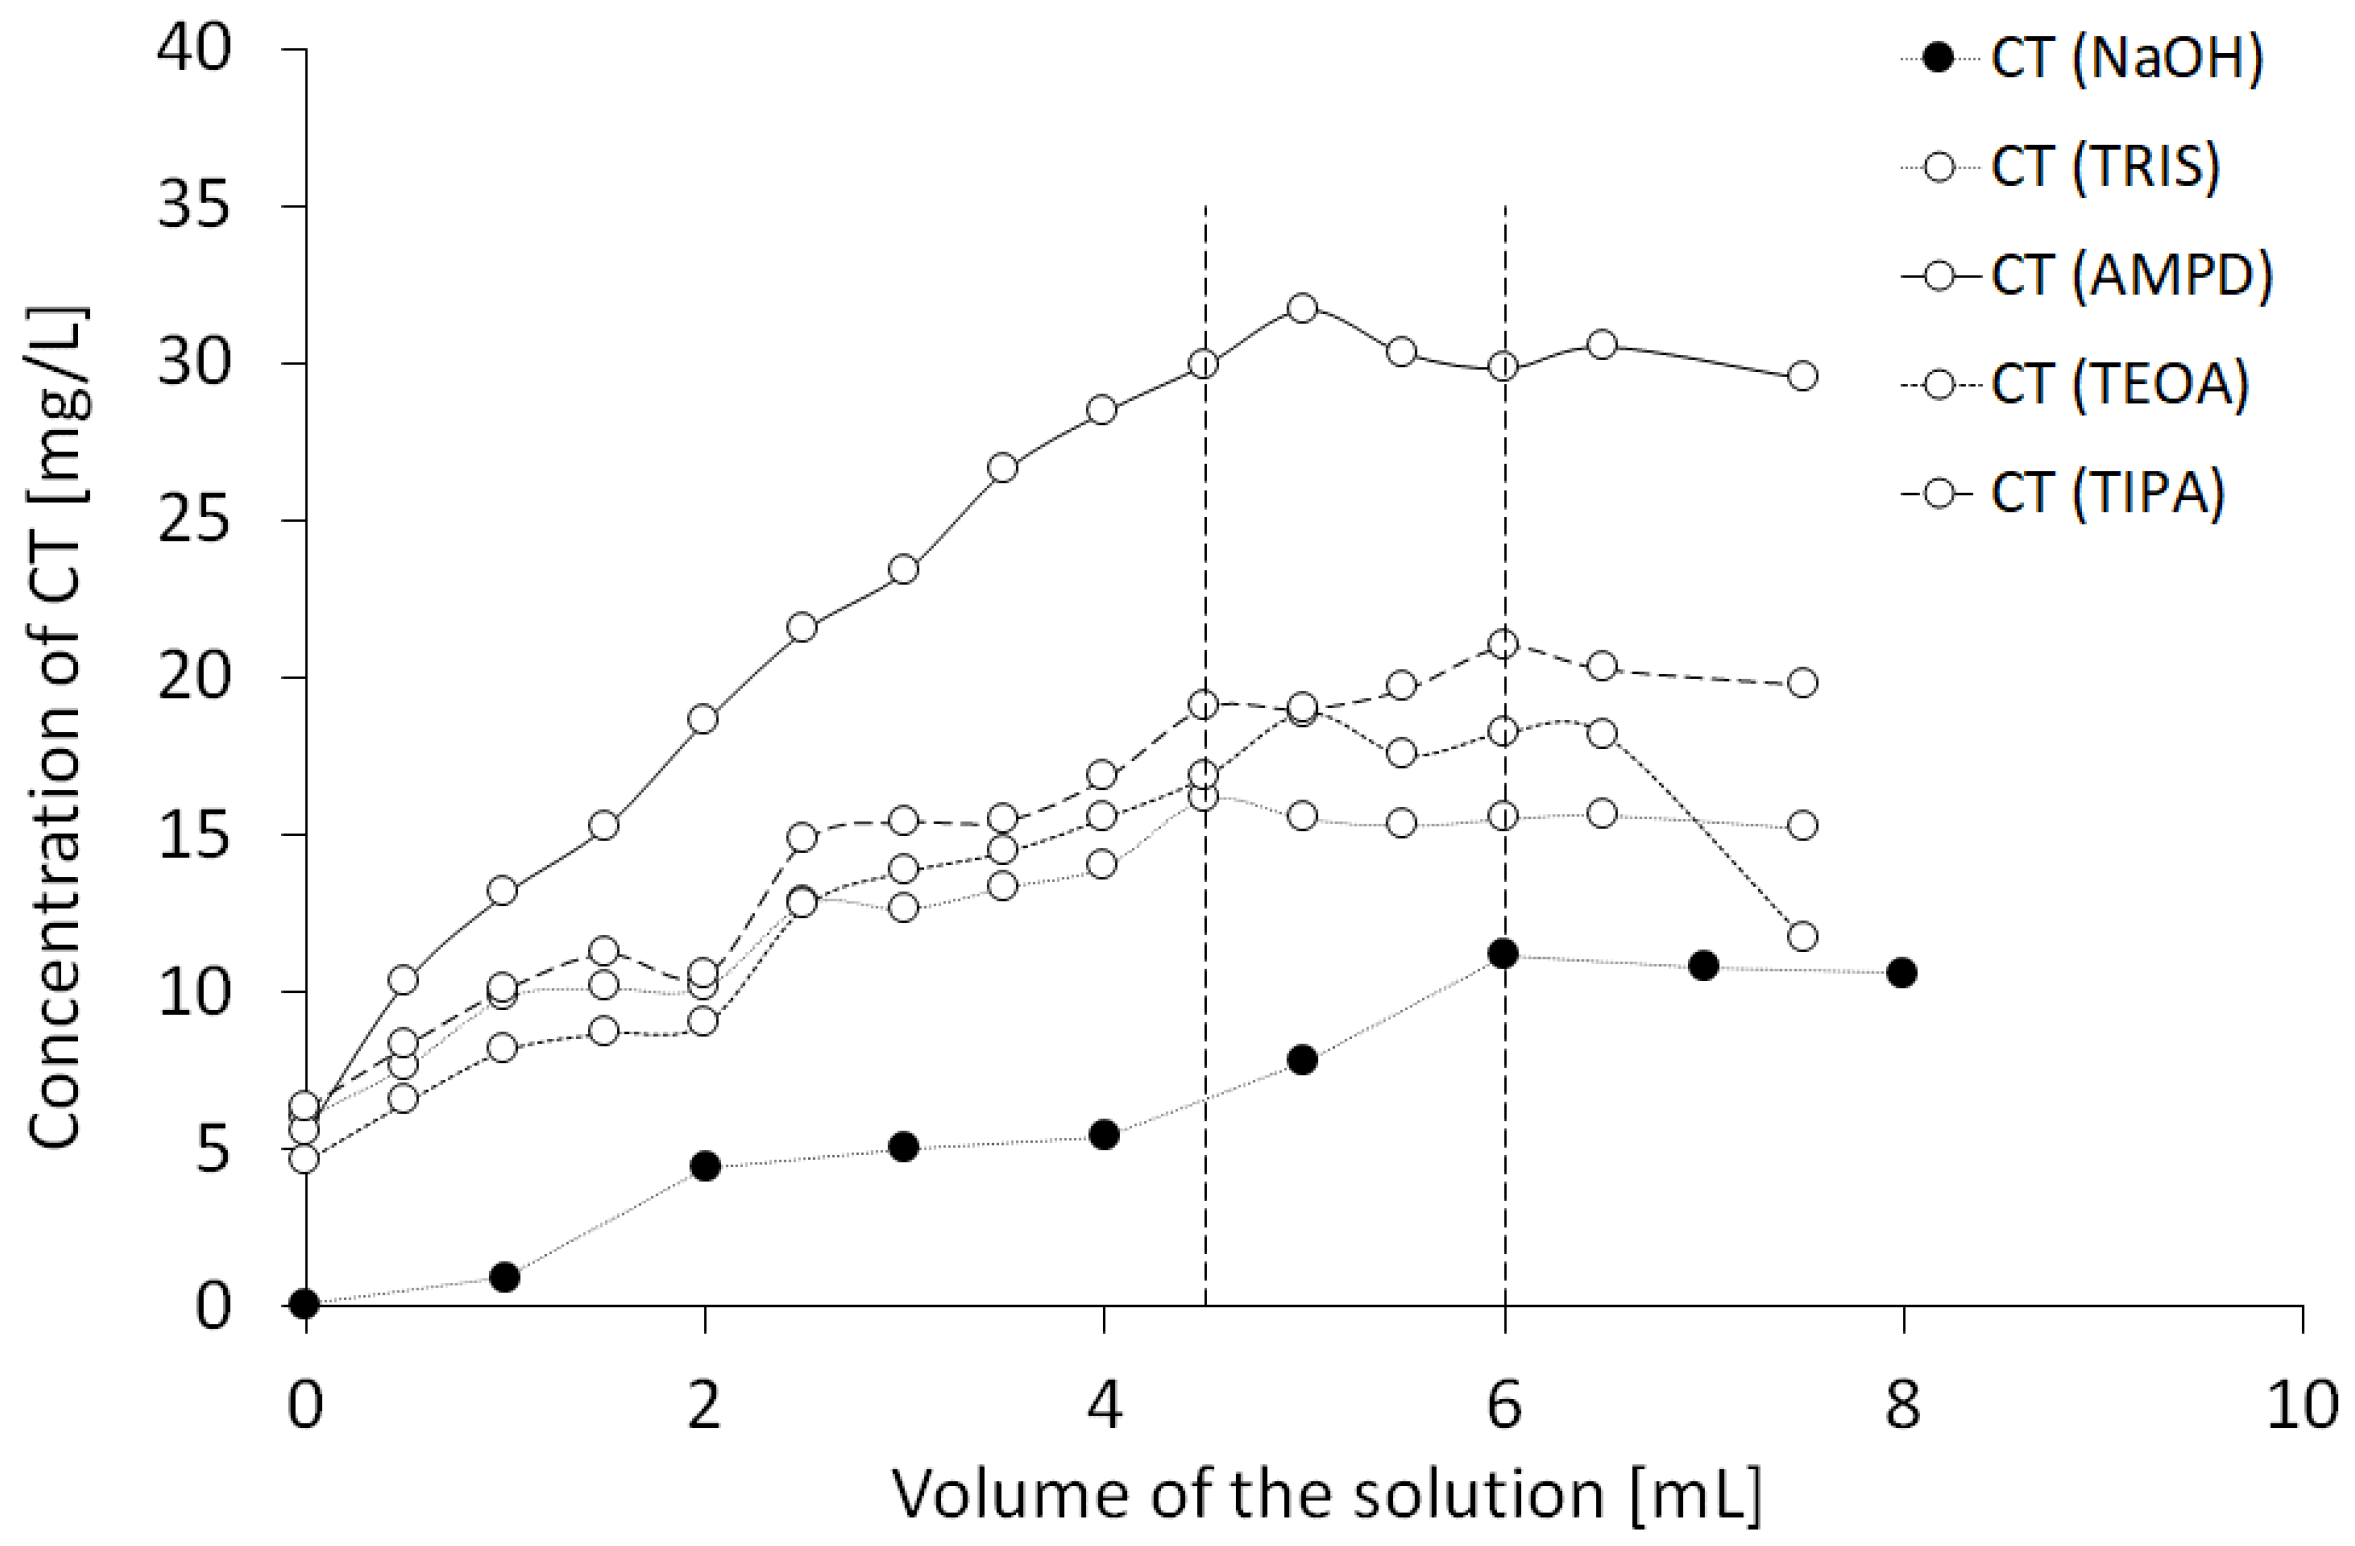
3.2. UV–Vis Spectrophotometric Evaluation of CT Solubility
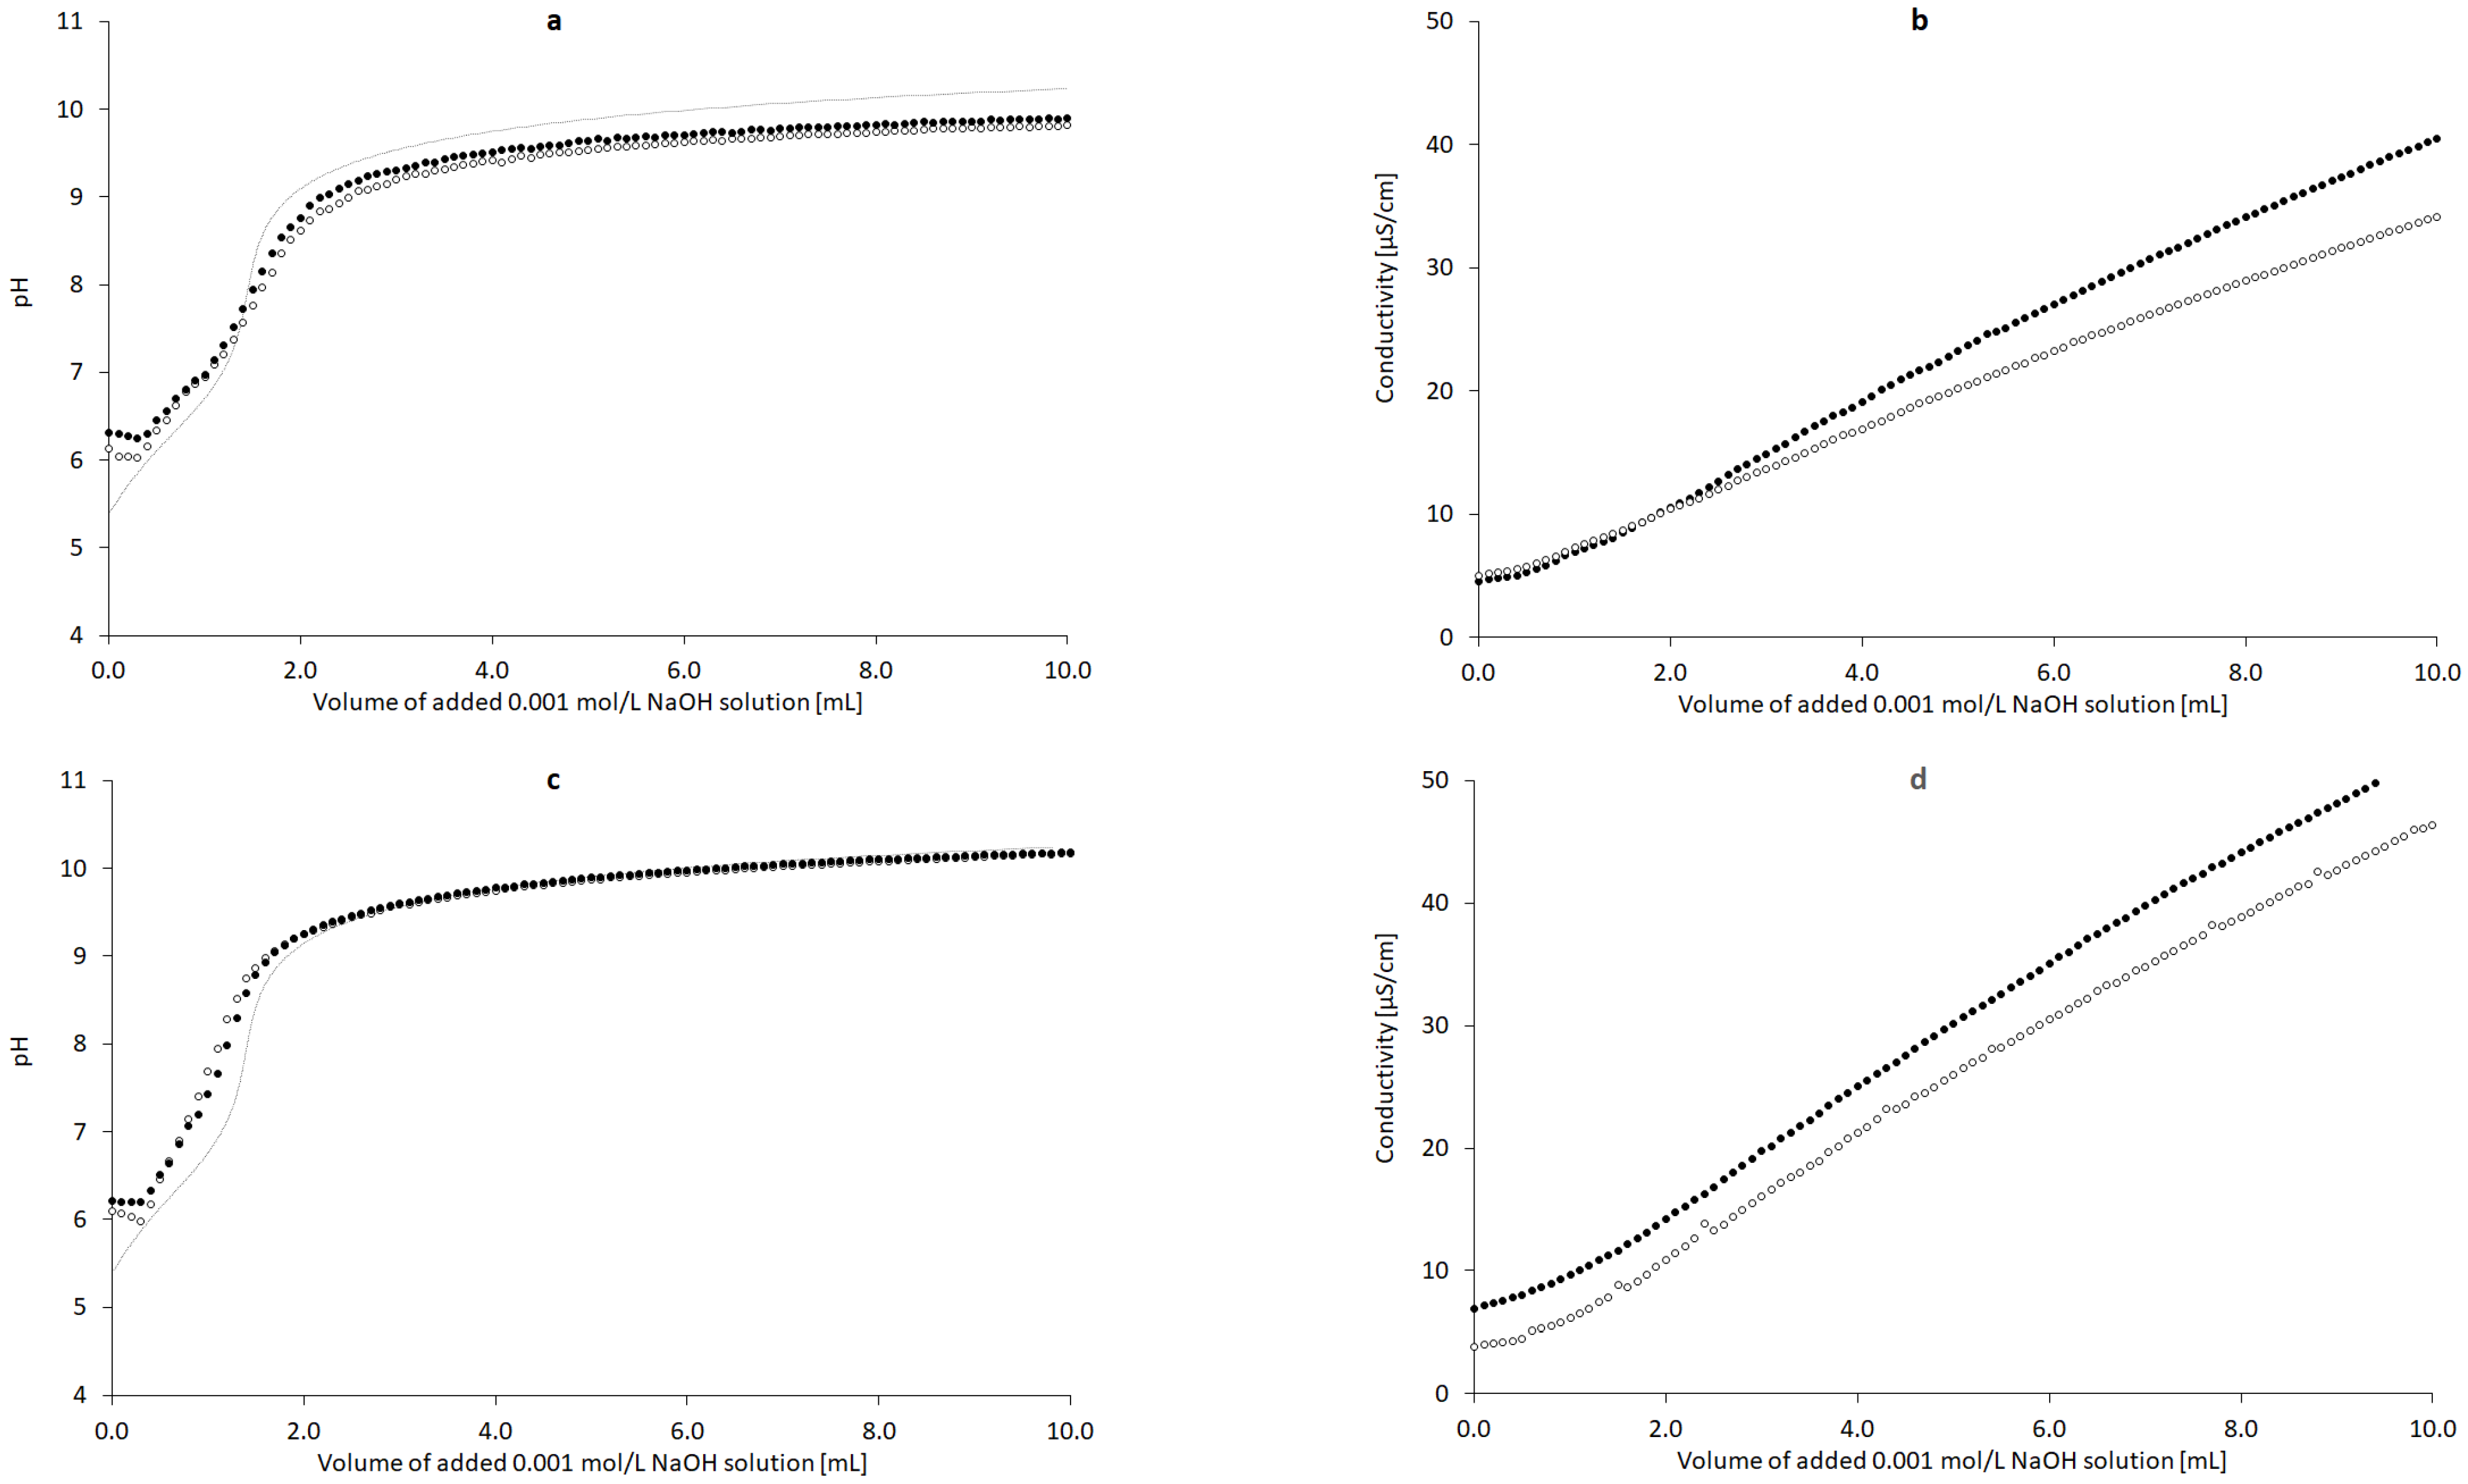
3.3. Titration Studies
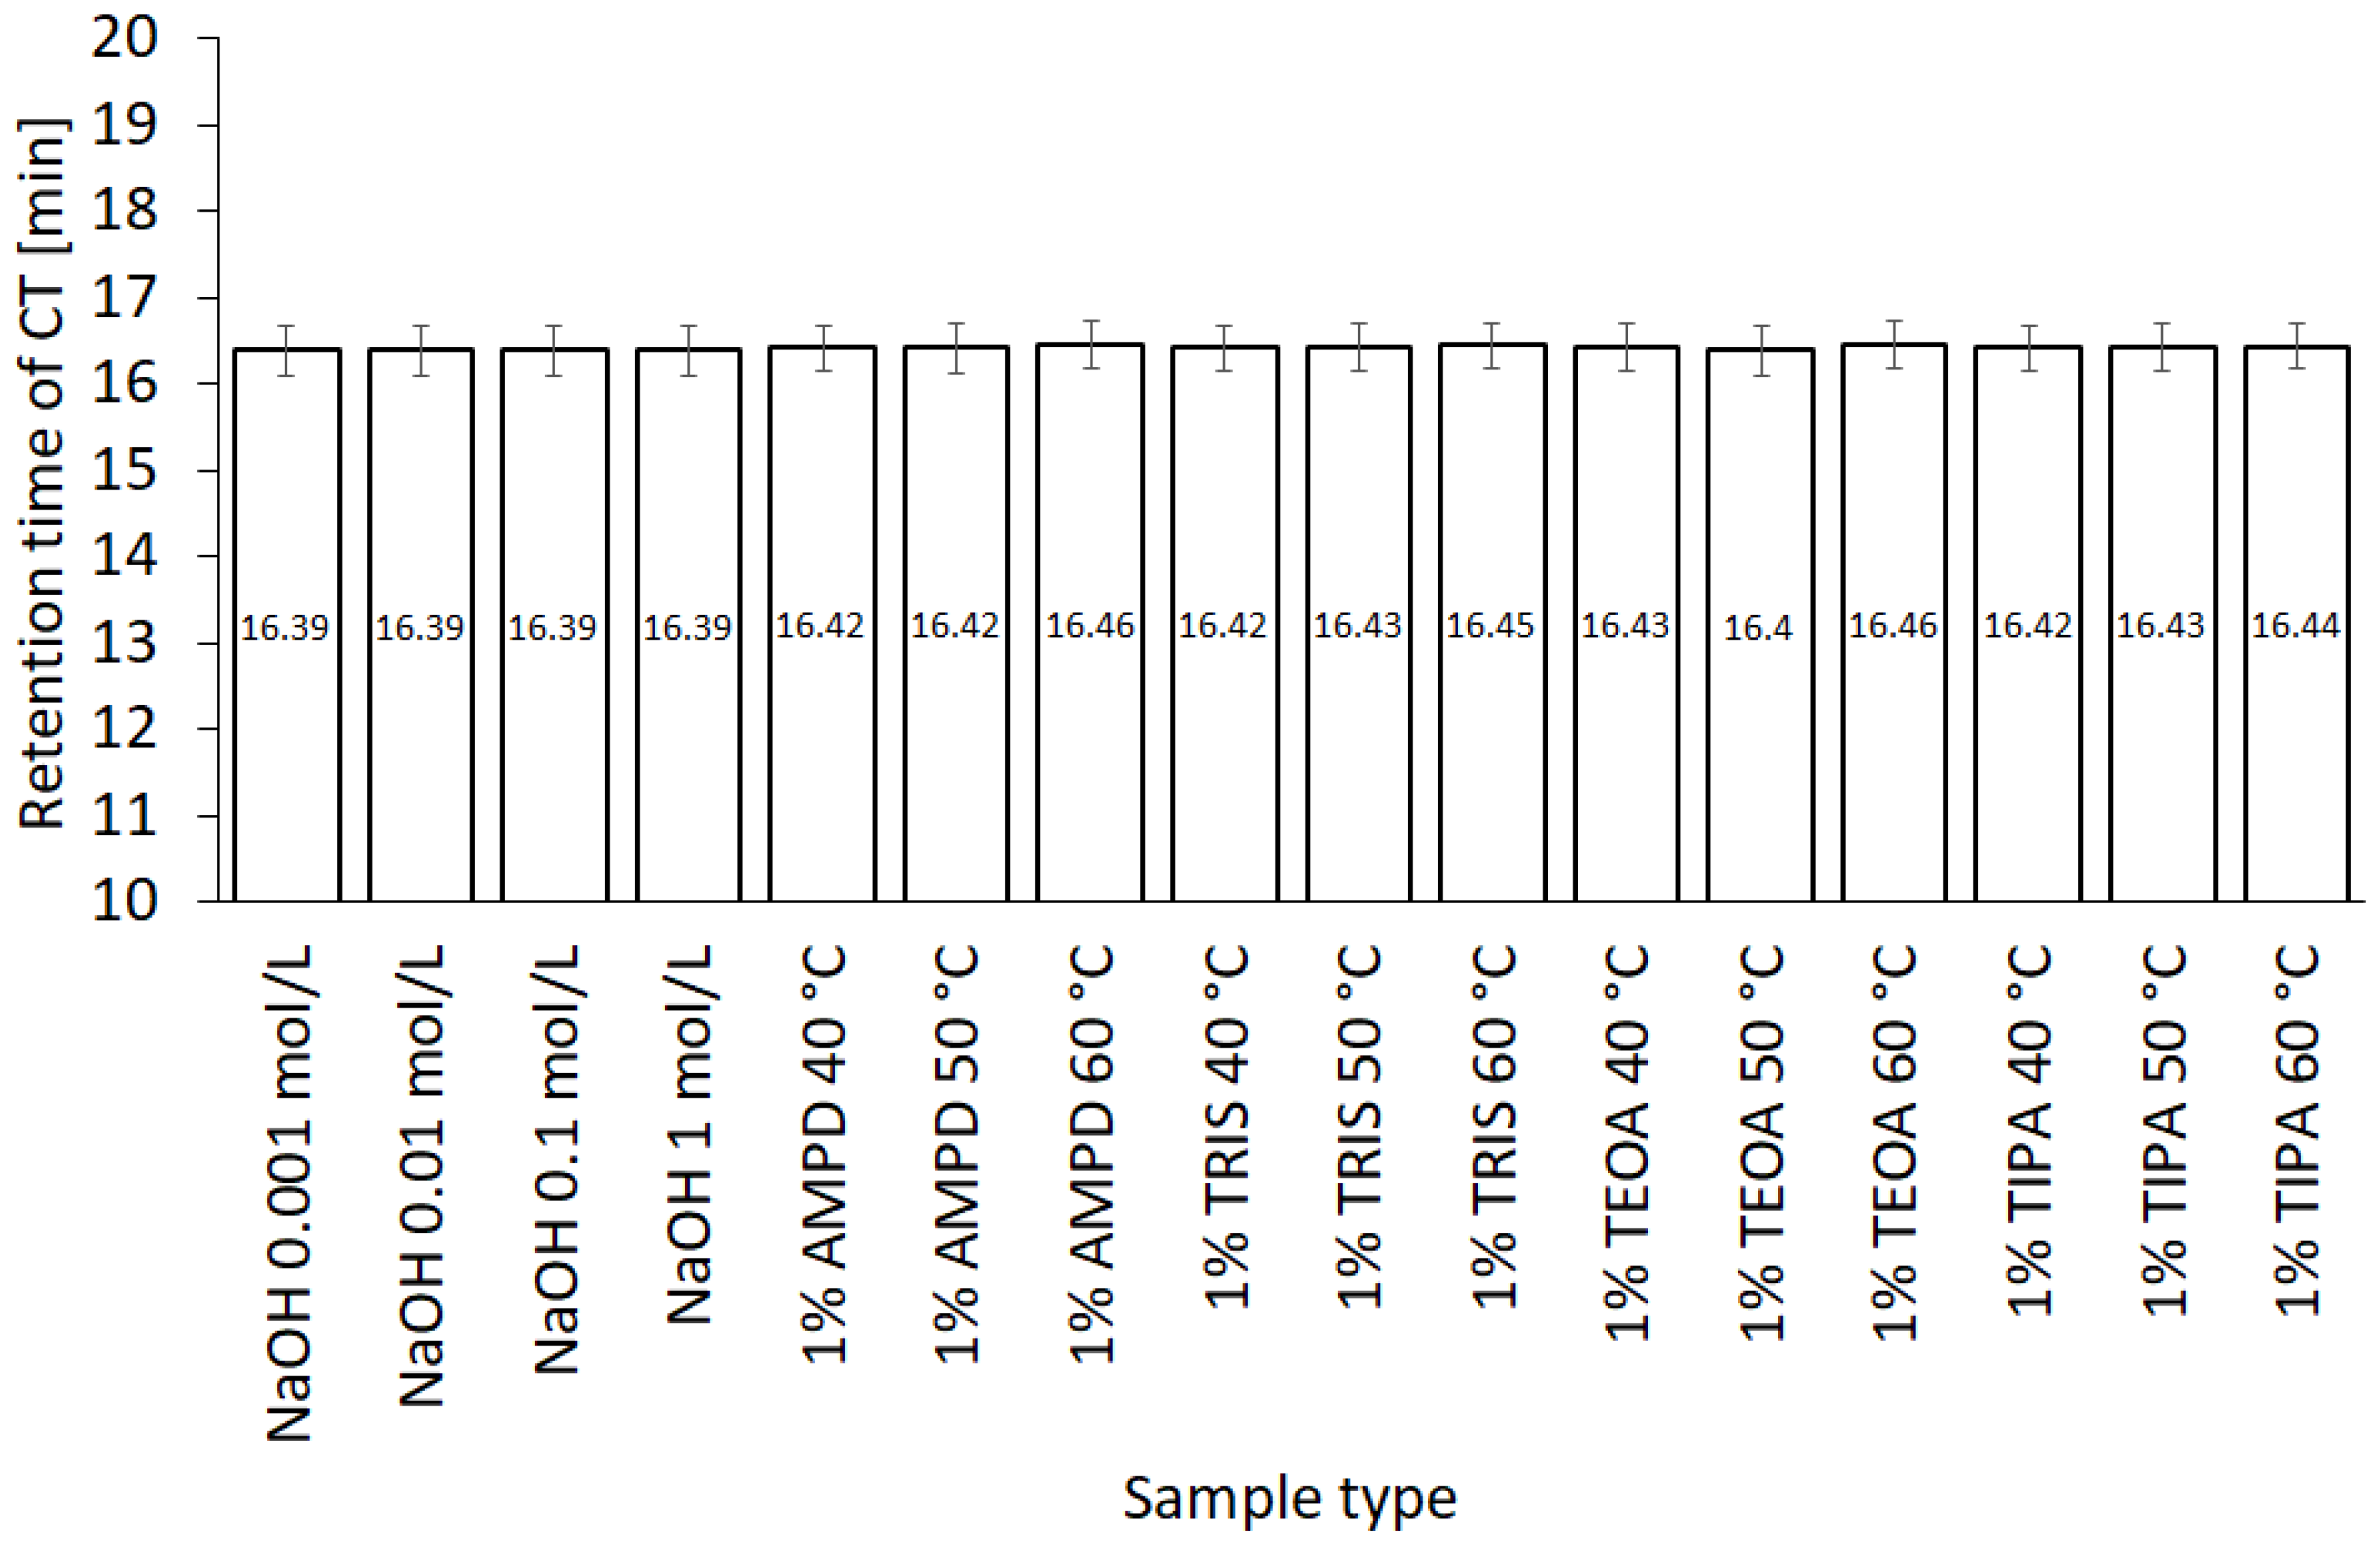
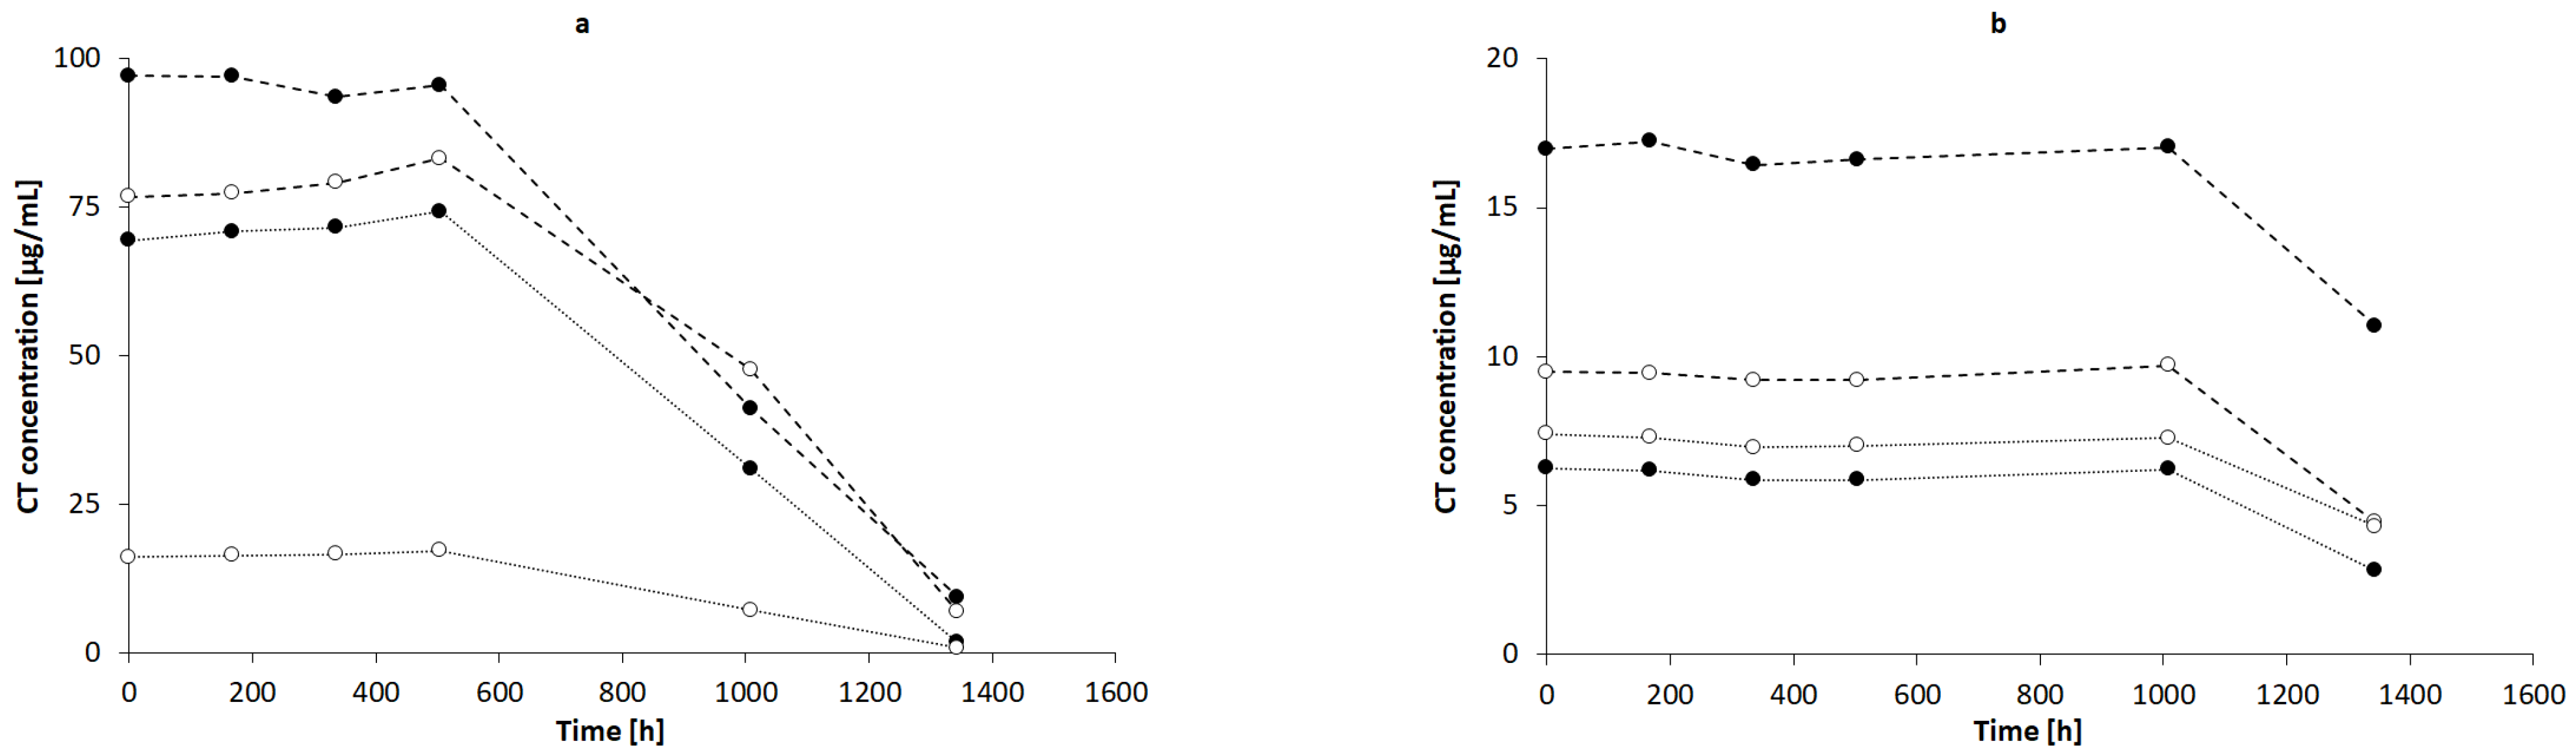
3.4. HPLC Studies
4. Discussion
4.1. Visual Results
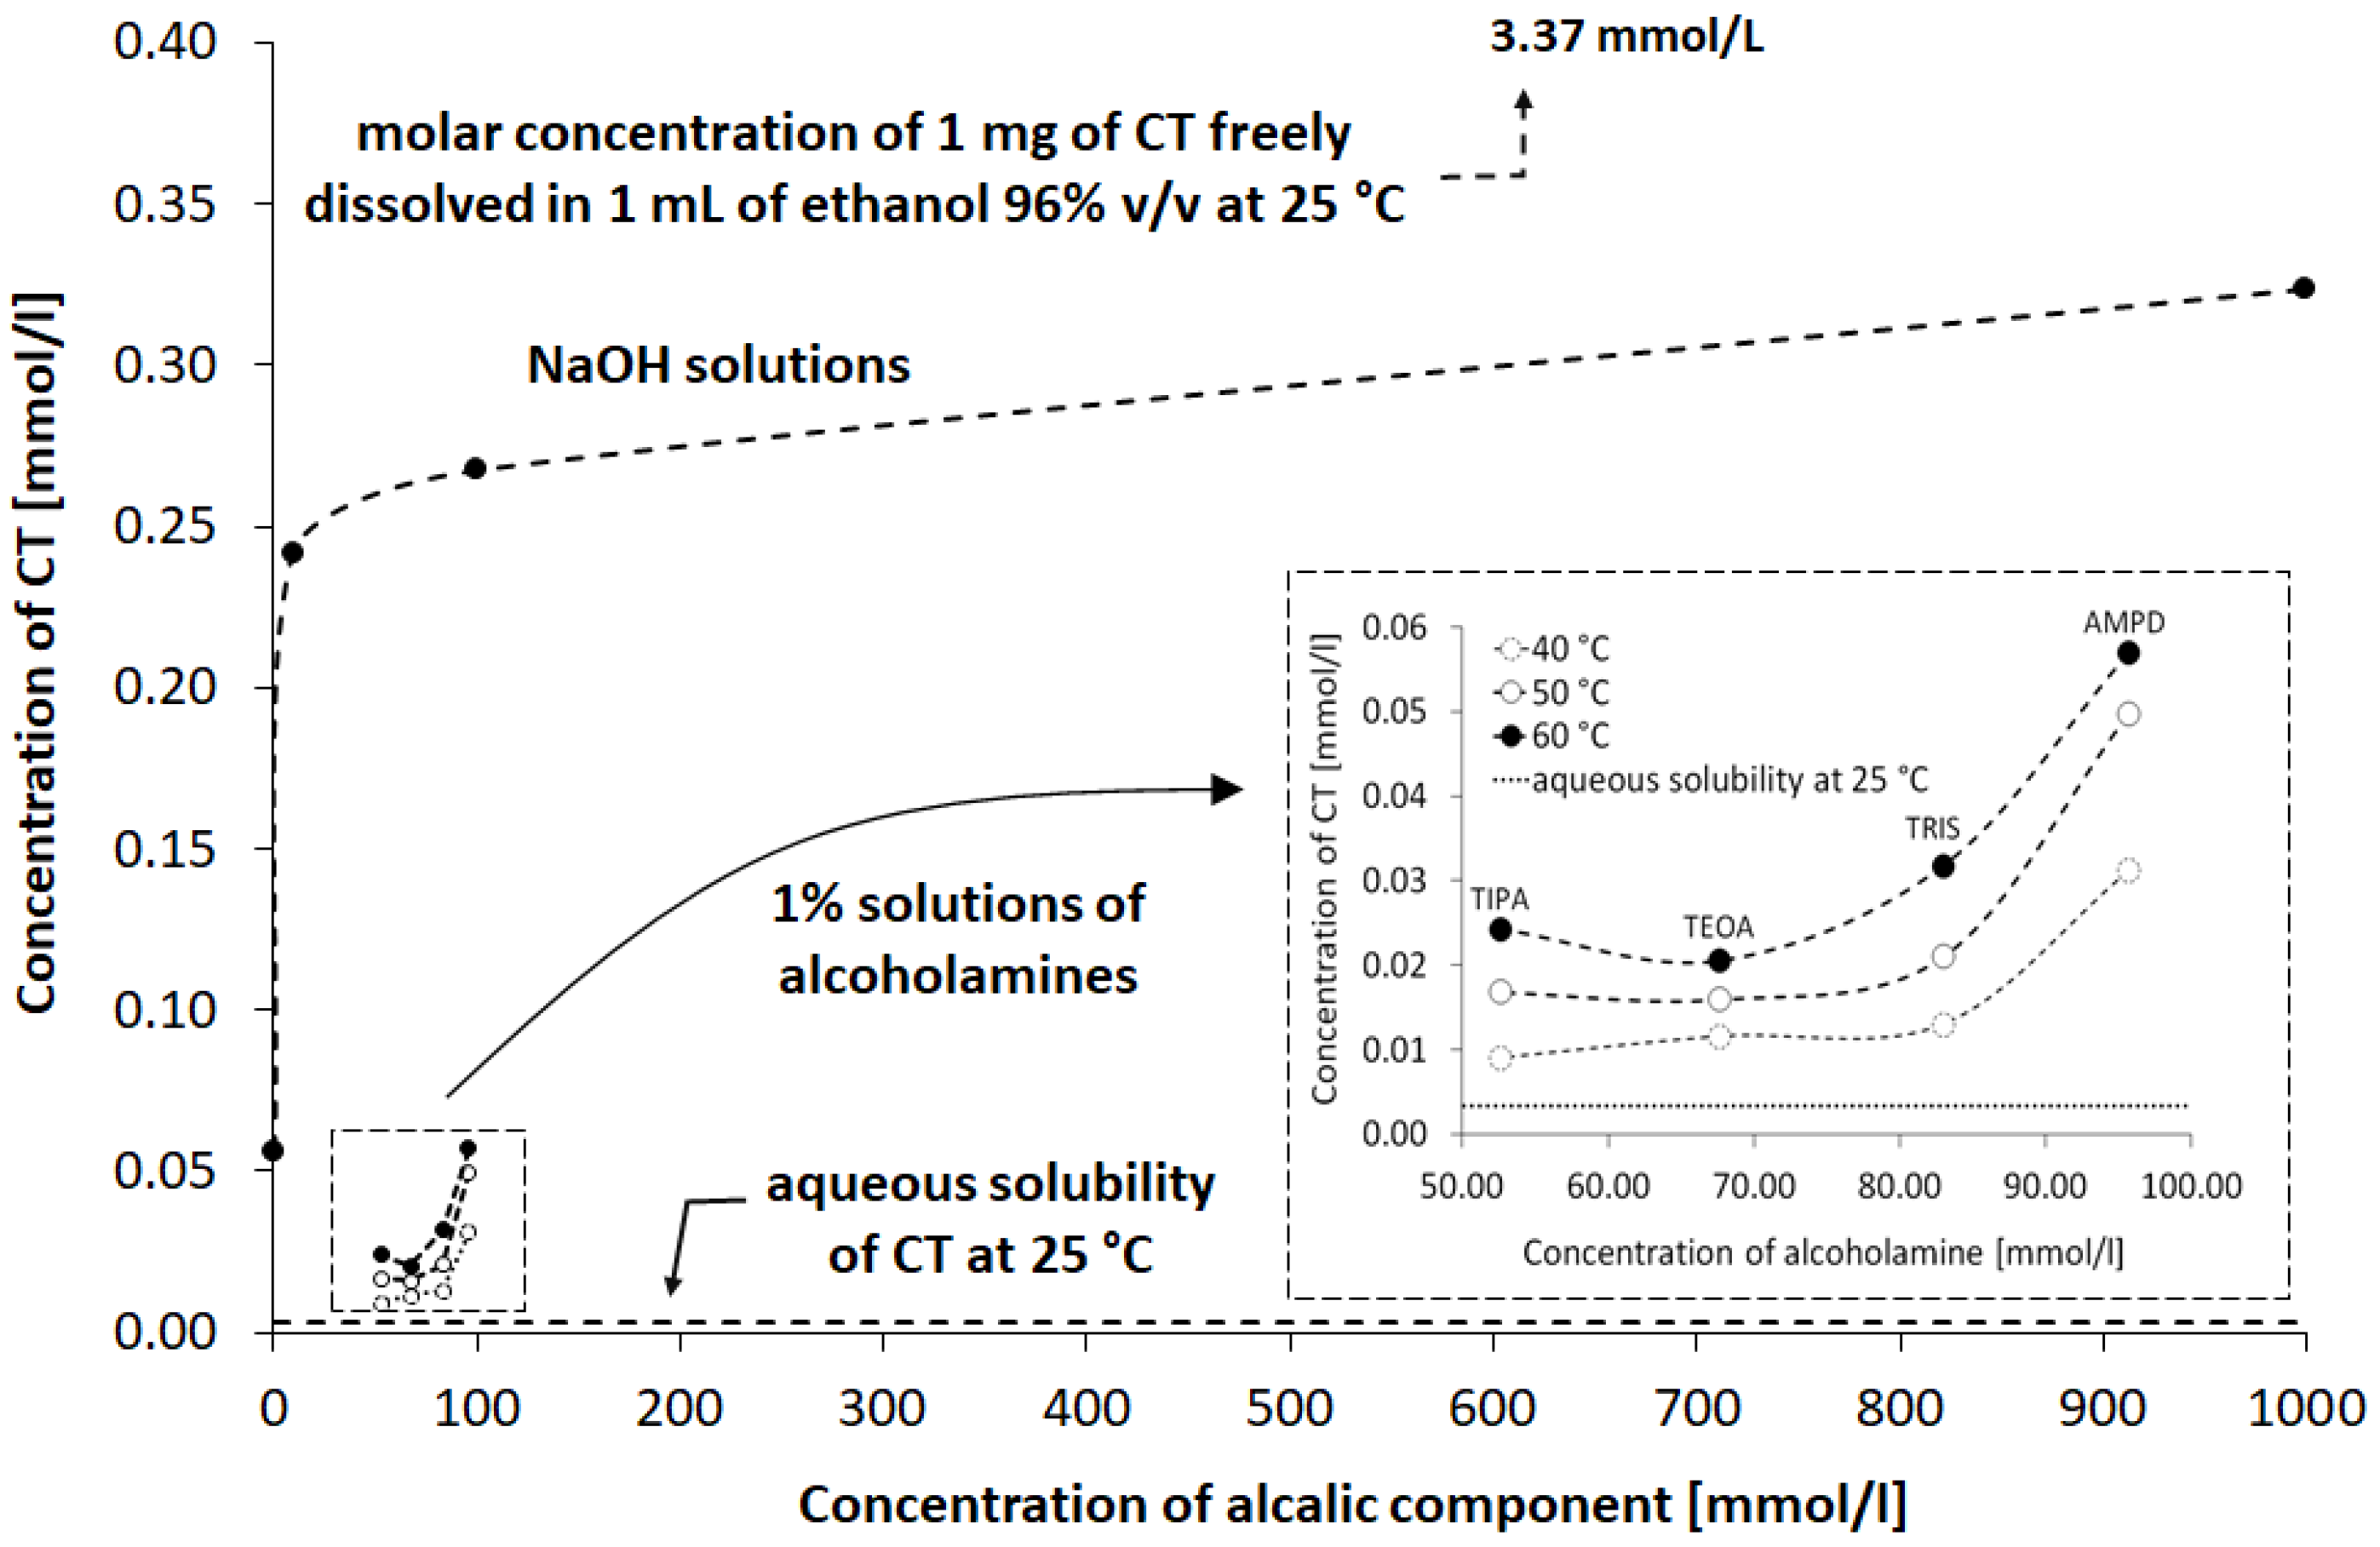
4.2. The Approximated Concentrations of CT under the Influence of Various Alkaline Solutions
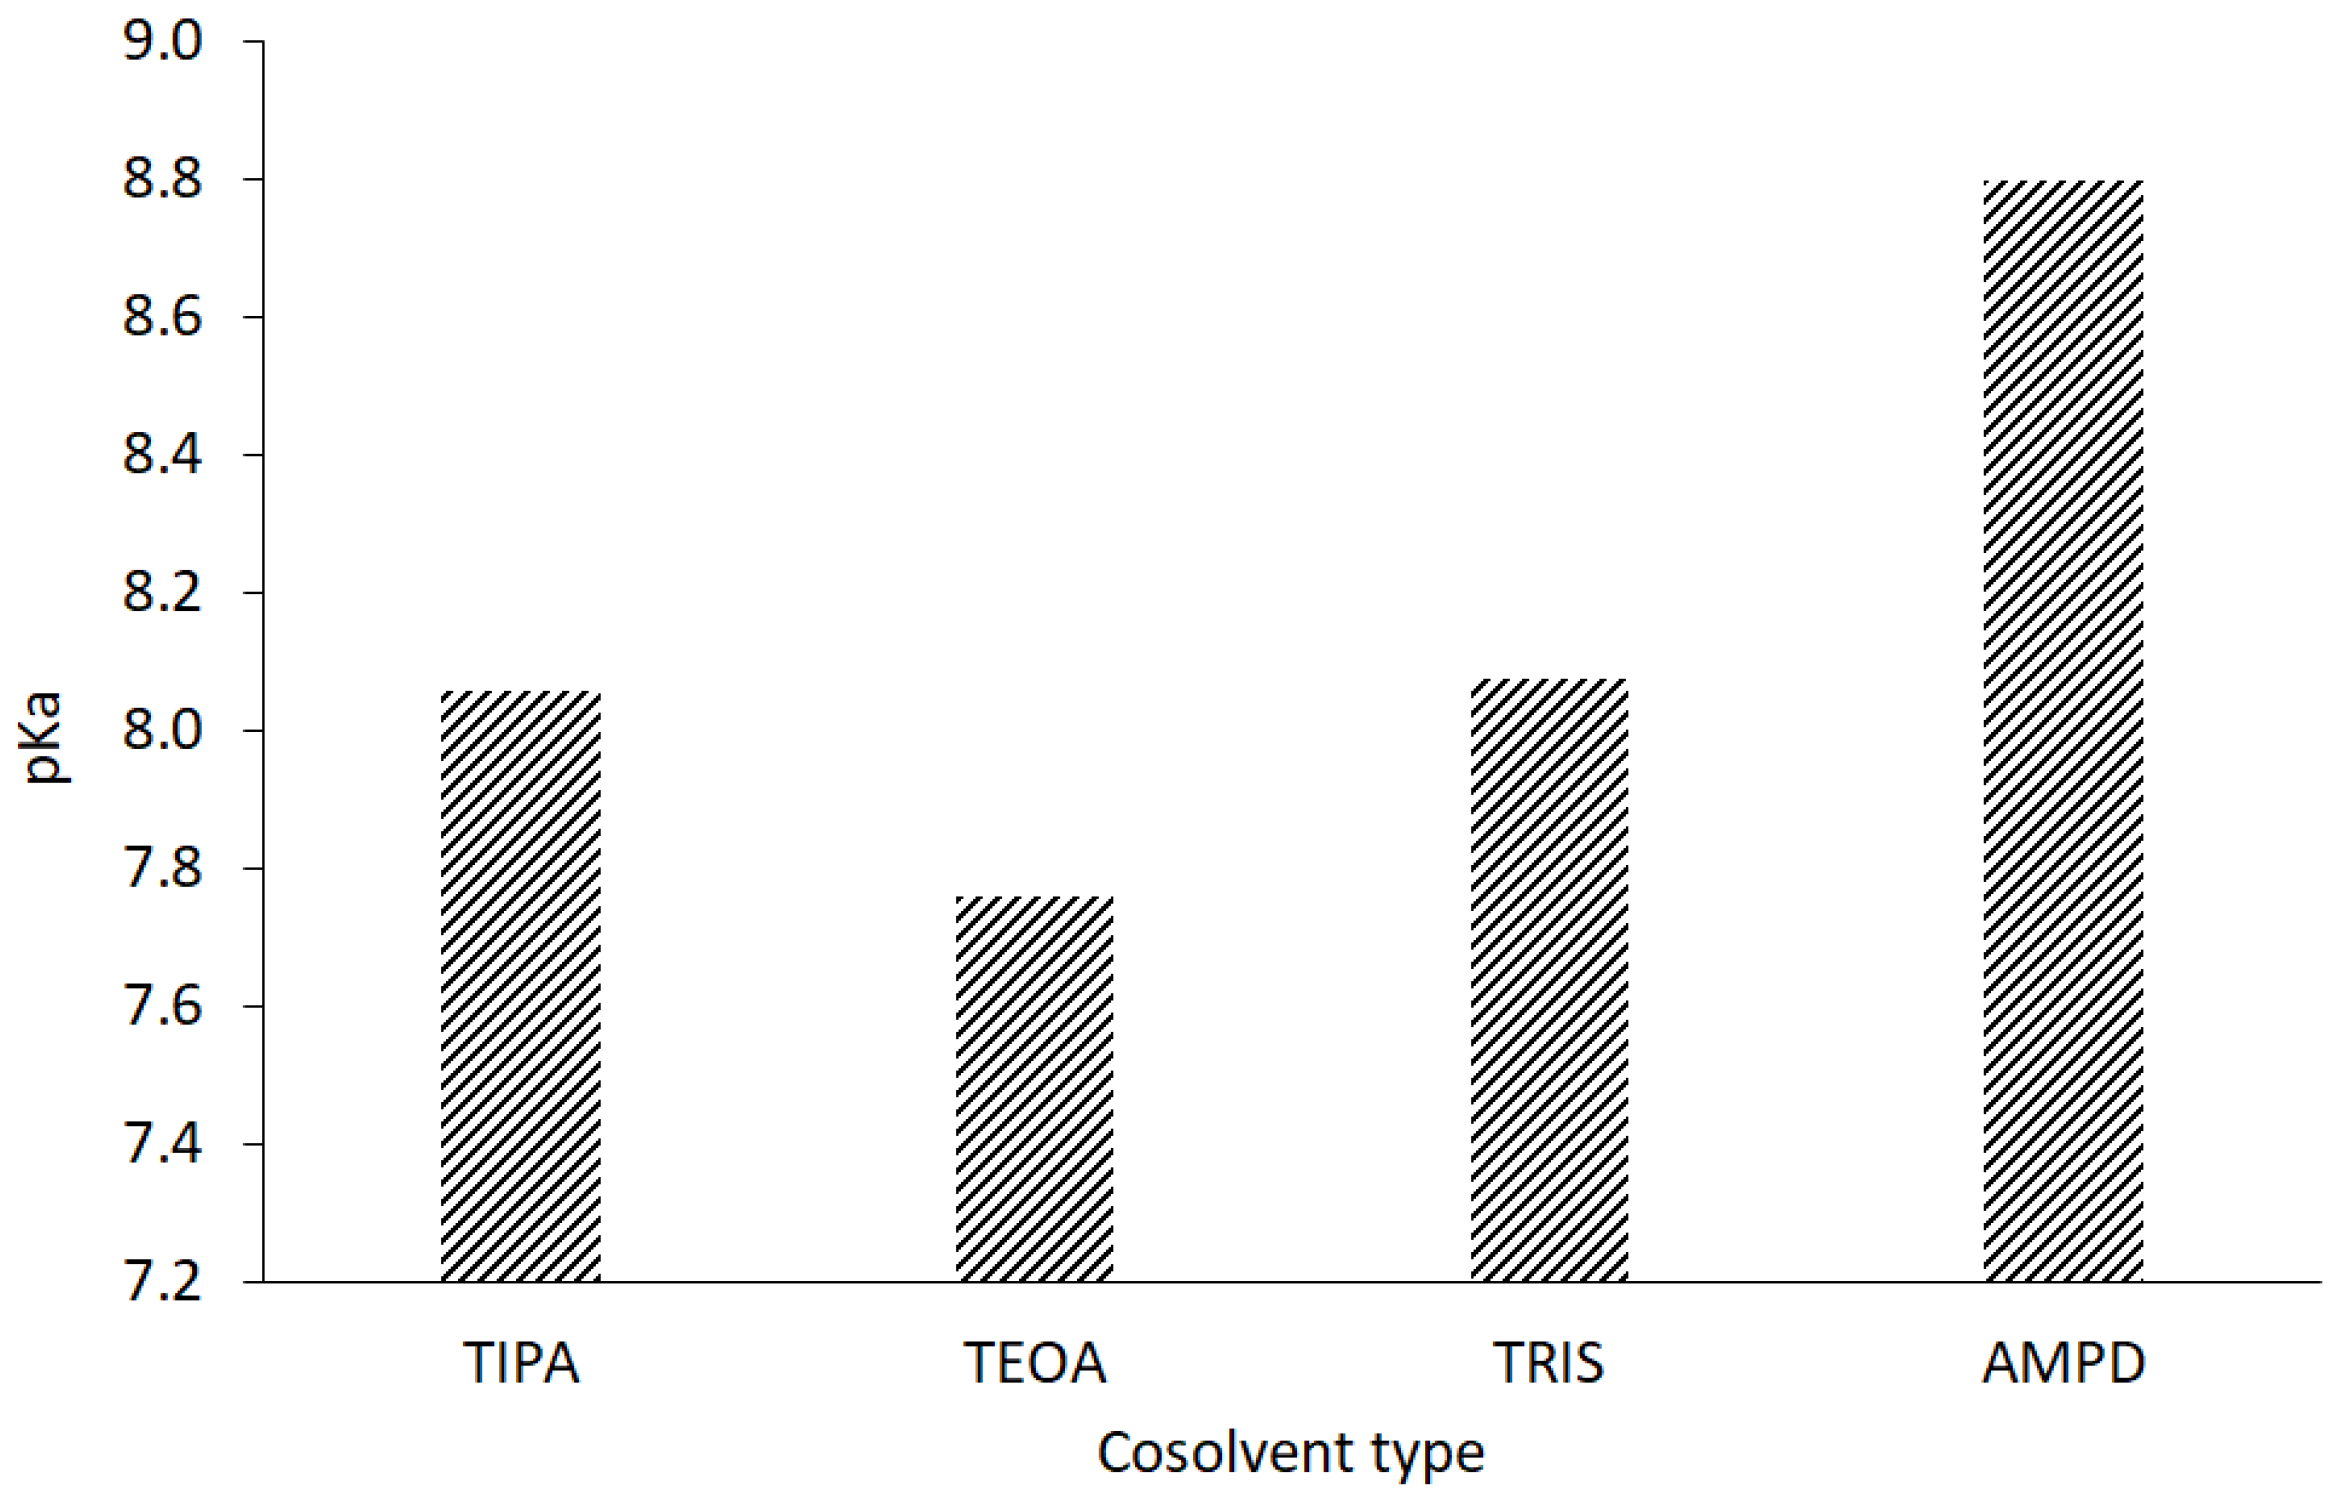
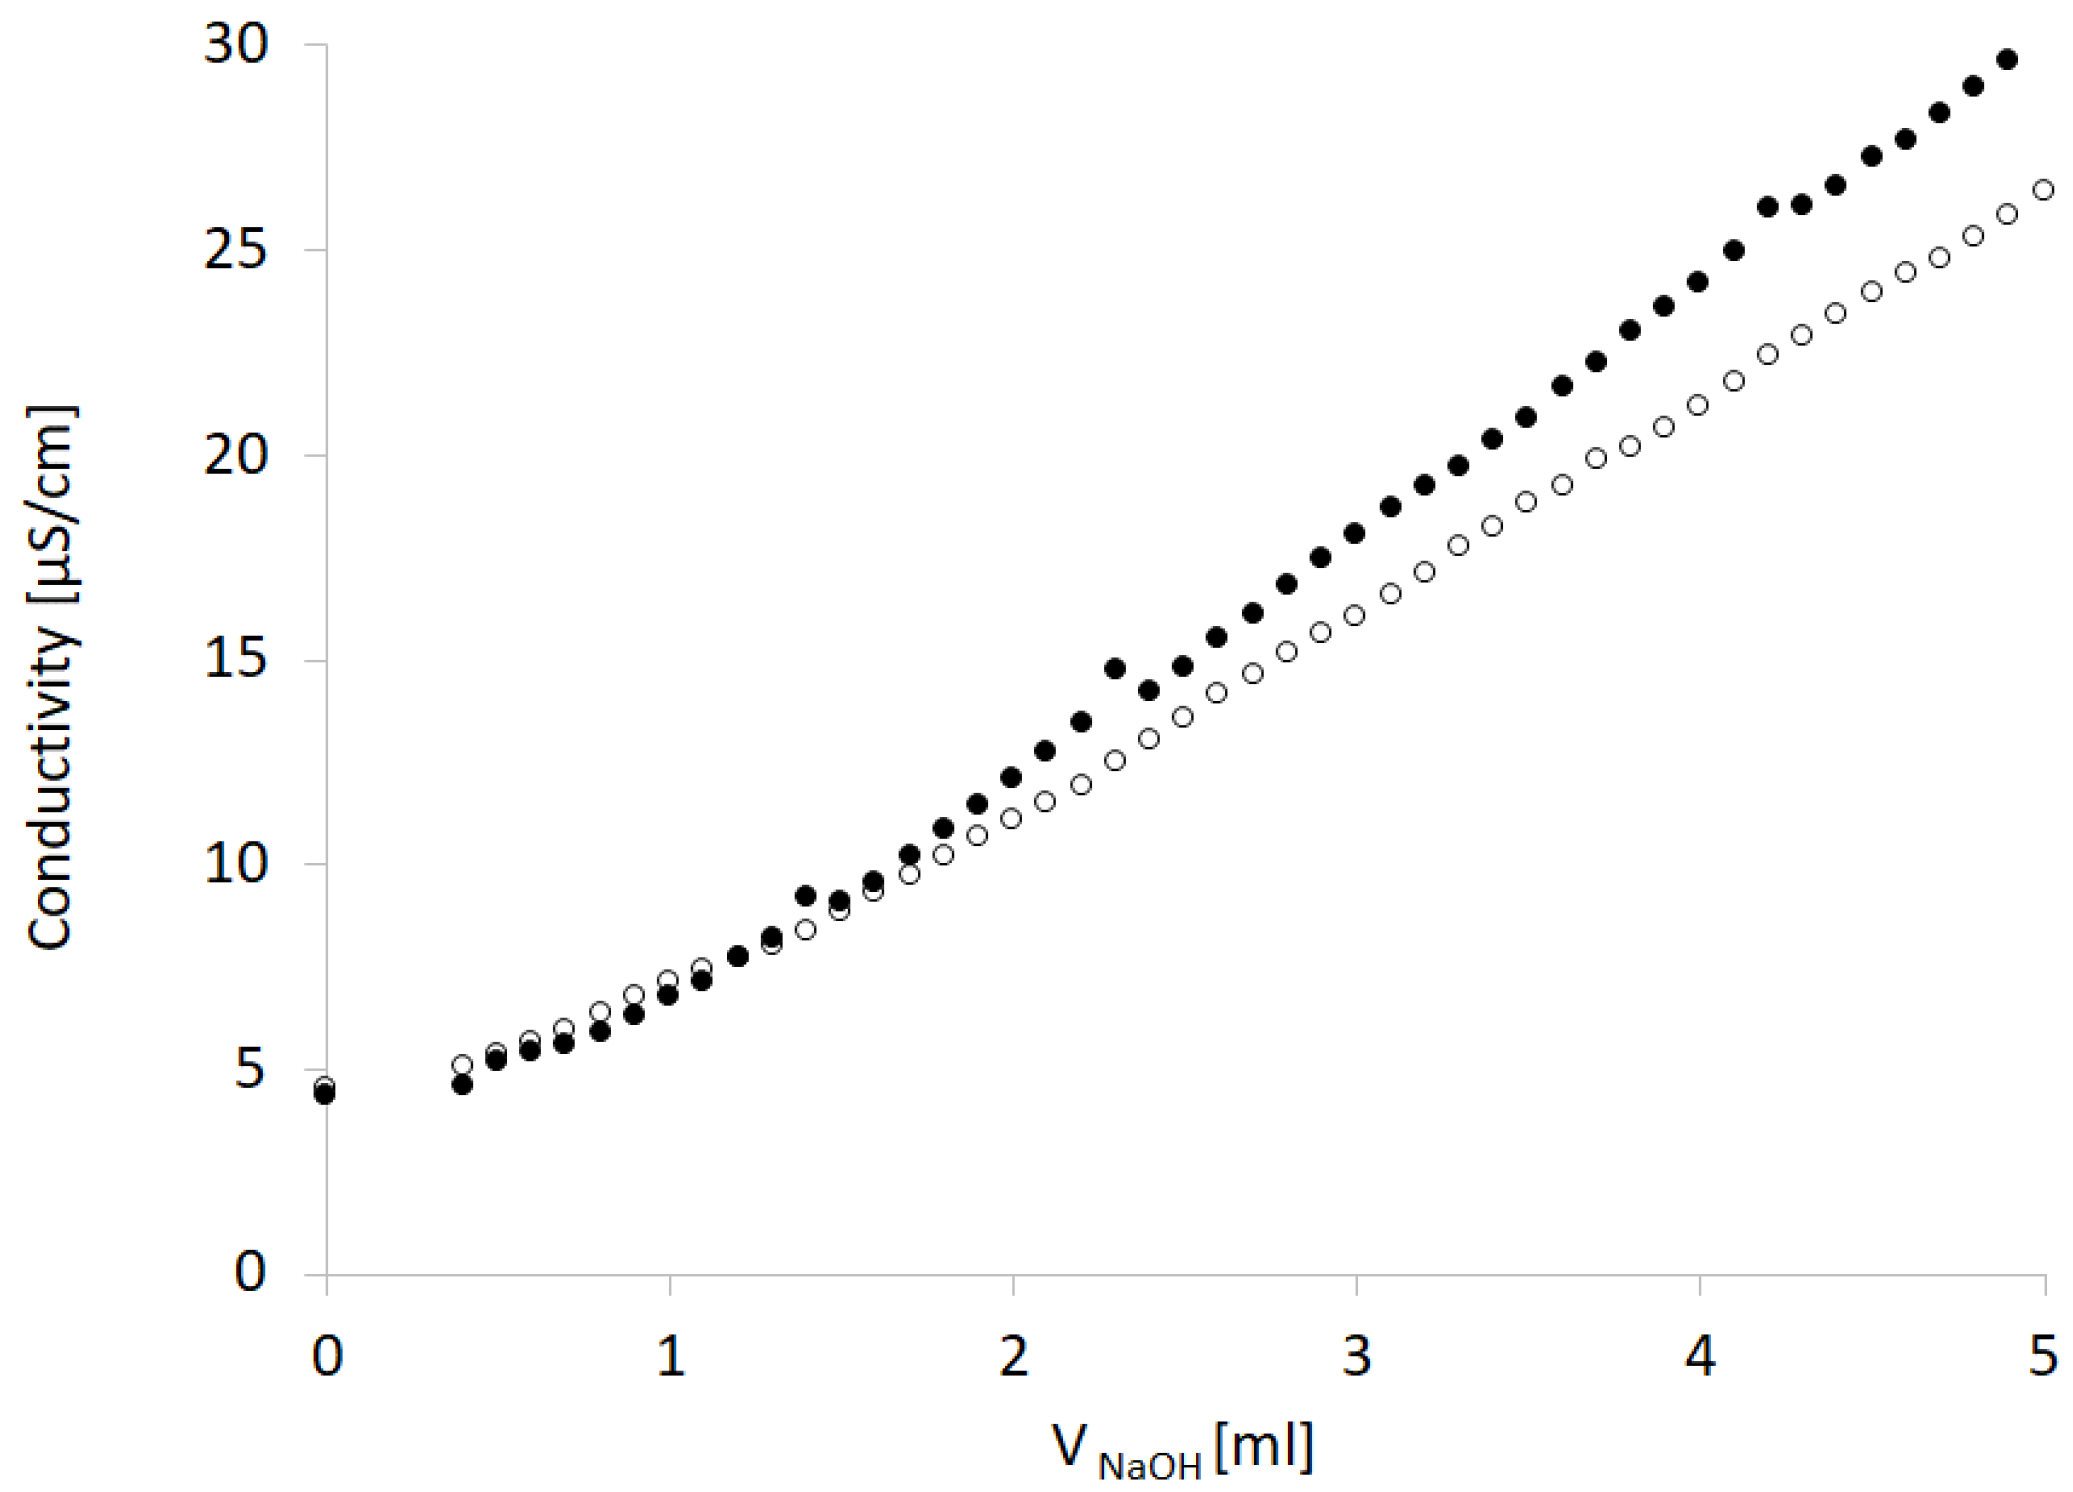
4.3. Titration Studies
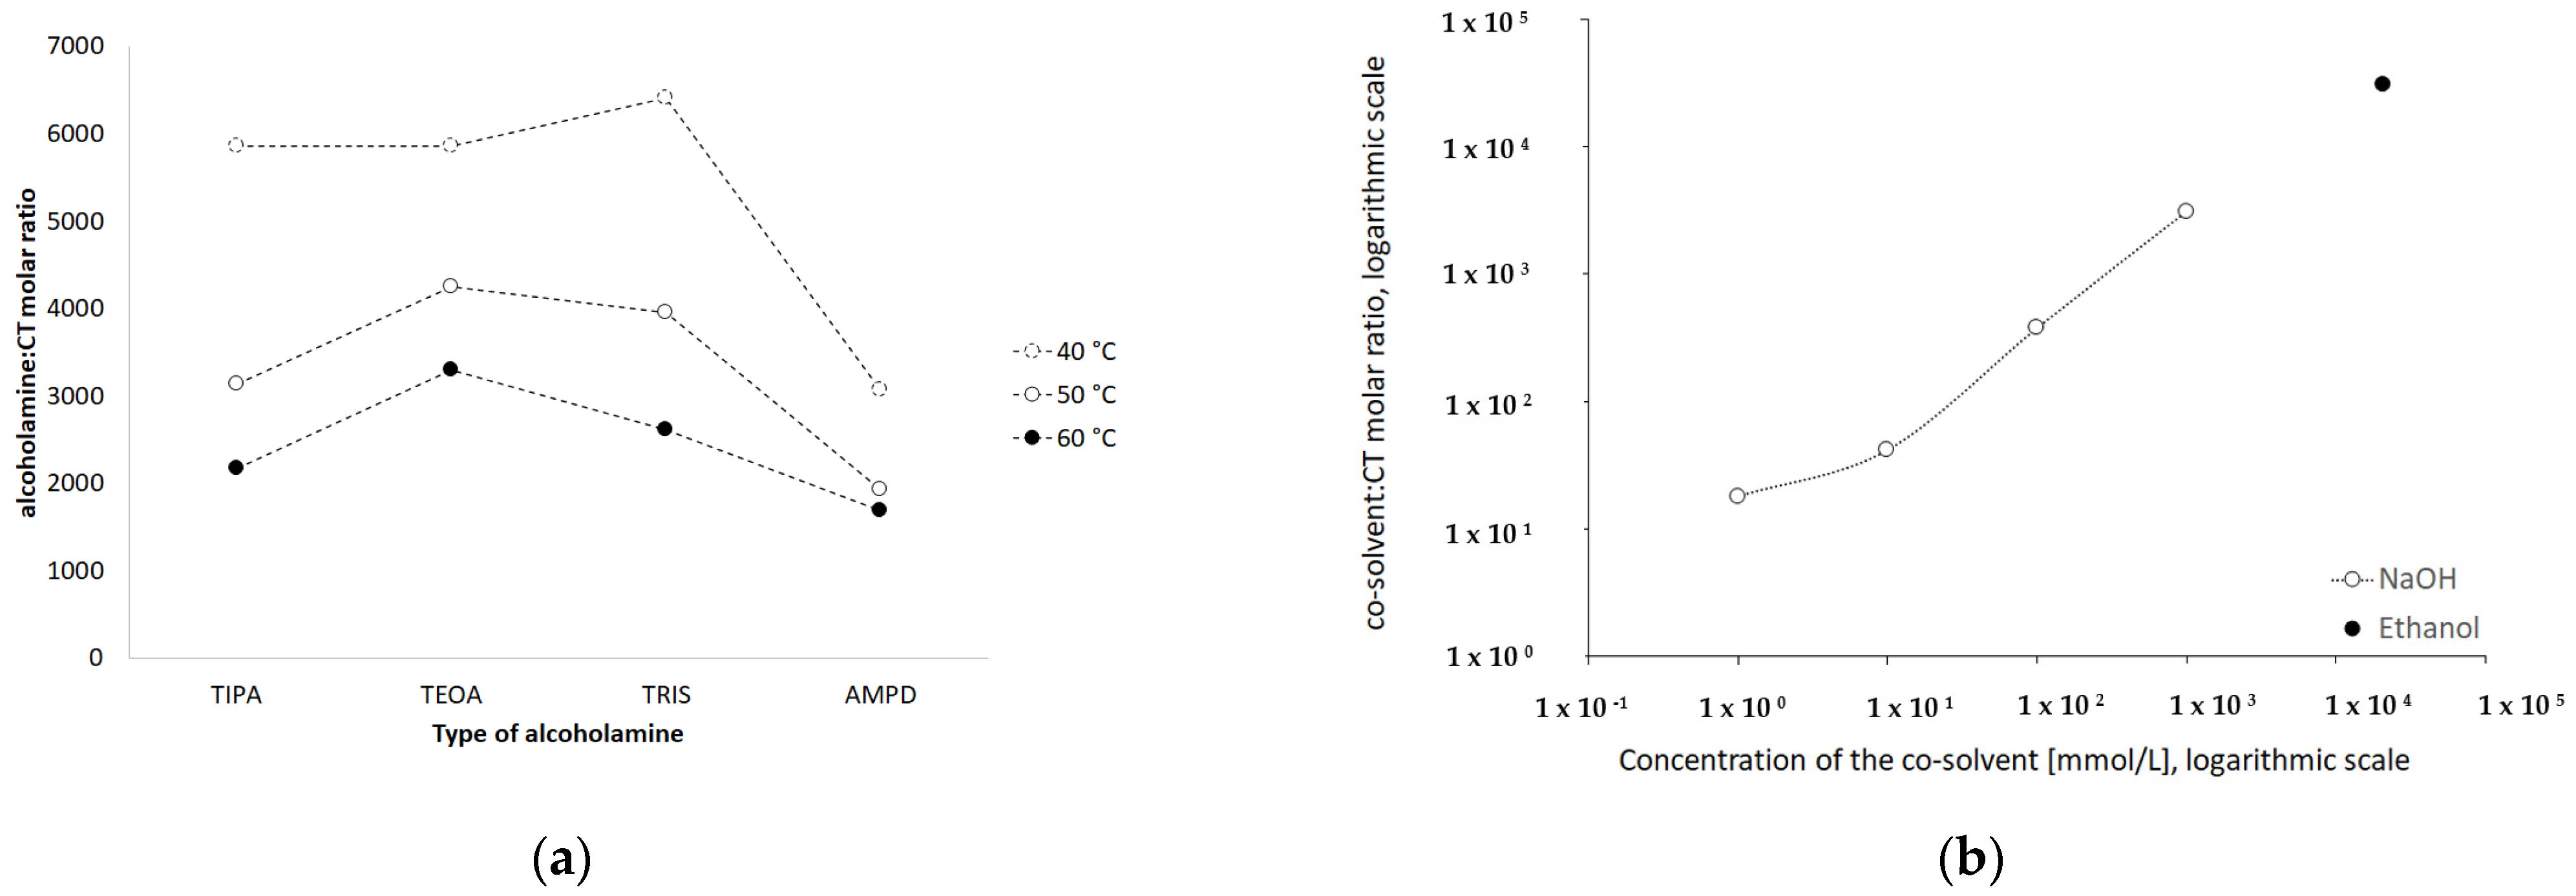
4.4. HPLC Studies
5. Conclusions
Supplementary Materials
Author Contributions
Funding
Institutional Review Board Statement
Informed Consent Statement
Data Availability Statement
Acknowledgments
Conflicts of Interest
References
- Vemula, V.R.; Lagishetty, V.; Lingala, S. Solubility enhancement techniques. Int. J. Pharmac. Sci. Rev. Res. 2010, 5, 41–51. [Google Scholar]
- Kavitha, K.; Vishva Ranjani, P. Solubility enhancement—A challenge for hydrophobic drugs. IOSR J. Pharm. Biol. Sci. 2015, 10, 50–60. [Google Scholar] [CrossRef]
- Zhang, J.; Huang, M.; Guan, S.; Bi, H.-C.; Pan, Y.; Duan, W.; Chan, S.Y.; Chen, X.; Hong, Y.-H.; Bian, J.-S.; et al. A mechanistic study of the intestinal absorption of cryptotanshinone, the major active constituent of Salvia miltiorrhiza. J. Pharmacol. Exp. Ther. 2006, 317, 1285–1294. [Google Scholar] [CrossRef]
- Chen, W.; Lu, Y.; Chen, G.; Huang, S. Molecular Evidence of Cryptotanshinone for Treatment and Prevention of Human Cancer. Anticancer Agents Med. Chem. 2013, 13, 979–987. [Google Scholar] [CrossRef]
- Xing, L.; Tan, Z.-R.; Cheng, J.-L.; Huang, W.-H.; Zhang, W.; Deng, W.; Yuan, C.-S.; Zhou, H.-H. Bioavailability and pharmacokinetic comparison of tanshinones between two formulations of Salvia miltiorrhiza in healthy volunteers. Sci. Rep. 2017, 7, 4709. [Google Scholar] [CrossRef]
- Jiang, Y.-Y.; Li, Q.; Lu, W.; Cai, J.-C. Facile and efficient total synthesis of (±)-cryptotanshinone and tanshinone IIA. Tetrahedron Lett. 2003, 44, 2073–2075. [Google Scholar] [CrossRef]
- Zhou, L.; Zuo, Z.; Chow, M.S.S. Danshen: An Overview of Its Chemistry, Pharmacology, Pharmacokinetics, and Clinical Use. J. Clin. Pharmacol. 2005, 45, 1345–1359. [Google Scholar] [CrossRef] [PubMed]
- Li, J.; Bai, Y.; Bai, Y.; Zhu, R.; Liu, W.; Cao, J.; Yan-Xu, C.; Tan, Z.; Chang, Y.-X. Pharmacokinetics of Caffeic Acid, Ferulic Acid, Formononetin, Cryptotanshinone, and Tanshinone IIA after Oral Administration of Naoxintong Capsule in Rat by HPLC-MS/MS. Evid. Based Complement Altern. Med. 2017, 2017, 9057238. [Google Scholar] [CrossRef] [PubMed]
- Liu, Z.; Xu, S.; Huang, X.; Wang, J.; Gao, S.; Li, H.; Zhou, C.; Ye, J.; Chen, S.; Jin, Z.-G.; et al. Cryptotanshinone, an orally bioactive herbal compound from Danshen, attenuates atherosclerosis in apolipoprotein E-deficient mice: Role of lectin-like oxidized LDL receptor-1 (LOX-1). Br. J. Pharmacol. 2015, 172, 5661–5675. [Google Scholar] [CrossRef]
- Zhang, Y.; Won, S.-H.; Jiang, C.; Lee, H.-J.; Jeong, S.-J.; Lee, E.-O.; Zhang, J.; Ye, M.; Kim, S.-H.; Lu, J. Tanshinones from Chinese Medicinal Herb Danshen (Salvia miltiorrhiza Bunge) Suppress Prostate Cancer Growth and Androgen Receptor Signaling. Pharm. Res. 2012, 29, 1595–1608. [Google Scholar] [CrossRef]
- Krajewska-Patan, A.; Dreger, M.; Górska-Paukszta, M.; Mścisz, A.; Mielcarek, S.; Baraniak, M.; Buchwald, W.; Marecik, R.; Grajek, W.; Mrozikiewicz, P.M. Salvia milthiorrhiza Bunge in vitro cultivation in callus cultures. Herba Pol. 2007, 53, 88–96. [Google Scholar]
- Hügel, H.M.; Jackson, N. Danshen diversity defeating dementia. Bioorg. Med. Chem. Lett. 2014, 24, 708–716. [Google Scholar] [CrossRef]
- Rimmon, A.; Vexler, A.; Berkovich, L.; Earon, G.; Ron, I.; Lev-Ari, S. Escin Chemosensitizes Human Pancreatic Cancer Cells and Inhibits the Nuclear Factor-kappaB Signaling Pathway. Biochem. Res. Int. 2013, 2013, 251752. [Google Scholar] [CrossRef]
- Guan, S.; Ma, J.; Zhang, Y.; Gao, Y.; Zhang, Y.; Zhang, X.; Wang, N.; Xie, Y.; Wang, J.; Zhang, J.; et al. Danshen (Salvia miltiorrhiza) injection suppresses kidney injury induced by iron overload in mice. PLoS ONE 2013, 8, e74318. [Google Scholar] [CrossRef]
- Xing, S.; Zhao, L.; Cao, Q. Safety Problem of Gynecological Disease Treatment Herb Danshen. Lat. Am. J. Pharm. 2017, 36, 205–208. [Google Scholar]
- Ren-An, Q.; Juan, L.; Chuyuan, L.; Wenjuan, F.; Chunyan, H.; Xuemei, Y.; Lin, H.; Hong, N. Study of the protective mechanisms of Compound Danshen Tablet (Fufang Danshen Pian) against myocardial ischemia/reperfusion injury via the Akt-eNOS signaling pathway in rats. J. Ethnopharmacol. 2014, 156, 190–198. [Google Scholar] [CrossRef]
- Jin, H.-J.; Li, C.-G. Molecular Mechanisms of Cardioprotective Actions of Tanshinones. J. Chem. 2016, 2016, 9150108. [Google Scholar] [CrossRef]
- Jin, Y.C.; Kim, C.W.; Kim, Y.M.; Nizamutdinova, I.T.; Ha, Y.M.; Kim, H.J.; Seo, H.G.; Son, K.H.; Jeon, S.J.; Kang, S.S.; et al. Cryptotanshinone, a lipophilic compound of Salvia miltiorrriza root, inhibits TNF-α-induced expression of adhesion molecules in HUVEC and attenuates rat myocardial ischemia/reperfusion injury in vivo. Eur. J. Pharmacol. 2009, 614, 91–97. [Google Scholar] [CrossRef] [PubMed]
- Ahmad, Z.; Ng, C.T.; Fong, L.Y.; Abu Bakar, N.A.; Hussain, N.H.M.; Ang, K.P.; Ee, G.C.L.; Hakim, M.N. Cryptotanshinone inhibits TNF-α-induced early atherogenic events in vitro. J. Physiol. Sci. 2016, 66, 213–220. [Google Scholar] [CrossRef] [PubMed]
- Maione, F.; Piccolo, M.; De Vita, S.; Chini, M.G.; Cristiano, C.; De Caro, C.; Lippiello, P.; Miniaci, M.C.; Santamaria, R.; Irace, C.; et al. Down regulation of pro-inflammatory pathways by tanshinone IIA and cryptotanshinone in a non-genetic mouse model of Alzheimer’s disease. Pharmacol. Res. 2018, 129, 482–490. [Google Scholar] [CrossRef] [PubMed]
- Shen, D.-Y.; Kang, J.-H.; Song, W.; Zhang, W.-Q.; Li, W.-G.; Zhao, Y.; Chen, Q.-X. Apoptosis of Human Cholangiocarcinoma Cell Lines induced by β-Escin through Mitochondrial Caspase-dependent Pathway. Phytother. Res. 2011, 25, 1519–1526. [Google Scholar] [CrossRef]
- Ling, W.; Xuehua, J.; Weijuan, X.; Chenrui, L. Complexation of tanshinone IIA with 2-hydroxypropyl-beta-cyclodextrin: Effect on aqueous solubility, dissolution rate, and intestinal absorption behavior in rats. Int. J. Pharm. 2007, 341, 58–67. [Google Scholar] [CrossRef]
- Chen, Z.; Zhu, R.; Zheng, J.; Chen, C.; Huang, C.; Ma, J.; Xu, C.; Zhai, W.; Zheng, J. Cryptotanshinone inhibits proliferation yet induces apoptosis by suppressing STAT3 signals in renal cell carcinoma. Oncotarget 2017, 8, 50023–50033. [Google Scholar] [CrossRef]
- Cha, J.-D.; Jeong, M.-R.; Choi, K.-M.; Park, J.-H.; Cha, S.-M.; Lee, K.-Y. Synergistic effect between cryptotanshinone and antibiotics in oral pathogenic bacteria. Adv. Biosci. Biotechnol. 2013, 4, 283–294. [Google Scholar] [CrossRef]
- Lee, D.-S.; Lee, S.-H.; Noh, J.-G.; Hong, S.-D. Antibacterial Activities of Cryptotanshinone and Dihydrotanshinone I from a Medicinal Herb, Salvia miltiorrhiza Bunge. Biosci. Biotechnol. Biochem. 1999, 63, 2236–2239. [Google Scholar] [CrossRef]
- Wang, D.; Zhang, W.; Wang, T.; Li, N.; Mu, H.; Zhang, J.; Duan, J. Unveiling the mode of action of two antibacterial tanshinone derivatives. Int. J. Mol. Sci. 2015, 16, 17668–17681. [Google Scholar] [CrossRef]
- Yu, H.; Subedi, R.K.; Nepal, P.R.; Kim, Y.G.; Choi, H.K. Enhancement of solubility and dissolution rate of cryptotanshinone, tanshinone i and tanshinone IIA extracted from Salvia miltiorrhiza. Arch. Pharm. Res. 2012, 35, 1457–1464. [Google Scholar] [CrossRef]
- Kakisawa, H.; Inouye, Y. Total Syntheses of Tanshinone-I, Tanshinone-II and Cryptotanshinone. Chem. Commun. 1968, 21, 1327. [Google Scholar] [CrossRef]
- Zhai, X.; Li, C.; Lenon, G.B.; Xue, C.C.L.; Li, W. Preparation and characterisation of solid dispersions of tanshinone IIA, cryptotanshinone and total tanshinones. Asian J. Pharm. Sci. 2017, 12, 85–97. [Google Scholar] [CrossRef]
- Hu, L.; Xing, Q.; Meng, J.; Shang, C. Preparation and enhanced oral bioavailability of cryptotanshinone-loaded solid lipid nanoparticles. AAPS PharmSciTech 2010, 11, 582–587. [Google Scholar] [CrossRef]
- Yu, Z.; Lv, H.; Han, G.; Ma, K. Ethosomes Loaded with Cryptotanshinone for Acne Treatment through Topical Gel Formulation. PLoS ONE 2016, 11, e0159967. [Google Scholar] [CrossRef]
- Wang, Z.; Liu, L.; Xiang, S.; Jiang, C.; Wu, W.; Ruan, S.; Du, Q.; Chen, T.; Xue, Y.; Chen, H.; et al. Formulation and Characterization of a 3D-Printed Cryptotanshinone-Loaded Niosomal Hydrogel for Topical Therapy of Acne. AAPS PharmSciTech 2020, 21, 159. [Google Scholar] [CrossRef]
- Zuo, T.; Chen, H.; Xiang, S.; Hong, J.; Cao, S.; Weng, L.; Zhang, L.; Liu, L.; Li, H.; Zhu, H.; et al. Cryptotanshinone-Loaded Cerasomes Formulation: In Vitro Drug Release, In Vivo Pharmacokinetics, and In Vivo Efficacy for Topical Therapy of Acne. ACS Omega 2016, 1, 1326–1335. [Google Scholar] [CrossRef]
- Li, J.F.; Wei, Y.X.; Ding, L.H.; Dong, C. Study on the inclusion complexes of cryptotanshinone with β-cyclodextrin and hydroxypropyl-β-cyclodextrin. Spectrochim. Acta Part A 2003, 59, 2759–2766. [Google Scholar] [CrossRef]
- Dong, C.; Qiao, J.; Yang, P. Study on the fluorescence properties of cryptotanshinone and tanshinone IIA and their molecular structures in different acidic media. Chin. J. Spectrosc. Lab. 2000, 17, 369–372. [Google Scholar]
- Li, J.F.; Wei, Y.X.; Xu, Z.C.; Dong, C.; Shuang, S.M. Studies on the spectroscopic behavior of cryptotanshinone, tanshinone IIA, and tanshinone I. Spectrochim. Acta Part A 2004, 60, 751–756. [Google Scholar] [CrossRef]
- Fiume, M.M.; Heldreth, B.; Bergfeld, W.F.; Belsito, D.V.; Hill, R.A.; Klaassen, C.D.; Liebler, D.; Marks, J.G.; Shank, R.C.; Slaga, T.J.; et al. Safety Assessment of Triethanolamine and Triethanolamine-Containing Ingredients as Used in Cosmetics. Int. J. Toxicol. 2013, 32, 59S–83S. [Google Scholar] [CrossRef]
- Musial, W.; Kubis, A. Preliminary evaluation of interactions between selected alcoholamines and model skin sebum components. Chem. Pharm. Bull. 2006, 54, 1076–1081. [Google Scholar] [CrossRef]
- Kostrzębska, A.; Musiał, W. The influence of increasing concentrations of AMPD on the efficacy of its penetration into a model skin sebum layer. Pharmaceutics 2020, 12, 1228. [Google Scholar] [CrossRef]
- Burnett, C.L.; Bergfeld, W.F.; Belsito, D.V.; Klaassen, C.D.; Marks, J.G.; Shank, R.C.; Slaga, T.J.; Snyder, P.W.; Andersen, F.A. Final amended report on safety assessment on aminomethyl Propanol and aminomethyl propanediol. Int. J. Toxicol. 2009, 28, 141S–161S. [Google Scholar] [CrossRef]
- Liebert, M.A. Final Report on the Safety Assessment of Diisopropanolamine, Triisopropanolamine, Isopropanolamine, and Mixed Isopropanolamine. J. Am. Coll. Toxicol. 1987, 6, 53–76. [Google Scholar]
- Becker, L.C.; Bergfeld, W.F.; Belsito, D.V.; Hill, R.A.; Klaassen, C.D.; Liebler, D.C.; Marks, J.G.; Shank, R.C.; Slaga, T.J.; Snyder, P.W.; et al. Safety Assessment of Tromethamine, Aminomethyl Propanediol, and Aminoethyl Propanediol as Used in Cosmetics. Int. J. Toxicol. 2018, 37, 5S–18S. [Google Scholar] [CrossRef]
- Shi, Z.; He, J.; Yao, T.; Chang, W.; Zhao, M. Simultaneous determination of cryptotanshinone, tanshinone I and tanshinone IIA in traditional Chinese medicinal preparations containing Radix salvia miltiorrhiza by HPLC. J. Pharm. Biomed. Anal. 2005, 37, 481–486. [Google Scholar] [CrossRef]
- Polish Pharmacopeia XI, 11th ed.; President of the Office for Registration of Medicinal Products: Warsaw, Poland, 2017; p. 279.
- Song, M.; Hang, T.J.; Zhang, Z.; Chen, H.Y. Effects of the coexisting diterpenoid tanshinones on the pharmacokinetics of cryptotanshinone and tanshinone IIA in rat. Eur. J. Pharm. Sci. 2007, 32, 247–253. [Google Scholar] [CrossRef]
- Kim, H.-K.; Woo, E.-R.; Lee, H.-W.; Park, H.-R.; Kim, H.-N.; Jung, Y.-K.; Choi, J.-Y.; Chae, S.-W.; Kim, H.-R.; Chae, H.-J. The Correlation of Salvia miltiorrhiza Extract–Induced Regulation of Osteoclastogenesis with the Amount of Components Tanshinone I, Tanshinone IIA, Cryptotanshinone, and Dihydrotanshinone. Immunopharmacol. Immunotoxicol. 2008, 30, 347–364. [Google Scholar] [CrossRef]
- Frank, F.; Ives, D.J.G. The structural properties of alcohol–water mixtures. Q. Rev. Chem. Soc. 1966, 20, 1–44. [Google Scholar] [CrossRef]
- Personna, Y.; Slater, L.; Ntarlagiannis, D.; Werkema, D.; Szabo, Z. Electrical signatures of ethanol-liquid mixtures: Implications for monitoring biofuels migration in the subsurface. J. Contam. Hydrol. 2013, 144, 99–107. [Google Scholar] [CrossRef] [PubMed]
- Cheng, H.T.; Li, X.L.; Li, X.R.; Li, Y.H.; Wang, L.J.; Xue, M. Simultaneous quantification of selected compounds from Salvia herbs by HPLC method and their application. Food Chem. 2012, 130, 1031–1035. [Google Scholar] [CrossRef]
- Cryptotanshinone. Available online: https://www.selleckchem.com/products/Cryptotanshinone.html (accessed on 21 June 2021).
- Song, M.; Hang, T.J.; Zhang, Z.X.; Du, R.; Chen, J. Determination of cryptotanshinone and its metabolite in rat plasma by liquid chromatography-tandem mass spectrometry. J. Chromat. B 2005, 827, 205–209. [Google Scholar] [CrossRef]
- Dedić, M.; Bečić, E.; Imamović, B.; Žiga, N. Determination of clindamycin hydrochloride content in 1% clindamycin lotion. Bull. Chem. Technol. Bosnia Herzeg. 2018, 50, 49–54. [Google Scholar]
- Han, S.; Karłowicz-Bodalska, K.; Potaczek, P.; Wójcik, A.; Ozimek, Ł.; Szura, D.; Musiał, W. Identification of unknown impurity of azelaic acid in liposomal formulation assessed by HPLC-ELSD, GC-FID, and GC-MS. AAPS PharmSciTech 2014, 15, 111–120. [Google Scholar] [CrossRef] [PubMed]


| Time (min) | 1 | 5 | 10 |
|---|---|---|---|
| Temperature (°C) | |||
| 30 | A | A | P |
| 40 | A | P | P |
| 50 | P | P | P |
| 60 | P | P | P |
| Solvent | Solution of: | ||||
|---|---|---|---|---|---|
| NaOH | AMPD | TRIS | TEOA | TIPA | |
| Molar mass (g/mol) | 39.99 | 105.14 | 121.14 | 149.18 | 191.27 |
| Alkalic component concentration (mol/L) | 0.001 | 0.095 | 0.083 | 0.067 | 0.052 |
| The plateau volume (mL) | 6.0 | 5.0 | 4.5 | 5.0 | 4.5 |
| Amount of alkali component (mmol) | 0.0066 | 0.475 | 0.374 | 0.335 | 0.234 |
| The preliminary molar ratio alkali component/CT | 27 | 889 | 1514 | 1089 | 737 |
| pH after establishing the plateau volume (8 mL) | 10.07 ± 0.20 | 10.08 ± 0.10 | 9.16 ± 0.20 | 9.46 ± 0.10 | 9.18 ± 0.20 |
| Standard Solution | Retention Time (min) | Slope | Intercept | r2 | Linearity (µg/mL) | Peak Area (mAU × min) |
|---|---|---|---|---|---|---|
| S1 | 17.6361 | 0.4839 | 0.0948 | 0.999 | 1–15 | 0.5–6 |
| S2 | 17.6361 | 0.4302 | 0.8644 | 0.999 | 20–235 | 10–105 |
Publisher’s Note: MDPI stays neutral with regard to jurisdictional claims in published maps and institutional affiliations. |
© 2021 by the authors. Licensee MDPI, Basel, Switzerland. This article is an open access article distributed under the terms and conditions of the Creative Commons Attribution (CC BY) license (https://creativecommons.org/licenses/by/4.0/).
Share and Cite
Kobryń, J.; Dałek, J.; Musiał, W. The Influence of Selected Factors on the Aqueous Cryptotanshinone Solubility. Pharmaceutics 2021, 13, 992. https://doi.org/10.3390/pharmaceutics13070992
Kobryń J, Dałek J, Musiał W. The Influence of Selected Factors on the Aqueous Cryptotanshinone Solubility. Pharmaceutics. 2021; 13(7):992. https://doi.org/10.3390/pharmaceutics13070992
Chicago/Turabian StyleKobryń, Justyna, Jowita Dałek, and Witold Musiał. 2021. "The Influence of Selected Factors on the Aqueous Cryptotanshinone Solubility" Pharmaceutics 13, no. 7: 992. https://doi.org/10.3390/pharmaceutics13070992
APA StyleKobryń, J., Dałek, J., & Musiał, W. (2021). The Influence of Selected Factors on the Aqueous Cryptotanshinone Solubility. Pharmaceutics, 13(7), 992. https://doi.org/10.3390/pharmaceutics13070992