
Degradation of Drug Delivery Nanocarriers and Payload Release: A Review of Physical Methods for Tracing Nanocarrier Biological Fate

 , and
, and
Abstract
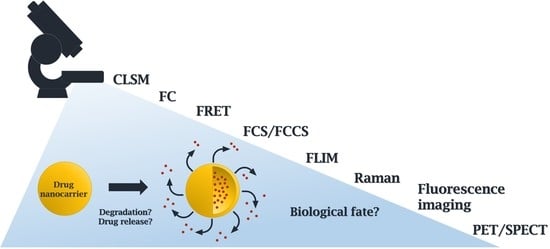
1. Introduction
2. In Vitro Techniques
2.1. Confocal Laser Scanning Microscopy
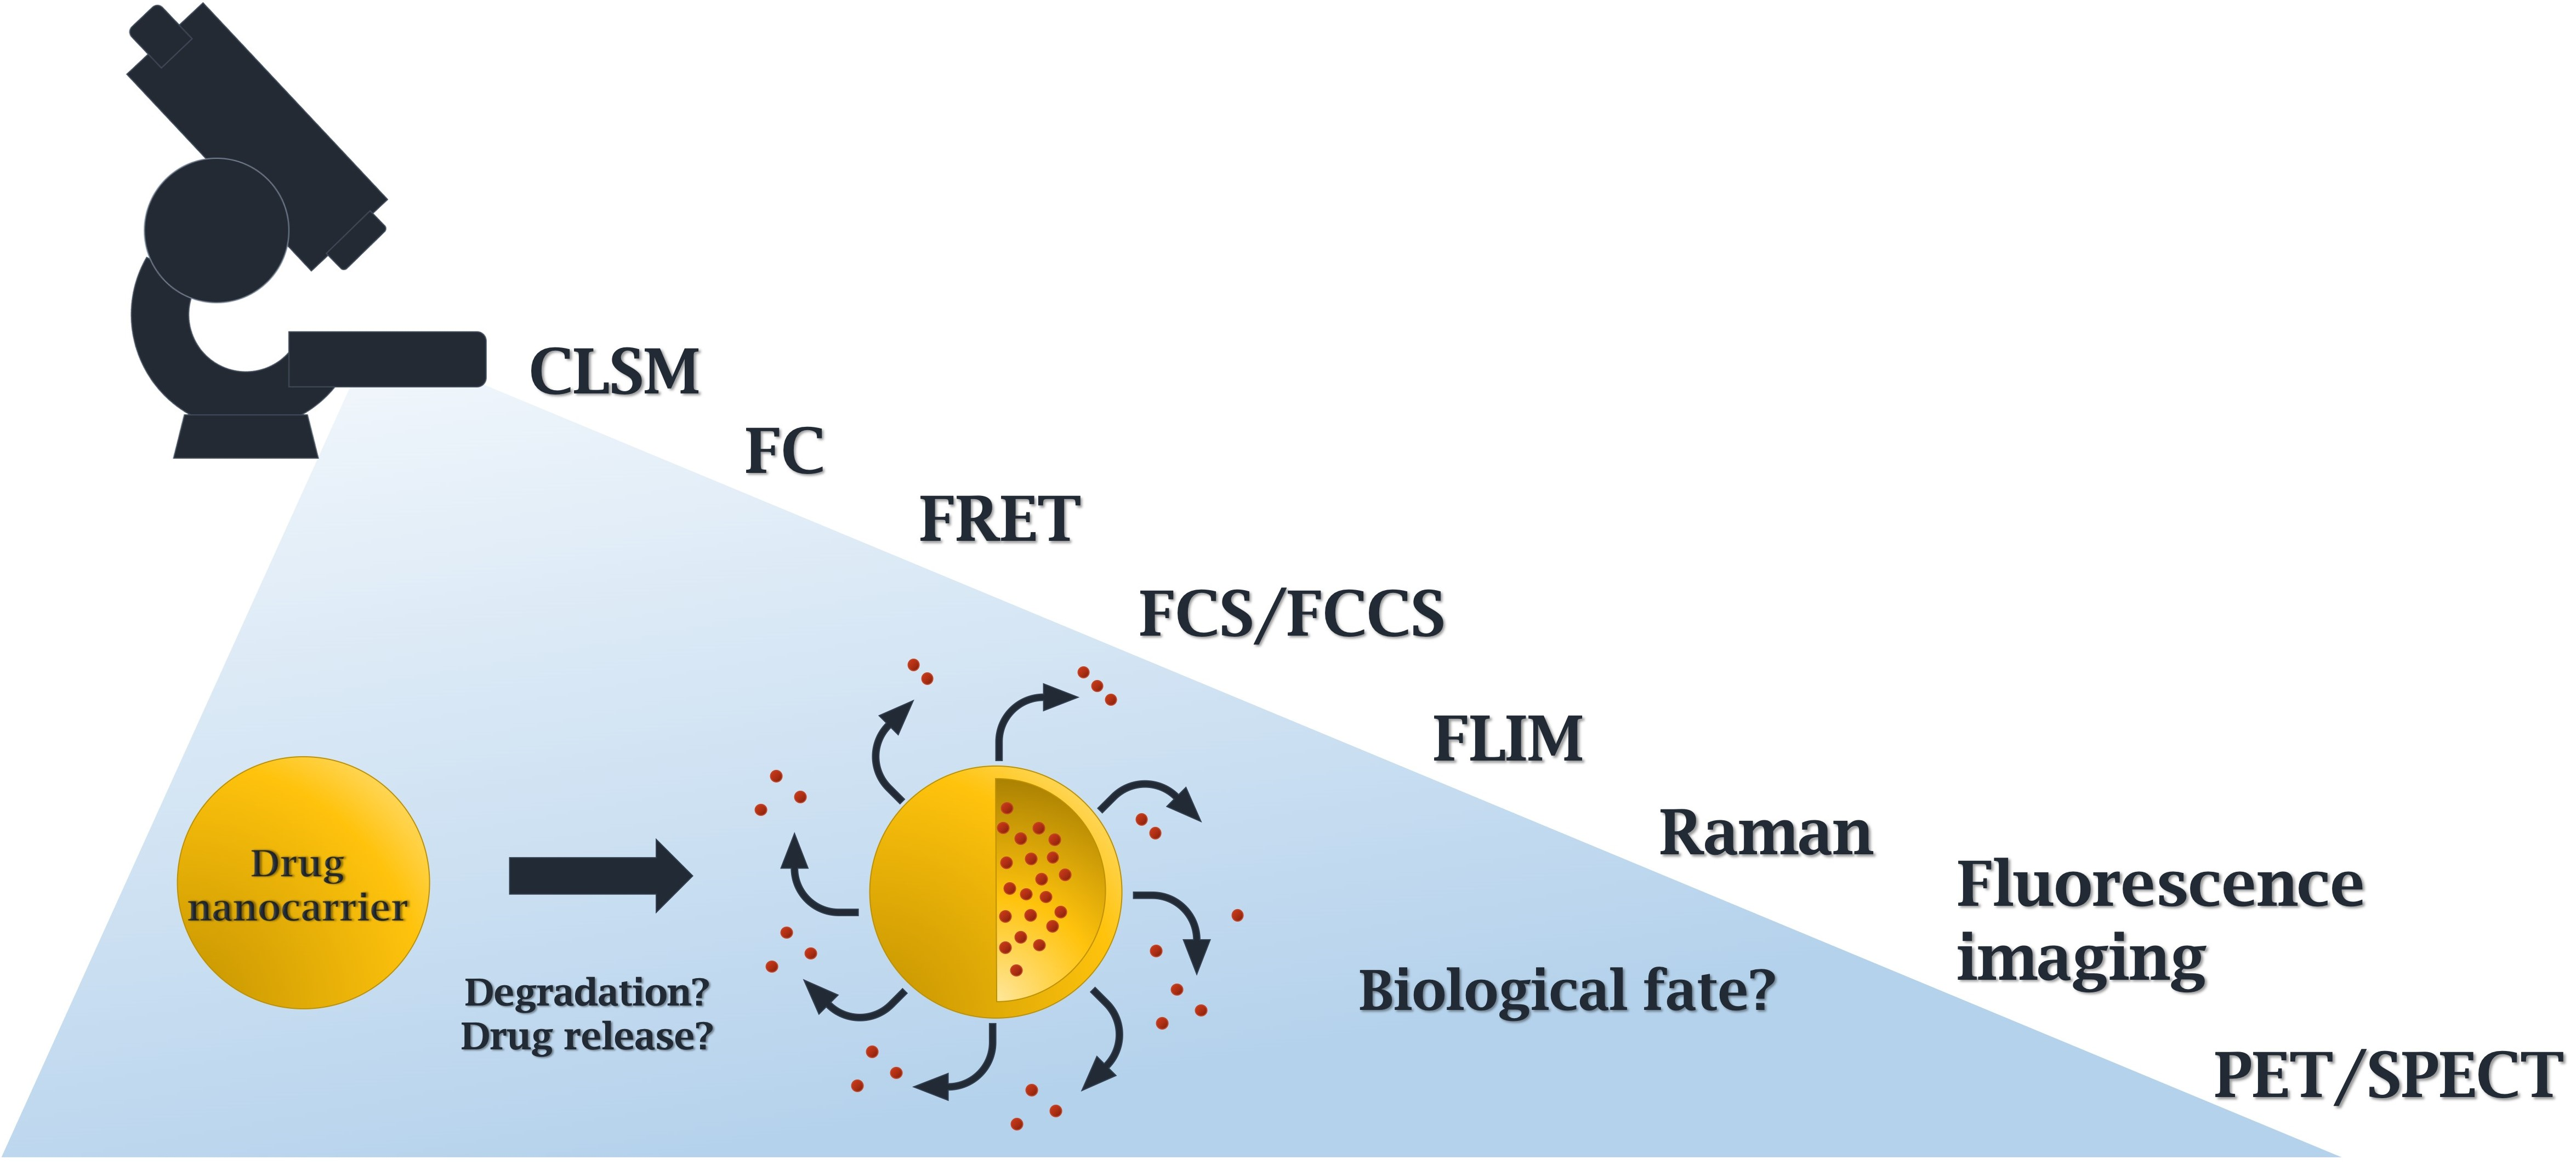
2.2. Flow Cytometry
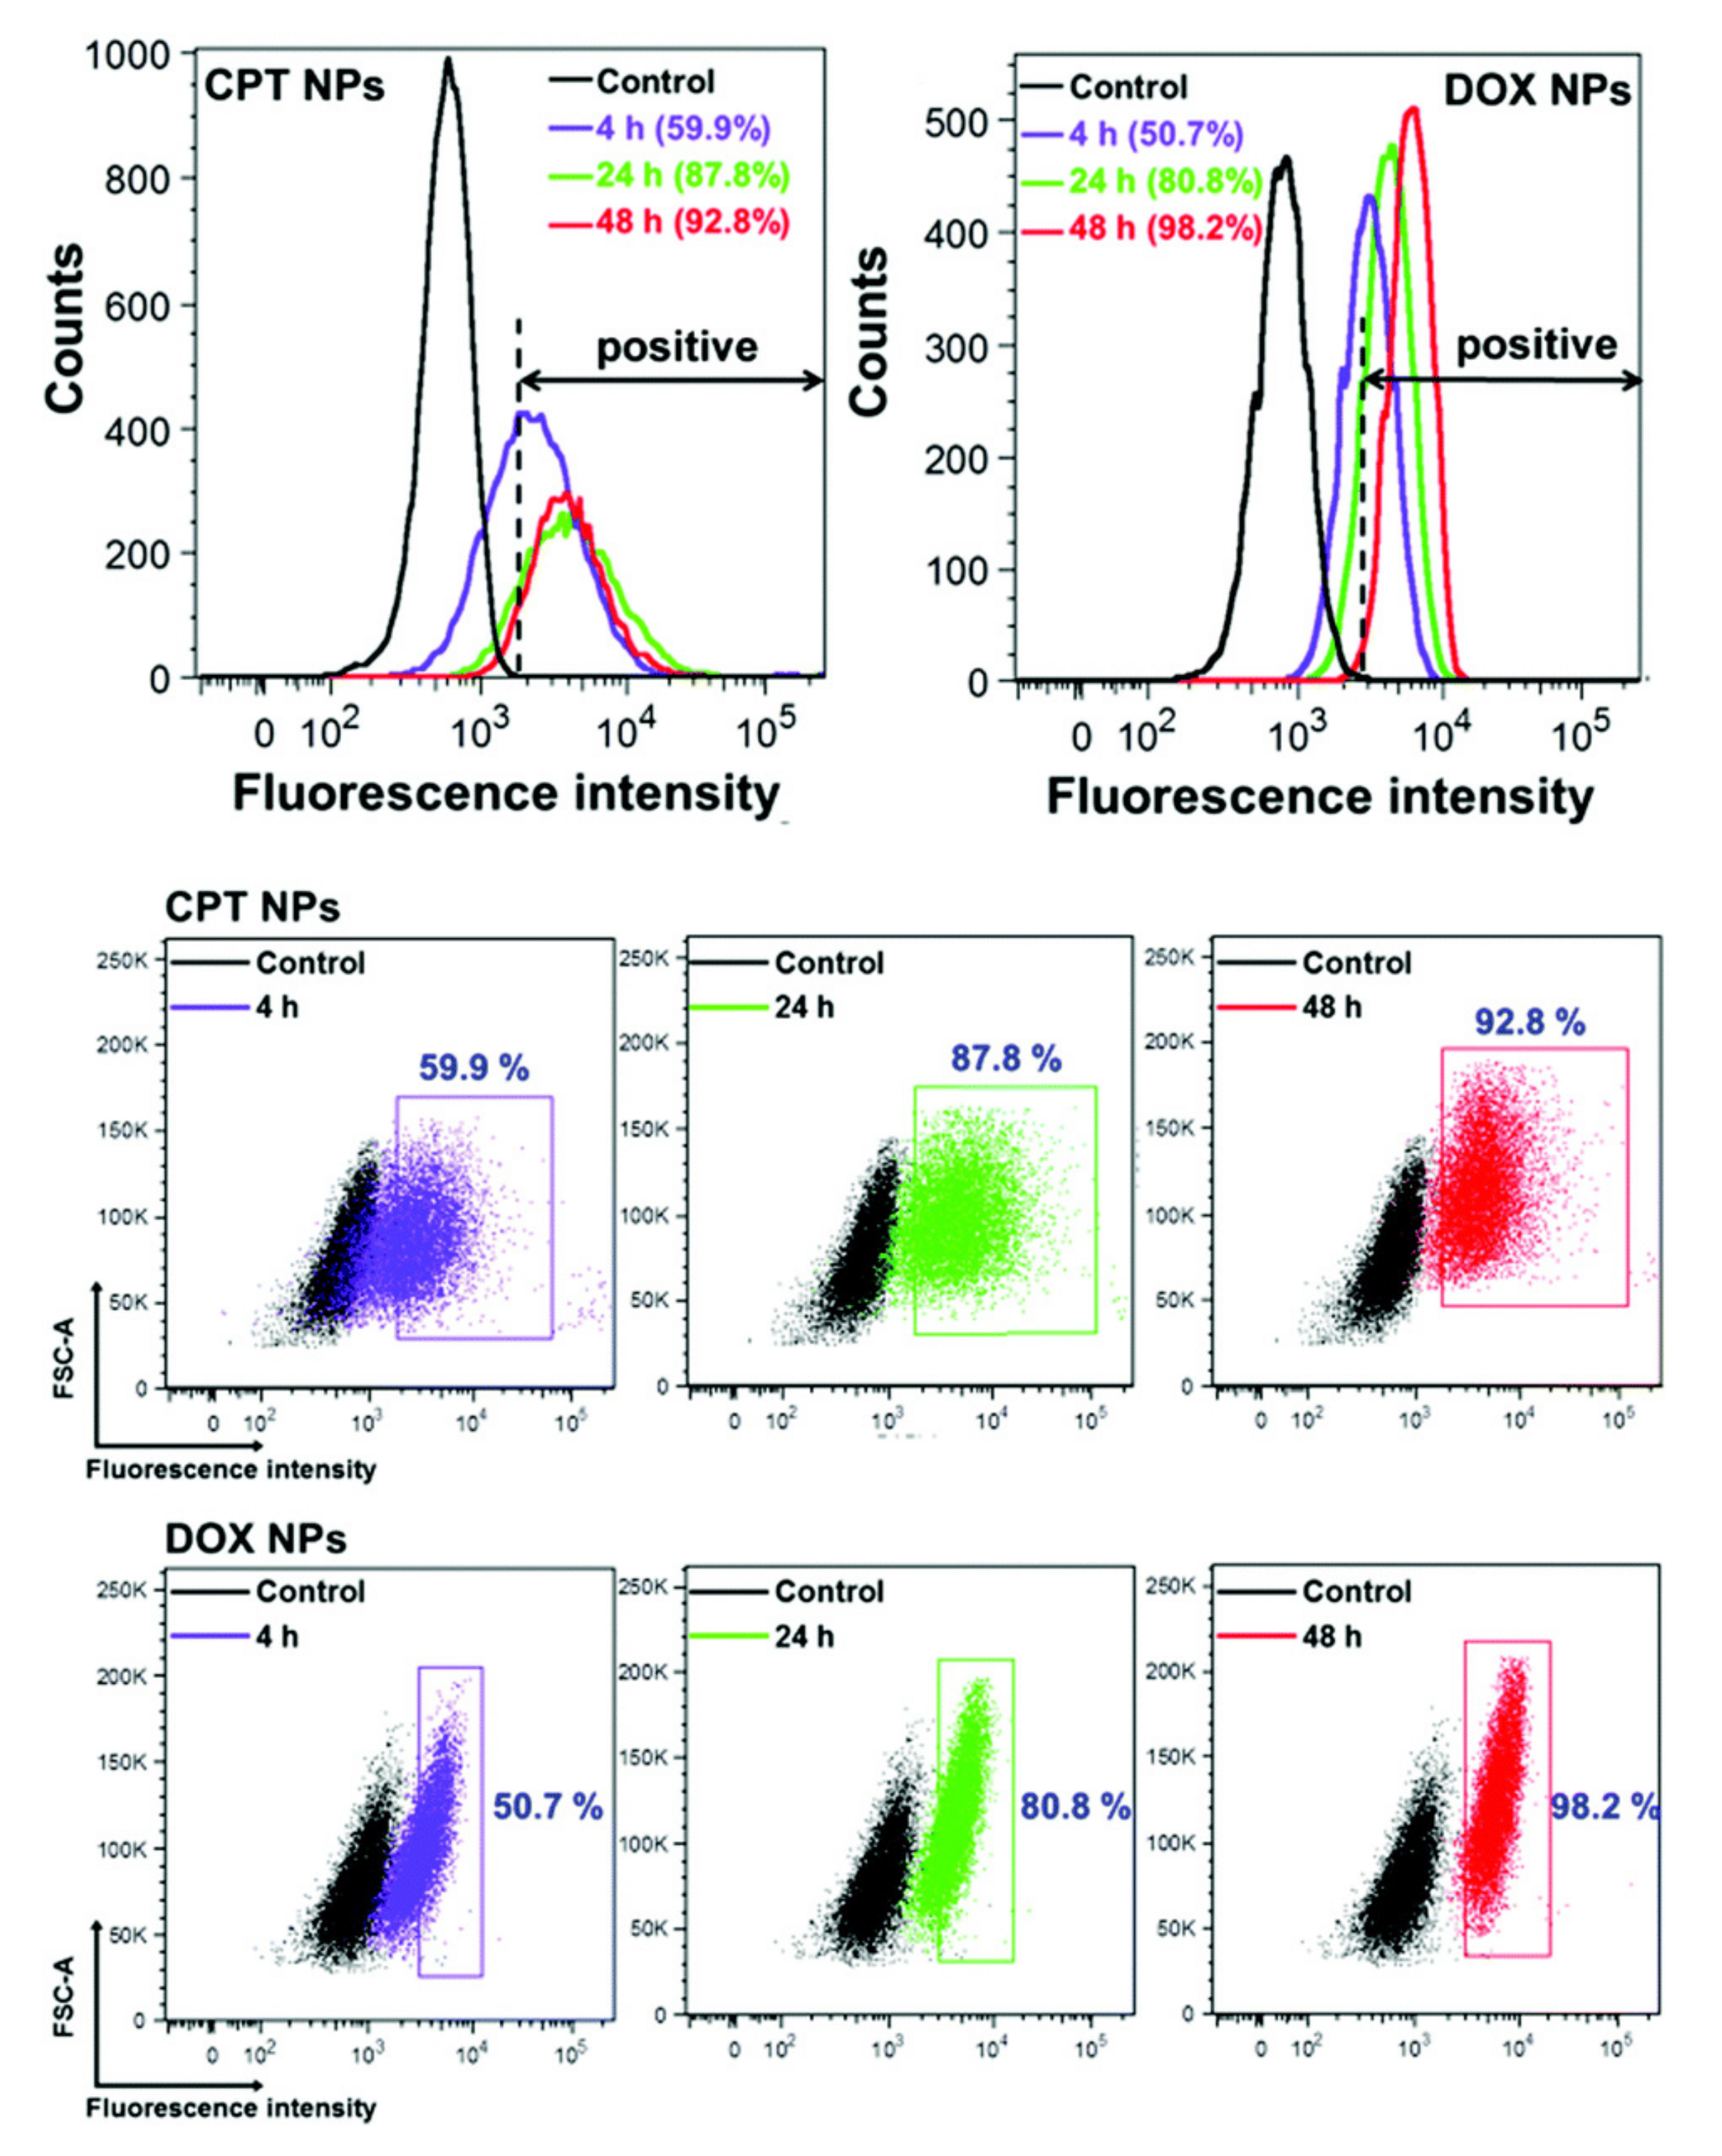
2.3. Förster Resonance Energy Transfer
2.4. Fluorescence Correlation Spectroscopy/Fluorescence Cross-Correlation Spectroscopy
2.5. Fluorescence Lifetime Imaging
3. Confocal Raman Microscopy
4. In Vivo Techniques
4.1. Fluorescence Imaging
4.2. Nuclear Imaging: Positron Emission Tomography and Single-Photon Emission Computed Tomography
4.3. In Vitro vs. In Vivo Studies
5. Summary and Perspectives
Funding
Institutional Review Board Statement
Informed Consent Statement
Data Availability Statement
Conflicts of Interest
References
- Min, Y.; Caster, J.M.; Eblan, M.J.; Wang, A.Z. Clinical Translation of Nanomedicine. Chem. Rev. 2015, 115, 11147–11190. [Google Scholar] [CrossRef] [PubMed]
- Kwon, G.S. Diblock Copolymer Nanoparticles for Drug Delivery. Crit. Rev. Ther. Drug Carrier Syst. 1998, 15, 481–512. [Google Scholar] [CrossRef] [PubMed]
- Reibetanz, U.; Claus, C.; Typlt, E.; Hofmann, J.; Donath, E. Defoliation and Plasmid Delivery with Layer-by-Layer Coated Colloids. Macromol. Biosci. 2006, 6, 153–160. [Google Scholar] [CrossRef] [PubMed]
- Simón-Gracia, L.; Hunt, H.; Scodeller, P.; Gaitzsch, J.; Kotamraju, V.R.; Sugahara, K.N.; Tammik, O.; Ruoslahti, E.; Battaglia, G.; Teesalu, T. IRGD Peptide Conjugation Potentiates Intraperitoneal Tumor Delivery of Paclitaxel with Polymersomes. Biomaterials 2016, 104, 247–257. [Google Scholar] [CrossRef] [PubMed]
- Xu, Z.; Liu, S.; Kang, Y.; Wang, M. Glutathione- and PH-Responsive Nonporous Silica Prodrug Nanoparticles for Controlled Release and Cancer Therapy. Nanoscale 2015, 7, 5859–5868. [Google Scholar] [CrossRef]
- Jin, S.; Ye, K. Nanoparticle-Mediated Drug Delivery and Gene Therapy. Biotechnol. Prog. 2007, 23, 32–41. [Google Scholar] [CrossRef] [PubMed]
- Gregori, M.; Masserini, M.; Mancini, S. Nanomedicine for the Treatment of Alzheimer’s Disease. Nanomedicine 2015, 10, 1203–1218. [Google Scholar] [CrossRef]
- Pelaz, B.; Alexiou, C.; Alvarez-Puebla, R.A.; Alves, F.; Andrews, A.M.; Ashraf, S.; Balogh, L.P.; Ballerini, L.; Bestetti, A.; Brendel, C.; et al. Diverse Applications of Nanomedicine. ACS Nano 2017, 11, 2313–2381. [Google Scholar] [CrossRef]
- Kumari, A.; Yadav, S.K.; Yadav, S.C. Biodegradable Polymeric Nanoparticles Based Drug Delivery Systems. Colloids Surf. B Biointerfaces 2010, 75, 1–18. [Google Scholar] [CrossRef]
- Battaglia, L.; Gallarate, M. Lipid Nanoparticles: State of the Art, New Preparation Methods and Challenges in Drug Delivery. Expert Opin. Drug Deliv. 2012, 9, 497–508. [Google Scholar] [CrossRef]
- Porter, C.J.H.; Trevaskis, N.L.; Charman, W.N. Lipids and Lipid-Based Formulations: Optimizing the Oral Delivery of Lipophilic Drugs. Nat. Rev. Drug Discov. 2007, 6, 231–248. [Google Scholar] [CrossRef] [PubMed]
- Liong, M.; Lu, J.; Kovochich, M.; Xia, T.; Ruehm, S.G.; Nel, A.E.; Tamanoi, F.; Zink, J.I. Multifunctional Inorganic Nanoparticles for Imaging, Targeting, and Drug Delivery. ACS Nano 2008, 2, 889–896. [Google Scholar] [CrossRef] [PubMed]
- De la Fuente, J.M.; Grazu, V. (Eds.) Nanobiotechnology: Inorganic Nanoparticles vs Organic Nanoparticles; Elsevier: Amsterdam, The Netherlands; Boston, MA, USA, 2012; Volume 4, ISBN 978-0-12-415769-9. [Google Scholar]
- Wang, L.; Zheng, M.; Xie, Z. Nanoscale Metal–Organic Frameworks for Drug Delivery: A Conventional Platform with New Promise. J. Mater. Chem. B 2018, 6, 707–717. [Google Scholar] [CrossRef]
- Bulbake, U.; Doppalapudi, S.; Kommineni, N.; Khan, W. Liposomal Formulations in Clinical Use: An Updated Review. Pharmaceutics 2017, 9, 12. [Google Scholar] [CrossRef]
- Chan, J.M.; Valencia, P.M.; Zhang, L.; Langer, R.; Farokhzad, O.C. Polymeric Nanoparticles for Drug Delivery. Methods Mol. Biol. Clifton NJ 2010, 624, 163–175. [Google Scholar] [CrossRef]
- Graybug Vision a Depot Formulation of Sunitinib Malate (GB-102) in Subjects with Neovascular (Wet) Age-Related Macular Degeneration. Available online: https://clinicaltrials.gov/ct2/show/NCT03249740?term=sunitinib (accessed on 5 May 2021).
- Jahanshahi, M.; Babaei, Z. Protein Nanoparticle: A Unique System as Drug Delivery Vehicles. Afr. J. Biotechnol. 2008, 7. [Google Scholar] [CrossRef]
- Coustet, M.; Irigoyen, J.; Garcia, T.A.; Murray, R.A.; Romero, G.; Susana Cortizo, M.; Knoll, W.; Azzaroni, O.; Moya, S.E. Layer-by-Layer Assembly of Polymersomes and Polyelectrolytes on Planar Surfaces and Microsized Colloidal Particles. J. Colloid Interface Sci. 2014, 421, 132–140. [Google Scholar] [CrossRef] [PubMed]
- Li, S.-D.; Huang, L. Stealth Nanoparticles: High Density but Sheddable PEG Is a Key for Tumor Targeting. J. Controlled Release 2010, 145, 178–181. [Google Scholar] [CrossRef]
- Murray, R.A.; Qiu, Y.; Chiodo, F.; Marradi, M.; Penadés, S.; Moya, S.E. A Quantitative Study of the Intracellular Dynamics of Fluorescently Labelled Glyco-Gold Nanoparticles via Fluorescence Correlation Spectroscopy. Small 2014, 10, 2602–2610. [Google Scholar] [CrossRef] [PubMed]
- Romero, G.; Estrela-Lopis, I.; Zhou, J.; Rojas, E.; Franco, A.; Espinel, C.S.; Fernández, A.G.; Gao, C.; Donath, E.; Moya, S.E. Surface Engineered Poly(Lactide-Co-Glycolide) Nanoparticles for Intracellular Delivery: Uptake and Cytotoxicity—A Confocal Raman Microscopic Study. Biomacromolecules 2010, 11, 2993–2999. [Google Scholar] [CrossRef] [PubMed]
- Romero, G.; Rojas, E.; Estrela-Lopis, I.; Donath, E.; Moya, S. Spontaneous Confocal Raman Microscopy—A Tool to Study the Uptake of Nanoparticles and Carbon Nanotubes into Cells. Nanoscale Res. Lett. 2011, 6, 429. [Google Scholar] [CrossRef]
- Huang, F.; Watson, E.; Dempsey, C.; Suh, J. Real-Time Particle Tracking for Studying Intracellular Trafficking of Pharmaceutical Nanocarriers. In Cellular and Subcellular Nanotechnology; Weissig, V., Elbayoumi, T., Olsen, M., Eds.; Methods in Molecular Biology; Humana Press: Totowa, NJ, USA, 2013; Volume 991, pp. 211–223. ISBN 978-1-62703-335-0. [Google Scholar]
- Gibbs-Flournoy, E.A.; Bromberg, P.A.; Hofer, T.P.; Samet, J.M.; Zucker, R.M. Darkfield-Confocal Microscopy Detection of Nanoscale Particle Internalization by Human Lung Cells. Part. Fibre Toxicol. 2011, 8, 2. [Google Scholar] [CrossRef]
- Shang, L.; Nienhaus, K.; Jiang, X.; Yang, L.; Landfester, K.; Mailänder, V.; Simmet, T.; Nienhaus, G.U. Nanoparticle Interactions with Live Cells: Quantitative Fluorescence Microscopy of Nanoparticle Size Effects. Beilstein J. Nanotechnol. 2014, 5, 2388–2397. [Google Scholar] [CrossRef] [PubMed]
- Murray, R.A.; Escobar, A.; Bastús, N.G.; Andreozzi, P.; Puntes, V.; Moya, S.E. Fluorescently Labelled Nanomaterials in Nanosafety Research: Practical Advice to Avoid Artefacts and Trace Unbound Dye. NanoImpact 2018, 9. [Google Scholar] [CrossRef]
- Smith, S.A.; Selby, L.I.; Johnston, A.P.R.; Such, G.K. The Endosomal Escape of Nanoparticles: Toward More Efficient Cellular Delivery. Bioconjug. Chem. 2019, 30, 263–272. [Google Scholar] [CrossRef] [PubMed]
- Di Silvio, D.; Martínez-Moro, M.; Salvador, C.; de los Angeles Ramirez, M.; Caceres-Velez, P.R.; Ortore, M.G.; Dupin, D.; Andreozzi, P.; Moya, S.E. Self-Assembly of Poly(Allylamine)/SiRNA Nanoparticles, Their Intracellular Fate and SiRNA Delivery. J. Colloid Interface Sci. 2019, 557, 757–766. [Google Scholar] [CrossRef]
- Eustaquio, T.; Leary, J.F. Single-Cell Nanotoxicity Assays of Superparamagnetic Iron Oxide Nanoparticles. In Nanotoxicity; Reineke, J., Ed.; Methods in Molecular Biology; Humana Press: Totowa, NJ, USA, 2012; Volume 926, pp. 69–85. ISBN 978-1-62703-001-4. [Google Scholar]
- García-Rodríguez, A.; Kazantseva, L.; Vila, L.; Rubio, L.; Velázquez, A.; Ramírez, M.J.; Marcos, R.; Hernández, A. Micronuclei Detection by Flow Cytometry as a High-Throughput Approach for the Genotoxicity Testing of Nanomaterials. Nanomaterials 2019, 9, 1677. [Google Scholar] [CrossRef]
- Lanna, E.G.; Siqueira, R.P.; Machado, M.G.C.; de Souza, A.; Trindade, I.C.; Branquinho, R.T.; Mosqueira, V.C.F. Lipid-Based Nanocarriers Co-Loaded with Artemether and Triglycerides of Docosahexaenoic Acid: Effects on Human Breast Cancer Cells. Biomed. Pharm. 2021, 134, 111114. [Google Scholar] [CrossRef]
- Guo, W.; Song, Y.; Song, W.; Liu, Y.; Liu, Z.; Zhang, D.; Tang, Z.; Bai, O. Co-Delivery of Doxorubicin and Curcumin with Polypeptide Nanocarrier for Synergistic Lymphoma Therapy. Sci. Rep. 2020, 10, 7832. [Google Scholar] [CrossRef]
- Ostermann, M.; Sauter, A.; Xue, Y.; Birkeland, E.; Schoelermann, J.; Holst, B.; Cimpan, M.R. Label-Free Impedance Flow Cytometry for Nanotoxicity Screening. Sci. Rep. 2020, 10, 142. [Google Scholar] [CrossRef]
- Lesniak, A.; Salvati, A.; Santos-Martinez, M.J.; Radomski, M.W.; Dawson, K.A.; Åberg, C. Nanoparticle Adhesion to the Cell Membrane and Its Effect on Nanoparticle Uptake Efficiency. J. Am. Chem. Soc. 2013, 135, 1438–1444. [Google Scholar] [CrossRef]
- Salvati, A.; Nelissen, I.; Haase, A.; Åberg, C.; Moya, S.; Jacobs, A.; Alnasser, F.; Bewersdorff, T.; Deville, S.; Luch, A.; et al. Quantitative Measurement of Nanoparticle Uptake by Flow Cytometry Illustrated by an Interlaboratory Comparison of the Uptake of Labelled Polystyrene Nanoparticles. NanoImpact 2018, 9, 42–50. [Google Scholar] [CrossRef]
- Shin, H.; Kwak, M.; Lee, T.G.; Lee, J.Y. Quantifying the Level of Nanoparticle Uptake in Mammalian Cells Using Flow Cytometry. Nanoscale 2020, 12, 15743–15751. [Google Scholar] [CrossRef]
- Jochums, A.; Friehs, E.; Sambale, F.; Lavrentieva, A.; Bahnemann, D.; Scheper, T. Revelation of Different Nanoparticle-Uptake Behavior in Two Standard Cell Lines NIH/3T3 and A549 by Flow Cytometry and Time-Lapse Imaging. Toxics 2017, 5, 15. [Google Scholar] [CrossRef]
- Yue, T.; Zhou, H.; Sun, H.; Li, S.; Zhang, X.; Cao, D.; Yi, X.; Yan, B. Why Are Nanoparticles Trapped at Cell Junctions When the Cell Density Is High? Nanoscale 2019, 11, 6602–6609. [Google Scholar] [CrossRef] [PubMed]
- Lin, J.; Miao, L.; Zhong, G.; Lin, C.-H.; Dargazangy, R.; Alexander-Katz, A. Understanding the Synergistic Effect of Physicochemical Properties of Nanoparticles and Their Cellular Entry Pathways. Commun. Biol. 2020, 3, 205. [Google Scholar] [CrossRef] [PubMed]
- Hou, S.; Sikora, K.N.; Tang, R.; Liu, Y.; Lee, Y.-W.; Kim, S.T.; Jiang, Z.; Vachet, R.W.; Rotello, V.M. Quantitative Differentiation of Cell Surface-Bound and Internalized Cationic Gold Nanoparticles Using Mass Spectrometry. ACS Nano 2016, 10, 6731–6736. [Google Scholar] [CrossRef]
- Romero, G.; Echeverría, M.; Qiu, Y.; Murray, R.A.; Moya, S.E. A Novel Approach to Monitor Intracellular Degradation Kinetics of Poly(Lactide-Co-Glycolide) Nanoparticles by Means of Flow Cytometry. J. Mater. Chem. B 2014. [Google Scholar] [CrossRef]
- Romero, G.; Murray, R.A.; Qiu, Y.; Sanz, D.; Moya, S.E. Layer by Layer Surface Engineering of Poly (Lactide-Co-Glycolide) Nanoparticles: A Versatile Tool for Nanoparticle Engineering for Targeted Drug Delivery. Sci. China Chem. 2013, 56, 1029–1039. [Google Scholar] [CrossRef]
- Han, Y.; Gu, Y.; Zhang, A.C.; Lo, Y.-H. Review: Imaging Technologies for Flow Cytometry. Lab. Chip 2016, 16, 4639–4647. [Google Scholar] [CrossRef]
- Omedes Pujol, M.; Coleman, D.J.L.; Allen, C.D.; Heidenreich, O.; Fulton, D.A. Determination of Key Structure–Activity Relationships in SiRNA Delivery with a Mixed Micelle System. J. Control. Release 2013, 172, 939–945. [Google Scholar] [CrossRef] [PubMed][Green Version]
- Chen, T.; He, B.; Tao, J.; He, Y.; Deng, H.; Wang, X.; Zheng, Y. Application of Förster Resonance Energy Transfer (FRET) Technique to Elucidate Intracellular and In Vivo Biofate of Nanomedicines. Adv. Drug Deliv. Rev. 2019, 143, 177–205. [Google Scholar] [CrossRef] [PubMed]
- Robin, M.P.; O’Reilly, R.K. Strategies for Preparing Fluorescently Labelled Polymer Nanoparticles. Polym. Int. 2015, 64, 174–182. [Google Scholar] [CrossRef]
- Cauzzo, J.; Nystad, M.; Holsæter, A.M.; Basnet, P.; Škalko-Basnet, N. Following the Fate of Dye-Containing Liposomes In Vitro. Int. J. Mol. Sci. 2020, 21, 4847. [Google Scholar] [CrossRef]
- Xiao, L.; Xiong, X.; Sun, X.; Zhu, Y.; Yang, H.; Chen, H.; Gan, L.; Xu, H.; Yang, X. Role of Cellular Uptake in the Reversal of Multidrug Resistance by PEG-b-PLA Polymeric Micelles. Biomaterials 2011, 32, 5148–5157. [Google Scholar] [CrossRef]
- Gravier, J.; Sancey, L.; Hirsjärvi, S.; Rustique, E.; Passirani, C.; Benoît, J.-P.; Coll, J.-L.; Texier, I. FRET Imaging Approaches for In Vitro and In Vivo Characterization of Synthetic Lipid Nanoparticles. Mol. Pharm. 2014, 11, 3133–3144. [Google Scholar] [CrossRef] [PubMed]
- Nguyen, H.T.P.; Allard-Vannier, E.; Gaillard, C.; Eddaoudi, I.; Miloudi, L.; Soucé, M.; Chourpa, I.; Munnier, E. On the Interaction of Alginate-Based Core-Shell Nanocarriers with Keratinocytes in Vitro. Colloids Surf. B Biointerfaces 2016, 142, 272–280. [Google Scholar] [CrossRef]
- Wolf, M.P.; Liu, K.; Horn, T.F.W.; Hunziker, P. FRET in a Polymeric Nanocarrier: IR-780 and IR-780-PDMS. Biomacromolecules 2019, 20, 4065–4074. [Google Scholar] [CrossRef] [PubMed]
- Nuhn, L.; Van Herck, S.; Best, A.; Deswarte, K.; Kokkinopoulou, M.; Lieberwirth, I.; Koynov, K.; Lambrecht, B.N.; De Geest, B.G. FRET Monitoring of Intracellular Ketal Hydrolysis in Synthetic Nanoparticles. Angew. Chem. Int. Ed. 2018, 57, 10760–10764. [Google Scholar] [CrossRef] [PubMed]
- Thapaliya, E.R.; Fowley, C.; Callan, B.; Tang, S.; Zhang, Y.; Callan, J.F.; Raymo, F.M. Energy-Transfer Schemes To Probe Fluorescent Nanocarriers and Their Emissive Cargo. Langmuir 2015, 31, 9557–9565. [Google Scholar] [CrossRef]
- Xu, Y.; Kim, C.-S.; Saylor, D.M.; Koo, D. Polymer Degradation and Drug Delivery in PLGA-Based Drug-Polymer Applications: A Review of Experiments and Theories. J. Biomed. Mater. Res. B Appl. Biomater. 2017, 105, 1692–1716. [Google Scholar] [CrossRef]
- Chen, H.; Kim, S.; Li, L.; Wang, S.; Park, K.; Cheng, J.-X. Release of Hydrophobic Molecules from Polymer Micelles into Cell Membranes Revealed by Forster Resonance Energy Transfer Imaging. Proc. Natl. Acad. Sci. USA 2008, 105, 6596–6601. [Google Scholar] [CrossRef]
- Taemaitree, F.; Fortuni, B.; Koseki, Y.; Fron, E.; Rocha, S.; Hofkens, J.; Uji-i, H.; Inose, T.; Kasai, H. FRET-Based Intracellular Investigation of Nanoprodrugs toward Highly Efficient Anticancer Drug Delivery. Nanoscale 2020, 12, 16710–16715. [Google Scholar] [CrossRef] [PubMed]
- Chen, K.-J.; Chiu, Y.-L.; Chen, Y.-M.; Ho, Y.-C.; Sung, H.-W. Intracellularly Monitoring/Imaging the Release of Doxorubicin from PH-Responsive Nanoparticles Using Förster Resonance Energy Transfer. Biomaterials 2011, 32, 2586–2592. [Google Scholar] [CrossRef]
- Pu, H.-L.; Chiang, W.-L.; Maiti, B.; Liao, Z.-X.; Ho, Y.-C.; Shim, M.S.; Chuang, E.-Y.; Xia, Y.; Sung, H.-W. Nanoparticles with Dual Responses to Oxidative Stress and Reduced PH for Drug Release and Anti-Inflammatory Applications. ACS Nano 2014, 8, 1213–1221. [Google Scholar] [CrossRef]
- Zhang, C.; Zhang, D.; Cheng, J.-X. Coherent Raman Scattering Microscopy in Biology and Medicine. Annu. Rev. Biomed. Eng. 2015, 17, 415–445. [Google Scholar] [CrossRef]
- Lai, J.; Shah, B.P.; Garfunkel, E.; Lee, K.-B. Versatile Fluorescence Resonance Energy Transfer-Based Mesoporous Silica Nanoparticles for Real-Time Monitoring of Drug Release. ACS Nano 2013, 7, 2741–2750. [Google Scholar] [CrossRef] [PubMed]
- Wang, D.; Chen, J.; Ren, L.; Li, Q.; Li, D.; Yu, J. AIEgen-Functionalised Mesoporous Silica Nanoparticles as a FRET Donor for Monitoring Drug Delivery. Inorg. Chem. Front. 2017, 4, 468–472. [Google Scholar] [CrossRef]
- Elson, E.L.; Webb, W.W. Fluorescecne Correlation Spectroscopy. II. An Experimental Realization. Biopolymers 1974, 13, 29–61. [Google Scholar]
- Elson, E.L. Fluorescence Correlation Spectroscopy. I. Conceptual Basis and Theory. Biopolymers 1974, 13, 1–27. [Google Scholar] [CrossRef]
- Silvestri, A.; Di Silvio, D.; Llarena, I.; Murray, R.A.; Marelli, M.; Lay, L.; Polito, L.; Moya, S.E. Influence of Surface Coating on the Intracellular Behaviour of Gold Nanoparticles: A Fluorescence Correlation Spectroscopy Study. Nanoscale 2017, 9, 14730–14739. [Google Scholar] [CrossRef] [PubMed]
- Bacia, K.; Majoul, I.V.; Schwille, P. Probing the Endocytic Pathway in Live Cells Using Dual-Color Fluorescence Cross-Correlation Analysis. Biophys. J. 2002, 83, 1184–1193. [Google Scholar] [CrossRef]
- Wawrezinieck, L.; Rigneault, H.; Marguet, D.; Lenne, P.-F. Fluorescence Correlation Spectroscopy Diffusion Laws to Probe the Submicron Cell Membrane Organization. Biophys. J. 2005, 89, 4029–4042. [Google Scholar] [CrossRef] [PubMed]
- Tang, L.; Dong, C.; Ren, J. Highly Sensitive Homogenous Immunoassay of Cancer Biomarker Using Silver Nanoparticles Enhanced Fluorescence Correlation Spectroscopy. Talanta 2010, 81, 1560–1567. [Google Scholar] [CrossRef] [PubMed]
- Chen, J.; Irudayaraj, J. Quantitative Investigation of Compartmentalized Dynamics of ErbB2 Targeting Gold Nanorods in Live Cells by Single Molecule Spectroscopy. ACS Nano 2009, 3, 4071–4079. [Google Scholar] [CrossRef] [PubMed]
- Capoulade, J.; Wachsmuth, M.; Hufnagel, L.; Knop, M. Quantitative Fluorescence Imaging of Protein Diffusion and Interaction in Living Cells. Nat. Biotechnol. 2011, 29, 835–839. [Google Scholar] [CrossRef]
- Shang, L.; Nienhaus, G.U. In Situ Characterization of Protein Adsorption onto Nanoparticles by Fluorescence Correlation Spectroscopy. Acc. Chem. Res. 2017, 50, 387–395. [Google Scholar] [CrossRef] [PubMed]
- Del Pino, P.; Pelaz, B.; Zhang, Q.; Maffre, P.; Nienhaus, G.U.; Parak, W.J. Protein Corona Formation around Nanoparticles—From the Past to the Future. Mater. Horiz. 2014. [Google Scholar] [CrossRef]
- Röcker, C.; Pötzl, M.; Zhang, F.; Parak, W.J.; Nienhaus, G.U. A Quantitative Fluorescence Study of Protein Monolayer Formation on Colloidal Nanoparticles. Nat. Nanotechnol. 2009, 4, 577–580. [Google Scholar] [CrossRef]
- Eriksen, A.Z.; Brewer, J.; Andresen, T.L.; Urquhart, A.J. The Diffusion Dynamics of PEGylated Liposomes in the Intact Vitreous of the Ex Vivo Porcine Eye: A Fluorescence Correlation Spectroscopy and Biodistribution Study. Int. J. Pharm. 2017, 522, 90–97. [Google Scholar] [CrossRef]
- Negwer, I.; Best, A.; Schinnerer, M.; Schäfer, O.; Capeloa, L.; Wagner, M.; Schmidt, M.; Mailänder, V.; Helm, M.; Barz, M.; et al. Monitoring Drug Nanocarriers in Human Blood by Near-Infrared Fluorescence Correlation Spectroscopy. Nat. Commun. 2018, 9, 1–9. [Google Scholar] [CrossRef] [PubMed]
- Schwille, P.; Meyer-Almes, F.J.; Rigler, R. Dual-Color Fluorescence Cross-Correlation Spectroscopy for Multicomponent Diffusional Analysis in Solution. Biophys. J. 1997, 72, 1878–1886. [Google Scholar] [CrossRef]
- Meseth, U.; Wohland, T.; Rigler, R.; Vogel, H. Resolution of Fluorescence Correlation Measurements. Biophys. J. 1999, 76, 1619–1631. [Google Scholar] [CrossRef]
- Weidemann, T.; Schwille, P. Fluorescence Cross-Correlation Spectroscopy. In Encyclopedia of Biophysics; Roberts, G.C.K., Ed.; Springer: Berlin/Heidelberg, Germany, 2013; pp. 795–799. ISBN 978-3-642-16712-6. [Google Scholar]
- Mérola, F.; Nüße, O.; Dupré-Crochet, S.; Tramier, M.; Erard, M.; Durand, D.; Bouchab, L.; Ziegler, C.S.; Fieschi, F. Quantitative Live-Cell Imaging and 3D Modeling Reveal Critical Functional Features in the Cytosolic Complex of Phagocyte NADPH Oxidase. J. Biol. Chem. 2019. [Google Scholar] [CrossRef]
- Bacia, K.; Kim, S.A.; Schwille, P. Fluorescence Cross-Correlation Spectroscopy in Living Cells. Nat. Methods 2006, 3, 83–89. [Google Scholar] [CrossRef]
- Lakowicz, J.R. Principles of Fluorescence Spectroscopy; Springer: Berlin/Heidelberg, Germany, 2013. [Google Scholar]
- Valeur, B. Molecular Fluorescence: Principles and Applications; Wiley-VCH Verlag GmbH: Weinheim, Germany, 2001; Volume 8, ISBN 3-527-60024-8. [Google Scholar]
- Pacheco-Liñan, P.J.; Moral, M.; Nueda, M.L.; Cruz-Sanchez, R.; Fernandez-Sainz, J.; Garzon-Ruiz, A.; Bravo, I.; Melguizo, M.; Laborda, J.; Albaladejo, J. Study on the PH Dependence of the Photophysical Properties of a Functionalized Perylene Bisimide and Its Potential Applications as a Fluorescence Lifetime Based PH Probe. J. Phys. Chem. C 2017, 121. [Google Scholar] [CrossRef]
- Stsiapura, V.I.; Kurhuzenkau, S.A.; Kuzmitsky, V.A.; Bouganov, O.V.; Tikhomirov, S.A. Solvent Polarity Effect on Nonradiative Decay Rate of Thioflavin, T. J. Phys. Chem. A 2016, 120, 5481–5496. [Google Scholar] [CrossRef]
- Okabe, K.; Inada, N.; Gota, C.; Harada, Y.; Funatsu, T.; Uchiyama, S. Intracellular Temperature Mapping with a Fluorescent Polymeric Thermometer and Fluorescence Lifetime Imaging Microscopy. Nat. Commun. 2012, 3. [Google Scholar] [CrossRef]
- Romero, G.; Qiu, Y.; Murray, R.A.; Moya, S.E. Study of Intracellular Delivery of Doxorubicin from Poly(Lactide-Co-Glycolide) Nanoparticles by Means of Fluorescence Lifetime Imaging and Confocal Raman Microscopy. Macromol. Biosci. 2013, 13, 234–241. [Google Scholar] [CrossRef] [PubMed]
- Dai, X.; Yue, Z.; Eccleston, M.E.; Swartling, J.; Slater, N.K.H.; Kaminski, C.F. Fluorescence Intensity and Lifetime Imaging of Free and Micellar-Encapsulated Doxorubicin in Living Cells. Nanomed. Nanotechnol. Biol. Med. 2008, 4, 49–56. [Google Scholar] [CrossRef]
- Suarasan, S.; Craciun, A.M.; Licarete, E.; Focsan, M.; Magyari, K.; Astilean, S. Intracellular Dynamic Disentangling of Doxorubicin Release from Luminescent Nanogold Carriers by Fluorescence Lifetime Imaging Microscopy (FLIM) under Two-Photon Excitation. ACS Appl. Mater. Interfaces 2019, 11, 7812–7822. [Google Scholar] [CrossRef] [PubMed]
- Zhou, T.; Luo, T.; Song, J.; Qu, J. Phasor-Fluorescence Lifetime Imaging Microscopy Analysis to Monitor Intercellular Drug Release from a PH-Sensitive Polymeric Nanocarrier. Anal. Chem. 2018, 90, 2170–2177. [Google Scholar] [CrossRef]
- Tasca, E.; Andreozzi, P.; Del Giudice, A.; Galantini, L.; Schillén, K.; Maria Giuliani, A.; de los Ramirez, M.A.; Moya, S.E.; Giustini, M. Poloxamer/Sodium Cholate Co-Formulation for Micellar Encapsulation of Doxorubicin with High Efficiency for Intracellular Delivery: An In-Vitro Bioavailability Study. J. Colloid Interface Sci. 2020, 579, 551–561. [Google Scholar] [CrossRef]
- Ge, H.; Cortezon-Tamarit, F.; Wang, H.C.; Sedgwick, A.C.; Arrowsmith, R.L.; Mirabello, V.; Botchway, S.W.; James, T.D.; Pascu, S.I. Multiphoton Fluorescence Lifetime Imaging Microscopy (FLIM) and Super-Resolution Fluorescence Imaging with a Supramolecular Biopolymer for the Controlled Tagging of Polysaccharides. Nanoscale 2019, 11, 9498–9507. [Google Scholar] [CrossRef]
- Jeong, S.; Greenfield, D.A.; Hermsmeier, M.; Yamamoto, A.; Chen, X.; Chan, K.F.; Evans, C.L. Time-Resolved Fluorescence Microscopy with Phasor Analysis for Visualizing Multicomponent Topical Drug Distribution within Human Skin. Sci. Rep. 2020, 10, 1–12. [Google Scholar] [CrossRef]
- Alex, A.; Frey, S.; Angelene, H.; Neitzel, C.D.; Li, J.; Bower, A.J.; Spillman, D.R.; Marjanovic, M.; Chaney, E.J.; Medler, J.L.; et al. In Situ Biodistribution and Residency of a Topical Anti-Inflammatory Using Fluorescence Lifetime Imaging Microscopy. Br. J. Dermatol. 2018, 179, 1342–1350. [Google Scholar] [CrossRef] [PubMed]
- Vanden-Hehir, S.; Tipping, W.J.; Lee, M.; Brunton, V.G.; Williams, A.; Hulme, A.N. Raman Imaging of Nanocarriers for Drug Delivery. Nanomaterials 2019, 93, 341. [Google Scholar] [CrossRef]
- Li, X.; Lachmanski, L.; Safi, S.; Sene, S.; Serre, C.; Grenèche, J.M.; Zhang, J.; Gref, R. New Insights into the Degradation Mechanism of Metal-Organic Frameworks Drug Carriers. Sci. Rep. 2017, 7, 13142. [Google Scholar] [CrossRef]
- Klein, K.; Gigler, A.M.; Aschenbrenner, T.; Monetti, R.; Bunk, W.; Jamitzky, F.; Morfill, G.; Stark, R.W.; Schlegel, J. Label-Free Live-Cell Imaging with Confocal Raman Microscopy. Biophys. J. 2012, 102, 360–368. [Google Scholar] [CrossRef] [PubMed]
- Van Apeldoorn, A.A.; van Manen, H.J.; Bezemer, J.M.; de Bruijn, J.D.; van Blitterswijk, C.A.; Otto, C. Raman Imaging of PLGA Microsphere Degradation inside Macrophages. J. Am. Chem. Soc. 2004, 126, 13226–13227. [Google Scholar] [CrossRef]
- Chernenko, T.; Matthäus, C.; Milane, L.; Quintero, L.; Amiji, M.; Diem, M. Label-Free Raman Spectral Imaging of Intracellular Delivery and Degradation of Polymeric Nanoparticle Systems. ACS Nano 2009, 3, 3552–3559. [Google Scholar] [CrossRef]
- Tolstik, E.; Osminkina, L.A.; Matthäus, C.; Burkhardt, M.; Tsurikov, K.E.; Natashina, U.A.; Timoshenko, V.Y.; Heintzmann, R.; Popp, J.; Sivakov, V. Studies of Silicon Nanoparticles Uptake and Biodegradation in Cancer Cells by Raman Spectroscopy. Nanomed. Nanotechnol. Biol. Med. 2016, 12, 1931–1940. [Google Scholar] [CrossRef]
- Iturrioz-rodríguez, N.; Martín-rodríguez, R.; Renero-lecuna, C.; Aguado, F.; González-legarreta, L.; González, J.; Fanarraga, M.L. Applied Surface Science Free-Labeled Nanoclay Intracellular Uptake Tracking by Confocal Raman Imaging. Appl. Surf. Sci. 2021, 537, 147870. [Google Scholar] [CrossRef]
- Lee, S.; Kwon, J.A.; Hee, K.; Min, C.; Bong, J.; Choi, I. European Journal of Pharmaceutics and Biopharmaceutics Controlled Drug Release with Surface-Capped Mesoporous Silica Nanoparticles and Its Label-Free in Situ Raman Monitoring. Eur. J. Pharm. Biopharm. 2018, 131, 232–239. [Google Scholar] [CrossRef]
- Cialla-May, D.; Zheng, X.S.; Weber, K.; Popp, J. Recent Progress in Surface-Enhanced Raman Spectroscopy for Biological and Biomedical Applications: From Cells to Clinics. Chem. Soc. Rev. 2017, 46, 3945–3961. [Google Scholar] [CrossRef] [PubMed]
- Smith, M.; Hepel, M. Controlled Release of Targeted Anti-Leukemia Drugs Azacitidine and Decitabine Monitored Using Surface-Enhanced Raman Scattering (SERS) Spectroscopy. Mediterr. J. Chem. 2017, 6, 125–132. [Google Scholar] [CrossRef]
- Santiago, T.; DeVaux, R.S.; Kurzatkowska, K.; Espinal, R.; Herschkowitz, J.I.; Hepel, M. Surface-Enhanced Raman Scattering Investigation of Targeted Delivery and Controlled Release of Gemcitabine. Int. J. Nanomed. 2017, 12, 7763–7776. [Google Scholar] [CrossRef]
- Kurzątkowska, K.; Santiago, T.; Hepel, M. Plasmonic Nanocarrier Grid-Enhanced Raman Sensor for Studies of Anticancer Drug Delivery. Biosens. Bioelectron. 2017, 91, 780–787. [Google Scholar] [CrossRef]
- Del Rosal, B.; Benayas, A. Strategies to Overcome Autofluorescence in Nanoprobe-Driven In Vivo Fluorescence Imaging. Small Methods 2018, 2, 1800075. [Google Scholar] [CrossRef]
- Hong, G.; Zou, Y.; Antaris, A.L.; Diao, S.; Wu, D.; Cheng, K.; Zhang, X.; Chen, C.; Liu, B.; He, Y.; et al. Ultrafast Fluorescence Imaging in Vivo with Conjugated Polymer Fluorophores in the Second Near-Infrared Window. Nat. Commun. 2014, 5, 1–9. [Google Scholar] [CrossRef] [PubMed]
- Meng, F.; Wang, J.; Ping, Q.; Yeo, Y. Quantitative Assessment of Nanoparticle Biodistribution by Fluorescence Imaging, Revisited. ACS Nano 2018, 12, 6458–6468. [Google Scholar] [CrossRef]
- Motamarry, A.; Negussie, A.H.; Rossmann, C.; Small, J.; Wolfe, A.M.; Wood, B.J.; Haemmerich, D. Real-Time Fluorescence Imaging for Visualization and Drug Uptake Prediction during Drug Delivery by Thermosensitive Liposomes. Int. J. Hyperth. 2019, 36, 817–826. [Google Scholar] [CrossRef] [PubMed]
- Hu, Z.; Fang, C.; Li, B.; Zhang, Z.; Cao, C.; Cai, M.; Su, S.; Sun, X.; Shi, X.; Li, C.; et al. First-in-Human Liver-Tumour Surgery Guided by Multispectral Fluorescence Imaging in the Visible and near-Infrared-I/II Windows. Nat. Biomed. Eng. 2020, 4, 259–271. [Google Scholar] [CrossRef]
- Zhang, H.; Fan, Y.; Pei, P.; Sun, C.; Lu, L.; Zhang, F. Tm 3+-Sensitized NIR-II Fluorescent Nanocrystals for In Vivo Information Storage and Decoding. Angew. Chem. 2019, 131, 10259–10263. [Google Scholar] [CrossRef]
- Li, T.; Yang, D.; Zhai, L.; Wang, S.; Zhao, B.; Fu, N.; Wang, L.; Tao, Y.; Huang, W. Thermally Activated Delayed Fluorescence Organic Dots (TADF Odots) for Time-Resolved and Confocal Fluorescence Imaging in Living Cells and In Vivo. Adv. Sci. 2017, 4, 1–11. [Google Scholar] [CrossRef]
- Zhang, Y.; Wei, C.; Lv, F.; Liu, T. Real-Time Imaging Tracking of a Dual-Fluorescent Drug Delivery System Based on Doxorubicin-Loaded Globin- Polyethylenimine Nanoparticles for Visible Tumor Therapy. Colloids Surf. B Biointerfaces 2018, 170, 163–171. [Google Scholar] [CrossRef]
- Sun, X.; Wang, G.; Zhang, H.; Hu, S.; Liu, X.; Tang, J.; Shen, Y. The Blood Clearance Kinetics and Pathway of Polymeric Micelles in Cancer Drug Delivery. ACS Nano 2018, 12, 6179–6192. [Google Scholar] [CrossRef] [PubMed]
- Lu, Z.; Zhang, Z.; Tang, Y. Conjugated Polymers-Based Thermal-Responsive Nanoparticles for Controlled Drug Delivery, Tracking, and Synergistic Photodynamic Therapy/Chemotherapy. ACS Appl. Bio Mater. 2019, 2, 4485–4492. [Google Scholar] [CrossRef]
- Zhen, S.; Yi, X.; Zhao, Z.; Lou, X.; Xia, F.; Tang, B.Z. Drug Delivery Micelles with Efficient Near-Infrared Photosensitizer for Combined Image-Guided Photodynamic Therapy and Chemotherapy of Drug-Resistant Cancer. Biomaterials 2019, 218, 119330. [Google Scholar] [CrossRef]
- Du, C.; Liang, Y.; Ma, Q.; Sun, Q.; Qi, J.; Cao, J.; Han, S.; Liang, M.; Song, B.; Sun, Y. Intracellular Tracking of Drug Release from PH-Sensitive Polymeric Nanoparticles via FRET for Synergistic Chemo-Photodynamic Therapy. J. Nanobiotechnol. 2019, 17, 113. [Google Scholar] [CrossRef]
- Polyak, A.; Ross, T.L. Nanoparticles for SPECT and PET Imaging: Towards Personalized Medicine and Theranostics. Curr. Med. Chem. 2018, 25, 4328–4353. [Google Scholar] [CrossRef] [PubMed]
- Lee, H.; Shields, A.F.; Siegel, B.A.; Miller, K.D.; Krop, I.; Ma, C.X.; LoRusso, P.M.; Munster, P.N.; Campbell, K.; Gaddy, D.F.; et al. 64 Cu-MM-302 Positron Emission Tomography Quantifies Variability of Enhanced Permeability and Retention of Nanoparticles in Relation to Treatment Response in Patients with Metastatic Breast Cancer. Clin. Cancer Res. 2017, 23, 4190–4202. [Google Scholar] [CrossRef] [PubMed]
- Man, F.; Lammers, T.; de Rosales, T.M.R. Imaging Nanomedicine-Based Drug Delivery: A Review of Clinical Studies. Mol. Imaging Biol. 2018, 20, 683–695. [Google Scholar] [CrossRef] [PubMed]
- Stockhofe, K.; Postema, J.; Schieferstein, H.; Ross, T. Radiolabeling of Nanoparticles and Polymers for PET Imaging. Pharmaceuticals 2014, 7, 392–418. [Google Scholar] [CrossRef] [PubMed]
- Lamb, J.; Holland, J.P. Advanced Methods for Radiolabeling Multimodality Nanomedicines for SPECT/MRI and PET/MRI. J. Nucl. Med. 2018, 59, 382–389. [Google Scholar] [CrossRef]
- Pérez-Medina, C.; Teunissen, A.J.P.; Kluza, E.; Mulder, W.J.M.; van der Meel, R. Nuclear Imaging Approaches Facilitating Nanomedicine Translation. Adv. Drug Deliv. Rev. 2020, 154–155, 123–141. [Google Scholar] [CrossRef] [PubMed]
- Pérez-Campaña, C.; Gómez-Vallejo, V.; Puigivila, M.; Martín, A.; Calvo-Fernández, T.; Moya, S.E.; Ziolo, R.F.; Reese, T.; Llop, J. Biodistribution of Different Sized Nanoparticles Assessed by Positron Emission Tomography: A General Strategy for Direct Activation of Metal Oxide Particles. ACS Nano 2013, 7, 3498–3505. [Google Scholar] [CrossRef] [PubMed]
- Llop, J.; Jiang, P.; Marradi, M.; Gómez-Vallejo, V.; Echeverría, M.; Yu, S.; Puigivila, M.; Baz, Z.; Szczupak, B.; Pérez-Campaña, C.; et al. Visualisation of Dual Radiolabelled Poly(Lactide-Co-Glycolide) Nanoparticle Degradation in Vivo Using Energy-Discriminant SPECT. J. Mater. Chem. B 2015, 3, 6293–6300. [Google Scholar] [CrossRef] [PubMed]
- Bindini, E.; de los Ramirez, M.A.; Rios, X.; Cossío, U.; Simó, C.; Gomez-Vallejo, V.; Soler-Illia, G.; Llop, J.; Moya, S.E. In Vivo Tracking of the Degradation of Mesoporous Silica through 89Zr Radio Labelled Core-Shell Nanoparticles. Small. accepted. [CrossRef]
- Tandel, H.; Bhatt, P.; Jain, K.; Shahiwala, A.; Misra, A. In-Vitro and In-Vivo Tools in Emerging Drug Delivery Scenario: Challenges and Updates. In In-Vitro and In-Vivo Tools in Drug Delivery Research for Optimum Clinical Outcomes; Misra, A., Shahiwala, A., Eds.; CRC Press: Boca Raton, FL, USA; Taylor & Francis: Milton, UK, 2018; pp. 1–24. ISBN 978-1-315-15004-8. [Google Scholar]


| Techniques | Advantages | Disadvantages | Experimental Type | References |
|---|---|---|---|---|
| FC | Quantitative measurements of NC/drug uptake in a cell population measuring fluorescence at single cell level. | Requires fluorescence labelling. Cannot discriminate easily between NPs. inside or on the surface of cells. | In vitro | [34,35,36,37,47] |
| CLSM | Able to visualize the location of NCs and drugs inside cell organelles. | Requires fluorescence labelling. Can give false results due to detached dyes from NCs. | Mainly in vitro | [23,24,25,26,27] |
| FRET | Can determine the proximity of two fluorescence molecules in vitro and in vivo. can be used for studying release of drugs or degradation of NPs | Requires labelling and sometimes complex. Molecular design. | In vitro/in vivo | [50,51] |
| FCS/FCCS | Allows for studying diffusion of fluorescent molecules and the temporally correlate the association of labelled species. Can be applied for studying degradation of NCs or Drug release. | Requires fluorescence labelling. Photobleaching can difficult measurements | In vitro | [63,64,79,80] |
| FLIM | Imaging is based on measuring lifetime of fluorescence molecules that can be traced even with low intensity. Lifetime measurements are sensitive to environmental conditions such as pH, ionic strength, temperature. | Requires fluorescence labelling. Can give false results due to detached dyes from NCs. | In vitro/in vivo | [81,82,83,84,85] |
| Fluorescence Imaging | Gives precise information about NCs/drug distribution biodistribution (in vivo). | Long exposure to fluorescent light can cause bleaching. Dye detachment can lead to a false localization of NPs or drugs. Not quantitative. | In vivo | [106,107,108] |
| Raman | Minimal sample preparation. Non-invasive. Non-destructive. Label-free manner visualization of NPs and drug in cells and tissues. Co localization studies of NPs and drug without additional labelling. | Limited confocality. Time consuming. Fluorescence can interfere with measurements. | In vitro | [94,96] |
| PET/SPECT | Based on the detection of radioactive element. Quantitative. In vivo biodistribution of NPs/drugs can be quantitatively determined. | Requires radiolabelling nanomaterials. Can give false. Information if radioisotopes detach. Molecules and imaging techniques are not easily accessible. | In vivo | [118,119,120,121,122,123] |
Publisher’s Note: MDPI stays neutral with regard to jurisdictional claims in published maps and institutional affiliations. |
© 2021 by the authors. Licensee MDPI, Basel, Switzerland. This article is an open access article distributed under the terms and conditions of the Creative Commons Attribution (CC BY) license (https://creativecommons.org/licenses/by/4.0/).
Share and Cite
Perrigue, P.M.; Murray, R.A.; Mielcarek, A.; Henschke, A.; Moya, S.E. Degradation of Drug Delivery Nanocarriers and Payload Release: A Review of Physical Methods for Tracing Nanocarrier Biological Fate. Pharmaceutics 2021, 13, 770. https://doi.org/10.3390/pharmaceutics13060770
Perrigue PM, Murray RA, Mielcarek A, Henschke A, Moya SE. Degradation of Drug Delivery Nanocarriers and Payload Release: A Review of Physical Methods for Tracing Nanocarrier Biological Fate. Pharmaceutics. 2021; 13(6):770. https://doi.org/10.3390/pharmaceutics13060770
Chicago/Turabian StylePerrigue, Patrick M., Richard A. Murray, Angelika Mielcarek, Agata Henschke, and Sergio E. Moya. 2021. "Degradation of Drug Delivery Nanocarriers and Payload Release: A Review of Physical Methods for Tracing Nanocarrier Biological Fate" Pharmaceutics 13, no. 6: 770. https://doi.org/10.3390/pharmaceutics13060770
APA StylePerrigue, P. M., Murray, R. A., Mielcarek, A., Henschke, A., & Moya, S. E. (2021). Degradation of Drug Delivery Nanocarriers and Payload Release: A Review of Physical Methods for Tracing Nanocarrier Biological Fate. Pharmaceutics, 13(6), 770. https://doi.org/10.3390/pharmaceutics13060770