
Novel Multitarget Hydroxamic Acids with a Natural Origin CAP Group against Alzheimer’s Disease: Synthesis, Docking and Biological Evaluation


 , , , , ,
 ,
,  and
and
Abstract
:
1. Introduction
2. Materials and Methods
2.1. Chemistry
2.2. General Method for the Synthesis of Hydroxamic Acids 1 and 2
2.3. N-Hydroxyadamantane-1-Carboxamide 1
2.4. N-Hydroxyadamantane-2-Carboxamide 2
2.5. General Method for Hydroxamic Acid 11–16 Synthesis
2.6. N1-Hydroxy-N8-((1R,2R,4R)-1,7,7-Trimethylbicyclo [2.2.1]heptan-2-yl)octanediamide 11
2.7. N1-Hydroxy-N9-((1R,2R,4R)-1,7,7-Trimethylbicyclo [2.2.1]heptan-2-yl)nonanediamide 12
2.8. N1-Hydroxy-N8-((1R,2R,4S)-1,3,3-Trimethylbicyclo[2.2.1]heptan-2-yl)octanediamide 13
2.9. N1-Hydroxy-N9-((1R,2R,4S)-1,3,3-Trimethylbicyclo[2.2.1]heptan-2-yl)nonanediamide 14
2.10. N1-(Adamant-2-yl)-N8-Hydroxyoctanediamide 15
2.11. N1-(Adamantan-2-yl)-N9-Hydroxynonanediamide 16
2.12. Methyl 4-Formylbenzoate 18
2.13. (E)-3-(4-Methoxycarbonylphenyl)prop-2-Enoic Acid 19
2.14. General Procedure for the Synthesis of Esters 20–22
2.15. Methyl 4-((E)-3-Oxo-3-(((1S,2R,4R)-1,7,7-Trimethylbicyclo[2.2.1]heptan-2-yl)amino)prop-1-en-1-yl)benzoate 20
2.16. Methyl 4-((E)-3-Oxo-3-(((1S,2R,4S)-1,3,3-Trimethylbicyclo[2.2.1]heptan-2-yl)amino)prop-1-en-1-yl)benzoate 21
2.17. Methyl 4-((E)-3-((Adamantan-2-yl)amino)-3-Oxoprop-1-en-1-yl)benzoate 22
2.18. General Procedure for the Synthesis of Target Hydroxamic Acids 23–25
2.19. N-Hydroxy-4-((E)-3-Oxo-3-(((2R,4R)-1,7,7-Trimethylbicyclo[2.2.1]heptan-2-yl)amino)prop-1-en-1-yl)benzamide 23
2.20. N-Hydroxy-4-((E)-3-Oxo-3-(((1S,4S)-1,3,3-Trimethylbicyclo[2.2.1]heptan-2-yl)amino)prop-1-en-1-yl)benzamide 24
2.21. 4-((E)-3-((-Adamantan-2-yl)amino)-3-Oxoprop-1-en-1-yl)-N-Hydroxybenzamide 25
2.21.1. In Vitro
Lipid Peroxidation
Antiradical Activity
HDAC6 Inhibiting Properties
Docking
Antiaggregation Activity
Influence on Cell Viability
2.21.2. In silico Evaluation of Pharmacokinetic Parameters of Synthesized Compounds
2.21.3. Plasma Sample Preparation and LC–MS/MS Analysis
2.21.4. In Vivo
Animals and Experimental Groups
The Open Field Test
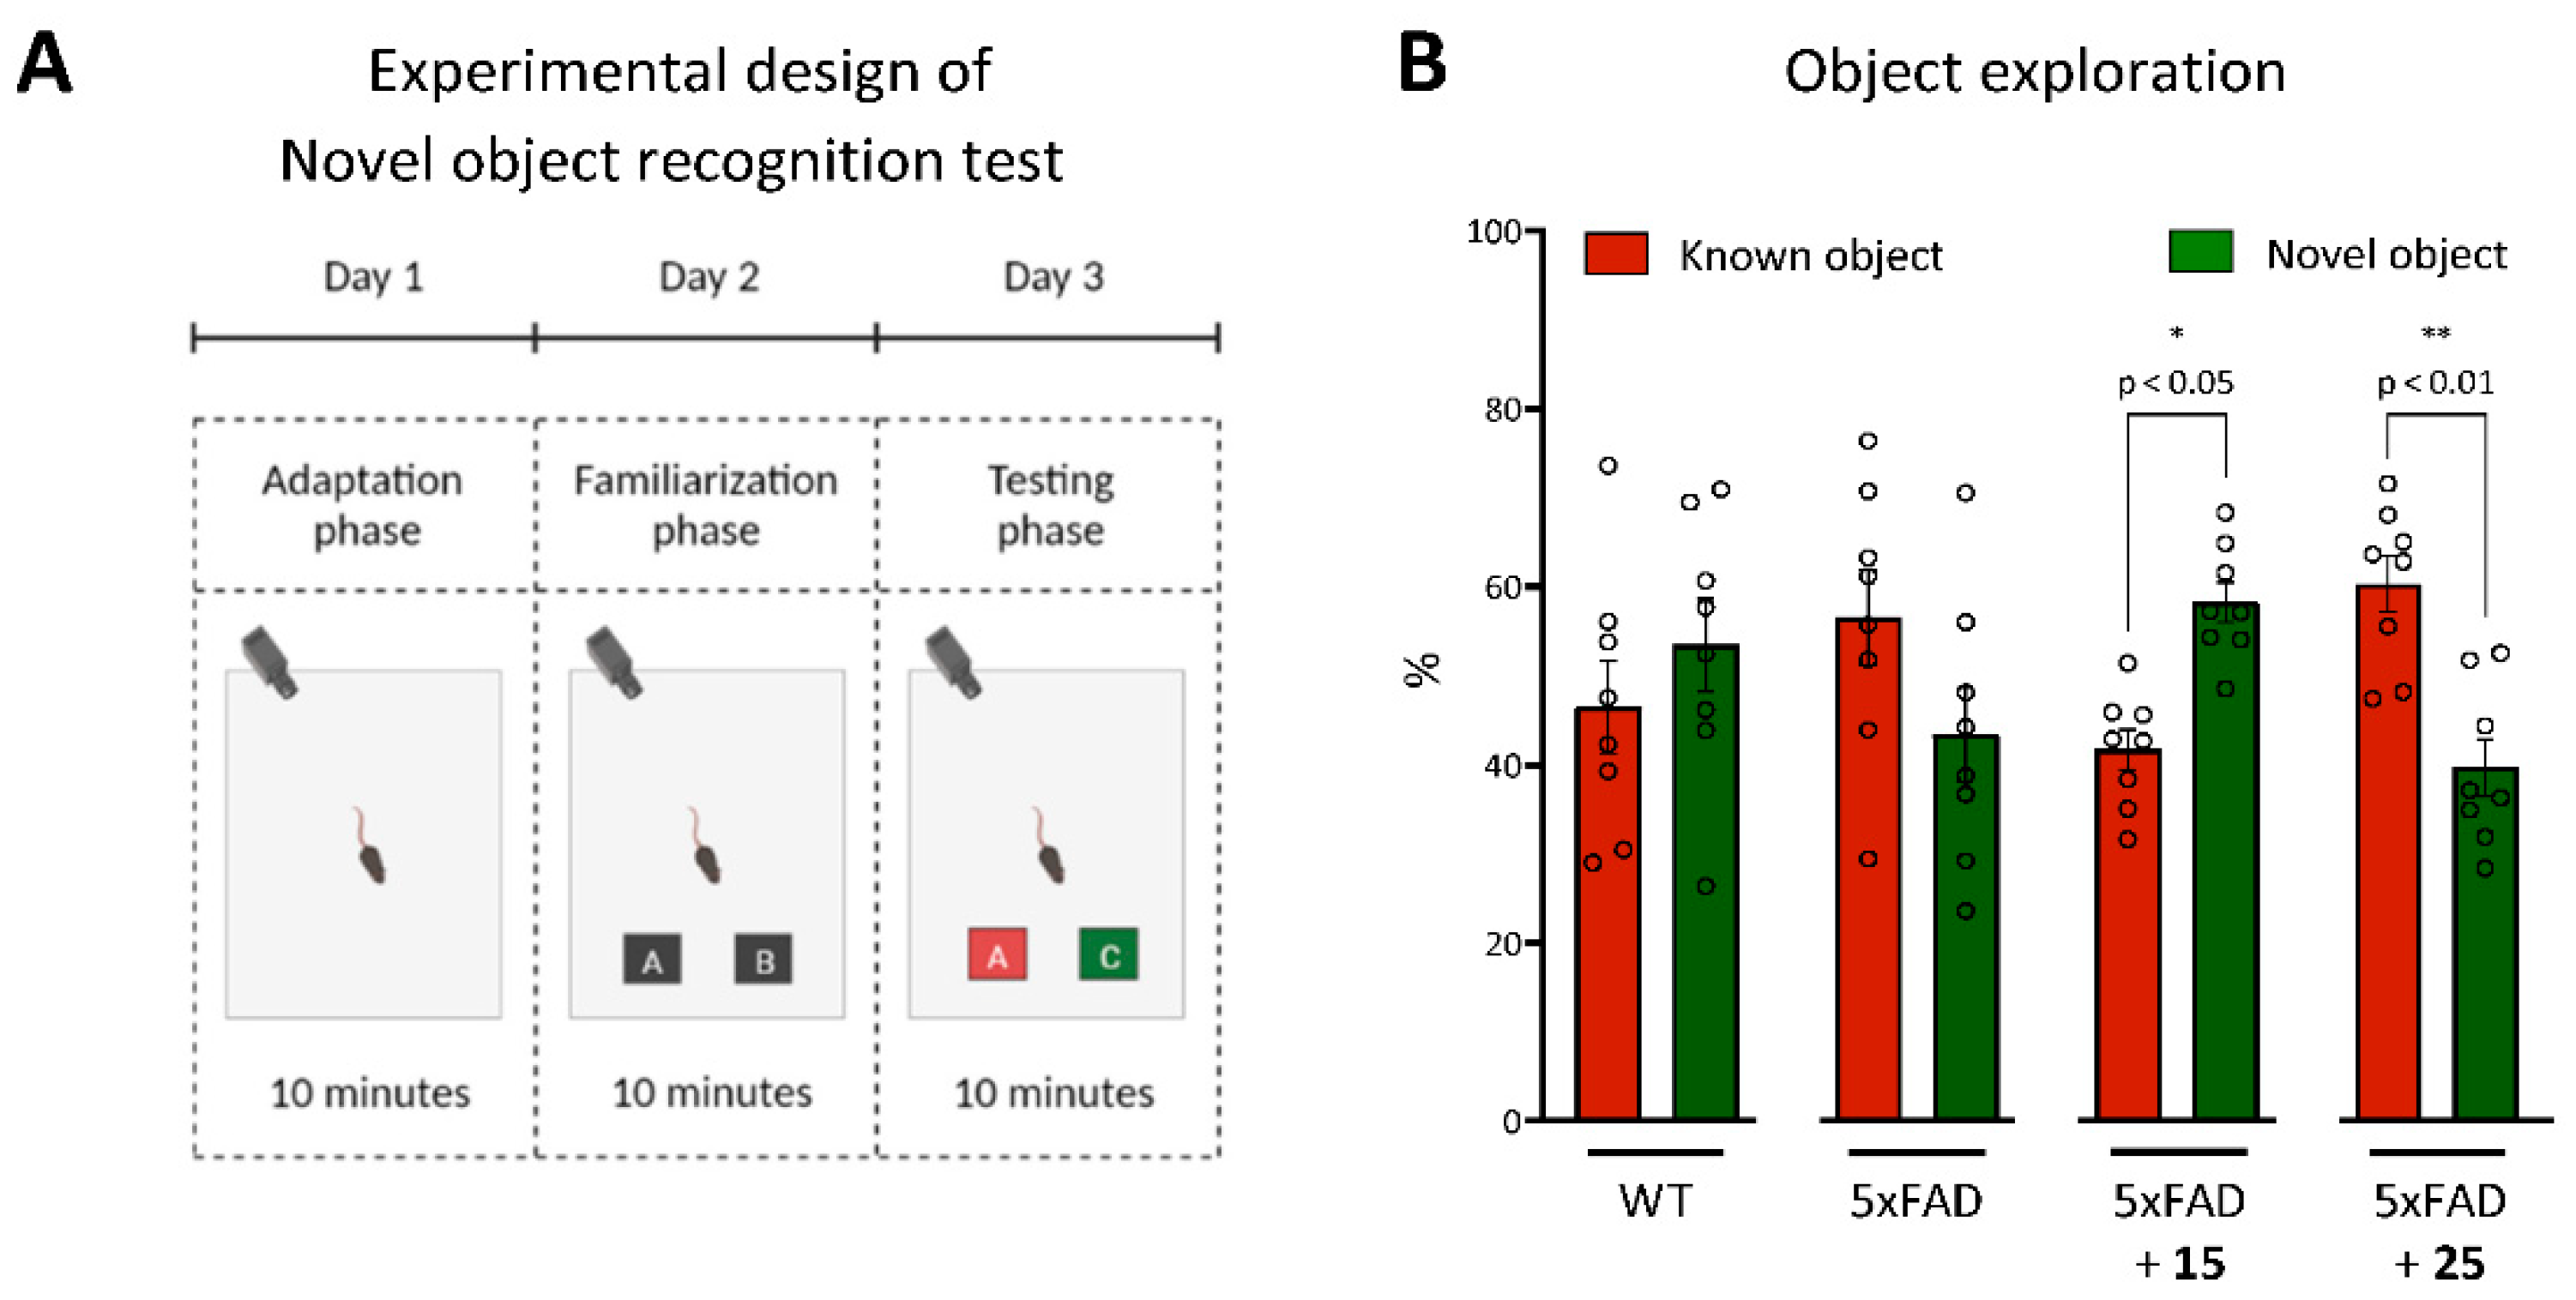
The Novel Object Recognition Test
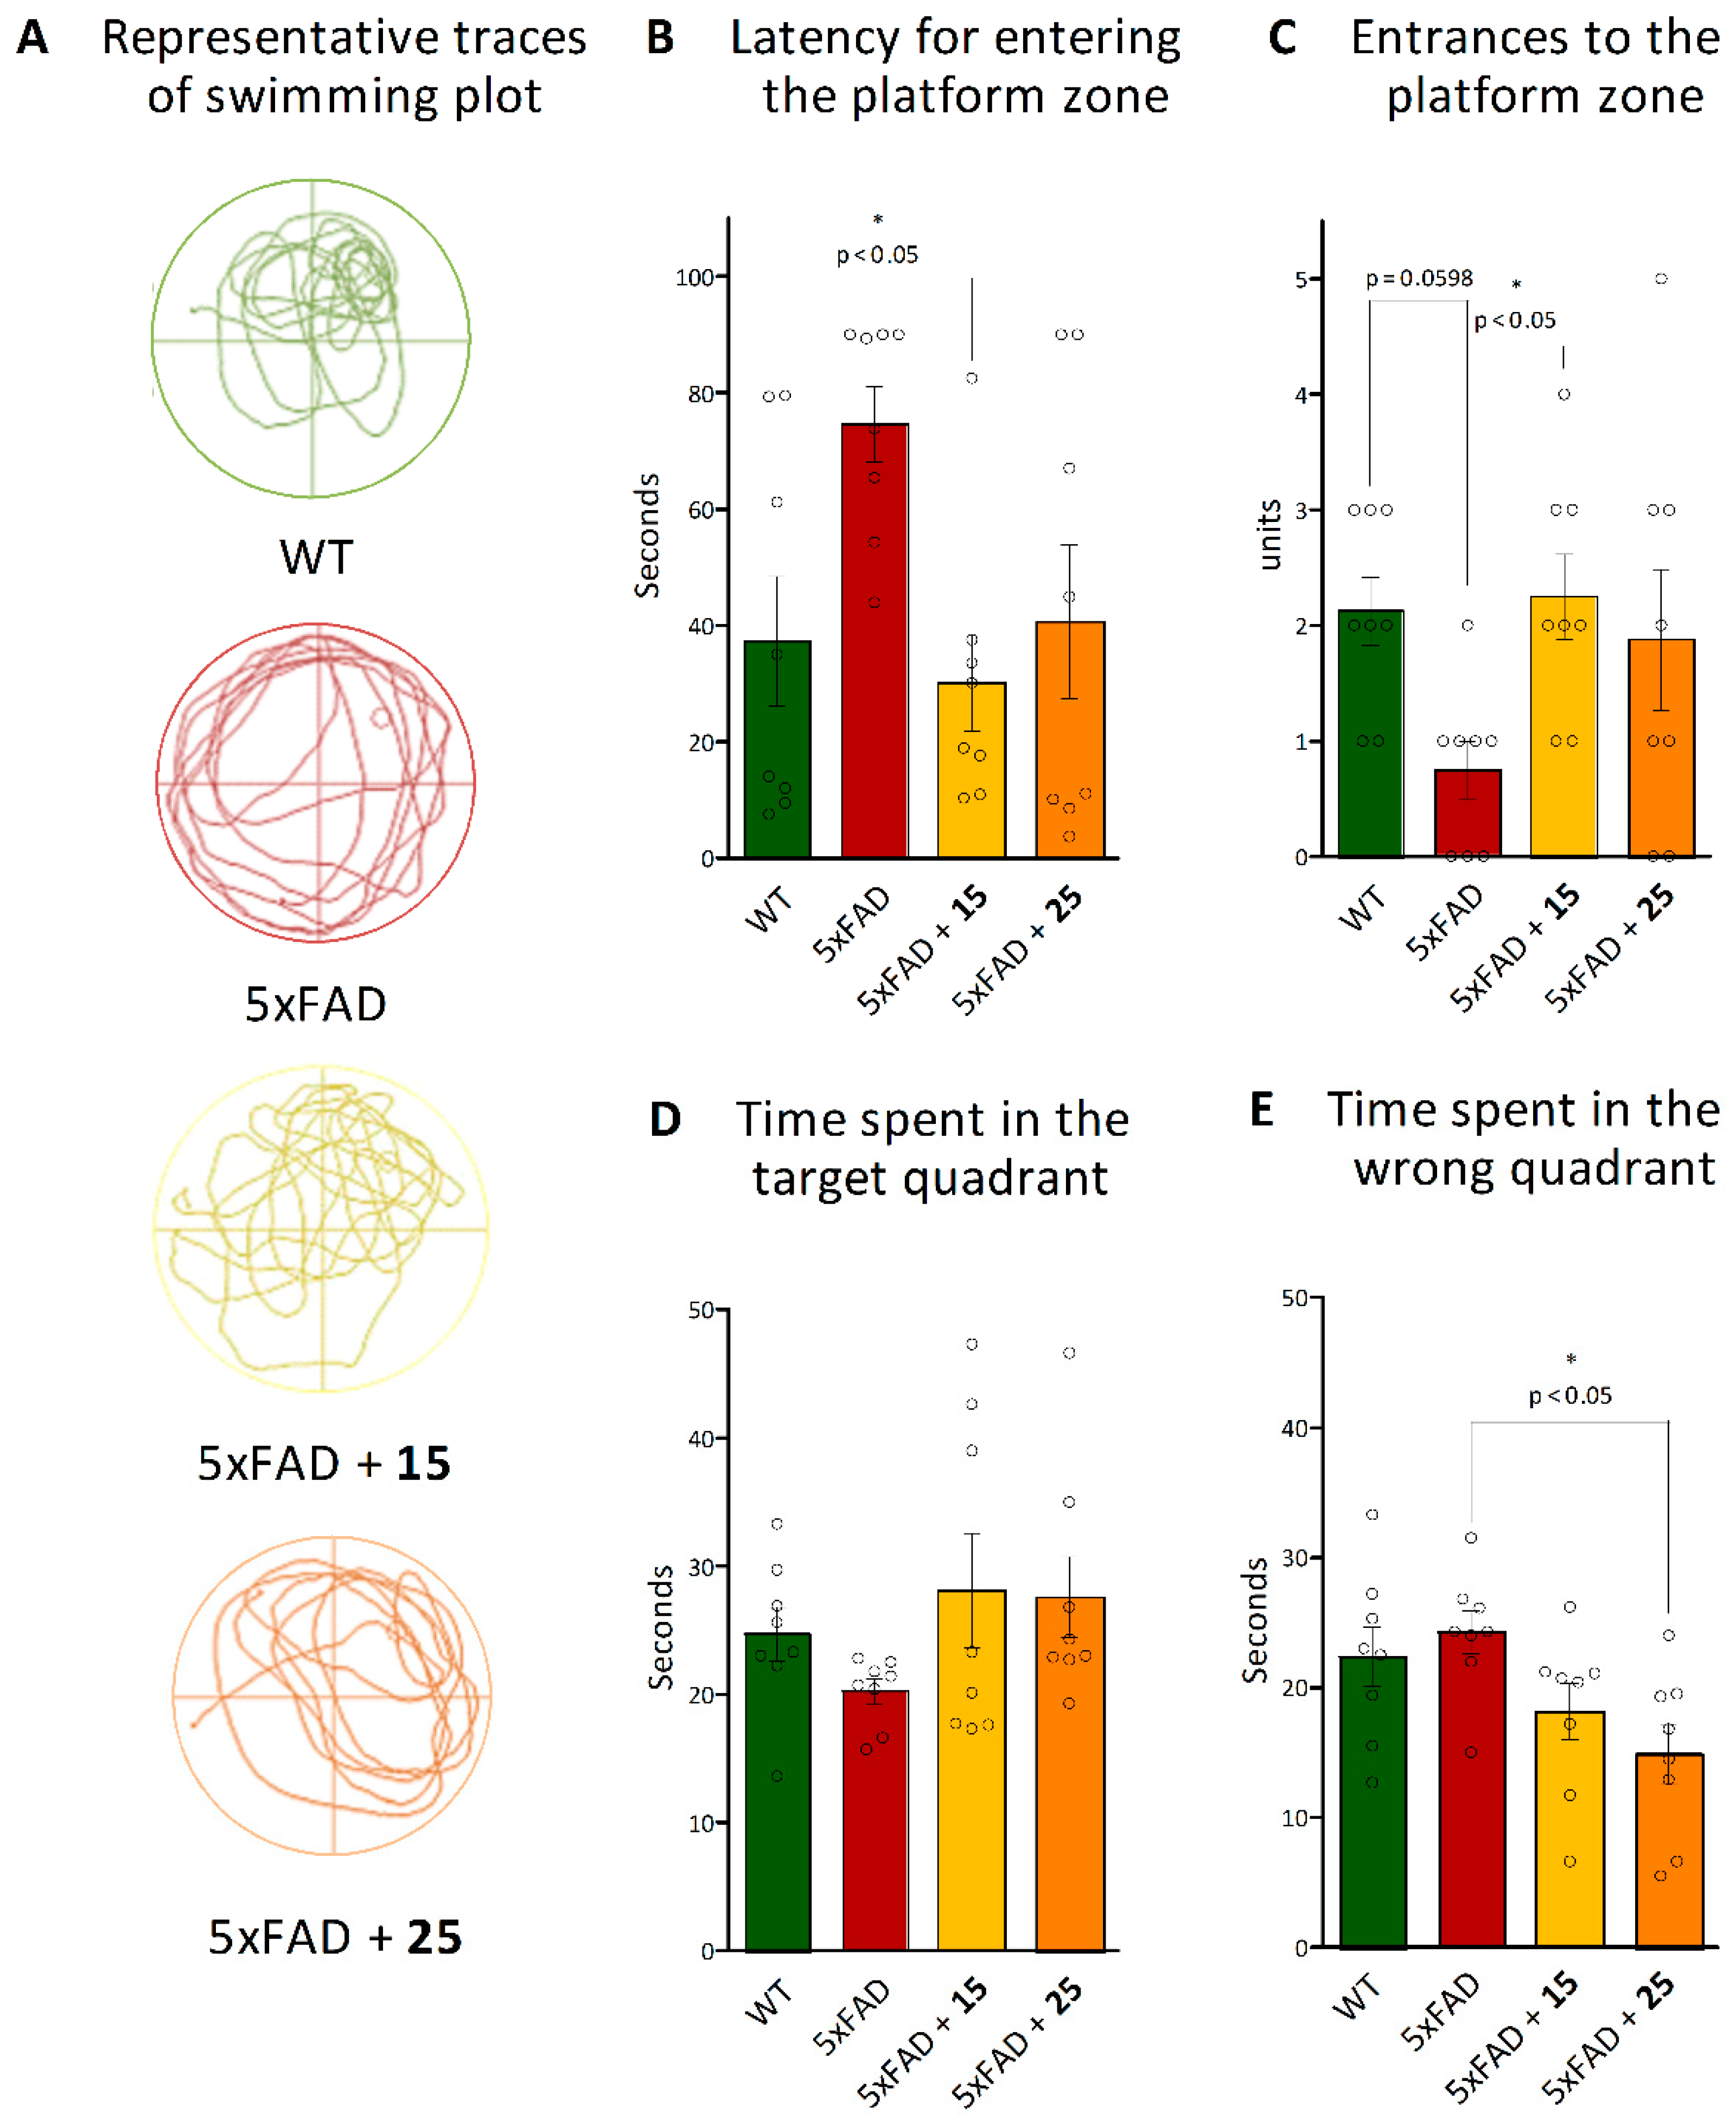
Morris Water Maze Test
2.21.5. Ex Vivo
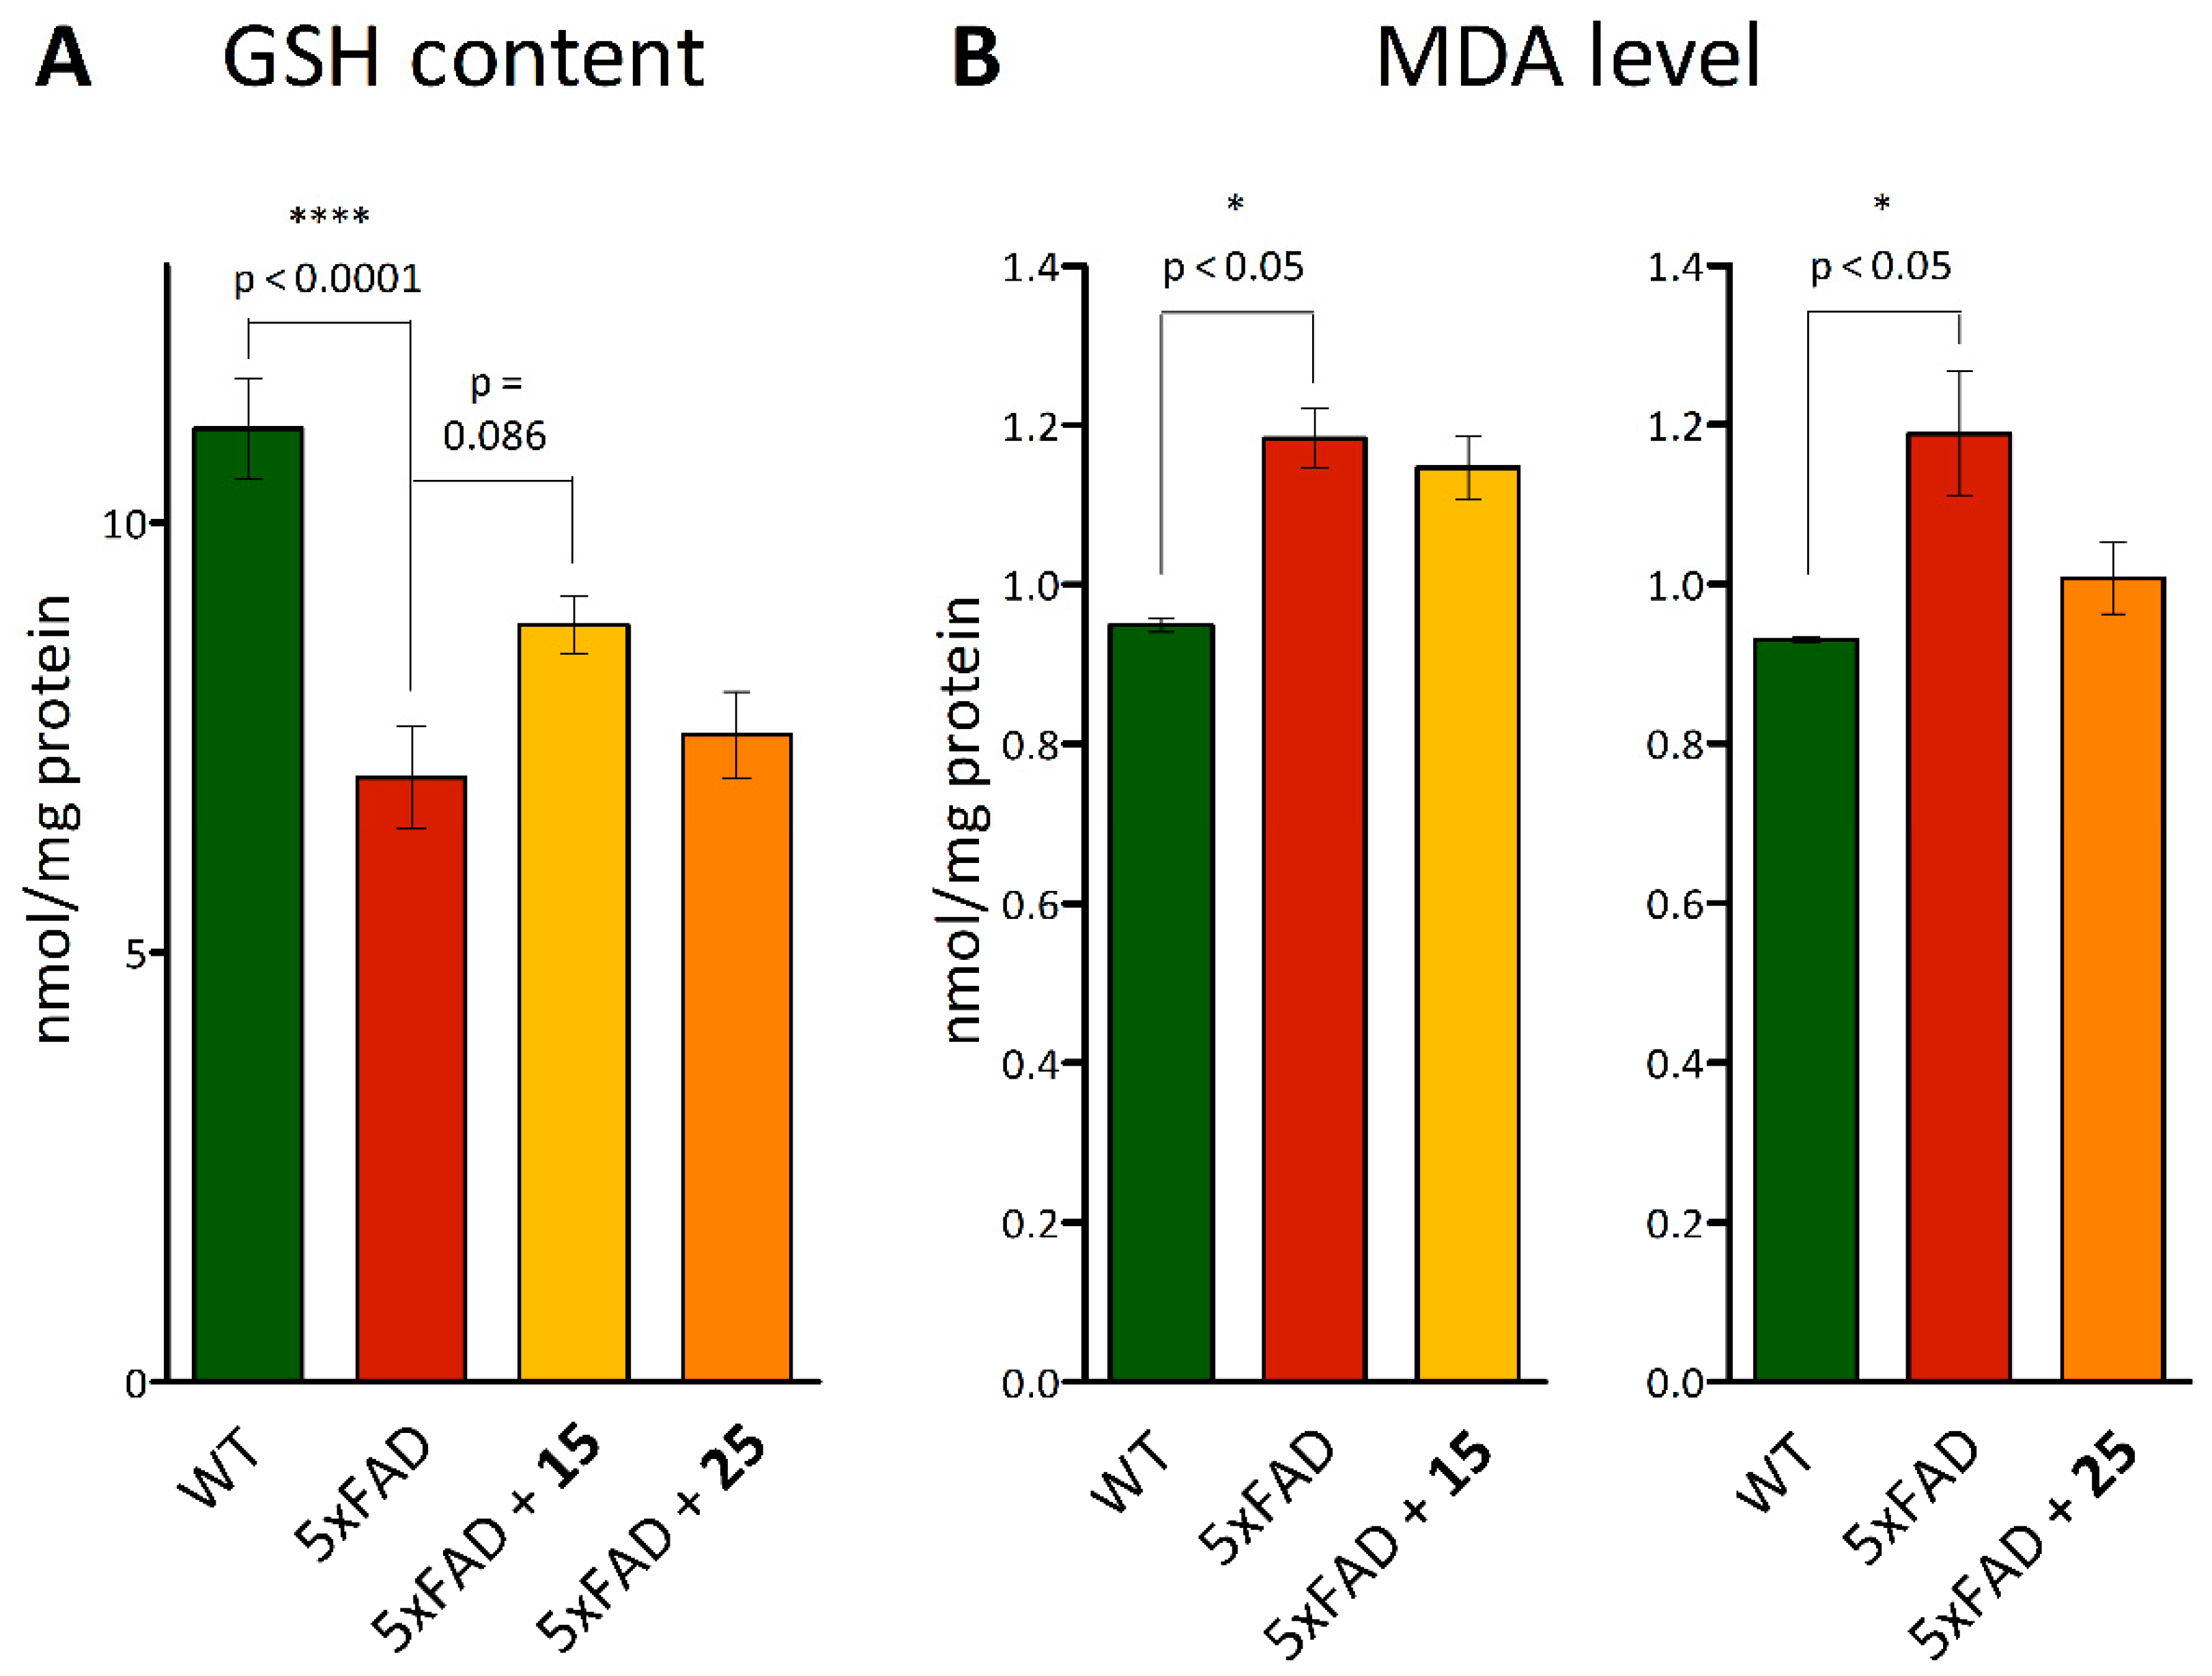
MDA Level and Glutathione Content
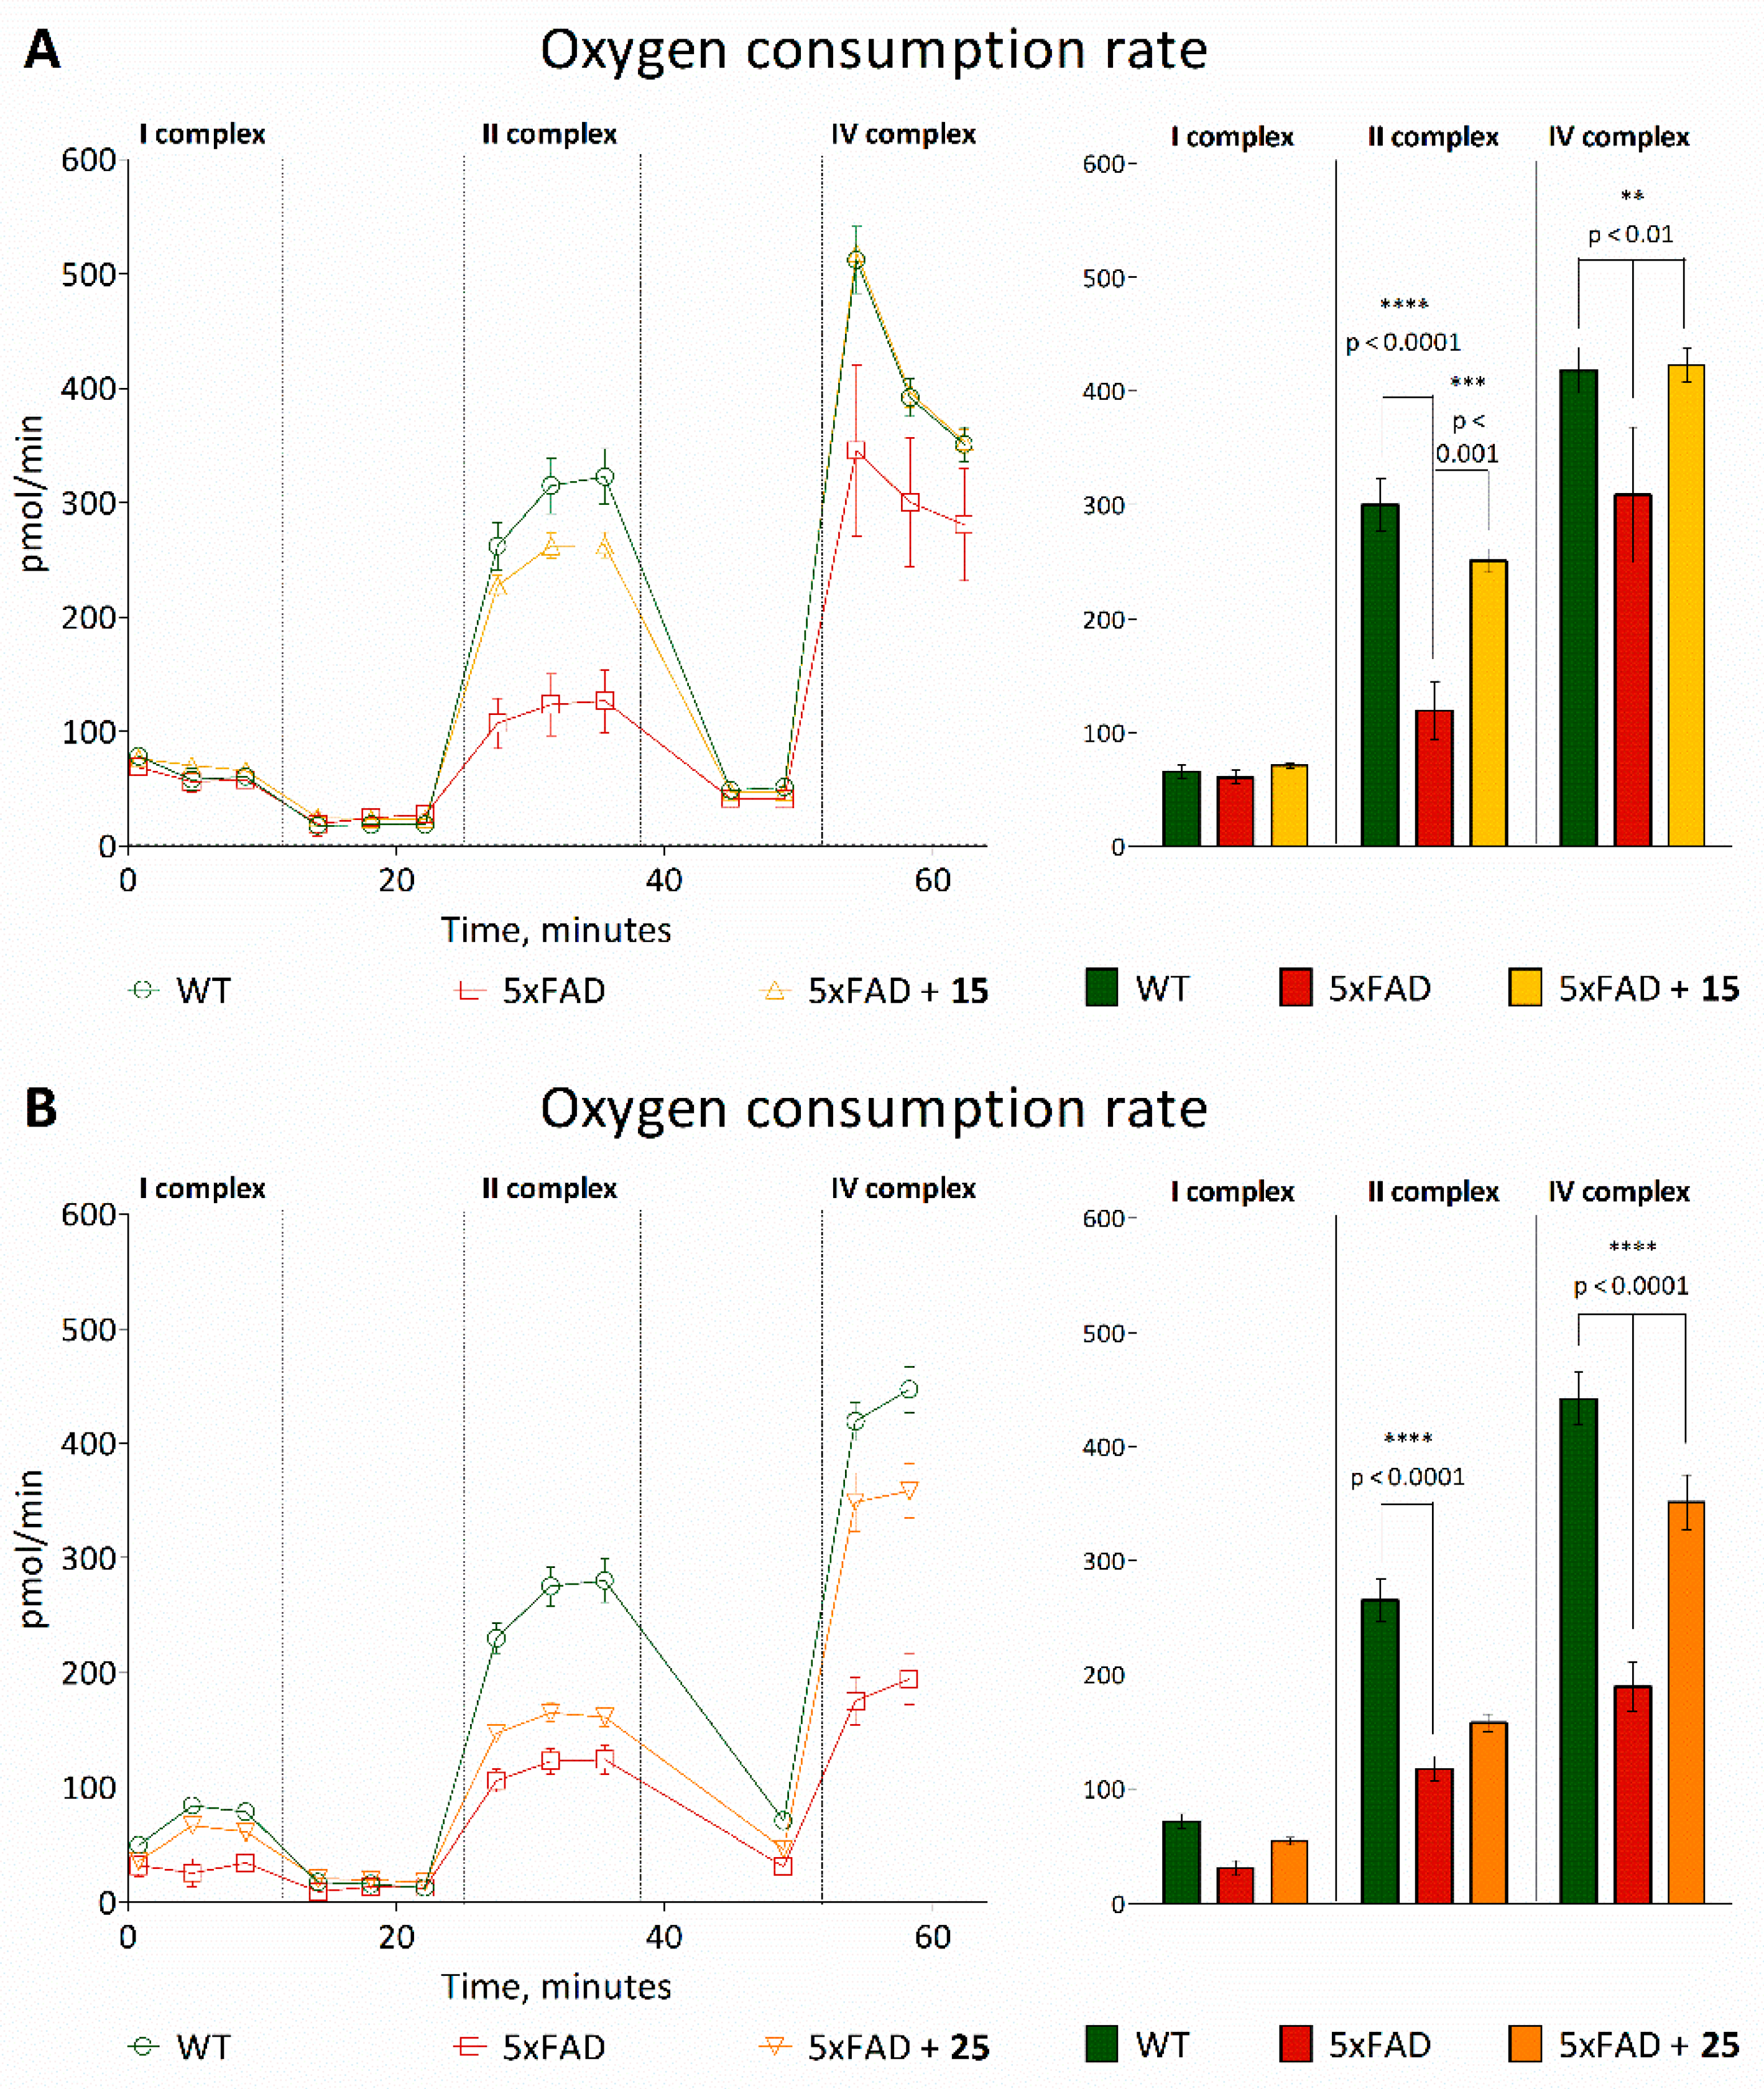
Bioenergetic Characteristics of the Mitochondria
Histology and Histochemistry
2.22. Data Analysis
3. Results and Discussion
3.1. Chemical Synthesis
3.2. Biological Evaluation
3.2.1. In Vitro
Antioxidant Activity
Inhibition of HDAC6
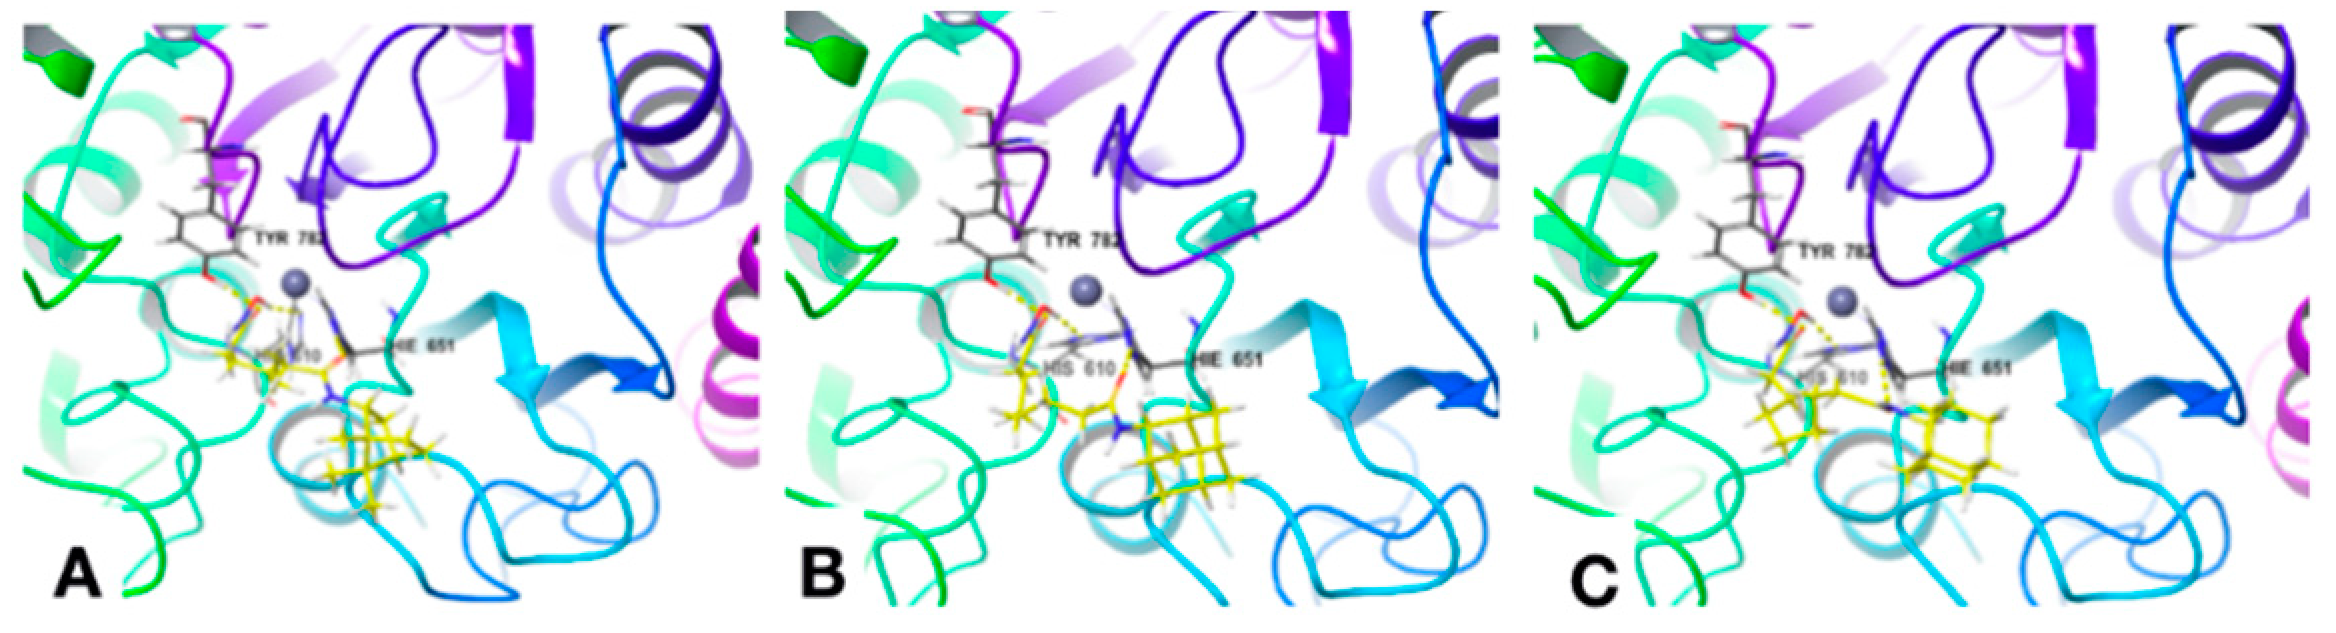
Docking
Antiaggregation Activity
Influence on Cell Viability
3.2.2. In silico Assessment of the Pharmacokinetic Parameters of the Synthesized Compounds
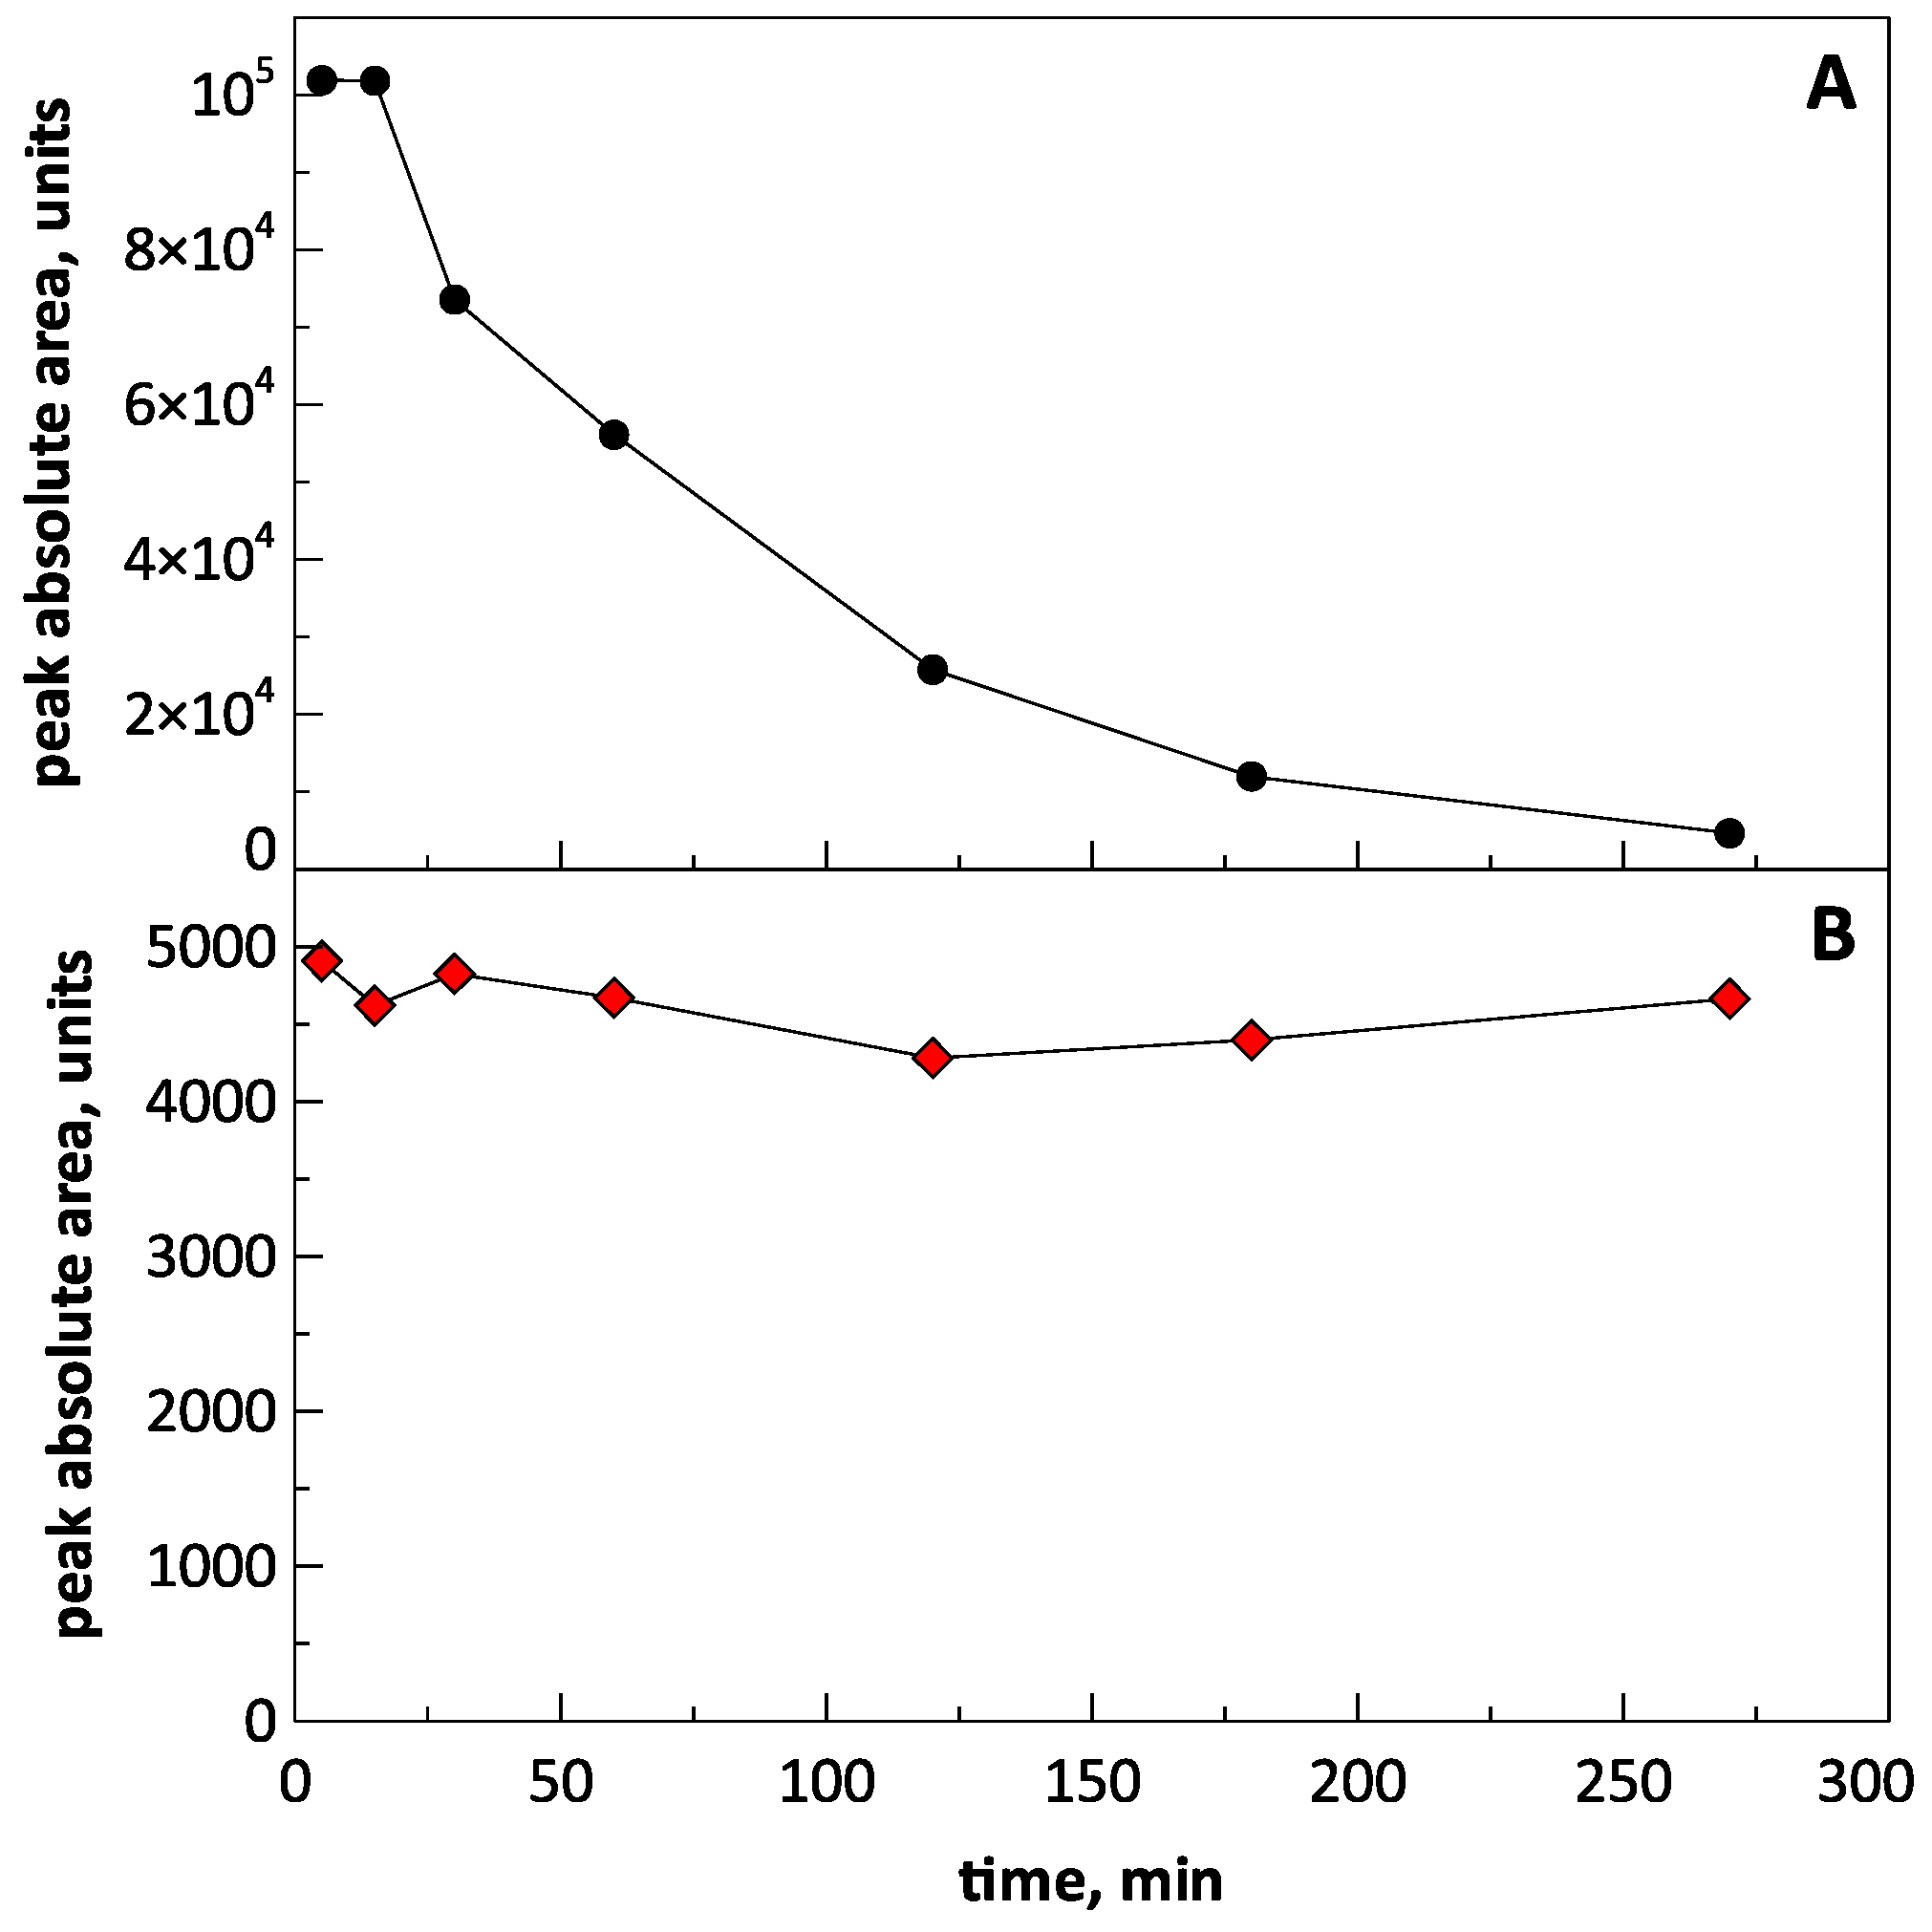
3.2.3. Stability Study of the Compounds 15 and 25 in Blood Plasma of Rats
3.2.4. In Vivo
Open Field Test
Novel Object Recognition
Morris Water Maze Test
3.2.5. Ex Vivo
4. Conclusions
Supplementary Materials
Author Contributions
Funding
Institutional Review Board Statement
Informed Consent Statement
Data Availability Statement
Acknowledgments
Conflicts of Interest
References
- Manal, M.; Chandrasekar, M.; Priya, J.G.; Nanjan, M. Inhibitors of histone deacetylase as antitumor agents: A critical review. Bioorganic Chem. 2016, 67, 18–42. [Google Scholar] [CrossRef]
- Giannini, G.; Battistuzzi, G.; Vignola, D. Hydroxamic acid based histone deacetylase inhibitors with confirmed activity against the malaria parasite. Bioorg. Med. Chem. Lett. 2015, 25, 459–461. [Google Scholar] [CrossRef]
- Rao, M.; Valentini, D.; Zumla, A.; Maeurer, M. Evaluation of the efficacy of valproic acid and suberoylanilide hydroxamic acid (vorinostat) in enhancing the effects of first-line tuberculosis drugs against intracellular Mycobacterium tuberculosis. Int. J. Infect. Dis. 2018, 69, 78–84. [Google Scholar] [CrossRef] [Green Version]
- Campiani, G.; Cavella, C.; Osko, J.D.; Brindisi, M.; Relitti, N.; Brogi, S.; Saraswati, A.P.; Federico, S.; Chemi, G.; Maramai, S.; et al. Harnessing the Role of HDAC6 in Idiopathic Pulmonary Fibrosis: Design, Synthesis, Structural Analysis, and Biological Evaluation of Potent Inhibitors. J. Med. Chem. 2021, 64, 9960–9988. [Google Scholar] [CrossRef]
- Qiu, X.; Xiao, X.; Li, N.; Li, Y. Histone deacetylases inhibitors (HDACis) as novel therapeutic application in various clinical diseases. Prog. Neuropsychopharmacol. Biol. Psychiatry 2017, 72, 60–72. [Google Scholar] [CrossRef]
- Xu, K.; Dai, X.-L.; Huang, H.-C.; Jiang, Z.-F. Targeting HDACs: A Promising Therapy for Alzheimer′s Disease. Oxidative Med. Cell. Longev. 2011, 2011, 143269. [Google Scholar] [CrossRef] [Green Version]
- Benito, E.; Urbanke, H.; Ramachandran, B.; Barth, J.; Halder, R.; Awasthi, A.; Jain, G.; Capece, V.; Burkhardt, S.; Navarro-Sala, M.; et al. HDAC inhibitor–dependent transcriptome and memory reinstatement in cognitive decline models. J. Clin. Investig. 2015, 125, 3572–3584. [Google Scholar] [CrossRef] [Green Version]
- Chopra, V.; Quinti, L.; Khanna, P.; Paganetti, P.; Kuhn, R.; Young, A.B.; Kazantsev, A.G.; Hersch, S. LBH589, A Hydroxamic Acid-Derived HDAC Inhibitor, is Neuroprotective in Mouse Models of Huntington’s Disease. J. Huntington’s Dis. 2016, 5, 347–355. [Google Scholar] [CrossRef] [Green Version]
- Rivieccio, M.A.; Brochier, C.; Willis, D.E.; Walker, B.A.; D’Annibale, M.A.; McLaughlin, K.; Siddiq, A.; Kozikowski, A.P.; Jaffrey, S.; Twiss, J.L.; et al. HDAC6 is a target for protection and regeneration following injury in the nervous system. Proc. Natl. Acad. Sci. USA 2009, 106, 19599–19604. [Google Scholar] [CrossRef] [Green Version]
- Ryu, H.; Lee, J.; Olofsson, B.A.; Mwidau, A.; Deodoglu, A.; Escudero, M.; Flemington, E.; Azizkhan-Clifford, J.; Ferrante, R.J.; Ratan, R.R. Histone deacetylase inhibitors prevent oxidative neuronal death independent of expanded polyglutamine repeats via an Sp1-dependent pathway. Proc. Natl. Acad. Sci. USA 2003, 100, 4281–4286. [Google Scholar] [CrossRef] [Green Version]
- Langley, B.; D′Annibale, M.A.; Suh, K.; Ayoub, I.; Tolhurst, A.; Bastan, B.; Yang, L.; Ko, B.; Fisher, M.; Cho, S.; et al. Pulse Inhibition of Histone Deacetylases Induces Complete Resistance to Oxidative Death in Cortical Neurons without Toxicity and Reveals a Role for Cytoplasmic p21waf1/cip1 in Cell Cycle-Independent Neuroprotection. J. Neurosci. 2008, 28, 163–176. [Google Scholar] [CrossRef]
- Sleiman, S.F.; Berlin, J.; Basso, M.; Karuppagounder, S.S.; Rohr, J.; Ratan, R.R. Histone Deacetylase Inhibitors and Mithramycin A Impact a Similar Neuroprotective Pathway at a Crossroad between Cancer and Neurodegeneration. Pharmaceuticals 2011, 4, 1183–1195. [Google Scholar] [CrossRef] [Green Version]
- Guo, Y.; Li, Z.; Shi, C.; Li, J.; Yao, M.; Chen, X. Trichostatin A attenuates oxidative stress-mediated myocardial injury through the FoxO3a signaling pathway. Int. J. Mol. Med. 2017, 40, 999–1008. [Google Scholar] [CrossRef] [Green Version]
- Olson, D.E.; Sleiman, S.; Bourassa, M.W.; Wagner, F.F.; Gale, J.P.; Zhang, Y.-L.; Ratan, R.R.; Holson, E.B. Hydroxamate-Based Histone Deacetylase Inhibitors Can Protect Neurons from Oxidative Stress via a Histone Deacetylase-Independent Catalase-Like Mechanism. Chem. Biol. 2015, 22, 439–445. [Google Scholar] [CrossRef] [Green Version]
- Sleiman, S.F.; Olson, D.; Bourassa, M.W.; Karuppagounder, S.S.; Zhang, Y.-L.; Gale, J.; Wagner, F.F.; Basso, M.; Coppola, G.; Pinto, J.T.; et al. Hydroxamic acid-based histone deacetylase (HDAC) inhibitors can mediate neuroprotection independent of HDAC inhibition. J. Neurosci. 2014, 34, 14328–14337. [Google Scholar] [CrossRef] [Green Version]
- Mucke, L.; Selkoe, D.J. Neurotoxicity of Amyloid -Protein: Synaptic and Network Dysfunction. Cold Spring Harb. Perspect. Med. 2012, 2, a006338. [Google Scholar] [CrossRef] [Green Version]
- Zhang, Y.; He, M.-L. Deferoxamine enhances alternative activation of microglia and inhibits amyloid beta deposits in APP/PS1 mice. Brain Res. 2017, 1677, 86–92. [Google Scholar] [CrossRef]
- Parvathy, S.; Hussain, I.; Karran, E.H.; Turner, A.A.J.; Hooper, N.M. Alzheimer’s Amyloid Precursor Protein α-Secretase Is Inhibited by Hydroxamic Acid-Based Zinc Metalloprotease Inhibitors: Similarities to the Angiotensin Converting Enzyme Secretase. Biochemistry 1998, 37, 1680–1685. [Google Scholar] [CrossRef]
- Bieliauskas, A.V.; Weerasinghe, S.V.W.; Negmeldin, A.T.; Pflum, M.K.H. Structural Requirements of Histone Deacetylase Inhibitors: SAHA Analogs Modified on the Hydroxamic Acid. Arch. der Pharm. 2016, 349, 373–382. [Google Scholar] [CrossRef]
- Neganova, M.E.; Klochkov, S.G.; Aleksandrova, Y.R.; Aliev, G. The Hydroxamic Acids as a Potential Anticancer and Neuroprotective Agents. Curr. Med. Chem. 2020, 28, 1–23. [Google Scholar] [CrossRef]
- He, F.; Chou, C.J.; Scheiner, M.; Poeta, E.; Chen, N.Y.; Gunesch, S.; Hoffmann, M.; Sotriffer, C.; Monti, B.; Maurice, T.; et al. Melatonin- and Ferulic Acid-Based HDAC6 Selective Inhibitors Exhibit Pronounced Immunomodulatory Effects In Vitro and Neuroprotective Effects in a Pharmacological Alzheimer’s Disease Mouse Model. J. Med. Chem. 2021, 64, 3794–3812. [Google Scholar] [CrossRef] [PubMed]
- De Lera, A.R.; Ganesan, A. Two-hit wonders: The expanding universe of multitargeting epigenetic agents. Curr. Opin. Chem. Biol. 2020, 57, 135–154. [Google Scholar] [CrossRef]
- Smalley, J.P.; Cowley, S.M.; Hodgkinson, J.T. Bifunctional HDAC Therapeutics: One Drug to Rule Them All? Molecules 2020, 25, 4394. [Google Scholar] [CrossRef]
- Piccialli, V.; Tedeschi, L.; Caputo, L.; Amato, G.; De Martino, L.; De Feo, V.; Secondo, A.; Pannaccione, A. The Antioxidant Activity of Limonene Counteracts Neurotoxicity Triggered by Aβ1-42 Oligomers in Primary Cortical Neurons. Antioxidants 2021, 10, 937. [Google Scholar] [CrossRef]
- Kabir, T.; Uddin, S.; Al Mamun, A.; Jeandet, P.; Aleya, L.; Mansouri, R.A.; Ashraf, G.M.; Mathew, B.; Bin-Jumah, M.N.; Abdel-Daim, M.M. Combination Drug Therapy for the Management of Alzheimer’s Disease. Int. J. Mol. Sci. 2020, 21, 3272. [Google Scholar] [CrossRef]
- Dembitsky, V.M.; Gloriozova, T.A.; Poroikov, V.V. Pharmacological profile of natural and synthetic compounds with rigid adamantane-based scaffolds as potential agents for the treatment of neurodegenerative diseases. Biochem. Biophys. Res. Commun. 2020, 529, 1225–1241. [Google Scholar] [CrossRef]
- Marotta, G.; Basagni, F.; Rosini, M.; Minarini, A. Memantine Derivatives as Multitarget Agents in Alzheimer’s Disease. Molecules 2020, 25, 4005. [Google Scholar] [CrossRef]
- Kuns, B.; Rosani, A.; Varghese, D. Memantine; StatPearls: Treasure Island, FL, USA, 2021. [Google Scholar]
- Nepali, K.; Hsu, T.-I.; Hsieh, C.-M.; Lo, W.-L.; Lai, M.-J.; Hsu, K.-C.; Lin, T.E.; Chuang, J.-Y.; Liou, J.-P. Pragmatic recruitment of memantine as the capping group for the design of HDAC inhibitors: A preliminary attempt to unravel the enigma of glioblastoma. Eur. J. Med. Chem. 2021, 217, 113338. [Google Scholar] [CrossRef]
- Jia, M.; Zhang, H.; Lin, Y.; Chen, D.; Chen, Y.; Xia, Y. Consecutive Lossen rearrangement/transamidation reaction of hydroxamic acids under catalyst- and additive-free conditions. Org. Biomol. Chem. 2018, 16, 3615–3624. [Google Scholar] [CrossRef]
- Qian, S.; He, T.; Wang, W.; He, Y.; Zhang, M.; Yang, L.; Li, G.-B.; Wang, Z. Discovery and preliminary structure–activity relationship of 1H-indazoles with promising indoleamine-2,3-dioxygenase 1 (IDO1) inhibition properties. Bioorganic Med. Chem. 2016, 24, 6194–6205. [Google Scholar] [CrossRef]
- Morera, L.; Roatsch, M.; Fürst, M.C.D.; Hoffmann, I.; Senger, J.; Hau, M.; Franz, H.; Schüle, R.; Heinrich, M.R.; Jung, M. 4-Biphenylalanine- and 3-Phenyltyrosine-Derived Hydroxamic Acids as Inhibitors of the JumonjiC-Domain-Containing Histone Demethylase KDM4A. ChemMedChem 2016, 11, 2063–2083. [Google Scholar] [CrossRef] [PubMed]
- Gornall, A.G.; Bardawill, C.J.; David, M.M. Determination of serum proteins by means of the biuret reaction. J. Biol Chem. 1949, 177, 751–766. [Google Scholar] [CrossRef]
- Neganova, M.E.; Klochkov, S.G.; Afanasieva, S.V.; Serkova, T.P.; Chudinova, E.S.; Bachurin, S.O.; Reddy, V.P.; Aliev, G.; Shevtsova, E.F. Neuroprotective effects of the securinine-analogues: Identification of Allomargaritarine as a lead compound. CNS Neurol. Disord. Drug Targets 2016, 15, 102–107. [Google Scholar] [CrossRef] [PubMed]
- Milackova, I.; Kovacikova, L.; Veverka, M.; Gallovič, J.; Stefek, M. Screening for antiradical efficiency of 21 semi-synthetic derivatives of quercetin in a DPPH assay. Interdiscip. Toxicol. 2013, 6, 13–17. [Google Scholar] [CrossRef] [Green Version]
- RCSB PDB. Available online: https://www.rcsb.org (accessed on 10 May 2021).
- Schrödinger Release 2018-1: Maestro, Schrödinger; LLC: New York, NY, USA, 2018.
- Harder, E.; Damm, W.; Maple, J.; Wu, C.; Reboul, M.; Xiang, J.Y.; Wang, L.; Lupyan, D.; Dahlgren, M.K.; Knight, J.L.; et al. OPLS3: A Force Field Providing Broad Coverage of Drug-like Small Molecules and Proteins. J. Chem. Theory Comput. 2016, 12, 281–296. [Google Scholar] [CrossRef]
- Greenwood, J.R.; Calkins, D.; Sullivan, A.P.; Shelley, J.C. Towards the comprehensive, rapid, and accurate prediction of the favorable tautomeric states of drug-like molecules in aqueous solution. J. Comput. Mol. Des. 2010, 24, 591–604. [Google Scholar] [CrossRef]
- Shelley, J.C.; Cholleti, A.; Frye, L.L.; Greenwood, J.R.; Timlin, M.R.; Uchimaya, M. Epik: A software program for pK a prediction and protonation state generation for drug-like molecules. J. Comput. Mol. Des. 2007, 21, 681–691. [Google Scholar] [CrossRef] [PubMed]
- Phan, H.T.T.; Samarat, K.; Takamura, Y.; Azo-Oussou, A.F.; Nakazono, Y.; Vestergaard, M.C. Polyphenols Modulate Alzheimer’s Amyloid Beta Aggregation in a Structure-Dependent Manner. Nutrients 2019, 11, 756. [Google Scholar] [CrossRef] [Green Version]
- Präbst, K.; Engelhardt, H.; Ringgeler, S.; Hübner, H. Basic Colorimetric Proliferation Assays: MTT, WST, and Resazurin. Methods Mol. Biol. 2017, 1601, 1–17. [Google Scholar] [CrossRef]
- Kraeuter, A.-K.; Guest, P.C.; Sarnyai, Z. The Open Field Test for Measuring Locomotor Activity and Anxiety-Like Behavior. Methods Mol. Biol. 2019, 1916, 99–103. [Google Scholar] [CrossRef]
- Lueptow, L.M. Novel Object Recognition Test for the Investigation of Learning and Memory in Mice. J. Vis. Exp. 2017, 2017, e55718. [Google Scholar] [CrossRef]
- Morris, R. Developments of a water-maze procedure for studying spatial learning in the rat. J. Neurosci. Methods 1984, 11, 47–60. [Google Scholar] [CrossRef]
- Vorhees, C.V.; Williams, M. Morris water maze: Procedures for assessing spatial and related forms of learning and memory. Nat. Protoc. 2006, 1, 848–858. [Google Scholar] [CrossRef] [Green Version]
- Connor-Robson, N.; Peters, O.; Millership, S.; Ninkina, N.; Buchman, V.L. Combinational losses of synucleins reveal their differential requirements for compensating age-dependent alterations in motor behavior and dopamine metabolism. Neurobiol. Aging 2016, 46, 107–112. [Google Scholar] [CrossRef] [PubMed] [Green Version]
- Ninkina, N.; Papachroni, K.; Robertson, D.C.; Schmidt, O.; Delaney, L.; O’Neill, F.; Court, F.; Rosenthal, A.; Fleetwood-Walker, S.M.; Davies, A.M.; et al. Neurons Expressing the Highest Levels of γ-Synuclein Are Unaffected by Targeted Inactivation of the Gene. Mol. Cell. Biol. 2003, 23, 8233–8245. [Google Scholar] [CrossRef] [Green Version]
- Stokes, G. An improved Congo red method for amyloid. Med. Lab. Sci. 1976, 33, 79–80. [Google Scholar] [PubMed]
- Doughty, M.J. A Grid-Based Nucleus Counting Method for Estimates of the Density of Superficial Conjunctival Cells from Impression Cytology Samples Taken from Normal Healthy Human Eyes. Curr. Eye Res. 2017, 42, 1228–1234. [Google Scholar] [CrossRef] [PubMed]
- Suslov, E.V.; Mozhaytsev, E.S.; Korchagina, D.V.; Bormotov, N.I.; Yarovaya, O.I.; Volcho, K.P.; Serova, O.A.; Agafonov, A.P.; Maksyutov, R.A.; Shishkina, L.N.; et al. New chemical agents based on adamantane–monoterpene conjugates against orthopoxvirus infections. RSC Med. Chem. 2020, 11, 1185–1195. [Google Scholar] [CrossRef]
- Zhou, Y.; Dong, J.; Zhang, F.; Gong, Y. Synthesis of C1-Symmetric Chiral Secondary Diamines and Their Applications in the Asymmetric Copper(II)-Catalyzed Henry (Nitroaldol) Reactions. J. Org. Chem. 2011, 76, 588–600. [Google Scholar] [CrossRef]
- Komnatnyy, V.V.; Chiang, W.-C.; Tolker-Nielsen, T.; Givskov, M. Bacteria-Triggered Release of Antimicrobial Agents. Angew. Chem. Int. Ed. 2014, 53, 439–441. [Google Scholar] [CrossRef]
- Mai, A.; Esposito, M.; Sbardella, G.; Massa, S. A new facile and expeditious synthesis of N-hydroxy-N\'-phenyloctanediamide, a potent inducer of terminal cytodifferentiation. Org. Prep. Proced. Int. 2001, 33, 391–394. [Google Scholar] [CrossRef]
- Rabbito, A.; Dulewicz, M.; Kulczyńska-Przybik, A.; Mroczko, B. Biochemical Markers in Alzheimer’s Disease. Int. J. Mol. Sci. 2020, 21, 1989. [Google Scholar] [CrossRef] [Green Version]
- Neganova, M.E.; Aleksandrova, Y.R.; Nebogatikov, V.O.; Klochkov, S.; Ustyugov, A.A. Promising molecular targets for pharmacological therapy of neurodegenerative pathologies. Acta Naturae 2020, 12, 60–80. [Google Scholar] [CrossRef] [PubMed]
- Dias, C.P.; de Lima, M.M.; Presti-Torres, J.; Dornelles, A.; Garcia, V.; Scalco, F.S.; Guimarães, M.R.; Constantino, L.; Budni, P.; Dal-Pizzol, F.; et al. Memantine reduces oxidative damage and enhances long-term recognition memory in aged rats. Neuroscience 2007, 146, 1719–1725. [Google Scholar] [CrossRef] [PubMed]
- Neganova, M.E.; Klochkov, S.G.; Aleksandrova, Y.R.; Aliev, G. Histone modifications in epigenetic regulation of cancer: Perspectives and achieved progress. Semin. Cancer Biol. 2020, 8. [Google Scholar] [CrossRef]
- Pulya, S.; Amin, S.A.; Adhikari, N.; Biswas, S.; Jha, T.; Ghosh, B. HDAC6 as privileged target in drug discovery: A perspective. Pharmacol. Res. 2021, 163, 105274. [Google Scholar] [CrossRef]
- Melesina, J.; Simoben, C.V.; Praetorius, L.; Bülbül, E.F.; Robaa, D.; Sippl, W. Strategies To Design Selective Histone Deacetylase Inhibitors. ChemMedChem 2021, 16, 1336–1359. [Google Scholar] [CrossRef] [PubMed]
- Zhang, X.-H.; Ma, Q.-; Wu, H.-P.; Khamis, M.Y.; Li, Y.-H.; Ma, L.-Y.; Liu, H.-M. A Review of Progress in Histone Deacetylase 6 Inhibitors Research: Structural Specificity and Functional Diversity. J. Med. Chem. 2021, 64, 1362–1391. [Google Scholar] [CrossRef]
- Hai, Y.; Christianson, Y.H.D.W. Histone deacetylase 6 structure and molecular basis of catalysis and inhibition. Nat. Chem. Biol. 2016, 12, 741–747. [Google Scholar] [CrossRef] [Green Version]
- Friesner, R.A.; Murphy, R.B.; Repasky, M.P.; Frye, L.L.; Greenwood, J.R.; Halgren, T.A.; Sanschagrin, P.C.; Mainz, D.T. Extra Precision Glide: Docking and Scoring Incorporating a Model of Hydrophobic Enclosure for Protein−Ligand Complexes. J. Med. Chem. 2006, 49, 6177–6196. [Google Scholar] [CrossRef] [Green Version]
- Halgren, T.A.; Murphy, R.B.; Friesner, R.A.; Beard, H.S.; Frye, L.L.; Pollard, W.T.; Banks, J.L. Glide: A New Approach for Rapid, Accurate Docking and Scoring. 2. Enrichment Factors in Database Screening. J. Med. Chem. 2004, 47, 1750–1759. [Google Scholar] [CrossRef] [PubMed]
- Friesner, R.A.; Banks, J.L.; Murphy, R.B.; Halgren, T.A.; Klicic, J.J.; Mainz, D.T.; Repasky, M.P.; Knoll, E.H.; Shelley, M.; Perry, J.K.; et al. Glide: A New Approach for Rapid, Accurate Docking and Scoring. 1. Method and Assessment of Docking Accuracy. J. Med. Chem. 2004, 47, 1739–1749. [Google Scholar] [CrossRef]
- Sweeney, P.; Park, H.; Baumann, M.; Dunlop, J.; Frydman, J.; Kopito, R.; McCampbell, A.; Leblanc, G.; Venkateswaran, A.; Nurmi, A.; et al. Protein misfolding in neurodegenerative diseases: Implications and strategies. Transl. Neurodegener. 2017, 6, 6. [Google Scholar] [CrossRef] [PubMed] [Green Version]
- Weydt, P.; La Spada, A.R. Targeting protein aggregation in neurodegeneration—lessons from polyglutamine disorders. Expert Opin. Ther. Targets 2006, 10, 505–513. [Google Scholar] [CrossRef] [PubMed]
- Neganova, M.E.; Klochkov, S.; Petrova, L.N.; Shevtsova, E.F.; Afanasieva, S.V.; Chudinova, E.S.; Fisenko, V.P.; Bachurin, S.O.; Barreto, G.E.; Aliev, G. Securinine Derivatives as Potential Anti-amyloid Therapeutic Approach. CNS Neurol. Disord. Drug Targets 2017, 16, 351–355. [Google Scholar] [CrossRef]
- Takahashi-Ito, K.; Makino, M.; Okado, K.; Tomita, T. Memantine inhibits β-amyloid aggregation and disassembles preformed β-amyloid aggregates. Biochem. Biophys. Res. Commun. 2017, 493, 158–163. [Google Scholar] [CrossRef]
- Parvathy, S.; Hussain, I.; Karran, E.H.; Turner, A.J.; Hooper, N.M. The amyloid precursor protein (APP) and the angiotensin converting enzyme (ACE) secretase are inhibited by hydroxamic acid-based inhibitors. Biochem. Soc. Trans. 1998, 26, S242. [Google Scholar] [CrossRef]
- Mishchenko, D.V.; Neganova, M.E.; Klimanova, E.N.; Sashenkova, T.E.; Klochkov, S.G.; Shevtsova, E.F.; Vystorop, I.V.; Tarasov, V.V.; Chubarev, V.; Samsonova, A.N.; et al. Chemosensitizing Activity of Histone Deacetylases Inhibitory Cyclic Hydroxamic Acids for Combination Chemotherapy of Lymphatic Leukemia. Curr. Cancer Drug Targets 2018, 18, 365–371. [Google Scholar] [CrossRef]
- Oakley, H.; Cole, S.L.; Logan, S.; Maus, E.; Shao, P.; Craft, J.; Guillozet-Bongaarts, A.; Ohno, M.; Disterhoft, J.; Van Eldik, L.; et al. Intraneuronal beta-Amyloid Aggregates, Neurodegeneration, and Neuron Loss in Transgenic Mice with Five Familial Alzheimer’s Disease Mutations: Potential Factors in Amyloid Plaque Formation. J. Neurosci. 2006, 26, 10129–10140. [Google Scholar] [CrossRef]
- Mumby, D.G.; Gaskin, S.; Glenn, M.J.; Schramek, T.E.; Lehmann, H. Hippocampal Damage and Exploratory Preferences in Rats: Memory for Objects, Places, and Contexts. Learn. Mem. 2002, 9, 49–57. [Google Scholar] [CrossRef] [Green Version]
- Eacott, M.J. Integrated Memory for Object, Place, and Context in Rats: A Possible Model of Episodic-Like Memory? J. Neurosci. 2004, 24, 1948–1953. [Google Scholar] [CrossRef] [PubMed] [Green Version]
- Wolfer, D.P.; Madani, R.; Valenti, P.; Lipp, H.-P. Extended analysis of path data from mutant mice using the public domain software Wintrack. Physiol. Behav. 2001, 73, 745–753. [Google Scholar] [CrossRef]
- Agrawal, I.; Jha, S. Mitochondrial Dysfunction and Alzheimer’s Disease: Role of Microglia. Front. Aging Neurosci. 2020, 12, 252. [Google Scholar] [CrossRef] [PubMed]
- Cassidy, L.; Fernandez, F.; Johnson, J.B.; Naiker, M.; Owoola, A.G.; Broszczak, D.A. Oxidative stress in alzheimer’s disease: A review on emergent natural polyphenolic therapeutics. Complement. Ther. Med. 2020, 49, 102294. [Google Scholar] [CrossRef]
- Ali, T.; Kim, T.; Rehman, S.U.; Khan, M.S.; Amin, F.U.; Khan, M.; Ikram, M.; Kim, M.O. Natural Dietary Supplementation of Anthocyanins via PI3K/Akt/Nrf2/HO-1 Pathways Mitigate Oxidative Stress, Neurodegeneration, and Memory Impairment in a Mouse Model of Alzheimer’s Disease. Mol. Neurobiol. 2018, 55, 6076–6093. [Google Scholar] [CrossRef]
- Uruno, A.; Matsumaru, D.; Ryoke, R.; Saito, R.; Kadoguchi, S.; Saigusa, D.; Saito, T.; Saido, T.C.; Kawashima, R.; Yamamoto, M. Nrf2 Suppresses Oxidative Stress and Inflammation in App Knock-In Alzheimer’s Disease Model Mice. Mol. Cell. Biol. 2020, 40, e00467-19. [Google Scholar] [CrossRef]
- Klann, I.P.; Martini, F.; Rosa, S.G.; Nogueira, C.W. Ebselen reversed peripheral oxidative stress induced by a mouse model of sporadic Alzheimer’s disease. Mol. Biol. Rep. 2020, 47, 2205–2215. [Google Scholar] [CrossRef]
- Gaschler, M.M.; Stockwell, B.R. Lipid peroxidation in cell death. Biochem. Biophys. Res. Commun. 2017, 482, 419–425. [Google Scholar] [CrossRef]
- Querfurth, H.W.; LaFerla, F.M. Alzheimer’s Disease. N. Engl. J. Med. 2010, 362, 329–344. [Google Scholar] [CrossRef] [Green Version]


| Analyte and Its Parent Ion Q1 (m/z) | Fragment Ion (Q3 m/z, Da) | DP, V | EP, V | CEP, V | CE, V | CXP, V |
|---|---|---|---|---|---|---|
| compound 15 (323.6) | 135.2 | 56 | 5.0 | 32 | 35 | 4.0 |
| 290.6 | 61 | 3.5 | 24 | 27 | 4.0 | |
| 152.3 | 66 | 6.0 | 32 | 31 | 4.0 | |
| compound 25 (341.6) | 135.4 | 56 | 5.5 | 32 | 37 | 4.0 |
| 207.4 | 71 | 3.5 | 22 | 27 | 8.0 | |
| 323.6 | 56 | 5.0 | 32 | 17 | 18.0 |
| % of Activity * | IC50 HDAC6 Inhibitory Activity, µM | |||
|---|---|---|---|---|
| Inhibition of LPO | Antiradical Activity | |||
| t-BHP | Fe (II) | |||
| Trolox | 99.11 ± 3.72 | 97.21 ± 4.09 | - | - |
| Trich. A | - | - | - | 0.03 ± 0.01 |
| 1 | - | - | - | - |
| 2 | - | - | 32.02 ± 3.33 | - |
| 11 | 35.96 ± 1.99 | 28.39 ±7.41 | 22.22 ± 1.40 | 0.69 ± 0.02 |
| 12 | 30.36 ± 1.98 | 44.02 ± 1.57 | - | 4.06 ± 0.48 |
| 13 | 24.02 ± 3.44 | 28.90 ± 3.38 | - | 9.44 ± 0.74 |
| 14 | 22.62 ± 4.31 | 37.91 ± 1.08 | - | 4.48 ± 0.13 |
| 15 | 43.24 ± 1.28 | 21.52 ± 2.15 | 19.70 ± 1.34 | 0.96 ± 0.01 |
| 16 | 16.27 ± 0.42 | 26.41 ± 2.58 | - | 0.74 ± 0.01 |
| 23 | 18.26 ± 4.90 | 32.91 ± 1.12 | 20.14 ± 1.28 | 18.03 ± 1.02 |
| 24 | 20.63 ± 3.92 | 34.16 ± 1.37 | 20.32 ± 0.41 | 4.06 ± 0.39 |
| 25 | 44.59 ± 1.73 | 19.81 ± 4.83 | 43.34 ± 1.42 | 6.52 ± 0.40 |
| Comp. ID | Hydrogen Bonds | Other Interactions | Hydrophobic Interactions |
|---|---|---|---|
| 2 | HIS610 TYR782 | --- | PRO608 PHE620 PHE680 LEU749 TYR782 |
| 11 | HIS610 HIS651 TYR782 | --- | PRO608 PHE620 PHE679 PHE680 LEU749 TYR782 |
| 12 | HIS610 HIS651 TYR782 | --- | PRO608 PHE620 PHE679 PHE680 LEU749 TYR782 |
| 13 | HIS610 HIS651 TYR782 | --- | PHE620 PHE679 PHE680 LEU749 TYR782 |
| 14 | HIS610 HIS651 TYR782 | --- | PRO608 PHE620 PHE679 PHE680 LEU749 TYR782 |
| 15 | HIS610 HIS651 TYR782 | --- | PHE620 PHE679 PHE680 LEU749 TYR782 |
| 16 | HIS610 HIS651 TYR782 | --- | PRO608 PHE620 PHE679 PHE680 LEU749 TYR782 |
| 23 | GLY619 | --- | PRO501 PRO608 PHE620 CYS621 PHE680 LEU749 TYR782 |
| 25 | SER568 GLY619 TYR782 | π-π: PHE680 | PRO608 PHE620 CYS621 PHE680 TYR782 |
| 24 | HIS610 TYR782 | π-π: PHE620 | PRO501 PHE620 PHE680 LEU749 TYR782 |
| Trich. A | GLY619 | --- | PRO501 PRO608 PHE620 PHE680 LEU749 TYR782 |
| IC50, mkM | |||||||||||
|---|---|---|---|---|---|---|---|---|---|---|---|
| 1 | 2 | 11 | 12 | 13 | 14 | 15 | 16 | 23 | 24 | 25 | |
| SH-SY5Y | >100 | >100 | 51.89 ± 3.56 | >100 | >100 | >100 | 47.56 ± 7.19 | >100 | 64.15 ± 4.10 | 51.96 ± 2.61 | 59.51 ± 0.42 |
| HEK-293 | >100 | >100 | >100 | >100 | >100 | >100 | >100 | 49.48 ± 3.43 | 68.28 ± 2.22 | 60.2 ± 1.0 | >100 |
Publisher’s Note: MDPI stays neutral with regard to jurisdictional claims in published maps and institutional affiliations. |
© 2021 by the authors. Licensee MDPI, Basel, Switzerland. This article is an open access article distributed under the terms and conditions of the Creative Commons Attribution (CC BY) license (https://creativecommons.org/licenses/by/4.0/).
Share and Cite
Neganova, M.; Aleksandrova, Y.; Suslov, E.; Mozhaitsev, E.; Munkuev, A.; Tsypyshev, D.; Chicheva, M.; Rogachev, A.; Sukocheva, O.; Volcho, K.; et al. Novel Multitarget Hydroxamic Acids with a Natural Origin CAP Group against Alzheimer’s Disease: Synthesis, Docking and Biological Evaluation. Pharmaceutics 2021, 13, 1893. https://doi.org/10.3390/pharmaceutics13111893
Neganova M, Aleksandrova Y, Suslov E, Mozhaitsev E, Munkuev A, Tsypyshev D, Chicheva M, Rogachev A, Sukocheva O, Volcho K, et al. Novel Multitarget Hydroxamic Acids with a Natural Origin CAP Group against Alzheimer’s Disease: Synthesis, Docking and Biological Evaluation. Pharmaceutics. 2021; 13(11):1893. https://doi.org/10.3390/pharmaceutics13111893
Chicago/Turabian StyleNeganova, Margarita, Yulia Aleksandrova, Evgenii Suslov, Evgenii Mozhaitsev, Aldar Munkuev, Dmitry Tsypyshev, Maria Chicheva, Artem Rogachev, Olga Sukocheva, Konstantin Volcho, and et al. 2021. "Novel Multitarget Hydroxamic Acids with a Natural Origin CAP Group against Alzheimer’s Disease: Synthesis, Docking and Biological Evaluation" Pharmaceutics 13, no. 11: 1893. https://doi.org/10.3390/pharmaceutics13111893
APA StyleNeganova, M., Aleksandrova, Y., Suslov, E., Mozhaitsev, E., Munkuev, A., Tsypyshev, D., Chicheva, M., Rogachev, A., Sukocheva, O., Volcho, K., & Klochkov, S. (2021). Novel Multitarget Hydroxamic Acids with a Natural Origin CAP Group against Alzheimer’s Disease: Synthesis, Docking and Biological Evaluation. Pharmaceutics, 13(11), 1893. https://doi.org/10.3390/pharmaceutics13111893