Article

Physiologically-Based Pharmacokinetic (PBPK) Modeling of Buprenorphine in Adults, Children and Preterm Neonates

1
Department of Clinical Pharmacy, Saarland University, 66123 Saarbrücken, Germany
2
Dr. Margarete Fischer-Bosch-Institute of Clinical Pharmacology, 70376 Stuttgart, Germany
3
Fraunhofer Institute for Biomedical Engineering IBMT, 66280 Sulzbach, Germany
4
Department of Internal Medicine V, Saarland University, 66421 Homburg, Germany
5
Departments of Clinical Pharmacology, and Pharmacy and Biochemistry, University Tübingen, 72076 Tübingen, Germany
*
Author to whom correspondence should be addressed.
Pharmaceutics 2020, 12(6), 578; https://doi.org/10.3390/pharmaceutics12060578
Submission received: 5 June 2020 / Revised: 18 June 2020 / Accepted: 21 June 2020 / Published: 23 June 2020
(This article belongs to the Special Issue Applications of Physiologically-Based Pharmacokinetic (PBPK) Modeling)

Abstract

:
Buprenorphine plays a crucial role in the therapeutic management of pain in adults, adolescents and pediatric subpopulations. However, only few pharmacokinetic studies of buprenorphine in children, particularly neonates, are available as conducting clinical trials in this population is especially challenging. Physiologically-based pharmacokinetic (PBPK) modeling allows the prediction of drug exposure in pediatrics based on age-related physiological differences. The aim of this study was to predict the pharmacokinetics of buprenorphine in pediatrics with PBPK modeling. Moreover, the drug-drug interaction (DDI) potential of buprenorphine with CYP3A4 and P-glycoprotein perpetrator drugs should be elucidated. A PBPK model of buprenorphine and norbuprenorphine in adults has been developed and scaled to children and preterm neonates, accounting for age-related changes. One-hundred-percent of the predicted AUClast values in adults (geometric mean fold error (GMFE): 1.22), 90% of individual AUClast predictions in children (GMFE: 1.54) and 75% in preterm neonates (GMFE: 1.57) met the 2-fold acceptance criterion. Moreover, the adult model was used to simulate DDI scenarios with clarithromycin, itraconazole and rifampicin. We demonstrate the applicability of scaling adult PBPK models to pediatrics for the prediction of individual plasma profiles. The novel PBPK models could be helpful to further investigate buprenorphine pharmacokinetics in various populations, particularly pediatric subgroups.

1. Introduction

Buprenorphine is a partial agonist of the µ-opioid receptor with an analgesic potency 25 to 100 times greater compared with that of morphine [1,2]. As such, buprenorphine plays a crucial role in the therapeutic management of pain in adults and adolescents, which is suggested among others in a recent guideline on cancer pain management of the World Health Organization (WHO) [2]. Furthermore, in recent years the use of buprenorphine has become widespread in pediatrics with indications ranging from postoperative analgesia to chronic pain in palliative care [3,4].
Buprenorphine displays a ceiling effect in adults, in which escalating doses do not cause additional respiratory depression [5,6]. However, this effect does not seem to apply to young children [7,8]. As a result, buprenorphine-related serious adverse reactions (ADR) up to fatal events have been reported, especially in young children, as well as single cases of accidental poisoning due to improperly stored buprenorphine drug products [7,9,10].
As a consequence, a recent meta-analysis by Vicencio-Rosas and colleagues pointed out the need of further research activities on buprenorphine in pediatric populations with particular focus on pharmacokinetic and pharmacodynamic issues [3]. Among others, their goals should be to allow researchers to develop dosage schemes and minimize the risk of ADR [3]. However, pediatric studies are difficult to conduct and are accompanied by numerous ethical challenges, many of which are unique to pediatrics, especially newborns [11]. Physiologically-based pharmacokinetic (PBPK) modeling in pediatrics has shown to be useful for the optimization of clinical study designs, the prediction of starting doses for children and the assessment of potential drug-drug interactions (DDIs) [12,13,14,15,16].
Compared to most other opioid receptor agonists, the potential for drug abuse and drug overdose in adults is lower due to buprenorphine’s partial agonism and its ceiling effect in the adult population [9,17]. Hence, buprenorphine has successfully been used in the treatment of opioid use disorders (OUD) and is helping combat the current opioid epidemic [18,19]. However, the increase in buprenorphine prescriptions has also been associated with illicit usage, raising concerns about the potential of misuse and diversion [9,20].
A major metabolic route of elimination of buprenorphine represents the metabolism to the active metabolite, norbuprenorphine, mainly through the cytochrome P450 (CYP) 3A4 enzyme, an enzyme with a high DDI potential [21,22]. As a result, buprenorphine and norbuprenorphine plasma levels can be affected by CYP3A4 inhibitors and inducers [21,23]. Recently conducted DDI studies with CYP3A4 perpetrator drugs have shown significant changes in buprenorphine plasma concentrations after specific oral and sublingual administration scenarios [24,25,26]. Still, the clinical relevance of other DDIs with frequently used perpetrator drugs (e.g., clarithromycin or itraconazole) and the impact of the inhibition and/or induction of the drug transporter P-glycoprotein (P-gp) remain unclear [23]. PBPK modeling has shown to be a powerful tool in predicting and simulating DDI scenarios and drug concentrations at specific target sites. Moreover, PBPK models are useful to elucidate transporter proteins and their contribution to drug disposition [22,27,28,29].
The objectives of this study were (1) to establish and evaluate a whole-body parent-metabolite intravenous PBPK model of buprenorphine and norbuprenorphine in adults, (2) to scale the adult PBPK model to pediatrics for the assessment of plasma concentration-time profiles, and (3) to use the developed adult PBPK model for the evaluation of DDIs with frequently used CYP3A4 and P-gp perpetrator drugs that have not been investigated yet. The novel PBPK models are publicly available in the Open Systems Pharmacology (OSP) repository as clinical research tools to support the design of clinical trials in specific populations as well as the development of novel drug formulations. The Supplementary Materials serve as a comprehensive reference manual including detailed documentation of the model performance assessment.

2. Materials and Methods

2.1. Software

The PBPK models were developed with the PK-Sim® modeling software (version 8.0, part of the OSP Suite). Model input parameter optimization was accomplished using the Monte Carlo algorithm implemented in PK-Sim®. Clinical data in scientific literature were digitized using GetData Graph Digitizer version 2.26.0.20 (S. Fedorov) according to best practices [30]. Allometric scaling was performed in NONMEM® (Version 7.4.3), pharmacokinetic (PK) parameter analyses and graphics with the R programming language version 3.6.1 (R Foundation for Statistical Computing, Vienna, Austria) and R Studio® version 1.2.5019 (R Studio, Inc., Boston, MA, USA).

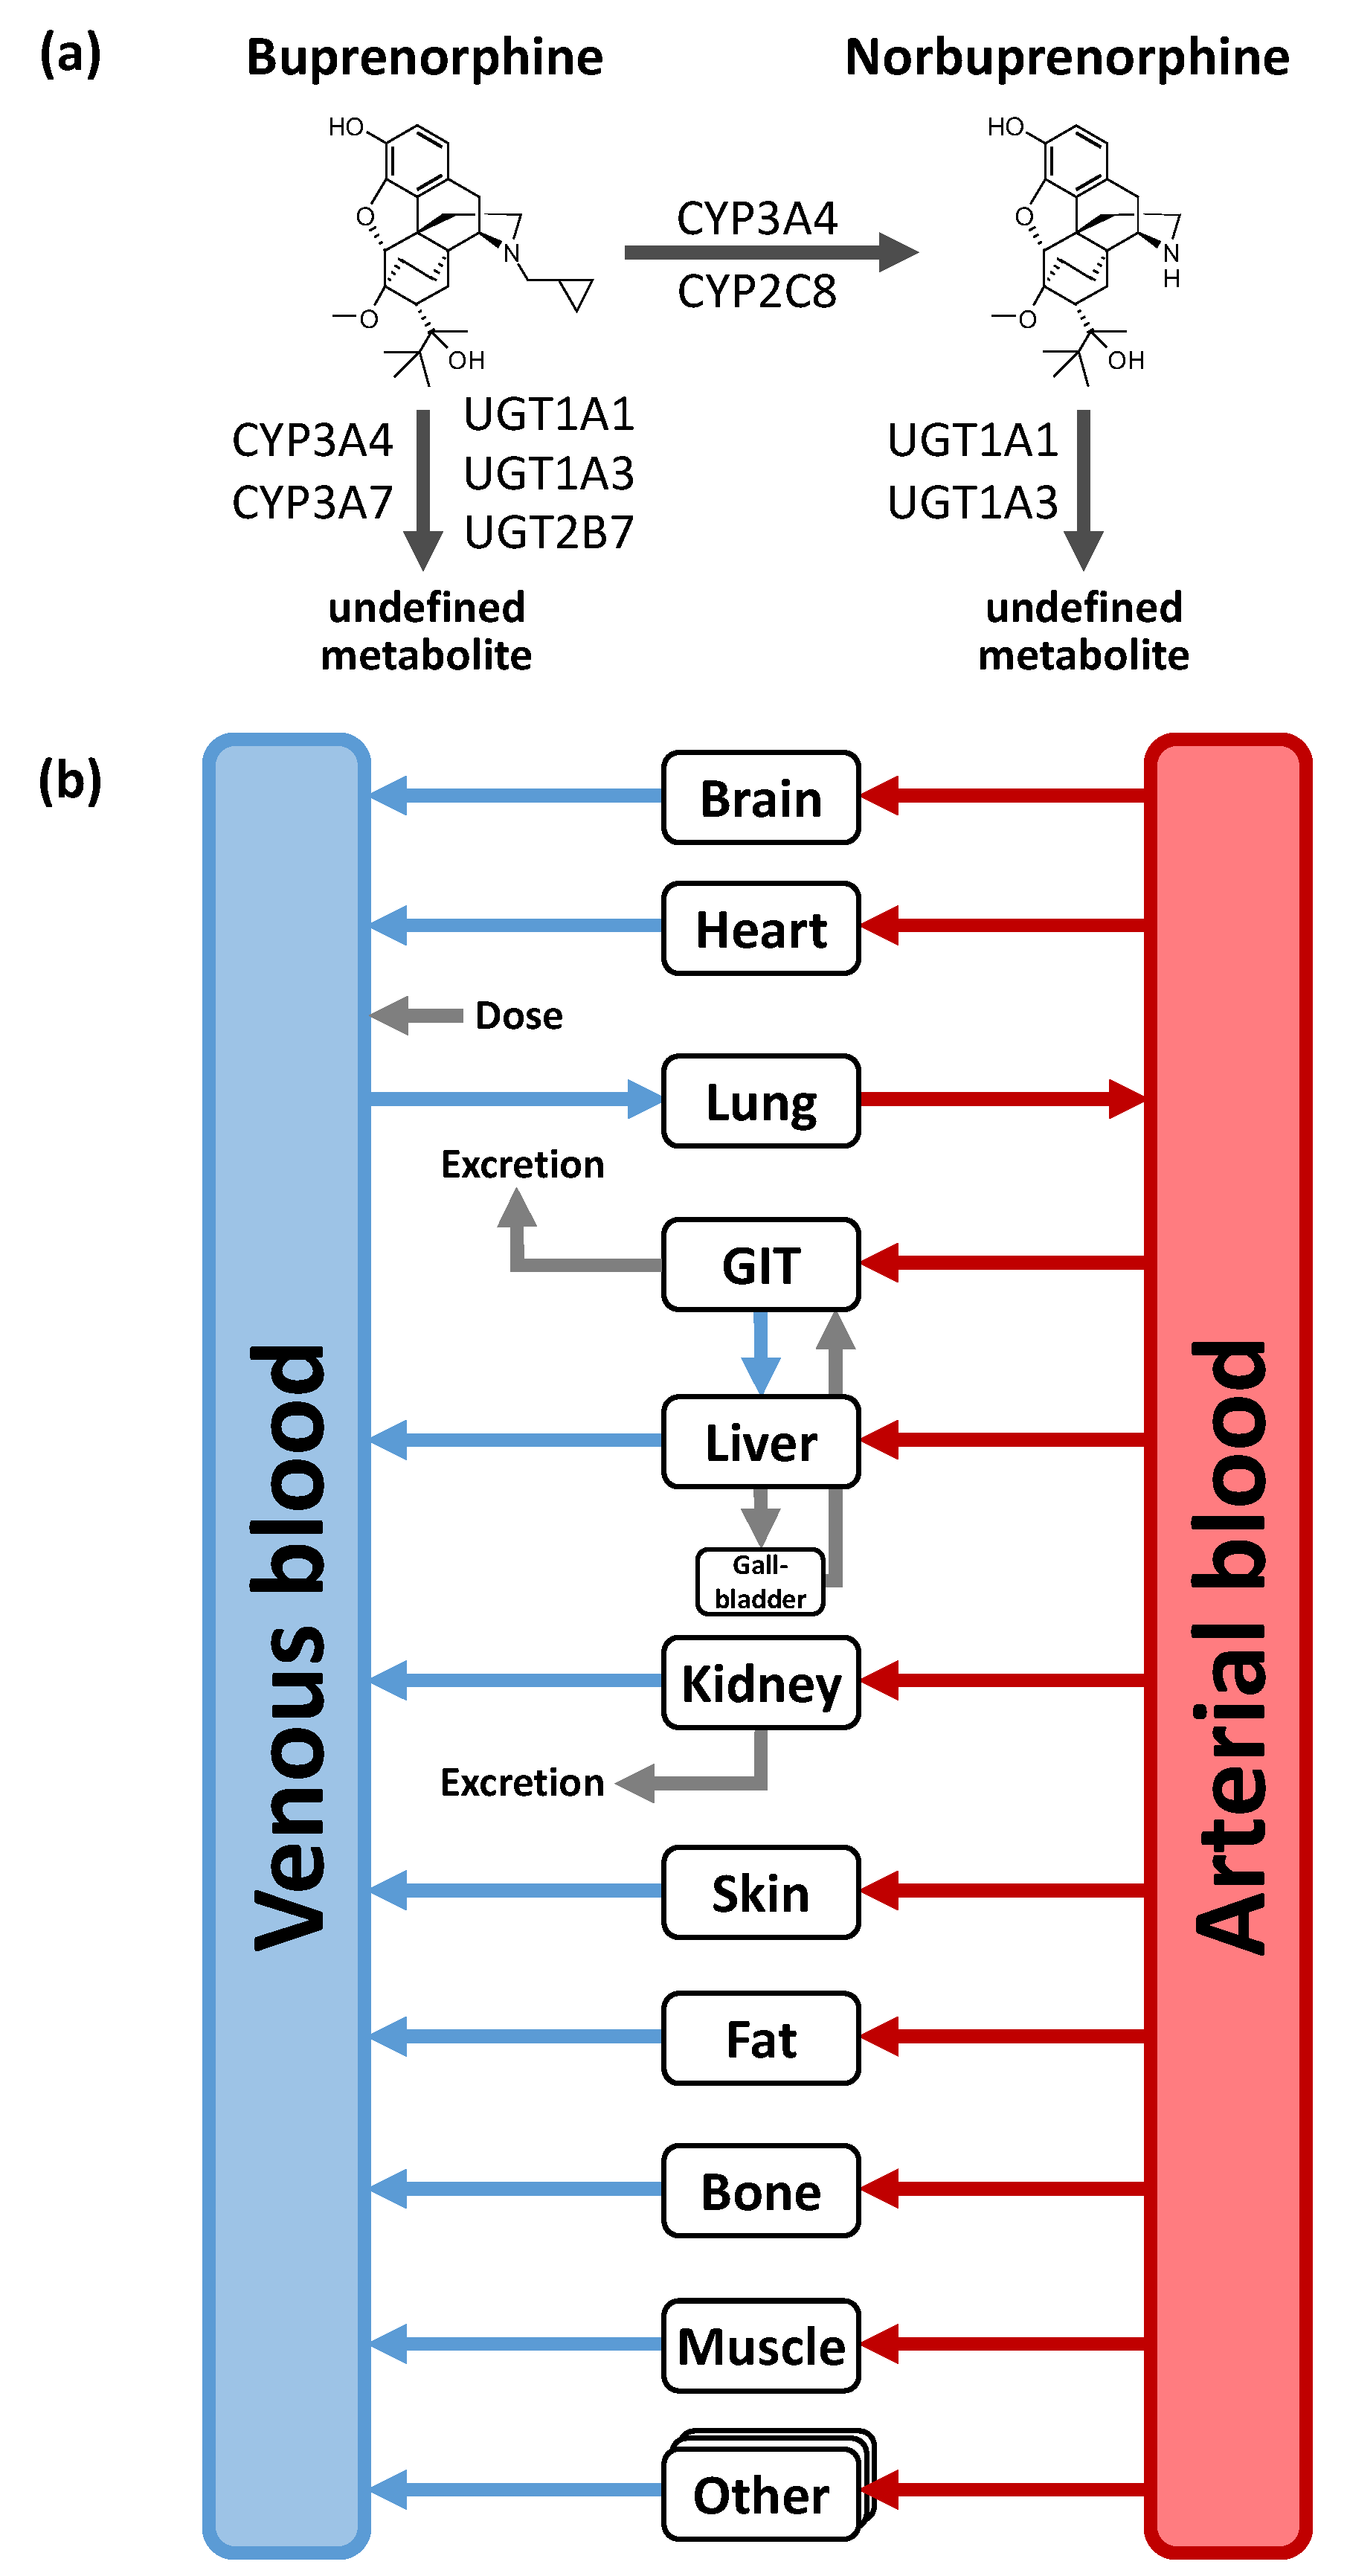
2.2. PBPK Parent-Metabolite Model Building in Adults

In agreement with pediatric PBPK model development workflows, first, an adult PBPK model was built and subsequently evaluated with observed plasma profiles to promote confidence in the parametrization of the PBPK model, before the model was scaled to pediatric populations [12,31,32,33]. For the building of the adult parent-metabolite PBPK model of buprenorphine and norbuprenorphine, an extensive literature search was performed to obtain information on (a) physicochemical properties, (b) distribution, metabolism and excretion processes of the two modeled compounds as well as (c) clinical studies of intravenous administration of buprenorphine. The gathered information was used to implement relevant transport proteins and enzymes involved in distribution, metabolism and excretion processes and to inform drug-dependent model input parameters. The plasma profiles of the identified clinical studies were digitized and split into an internal training and an external test dataset. The selection of studies for the internal dataset was guided by the information contained in the different studies (i.e., dosing regimens, frequent as well as early and late sampling, measurements of norbuprenorphine, measurements of arterial plasma concentrations, etc.). To obtain values for model input parameters, which could not be adequately obtained from literature, parameter estimation was performed by fitting the parent-metabolite model to the training dataset. The external test dataset was used for model evaluation.
Distribution and elimination processes including CYP and uridine 5′-diphospho-glucuronosyltransferase (UGT) enzymes as well as drug transporter were implemented according to the literature [21,34,35]. For the buprenorphine model, these are (1) metabolism of buprenorphine to a major active metabolite norbuprenorphine through CYP3A4 and CYP2C8; (2) metabolism pathways metabolizing buprenorphine to other non-specified metabolites through CYP3A4, CYP3A7, UGT1A1, UGT1A3, and UGT2B7; as well as (3) renal excretion through glomerular filtration. For the norbuprenorphine model, metabolism through UGT1A1 and UGT1A3 as well as renal clearance by glomerular filtration and tubular secretion through the transport protein P-gp were implemented [36,37]. Figure 1 shows a structural overview of the PBPK model including the implemented metabolic processes of buprenorphine and norbuprenorphine. Tissue expression distribution of the implemented enzymes was informed by the PK-Sim® expression database [38]. For detailed supplementary information on PBPK model building see Section 1 in the Supplementary Materials.

2.3. Pediatric Scaling and Model Applications

After the building and evaluation of the adult PBPK model, the model was scaled to the administration of buprenorphine in children and preterm neonates for a priori predictions of the PK in the two pediatric populations. For this, the adult virtual populations were replaced by pediatric populations. These virtual pediatric populations were based on the patient characteristics of two included pediatric clinical trials with children and preterm neonates, respectively. As a result, both anatomic and physiological parameters as well as enzyme tissue concentrations were scaled to values of the respective target population accounting for age-related changes such as size and composition of tissue compartments, protein binding and maturation of elimination processes. Information on the ontogeny functions for enzymes can be found in [39] and in Table S1 of the Supplementary Materials. For scaling the fraction unbound of buprenorphine to children and preterm neonates, the method of McNamara and Alcorn for alpha-1-acid glycoprotein was applied [40,41]. The extrapolated PBPK model was subsequently used to predict 22 individual plasma concentration-time profiles in children and preterm neonates. To compare the outcome of the PK predictions using the pediatric PBPK models, a classical allometric scaling approach, as described by Tod et al., was used [42]. For detailed information on the allometric scaling, see Section 3 in the Supplementary Materials.
Additionally, the adult PBPK model was used to assess the DDI potential of the CYP and UGT substrate buprenorphine with the three perpetrator drugs clarithromycin, itraconazole and rifampicin. While itraconazole and its metabolites inhibit both CYP3A4 and P-gp competitively, clarithromycin is a mechanism-based inhibitor of the CYP3A4 enzyme and also competitively inhibits P-gp, yet with a much higher inhibition constant (Ki) [22]. In contrast, rifampicin both inhibits and induces the CYP2C8, CYP3A4, UGT1A1, and UGT1A3 enzymes as well as the P-gp efflux transporter [22,43,44,45,46,47,48,49,50]. For the simulation of buprenorphine plasma profiles in the DDI scenarios, the buprenorphine model was coupled with recently published PBPK models of clarithromycin, itraconazole and rifampicin [22]. The rifampicin model was further extended with information on the CYP2C8, UGT1A1 and UGT1A3 induction and inhibition processes. Detailed information is provided in Section 2 of the Supplementary Materials.

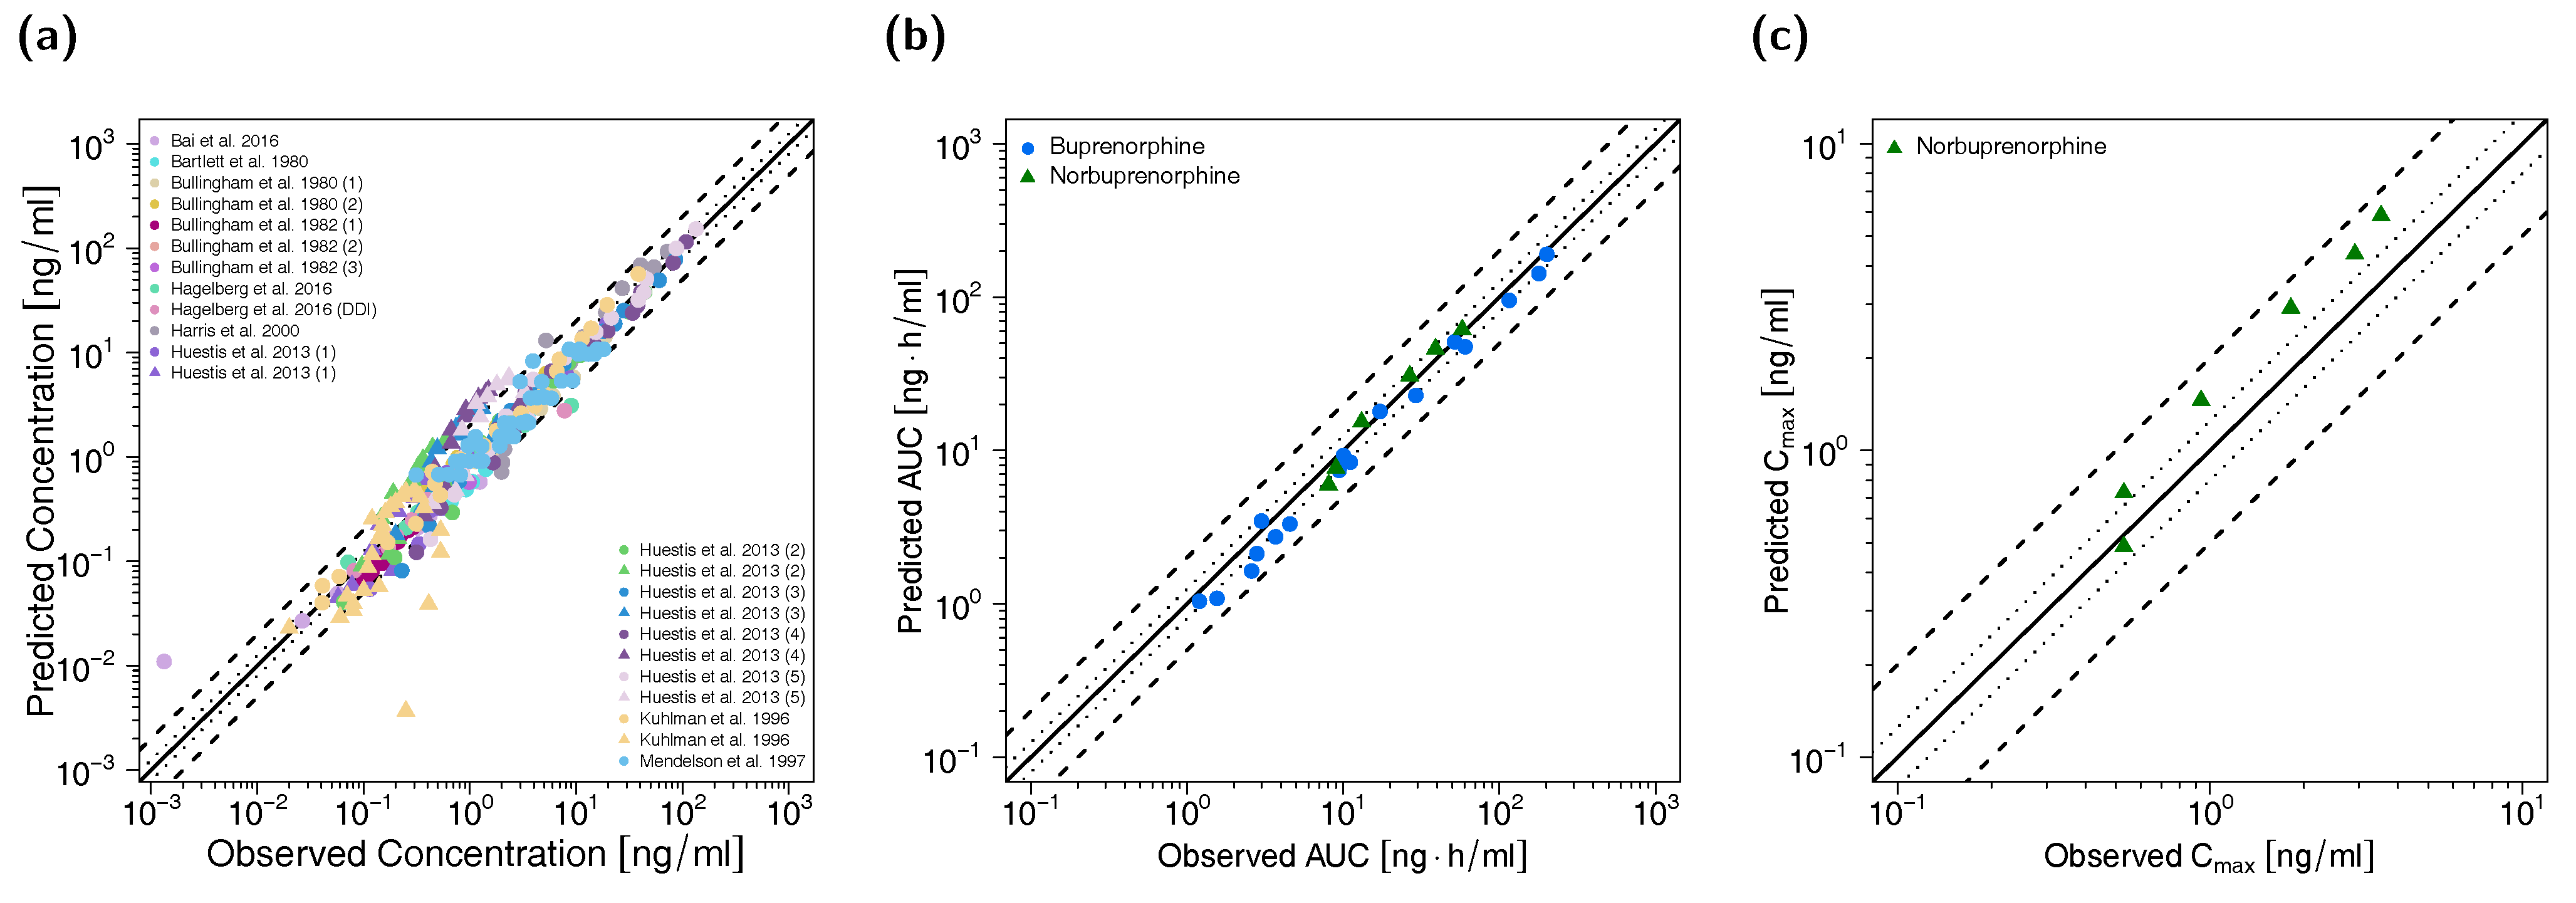
2.4. PBPK Model Evaluation

Adult and pediatric PBPK model performances were evaluated with several methods. Predicted and observed areas under the plasma concentration-time curve from the first to the last data point (AUClast) and maximum plasma concentration (Cmax) values as well as the predicted plasma concentrations and their respective values observed were compared in goodness-of-fit plots. Moreover, buprenorphine and norbuprenorphine plasma concentration-time profiles observed both from adult and pediatric studies were visually compared to the plasma profiles predicted with the PBPK models. To estimate the variability of plasma profiles, virtual populations of 100 individuals were generated representing the corresponding clinical trial population. For detailed information on virtual populations see Section 1.2 in the Supplementary Materials. Individual plasma concentration-time profiles including the corresponding individual demographics were available in one study [51]. Here, populations of 100 individuals with the same demographics were used for simulations only allowing variability in the expression of the implemented enzymes and transporters. Population predictions were plotted as geometric mean with geometric standard deviation. When individual concentration-time datasets were available but demographic values could not be matched to the specific profile, median with 90% population prediction intervals were plotted. The sensitivity of the final PBPK models to single parameter changes (local sensitivity analysis) was investigated with PK-Sim®. Furthermore, two quantitative performance measures were calculated: the mean relative deviation (MRD) of the predicted plasma concentrations for each single plasma profile as well as the geometric mean fold errors (GMFE) of AUClast and Cmax ratios, respectively (for detailed information including equations please refer to Section 4.3 in the Supplementary Materials). Cmax values were calculated only for intravenous long-term infusions and norbuprenorphine metabolite. Conclusively, the percentage of model-predicted concentrations falling within 2-fold of the corresponding observed concentrations was examined in addition to the mentioned evaluation measures above.
The DDI effects were evaluated by comparing plasma concentration-time profiles of buprenorphine and norbuprenorphine after buprenorphine administration alone (control) and plasma profiles during concomitant use with the DDI perpetrator (inhibition/induction). Additionally, the corresponding predicted AUC ratios (AUCinhibition/induction, predicted/AUCcontrol, predicted) were calculated. Since observed data of a DDI clinical trial with rifampicin was available, the AUC ratio predicted was also compared to the AUC ratio observed in the respective DDI study.

3. Results

3.1. PK Data for PBPK Model Development and Pediatric Scaling

After a comprehensive literature search, eight PK studies in adults with 17 different treatment blocks after intravenous administration of buprenorphine were identified. Two of these studies were performed in an elderly population, one was a DDI study with rifampicin as the perpetrator drug. The dataset encompasses wide mean age and dose ranges with 21 to 67.5 years and 0.3 to 16 mg buprenorphine, respectively. In six treatment blocks, norbuprenorphine plasma concentrations were reported. All plasma concentration-time profiles were digitized and split into an internal training (n = 7 profiles) and an external test dataset (n = 16 profiles). The internal training dataset was complemented with information on the fraction of buprenorphine metabolized to norbuprenorphine, fraction of buprenorphine excreted unchanged in urine, and fraction of dose excreted in urine as norbuprenorphine [35,52,53]. For the evaluation of the PBPK model predictions in pediatrics, two clinical trials investigating buprenorphine plasma concentrations in both children (age: 4.6–7.5 years) and preterm neonates (27–34 weeks postmenstrual age) were located and the data digitized. An overview of the included clinical studies, comprising study characteristics and dosing regimens, is shown in Table 1.

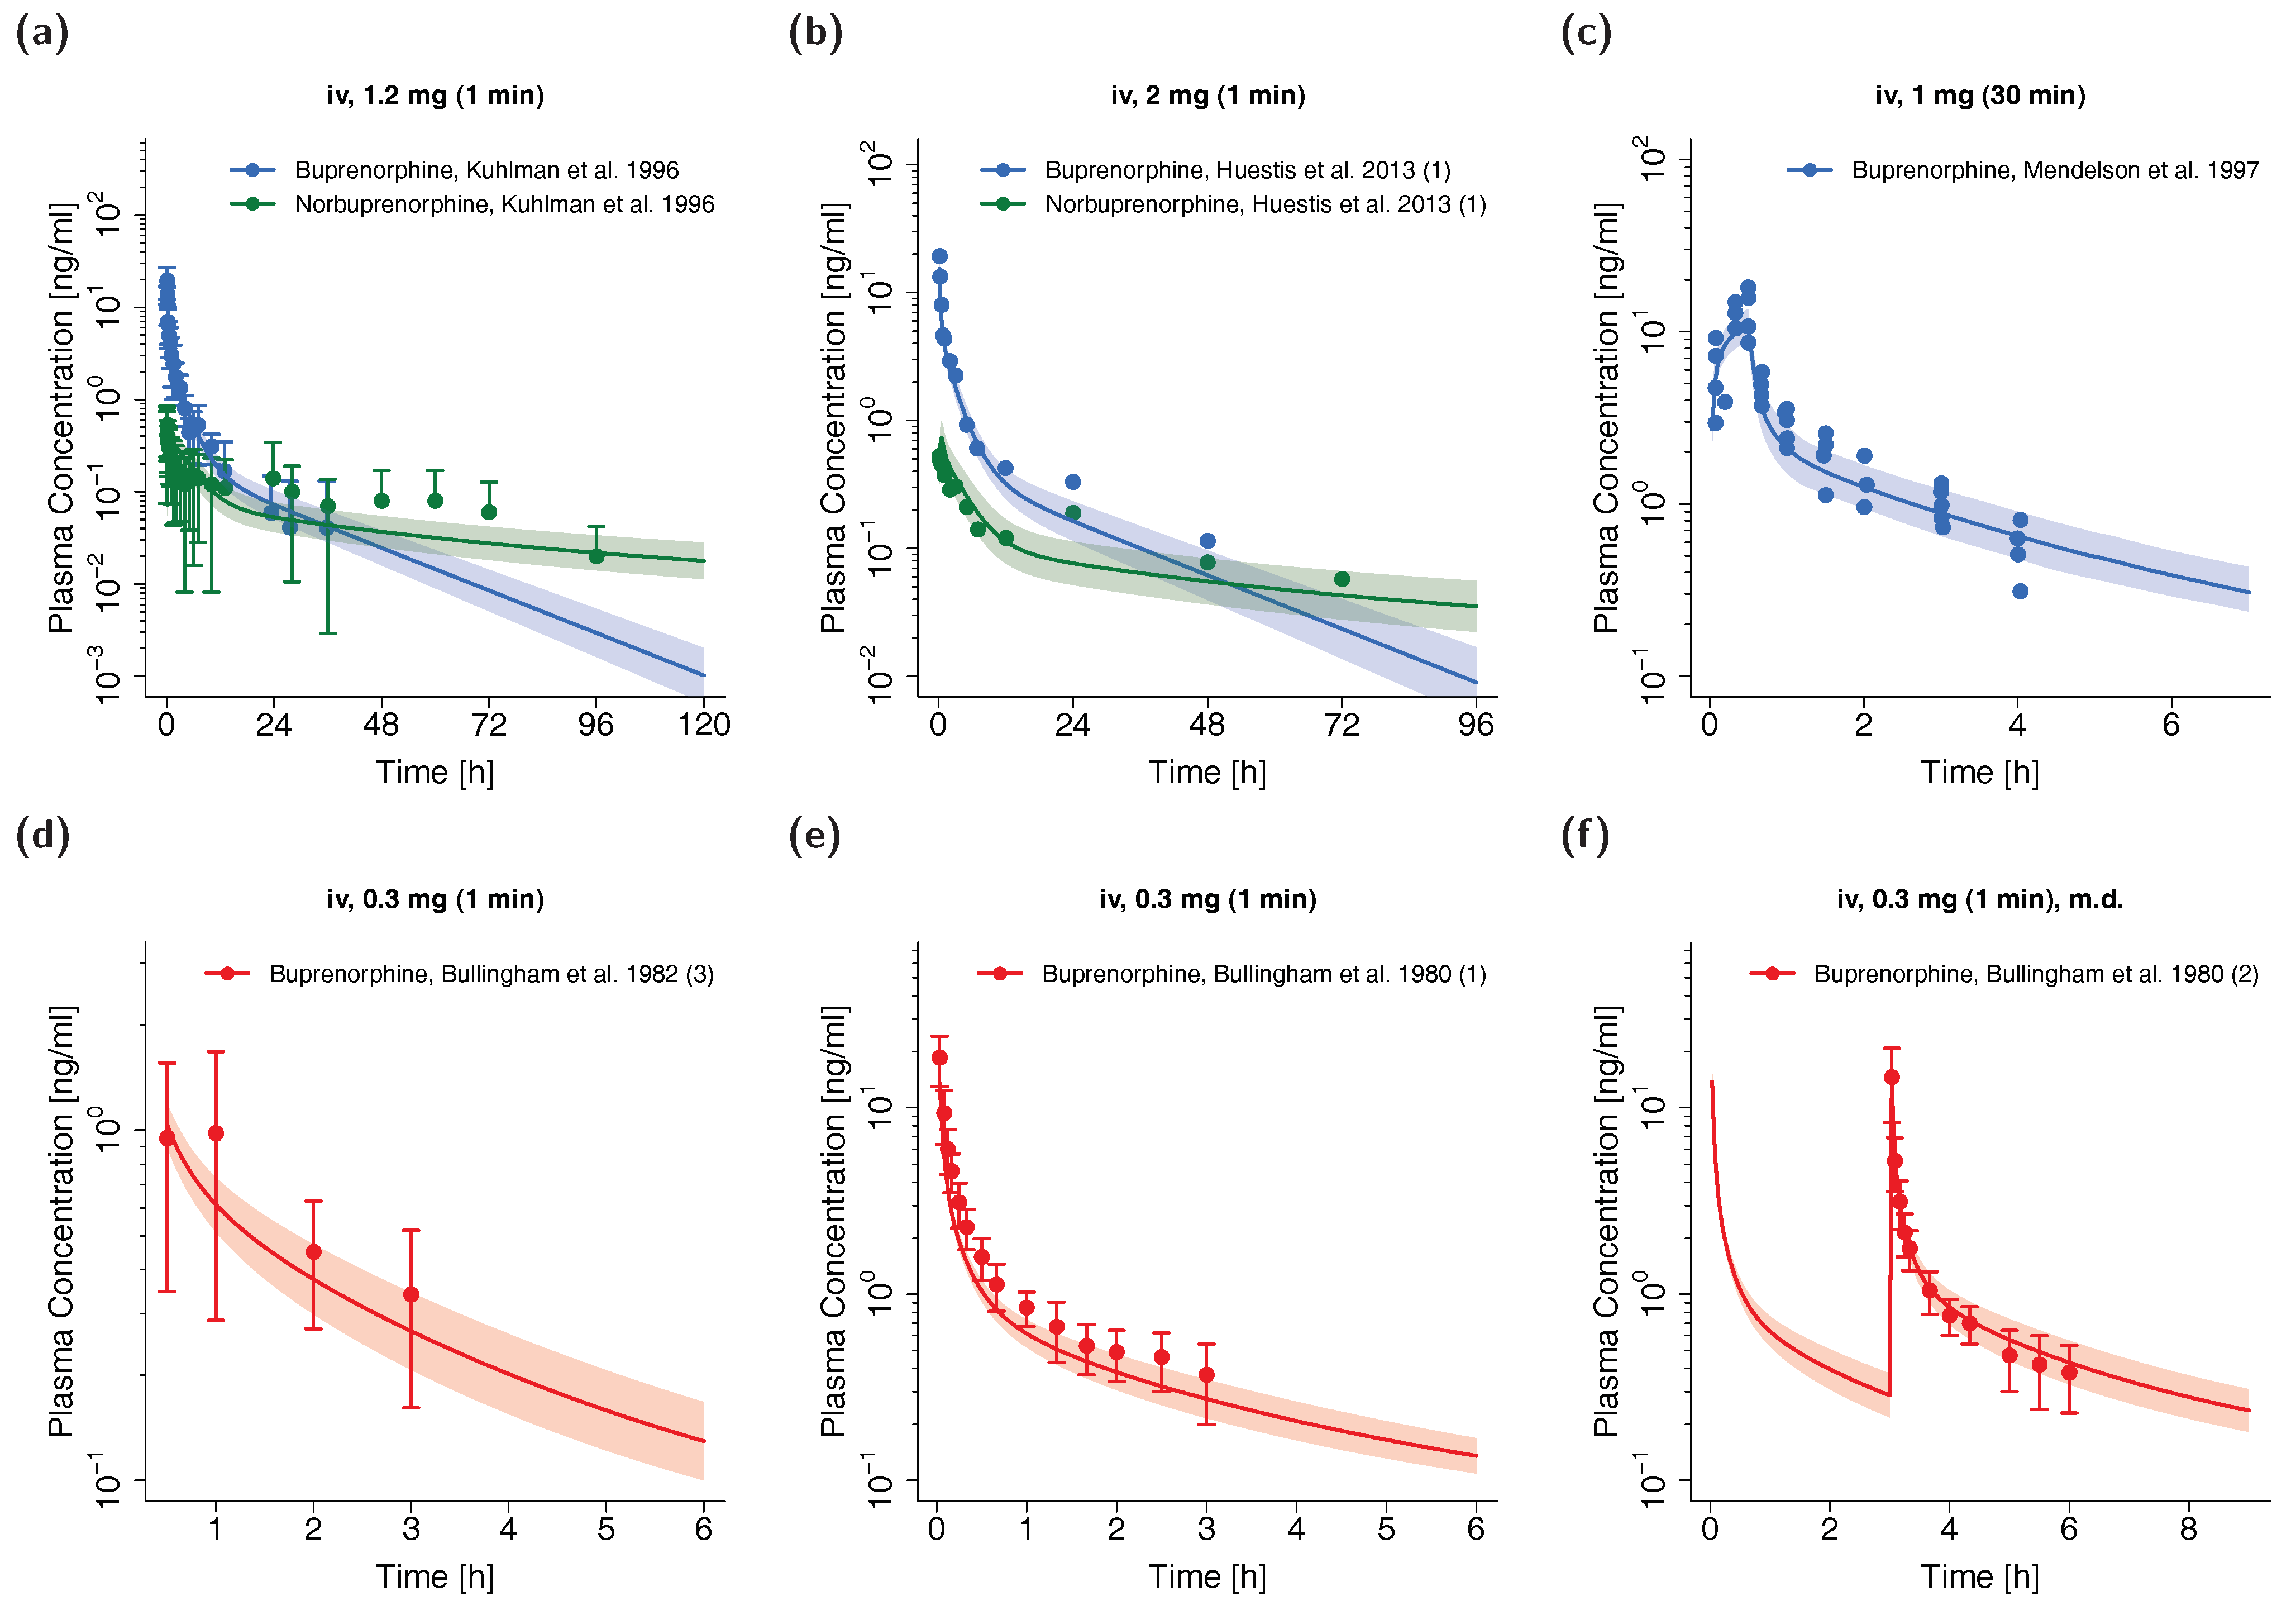
3.2. Adult PBPK Model Building and Evaluation

The whole-body PBPK model for adults precisely predicts plasma concentration-time profiles of buprenorphine and norbuprenorphine following intravenous administration of buprenorphine. Visual comparison of predicted to observed plasma profiles are shown in Figure 2 (selection of internal and external dataset) and in detail in Section 4.1 of the Supplementary Materials (all studies, both linear and semilogarithmic plots). Predicted plasma profile trajectories are in close agreement with profiles observed both for buprenorphine venous and arterial blood plasma concentrations as well as for norbuprenorphine plasma concentrations.
All predicted AUClast and Cmax values are within the 2-fold acceptance criterion. The goodness-of-fit plot of predicted versus observed plasma concentrations is shown in Figure 3 together with goodness-of-fit plots of predicted versus observed AUClast and Cmax values. The GMFE values for the adult PBPK model are 1.22 and 1.45 for AUClast and Cmax, respectively. Moreover, 84% of all predicted plasma concentrations fall within 2-fold of the corresponding observed concentration. The overall MRD value for predicted plasma concentrations for the adult PBPK model is 1.70. Detailed results on MRD and GMFE values, calculated for all studies, are provided in Sections 4.4 and 4.5 of the Supplementary Materials, the results of the sensitivity analysis are shown in Section 4.6 of the Supplementary Materials.
Metabolism of buprenorphine to its major active metabolite norbuprenorphine is predominantly mediated through CYP3A4 (~65%) and CYP2C8 (~30%) [21]. In total, this pathway is responsible for about 35% of buprenorphine metabolism [21,35,52]. In contrast, urinary excretion only covers a minor fraction of buprenorphine elimination (0–1%) [26,35,62]. The PBPK model predictions for fraction metabolized to norbuprenorphine of ~37% and for fraction of buprenorphine excreted unchanged in urine of ~0.5% perfectly align with these literature reports (visual comparison of predicted to observed fractions of buprenorphine excreted unchanged in urine are shown in Figure S2 of the Supplementary Materials). Two factors, for the metabolic pathway to norbuprenorphine and the metabolic pathway to other metabolites, were estimated and multiplied with the in vitro literature values for the respective maximum reaction velocities in order to account for the in vivo relation of drug metabolized to norbuprenorphine and to other metabolites, respectively [21,35,52]. Further, the predicted fraction of the dose excreted in urine as norbuprenorphine (~2%) is in concordance with the literature as well (1.3 to 2.1%) [35]. This fraction was achieved by implementing the efflux transporter P-gp in the PBPK model according to the literature [37]. Drug-dependent parameters of the final PBPK model are depicted in Table 2. For detailed information including system-dependent model parameters, see Section 1 of the Supplementary Materials.

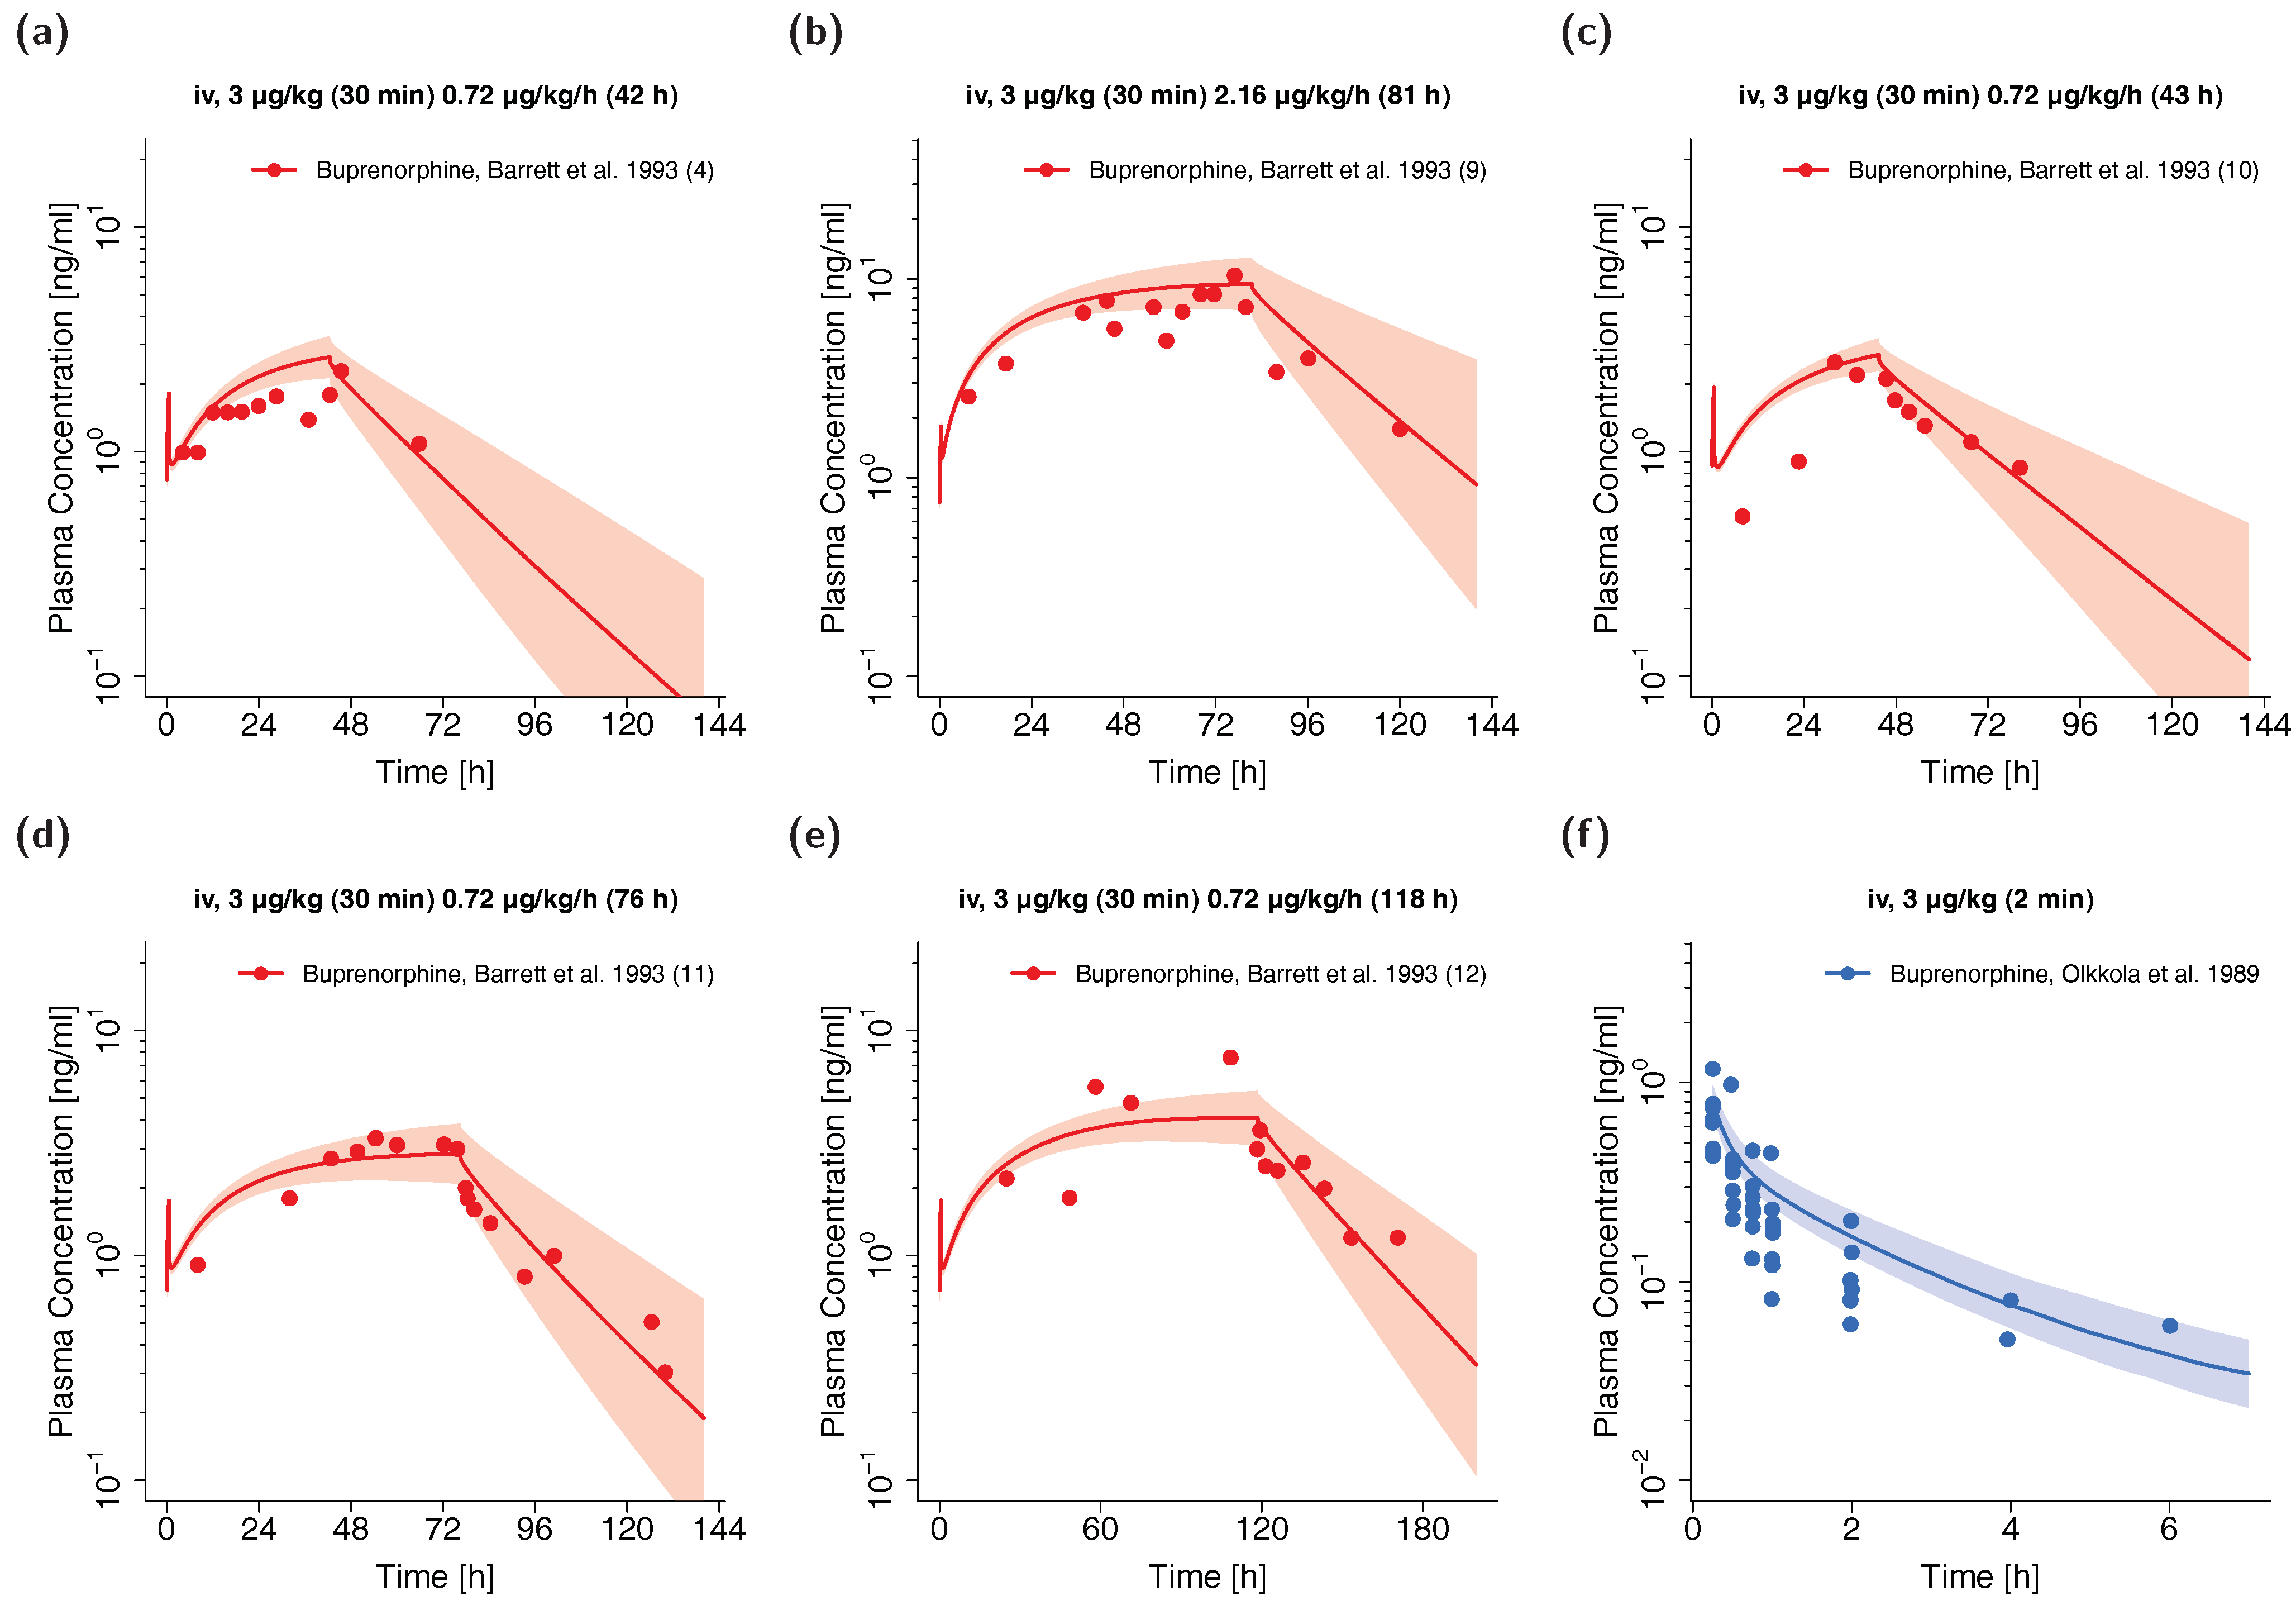
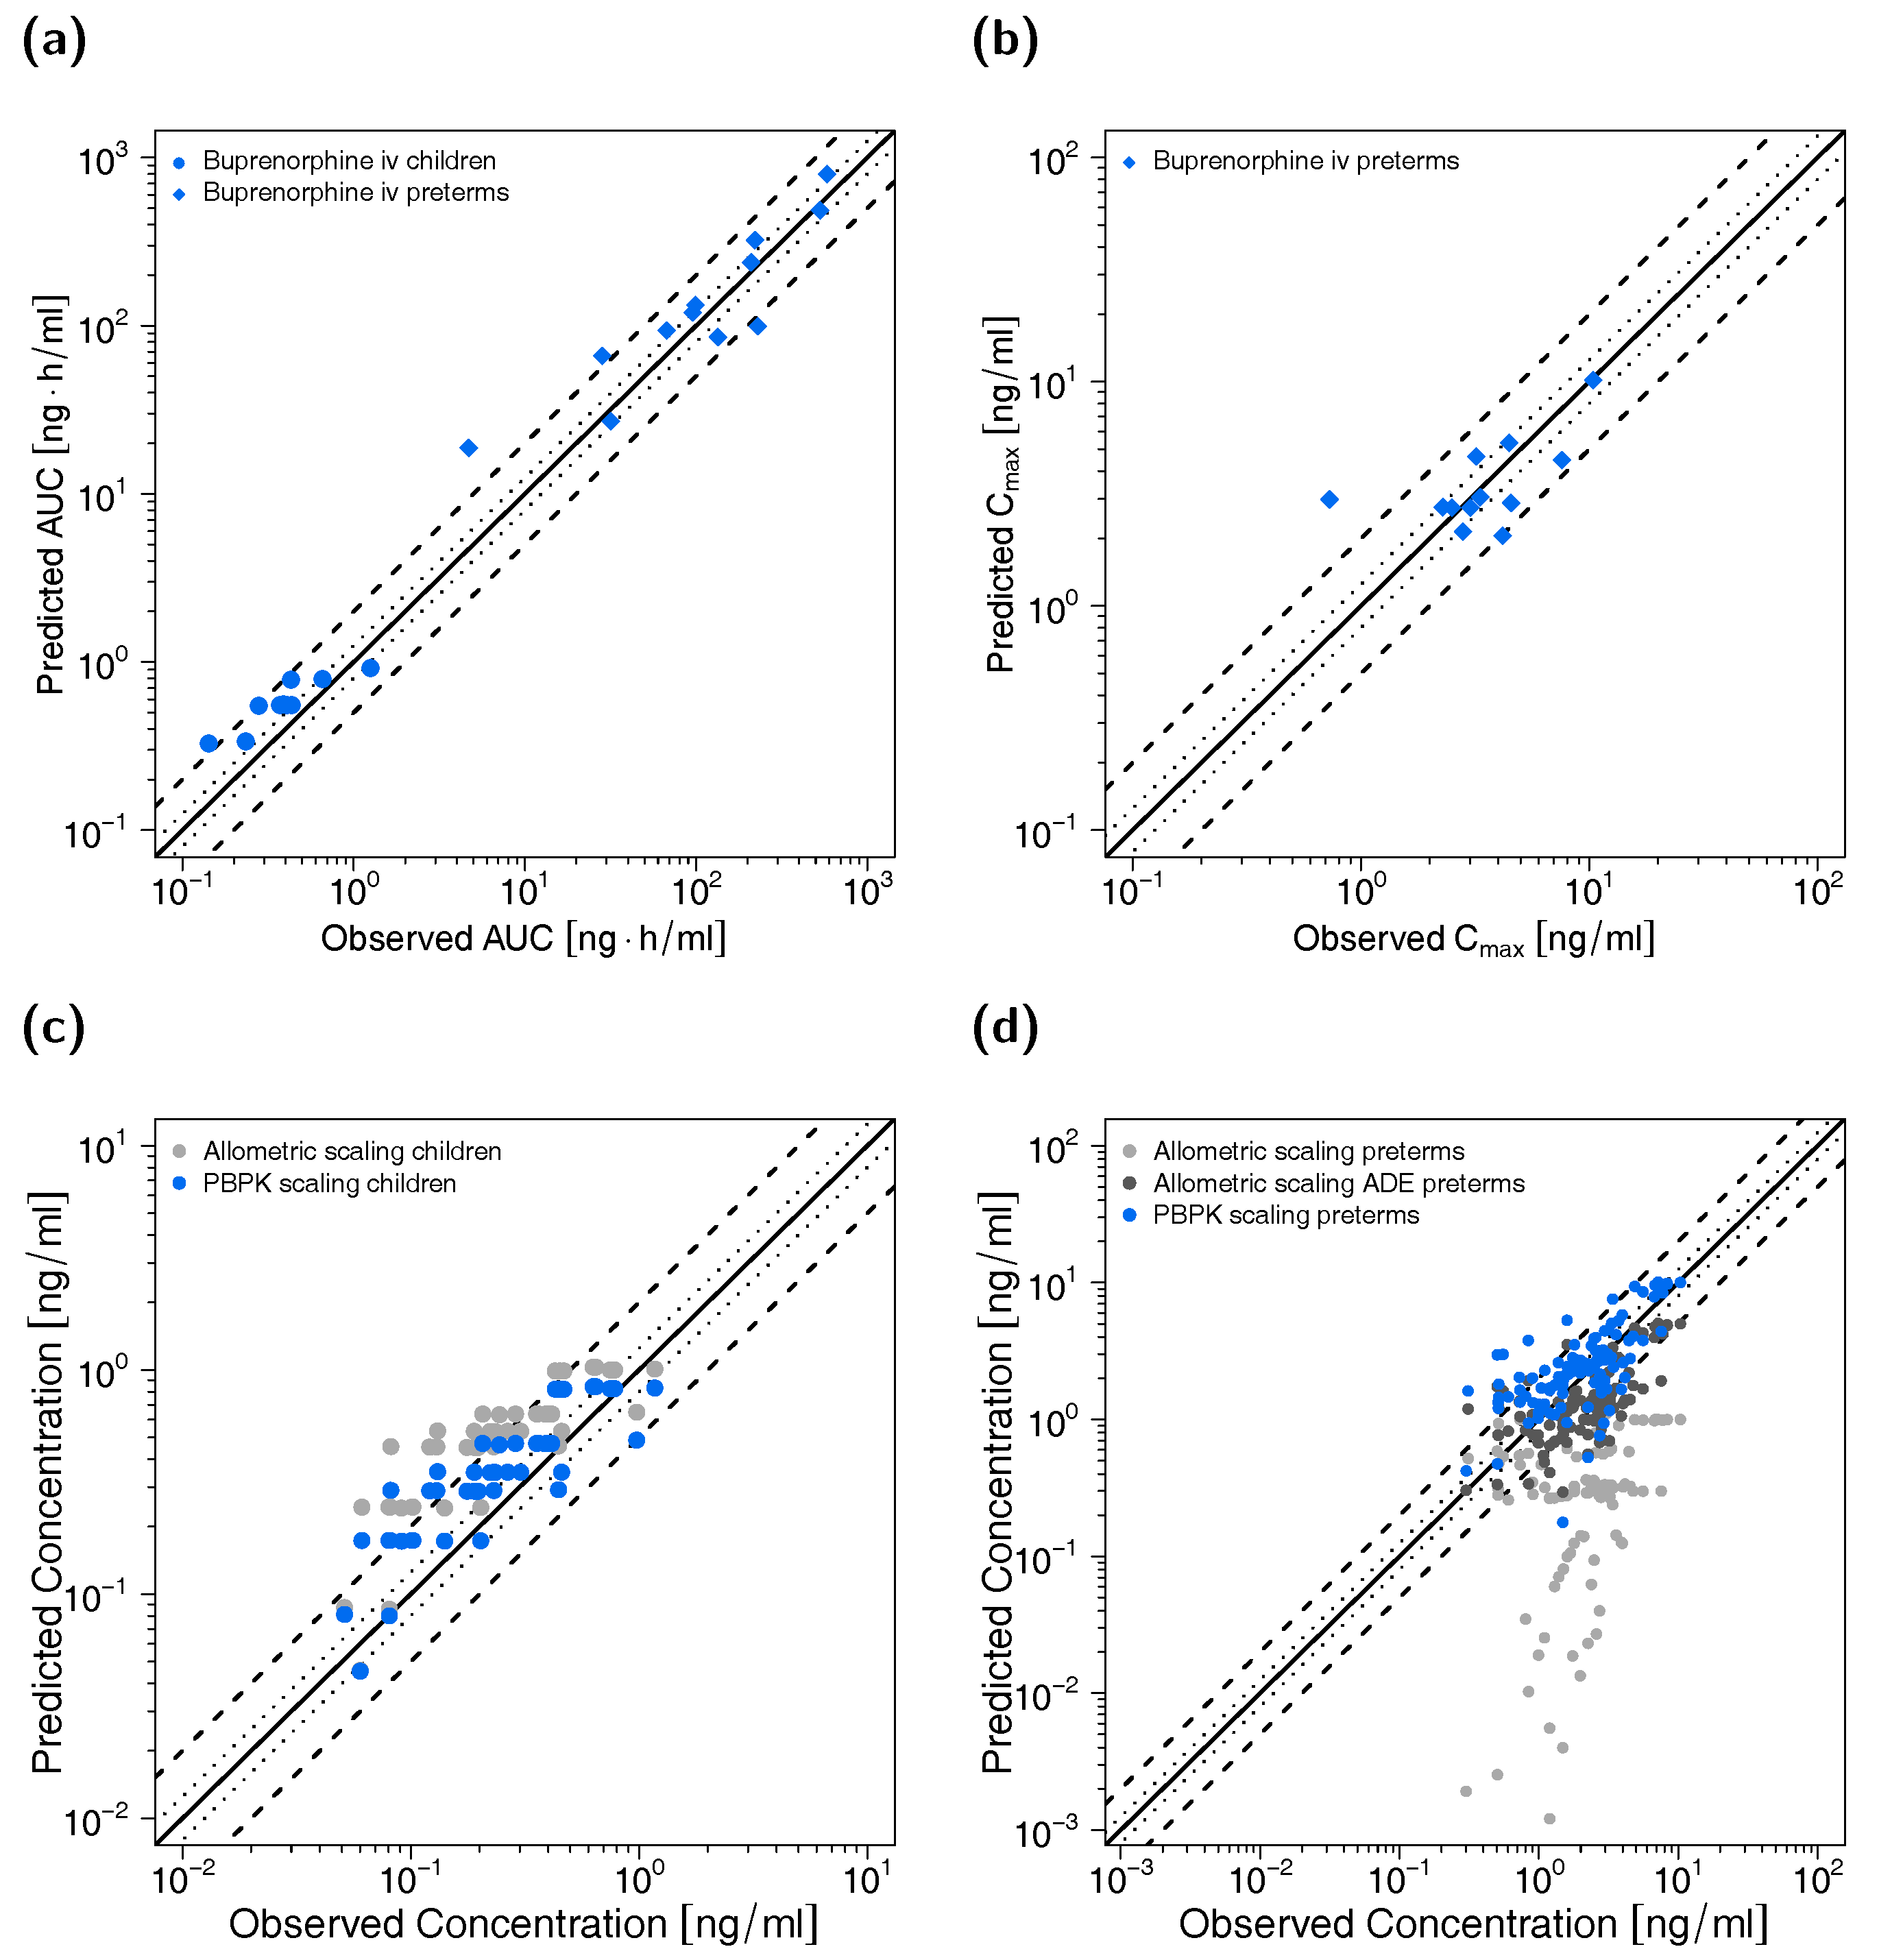
3.3. Pediatric PBPK Model Building and Evaluation

The adult PBPK model was scaled to two pediatric populations with a mean age of 5.9 years and 31 weeks (postmenstrual age), respectively. The fraction unbound of buprenorphine was calculated with the method of McNamara and Alcorn [40] and resulted in fraction unbounds of 5.1% for the child population and 7.2% (mean) for the preterm neonate population. All other drug-dependent parameters were kept fixed to the values of the adult PBPK model. Enzyme concentrations in the respective organs were scaled based on the implemented ontogeny functions [39].
Visual comparison of predicted to observed individual plasma profiles are shown in Figure 4 (selection of plots) and in detail in Section 4.2 of the Supplementary Materials (all plots, both linear and semilogarithmic).
Goodness-of-fit plots of predicted to observed AUClast and Cmax values are shown in Figure 5 accompanied with goodness-of-fit plots of predicted versus observed plasma concentrations. The GMFE values for individual AUClast predictions were 1.54 for the child and 1.57 for the preterm neonate population, respectively. Ninety percent of individual AUClast predictions for the child population and 75% of individual AUClast predictions for the preterm neonate population were within 2-fold of the respective observed values. GMFE of Cmax was 1.44 for the long-term infusions in preterm neonates (with 83% of individual Cmax predictions within 2-fold range). Moreover, 81% (children) and 80% (preterm neonates) of all predicted plasma concentrations fell within 2-fold of the corresponding observed concentrations (overall MRD values of 1.72 for plasma concentration predictions in children and 1.86 for predictions in preterm neonates). Detailed results for MRD and GMFE values for the pediatric predictions can be found in Sections 4.4 and 4.5 of the Supplementary Materials. The allometric scaling approach led to less precise predictions (see Figure 5c,d) with MRD values of 2.28 (children), 12.46 (preterm neonates without age-dependent exponent) and 2.08 (preterm neonates with age-dependent exponent).

3.4. DDI Evaluation with the Adult PBPK Model

The plasma concentration-time profiles of the simulated DDI scenarios are depicted in Figure 6. A slight decrease in buprenorphine AUC could be observed when simulating buprenorphine administration with concomitant rifampicin compared to simulation of buprenorphine administration alone in the setting of the DDI study by Hagelberg et al. [26]. The corresponding ratio of predicted AUCratio (0.89) and observed AUCratio (0.85) for the DDI was 0.96. The predicted AUCratio for norbuprenorphine was 1.13 (see Table 3). For the assessment of DDI potential of buprenorphine with clarithromycin and itraconazole, a dosing regimen of a long-term buprenorphine infusion was selected to achieve similar steady-state plasma concentrations compared with the administration of marketed transdermal patches with 10 µg/h buprenorphine [70]. The administration of the perpetrator drugs started prior to buprenorphine administration and continued throughout the administration of the buprenorphine infusion. For details regarding the dosing regimens see Table 3. The predicted AUCratio of buprenorphine for the DDI with clarithromycin and itraconazole was 1.06 and 1.11, respectively, while the predicted AUCratio of norbuprenorphine was calculated to be 0.82 and 0.64.

4. Discussion

In this study, whole-body PBPK models of buprenorphine for an adult and two pediatric populations have been successfully developed. The adult PBPK model provides a consistent representation of the buprenorphine and norbuprenorphine dose–exposure relationship following intravenous administration of a wide dose range (0.3–16 mg) and describes and predicts buprenorphine and norbuprenorphine venous and arterial plasma concentration-time profiles. Thereby, predictions of the fraction of buprenorphine metabolized to norbuprenorphine and fractions of buprenorphine and norbuprenorphine excreted in urine align with literature reports. With the successful scaling of the adult PBPK model to children and preterm neonates, we confirm the potential of PBPK modeling to predict the PK in pediatrics. Moreover, we demonstrate the applicability of scaling an adult PBPK model to preterm neonates in order to predict individual plasma profiles with 75% of AUC ratios falling within 2-fold range. The performance of the PBPK models have been demonstrated by comparison of predicted to observed plasma concentration-time profiles and the respective goodness-of-fit plots, the calculation of MRD values as well as the comparison of predicted to observed AUClast and Cmax values including the calculation of the respective GMFEs.
By defining absorption, distribution, metabolism, and excretion (ADME) as a function of anatomy, physiology and biochemistry, PBPK modeling offers the opportunity of rational scaling between adults and children [31,33]. This study investigated the prediction of individual AUCs and plasma concentrations of 22 individual buprenorphine plasma profiles. In the case of predictions for children at the age of 4.6–7.5 years, 90% of individual AUC predictions were within 2-fold range. In the case of predictions for preterm neonates with 27–34 weeks of postmenstrual age, 75% of individual AUC and 83% of Cmax predictions were within 2-fold range, suggesting good predictive model performance. While PK predictions for preterm neonates are particularly challenging [71,72,73], our results provide evidence that individual predictions of AUC and Cmax values can be feasible.
As reported recently in other pediatric PBPK modeling approaches [12], the clearance in children (age range of 1–12 years) was slightly underestimated. This could be partly due to the fact that the implemented ontogeny functions for the CYP and UGT enzymes do not account for partially elevated concentrations in this age group, which has been reported in literature [39,74].
PK predictions with the PBPK modeling approach were superior compared to the allometric approach, especially for the preterm neonate population. The application of the exponent 1.2 for the allometric scaling of clearance in preterm neonates led to an improvement of predictions in this population compared to the exponent of 0.75, supporting the suggested advantages of an age-dependent exponent in allometric scaling by Mahmood and Tegenge [69].
In contrast to the simulated DDI scenario with rifampicin (decrease in buprenorphine AUC of ~11%), concomitant itraconazole administration slightly elevated the AUC of buprenorphine (~11%) due to the inhibition of CYP3A4. Similarly, clarithromycin inhibited the metabolism of buprenorphine to norbuprenorphine through CYP3A4 (AUC elevation of ~6%), while the CYP2C8 and UGT metabolic pathways were not affected by the DDIs with itraconazole and clarithromycin. Recent studies with the perpetrator drugs voriconazole and rifampicin have shown stronger DDI effects after oral and sublingual buprenorphine administration [24,25,26,75]. This is probably due to the fact that first-pass metabolism in the gut, which can be highly affected by DDIs, is avoided during intravenous buprenorphine administration. As a result, the DDI assessment in this study rather reflects the DDI potential for buprenorphine administrations not affected by first-pass metabolism like intravenous and transdermal applications.
Albeit clarithromycin (mechanism-based inhibition) and itraconazole (competitive inhibition) strongly inhibit CYP3A4 metabolism to norbuprenorphine, AUCs of norbuprenorphine did not vanish (decrease of only ~18% and ~36%, respectively). Firstly, norbuprenorphine can also be produced through CYP2C8. Secondly, the additional inhibition of the efflux transporter P-gp leads to a decreased norbuprenorphine excretion in the model. The simulated DDI scenario with rifampicin led to a less pronounced effect on the AUC of norbuprenorphine (increase of ~11%) despite an effect of comparable extent on buprenorphine AUC. This can be attributed to a simultaneous induction and inhibition of norbuprenorphine’s production (CYP2C8 and CYP3A4) and elimination pathways (UGT1A1 and UGT1A3) by rifampicin.
As plasma concentrations of norbuprenorphine-glucuronide were not available in the included studies, enterohepatic circulation for norbuprenorphine was not implemented in the PBPK model. To account for this missing process, a factor for maximum reaction velocities of UGT1A1 and UGT1A3 norbuprenorphine metabolism was estimated to decrease norbuprenorphine elimination. However, this could still lead to underpredictions of norbuprenorphine plasma levels, especially in terminal phases, multiple-dose regimens and DDI scenarios. Hence, the simulated DDI effects on norbuprenorphine plasma concentrations (increase with coadministration of rifampicin, decrease with coadministration of clarithromycin and itraconazole) have to be interpreted carefully. Moreover, only a limited number of PK studies with reported norbuprenorphine measurements were available for PBPK model building and evaluation [6,59]. Kapil et al. have reported “slightly higher” norbuprenorphine plasma levels after transdermal buprenorphine application during concomitant use of ketoconazole (inhibitor of CYP3A4 and P-gp), which “may be explained by ketoconazole inhibition of the efflux transporter” [3]. The concomitant administration of voriconazole, an inhibitor of CYP3A4 and CYP2C19, with oral buprenorphine led to an increase of norbuprenorphine AUC of ~400% in a recent study [24]. The authors hypothesized that the elevation of norbuprenorphine levels could be due to inhibition of transporters like P-gp among others, which could affect tissue distribution. The inhibition of P-gp did not result in such an increase of norbuprenorphine plasma concentrations in the simulated DDI scenarios. However, if implemented in the model, an enhanced enterohepatic circulation due to inhibition of P-gp might explain the observed increase. Further studies with buprenorphine need to be conducted to investigate the effect of DDIs on norbuprenorphine exposure including distribution and elimination through transport proteins.
Buprenorphine has recently been of interest in mechanistic modeling efforts. Kalluri et al. and Johnson et al. developed two intravenous and sublingual models of buprenorphine with the SimCyp® simulator [53,76]. The model by Kalluri et al. represents an adult PBPK model and was further extended to a pregnant population by Zhang et al. [77]. Ji et al. used the model to assess the influence of benzodiazepines on buprenorphine PK, which was shown to be negligible [78]. While Johnson et al. succeeded in predicting clearance parameters in adults and 6-year-old children, the observed clearance in a younger age group fell “at the bottom end of the predicted results in term newborns” [76]. This could possibly be due to the fact that only CYP3A4 and UGT1A1 were incorporated in the model and considered for ontogeny. The focus of this study was on predictions of clearance values in different populations. Predictions of buprenorphine plasma concentration-time profiles in adults or pediatrics after intravenous administration were not shown.
Moreover, neither of the models included norbuprenorphine, a major active metabolite of buprenorphine [37]. The contribution of norbuprenorphine to the analgesic efficacy seen after buprenorphine administration is still under debate [79]. However, norbuprenorphine showed a higher potency with regard to the induction of dose-related respiratory depression compared to buprenorphine [80], which has recently been confirmed in a clinical trial with sublingual buprenorphine, pointing out the relevance of the metabolite norbuprenorphine [81]. All AUClast and Cmax values of norbuprenorphine plasma concentration-time profiles predicted with the presented PBPK model lie within 2-fold range of the corresponding observed values with an MRD value of 2.27 for the predicted plasma concentrations.
Norbuprenorphine plasma concentration measurements were only available in clinical studies with adults. Hence, PBPK model predictions for norbuprenorphine were only evaluated in this population. Furthermore, the DDI assessment could only be carried out with the adult PBPK model due to the fact that the incorporated perpetrator drug PBPK models were developed for the application in non-pediatric populations [22].
The impact of the inhibition processes of UGT1A1 and UGT1A3 by buprenorphine and norbuprenorphine on the AUC values was negligible as seen in the local sensitivity analysis. This is probably due to the fact that intracellular unbound drug concentrations were far below the respective Ki values from the literature [34], which is supported by Kress in a recent review [23]. As a result, these inhibitory processes seem to play a minor role in the fate of buprenorphine and norbuprenorphine PK if the in vitro Ki values can be transferred to the in vivo setting and the range of predicted intracellular concentrations reflects the in vivo scenario.
Transdermal buprenorphine has shown its benefits in the treatment of diverse acute and chronic pain syndromes as well as other difficult-to-treat pain conditions and OUD [18,82]. Sustained-release formulations such as transdermal patches hold the potential to reduce plasma concentration fluctuations and risk for non-adherence. Moreover, recent studies have evaluated the use of transdermal buprenorphine patches in children and its reduced risk of ADR compared to other dosage forms with the need for further investigations [3]. As a result of the good predictive PK performance, the new established intravenous buprenorphine PBPK models could be used to develop transdermal PBPK models for predictions of buprenorphine plasma concentrations after transdermal administration based on patch characteristics and in vitro dissolution data.

5. Conclusions

A whole-body parent-metabolite PBPK model of buprenorphine has been developed to predict buprenorphine and norbuprenorphine venous and arterial blood plasma concentration-time profiles as well as buprenorphine and norbuprenorphine urinary excretion after intravenous administration in adults. The model has been used for the assessment of buprenorphine DDIs with clarithromycin, itraconazole as well as rifampicin. Furthermore, the adult PBPK model has been successfully scaled to both a child and a preterm neonate population for predictions of individual plasma concentration-time profiles. The models are thoroughly documented in the Supplementary Materials and publicly available in the OSP repository. With that, the models could support the development of a physiological transdermal buprenorphine model, contribute to a library of PBPK models for predictions in other DDI scenarios, and help with future investigations of buprenorphine and norbuprenorphine pharmacokinetics, including the design of clinical trials and novel formulations both for adults and pediatrics.

Supplementary Materials

The following are available online at https://www.mdpi.com/1999-4923/12/6/578/s1, Electronic Supplementary Materials: Additional detailed model information and evaluation.

Author Contributions

Conceptualization, L.K., C.S., D.S., M.S. and T.L.; Funding acquisition, Y.K., R.B., M.S. and T.L.; Investigation, L.K., C.S. and T.L.; Methodology, L.K., C.S. and T.L.; Visualization, L.K. and D.S.; Writing—original draft, L.K. and T.L.; Writing—review & editing, L.K., C.S., D.S., Y.K., R.B., M.S. and T.L. All authors have read and agreed to the published version of the manuscript.

Funding

This research was funded by the German Federal Ministry of Education and Research (BMBF), 031L0153 “Alternativmethoden zum Tierversuch”, 03XP0196 ”NanoCare4.0–Anwendungssichere Materialinnovationen” and 031L0188D “Guide-IBD”, the Horizon 2020-PHC-2015 grant U-PGx 668353 and the Robert Bosch Stiftung, Stuttgart, Germany.

Conflicts of Interest

Yvonne Kohl, Robert Bals, Matthias Schwab and Thorsten Lehr have received research grants from the German Federal Ministry of Education and Research (BMBF). Lukas Kovar, Christina Schräpel and Dominik Selzer declare no conflicts of interest. The funders had no role in the design of the study; in the collection, analyses, or interpretation of data; in the writing of the manuscript, or in the decision to publish the results.

References

  1. Maunuksela, E.-L.; Korpela, R.; Olkkola, K.T. Double-blind, multiple-dose comparison of buprenorphine and morphine in postoperative pain of children. Br. J. Anaesth. 1988, 60, 48–55. [Google Scholar] [CrossRef] [PubMed] [Green Version]
  2. WHO. Guidelines for the Pharmacological and Radiotherapeutic Management of Cancer Pain in Adults and Adolescents; Licence: CC BY-NC-SA 3.0 IGO; World Health Organization: Geneva, Switzerland, 2018; ISBN 978-92-4-155039-0. [Google Scholar]
  3. Vicencio-Rosas, E.; Pérez-Guillé, M.G.; Flores-Pérez, C.; Flores-Pérez, J.; Trujillo-Jiménez, F.; Chávez-Pacheco, J.L. Buprenorphine and pain treatment in pediatric patients: An update. J. Pain Res. 2018, 11, 549–559. [Google Scholar] [CrossRef] [PubMed] [Green Version]
  4. Michel, E.; Anderson, B.J.; Zernikow, B. Buprenorphine TTS for children—A review of the drug’s clinical pharmacology. Pediatric Anesth. 2011, 21, 280–290. [Google Scholar] [CrossRef] [PubMed]
  5. Dahan, A.; Yassen, A.; Romberg, R.; Sarton, E.; Teppema, L.; Olofsen, E.; Danhof, M. Buprenorphine induces ceiling in respiratory depression but not in analgesia. Br. J. Anaesth. 2006, 96, 627–632. [Google Scholar] [CrossRef] [PubMed] [Green Version]
  6. Kuhlman, J.J.; Lalani, S.; Magluilo, J.; Levine, B.; Darwin, W.D.; Johnson, R.E.; Cone, E.J. Human Pharmacokinetics of Intravenous, Sublingual, and Buccal Buprenorphine. J. Anal. Toxicol. 1996, 20, 369–378. [Google Scholar] [CrossRef] [Green Version]
  7. Lo Re, M.; Chaplin, M.; Aronow, B.; Modesto-Lowe, V. Buprenorphine Overdose in Young Children: An Underappreciated Risk. Clin. Pediatric 2019, 58, 613–617. [Google Scholar] [CrossRef]
  8. Boyer, E.W. Management of Opioid Analgesic Overdose. N. Engl. J. Med. 2012, 367, 146–155. [Google Scholar] [CrossRef] [PubMed] [Green Version]
  9. Ling, W. Buprenorphine for opioid addiction. Pain Manag. 2012, 2, 345–350. [Google Scholar] [CrossRef] [PubMed] [Green Version]
  10. Post, S.; Spiller, H.A.; Casavant, M.J.; Chounthirath, T.; Smith, G.A. Buprenorphine Exposures Among Children and Adolescents Reported to US Poison Control Centers. Pediatrics 2018, 142, e20173652. [Google Scholar] [CrossRef]
  11. Ward, R.M.; Sherwin, C.M.T. Ethics of Drug Studies in the Newborn. Pediatric Drugs 2014, 17, 37–42. [Google Scholar] [CrossRef] [PubMed]
  12. Leong, R.; Vieira, M.L.T.; Zhao, P.; Mulugeta, Y.; Lee, C.S.; Huang, S.-M.; Burckart, G.J. Regulatory experience with physiologically based pharmacokinetic modeling for pediatric drug trials. Clin. Pharmacol. Ther. 2012, 91, 926–931. [Google Scholar] [CrossRef] [PubMed]
  13. Barrett, J.S.; Della Casa Alberighi, O.; Läer, S.; Meibohm, B. Physiologically Based Pharmacokinetic (PBPK) Modeling in Children. Clin. Pharmacol. Ther. 2012, 92, 40–49. [Google Scholar] [CrossRef] [PubMed]
  14. Sager, J.E.; Yu, J.; Ragueneau-Majlessi, I.; Isoherranen, N. Physiologically Based Pharmacokinetic (PBPK) Modeling and Simulation Approaches: A Systematic Review of Published Models, Applications, and Model Verification. Drug Metab. Dispos. 2015, 43, 1823–1837. [Google Scholar] [CrossRef] [PubMed]
  15. Templeton, I.E.; Jones, N.S.; Musib, L. Pediatric Dose Selection and Utility of PBPK in Determining Dose. AAPS J. 2018, 20, 31. [Google Scholar] [CrossRef]
  16. Strougo, A.; Yassen, A.; Monnereau, C.; Danhof, M.; Freijer, J. Predicting the “First dose in children” of CYP3A-metabolized drugs: Evaluation of scaling approaches and insights into the CYP3A7-CYP3A4 switch at young ages. J. Clin. Pharmacol. 2014, 54, 1006–1015. [Google Scholar] [CrossRef]
  17. Yokell, M.A.; Zaller, N.D.; Green, T.C.; Rich, J.D. Buprenorphine and buprenorphine/naloxone diversion, misuse, and illicit use: An international review. Curr. Drug Abuse Rev. 2011, 4, 28–41. [Google Scholar] [CrossRef]
  18. Rosenthal, R.; Goradia, V. Advances in the delivery of buprenorphine for opioid dependence. Drug Des. Devel. Ther. 2017, 11, 2493–2505. [Google Scholar] [CrossRef] [Green Version]
  19. Yang, J.C.; Roman-Urrestarazu, A.; Brayne, C. Responses among substance abuse treatment providers to the opioid epidemic in the USA: Variations in buprenorphine and methadone treatment by geography, operational, and payment characteristics, 2007–2016. PLoS ONE 2020, 15, e0229787. [Google Scholar] [CrossRef] [Green Version]
  20. Dunlap, B.; Cifu, A.S. Clinical Management of Opioid Use Disorder. JAMA 2016, 316, 338. [Google Scholar] [CrossRef]
  21. Picard, N.; Cresteil, T.; Djebli, N.; Marquet, P. In vitro metabolism study of buprenorphine: Evidence for new metabolic pathways. Drug Metab. Dispos. 2005, 33, 689–695. [Google Scholar] [CrossRef]
  22. Hanke, N.; Frechen, S.; Moj, D.; Britz, H.; Eissing, T.; Wendl, T.; Lehr, T. PBPK Models for CYP3A4 and P-gp DDI Prediction: A Modeling Network of Rifampicin, Itraconazole, Clarithromycin, Midazolam, Alfentanil, and Digoxin. CPT Pharmacomet. Syst. Pharmacol. 2018, 7, 647–659. [Google Scholar] [CrossRef] [PubMed] [Green Version]
  23. Kress, H.G. Clinical update on the pharmacology, efficacy and safety of transdermal buprenorphine. Eur. J. Pain 2009, 13, 219–230. [Google Scholar] [CrossRef] [PubMed]
  24. Fihlman, M.; Hemmilä, T.; Hagelberg, N.M.; Backman, J.T.; Laitila, J.; Laine, K.; Neuvonen, P.J.; Olkkola, K.T.; Saari, T.I. Voriconazole greatly increases the exposure to oral buprenorphine. Eur. J. Clin. Pharmacol. 2018, 74, 1615–1622. [Google Scholar] [CrossRef] [PubMed] [Green Version]
  25. Fihlman, M.; Hemmilä, T.; Hagelberg, N.M.; Kuusniemi, K.; Backman, J.T.; Laitila, J.; Laine, K.; Neuvonen, P.J.; Olkkola, K.T.; Saari, T.I. Voriconazole more likely than posaconazole increases plasma exposure to sublingual buprenorphine causing a risk of a clinically important interaction. Eur. J. Clin. Pharmacol. 2016, 72, 1363–1371. [Google Scholar] [CrossRef] [Green Version]
  26. Hagelberg, N.M.; Fihlman, M.; Hemmilä, T.; Backman, J.T.; Laitila, J.; Neuvonen, P.J.; Laine, K.; Olkkola, K.T.; Saari, T.I. Rifampicin decreases exposure to sublingual buprenorphine in healthy subjects. Pharmacol. Res. Perspect. 2016, 4, e00271. [Google Scholar] [CrossRef]
  27. Kovar, L.; Selzer, D.; Britz, H.; Benowitz, N.; St. Helen, G.; Kohl, Y.; Bals, R.; Lehr, T. Comprehensive Parent–Metabolite PBPK/PD Modeling Insights into Nicotine Replacement Therapy Strategies. Clin. Pharmacokinet. 2020. [Google Scholar] [CrossRef] [Green Version]
  28. Johnson, T.N.; Rostami-Hodjegan, A. Resurgence in the use of physiologically based pharmacokinetic models in pediatric clinical pharmacology: Parallel shift in incorporating the knowledge of biological elements and increased applicability to drug development and clinical practice. Pediatric Anesth. 2011, 21, 291–301. [Google Scholar] [CrossRef]
  29. Jones, H.M.; Dickins, M.; Youdim, K.; Gosset, J.R.; Attkins, N.J.; Hay, T.L.; Gurrell, I.K.; Logan, Y.R.; Bungay, P.J.; Jones, B.C.; et al. Application of PBPK modelling in drug discovery and development at Pfizer. Xenobiotica 2012, 42, 94–106. [Google Scholar] [CrossRef]
  30. Wojtyniak, J.-G.; Britz, H.; Selzer, D.; Schwab, M.; Lehr, T. Data Digitizing: Accurate and Precise Data Extraction for Quantitative Systems Pharmacology and Physiologically-Based Pharmacokinetic Modeling. CPT Pharmacomet. Syst. Pharmacol. Pharmacol. 2020. accepted for publication. [Google Scholar] [CrossRef]
  31. Maharaj, A.R.; Barrett, J.S.; Edginton, A.N. A workflow example of PBPK modeling to support pediatric research and development: Case study with lorazepam. AAPS J. 2013, 15, 455–464. [Google Scholar] [CrossRef] [Green Version]
  32. Maharaj, A.R.; Edginton, A.N. Physiologically Based Pharmacokinetic Modeling and Simulation in Pediatric Drug Development. CPT Pharmacomet. Syst. Pharmacol. 2014, 3, 1–13. [Google Scholar] [CrossRef] [PubMed] [Green Version]
  33. Ince, I.; Solodenko, J.; Frechen, S.; Dallmann, A.; Niederalt, C.; Schlender, J.; Burghaus, R.; Lippert, J.; Willmann, S. Predictive Pediatric Modeling and Simulation Using Ontogeny Information. J. Clin. Pharmacol. 2019, 59, S95–S103. [Google Scholar] [CrossRef] [PubMed] [Green Version]
  34. Oechsler, S.; Skopp, G. An in vitro approach to estimate putative inhibition of buprenorphine and norbuprenorphine glucuronidation. Int. J. Legal Med. 2010, 124, 187–194. [Google Scholar] [CrossRef] [PubMed]
  35. Everhart, E.; Cheung, P.; Mendelson, J.; Upton, R.; Jones, R. The mass balance of buprenorphine in humans. Clin. Pharmacol. Ther. 1999, 65, 152. [Google Scholar] [CrossRef]
  36. Chang, Y.; Moody, D.E. Glucuronidation of buprenorphine and norbuprenorphine by human liver microsomes and UDP-glucuronosyltransferases. Drug Metab. Lett. 2009, 3, 101–107. [Google Scholar] [CrossRef]
  37. Brown, S.M.; Campbell, S.D.; Crafford, A.; Regina, K.J.; Holtzman, M.J.; Kharasch, E.D. P-glycoprotein is a major determinant of norbuprenorphine brain exposure and antinociception. J. Pharmacol. Exp. Ther. 2012, 343, 53–61. [Google Scholar] [CrossRef] [Green Version]
  38. Open Systems Pharmacology Suite Community Open Systems Pharmacology Suite Manual, Version 7.4. Available online: https://github.com/Open-Systems-Pharmacology/OSPSuite.Documentation/blob/master/Open%20Systems%20Pharmacology%20Suite.pdf (accessed on 25 March 2020).
  39. PK-Sim® Ontogeny Database, Version 7.3. Available online: https://github.com/Open-Systems-Pharmacology/OSPSuite.Documentation/blob/master/PK-Sim Ontogeny Database Version 7.3.pdf (accessed on 25 March 2020).
  40. McNamara, P.J.; Alcorn, J. Protein binding predictions in infants. AAPS PharmSci 2002, 4, 19–26. [Google Scholar] [CrossRef] [PubMed] [Green Version]
  41. Takahashi, Y.; Ishii, S.; Arizono, H.; Nishimura, S.; Tsuruda, K.; Saito, N.; Nemoto, H.; Jin, Y.; Esumi, Y. Pharmacokinetics of Buprenorphine Hydrochloride (BN HCl) (1): Absorption, Distribution, Metabolism and Excretion after Percutaneous (TSN-09: BN HCl Containing Tape Application) or Subcutaneous Administration of BN HCl in Rats. Drug Metab. Pharmacokinet. 2001, 16, 569–583. [Google Scholar] [CrossRef] [Green Version]
  42. Tod, M.; Jullien, V.; Pons, G. Facilitation of Drug Evaluation in Children by Population Methods and Modelling†. Clin. Pharmacokinet. 2008, 47, 231–243. [Google Scholar] [CrossRef]
  43. Kajosaari, L.I.; Laitila, J.; Neuvonen, P.J.; Backman, J.T. Metabolism of repaglinide by CYP2C8 and CYP3A4 in vitro: Effect of fibrates and rifampicin. Basic Clin. Pharmacol. Toxicol. 2005, 97, 249–256. [Google Scholar] [CrossRef]
  44. Rajaonarison, J.; Lacarelle, B.; Catalin, J.; Placidi, M.; Rahmani, R. 3’-azido-3’-deoxythymidine drug interactions. Screening for inhibitors in human liver microsomes. Drug Metab. Dispos. 1992, 20, 578–584. [Google Scholar] [PubMed]
  45. Chiou, W.J.; de Morais, S.M.; Kikuchi, R.; Voorman, R.L.; Li, X.; Bow, D.A.J. In vitro OATP1B1 and OATP1B3 inhibition is associated with observations of benign clinical unconjugated hyperbilirubinemia. Xenobiotica 2014, 44, 276–282. [Google Scholar] [CrossRef] [PubMed]
  46. Soars, M.G.; Petullo, D.M.; Eckstein, J.A.; Kasper, S.C.; Wrighton, S.A. An assessment of udp-glucuronosyltransferase induction using primary human hepatocytes. Drug Metab. Dispos. 2004, 32, 140–148. [Google Scholar] [CrossRef] [PubMed]
  47. Trottier, J.; El Husseini, D.; Perreault, M.; Pâquet, S.; Caron, P.; Bourassa, S.; Verreault, M.; Inaba, T.T.; Poirier, G.G.; Bélanger, A.; et al. The Human UGT1A3 Enzyme Conjugates Norursodeoxycholic Acid into a C 23 -ester Glucuronide in the Liver. J. Biol. Chem. 2010, 285, 1113–1121. [Google Scholar] [CrossRef] [PubMed] [Green Version]
  48. Reitman, M.L.; Chu, X.; Cai, X.; Yabut, J.; Venkatasubramanian, R.; Zajic, S.; Stone, J.A.; Ding, Y.; Witter, R.; Gibson, C.; et al. Rifampin’s Acute Inhibitory and Chronic Inductive Drug Interactions: Experimental and Model-Based Approaches to Drug–Drug Interaction Trial Design. Clin. Pharmacol. Ther. 2011, 89, 234–242. [Google Scholar] [CrossRef] [PubMed]
  49. Greiner, B.; Eichelbaum, M.; Fritz, P.; Kreichgauer, H.-P.; von Richter, O.; Zundler, J.; Kroemer, H.K. The role of intestinal P-glycoprotein in the interaction of digoxin and rifampin. J. Clin. Investig. 1999, 104, 147–153. [Google Scholar] [CrossRef] [Green Version]
  50. Buckley, D.B.; Wiegand, C.M.; Prentiss, P.L.; Fahmi, O.A. Time-course of cytochrome P450 (CYP450) induction in cultured human hepatocytes: Evaluation of activity and mRNA expression profiles for six inducible CYP450 enzymes [poster no. P186]. In Proceedings of the 10th International ISSX Meeting, Toronto, ON, Canada, 29 September–3 October 2013. [Google Scholar]
  51. Barrett, D.; Simpson, J.; Rutter, N.; Kurihara-Bergstrom, T.; Shaw, P.; Davis, S. The pharmacokinetics and physiological effects of buprenorphine infusion in premature neonates. Br. J. Clin. Pharmacol. 1993, 36, 215–219. [Google Scholar] [CrossRef] [Green Version]
  52. Chiang, C.N.; Hawks, R.L. Pharmacokinetics of the combination tablet of buprenorphine and naloxone. Drug Alcohol Depend. 2003, 70, S39–S47. [Google Scholar] [CrossRef]
  53. Kalluri, H.V.; Zhang, H.; Caritis, S.N.; Venkataramanan, R. A physiologically based pharmacokinetic modelling approach to predict buprenorphine pharmacokinetics following intravenous and sublingual administration. Br. J. Clin. Pharmacol. 2017, 83, 2458–2473. [Google Scholar] [CrossRef]
  54. Bai, S.A.; Xiang, Q.; Finn, A. Evaluation of the Pharmacokinetics of Single- and Multiple-dose Buprenorphine Buccal Film in Healthy Volunteers. Clin. Ther. 2016, 38, 358–369. [Google Scholar] [CrossRef]
  55. Bartlett, A.J.; Lloyd-Jones, J.G.; Rance, M.J.; Flockhart, I.R.; Dockray, G.J.; Bennett, M.R.D.; Moore, R.A. The radioimmunoassay of buprenorphine. Eur. J. Clin. Pharmacol. 1980, 18, 339–345. [Google Scholar] [CrossRef] [PubMed]
  56. Bullingham, R.E.; McQuay, H.J.; Moore, A.; Bennett, M.R. Buprenorphine kinetics. Clin. Pharmacol. Ther. 1980, 28, 667–672. [Google Scholar] [CrossRef] [PubMed]
  57. Bullingham, R.E.; McQuay, H.J.; Porter, E.J.; Allen, M.C.; Moore, R.A. Sublingual buprenorphine used postoperatively: Ten hour plasma drug concentration analysis. Br. J. Clin. Pharmacol. 1982, 13, 665–673. [Google Scholar] [CrossRef] [PubMed] [Green Version]
  58. Harris, D.S.; Jones, R.T.; Welm, S.; Upton, R.A.; Lin, E.; Mendelson, J. Buprenorphine and naloxone co-administration in opiate-dependent patients stabilized on sublingual buprenorphine. Drug Alcohol Depend. 2000, 61, 85–94. [Google Scholar] [CrossRef]
  59. Huestis, M.A.; Cone, E.J.; Pirnay, S.O.; Umbricht, A.; Preston, K.L. Intravenous buprenorphine and norbuprenorphine pharmacokinetics in humans. Drug Alcohol Depend. 2013, 131, 258–262. [Google Scholar] [CrossRef] [Green Version]
  60. Mendelson, J.; Upton, R.A.; Everhart, E.T.; Jacob, P., III; Jones, R.T. Bioavailability of Sublingual Buprenorphine. J. Clin. Pharmacol. 1997, 37, 31–37. [Google Scholar] [CrossRef]
  61. Olkkola, K.; Maunuksela, E.; Korpela, R. Pharmacokinetics of intravenous buprenorphine in children. Br. J. Clin. Pharmacol. 1989, 28, 202–204. [Google Scholar] [CrossRef] [Green Version]
  62. Cone, E.J.; Gorodetzky, C.W.; Yousefnejad, D.; Buchwald, W.F.; Johnson, R.E. The metabolism and excretion of buprenorphine in humans. Drug Metab. Dispos. 1984, 12, 577–581. [Google Scholar]
  63. Wishart, D.S.; Knox, C.; Guo, A.C.; Shrivastava, S.; Hassanali, M.; Stothard, P.; Chang, Z.; Woolsey, J. DrugBank: A comprehensive resource for in silico drug discovery and exploration. Nucleic Acids Res. 2006, 34, D668–D672. [Google Scholar] [CrossRef]
  64. Yeola, G.S.; Darandale, S.; Khire, A.; Vavia, P.R. Fabrication and statistical optimization of a polysaccharide-based sublingual film of buprenorphine hydrochloride for breakthrough pain management: In vitro and in vivo performance. Drug Deliv. Transl. Res. 2014, 4, 116–125. [Google Scholar] [CrossRef]
  65. Wishart, D.S.; Feunang, Y.D.; Marcu, A.; Guo, A.C.; Liang, K.; Vázquez-Fresno, R.; Sajed, T.; Johnson, D.; Li, C.; Karu, N.; et al. HMDB 4.0: The human metabolome database for 2018. Nucleic Acids Res. 2018, 46, D608–D617. [Google Scholar] [CrossRef]
  66. Heel, R.C.; Brogden, R.N.; Speight, T.M.; Avery, G.S. Buprenorphine: A review of its pharmacological properties and therapeutic efficacy. Drugs 1979, 17, 81–110. [Google Scholar] [CrossRef] [PubMed]
  67. Schmitt, W. General approach for the calculation of tissue to plasma partition coefficients. Toxicol. In Vitro 2008, 22, 457–467. [Google Scholar] [CrossRef] [PubMed]
  68. Obach, R.S. Nonspecific binding to microsomes: Impact on scale-up of in vitro intrinsic clearance to hepatic clearance as assessed through examination of warfarin, imipramine, and propranolol. Drug Metab. Dispos. 1997, 25, 1359–1369. [Google Scholar] [PubMed]
  69. Mahmood, I.; Tegenge, M.A. A Comparative Study Between Allometric Scaling and Physiologically Based Pharmacokinetic Modeling for the Prediction of Drug Clearance From Neonates to Adolescents. J. Clin. Pharmacol. 2019, 59, 189–197. [Google Scholar] [CrossRef] [PubMed]
  70. Kapil, R.P.; Cipriano, A.; Friedman, K.; Michels, G.; Shet, M.S.; Colucci, S.V.; Apseloff, G.; Kitzmiller, J.; Harris, S.C. Once-Weekly Transdermal Buprenorphine Application Results in Sustained and Consistent Steady-State Plasma Levels. J. Pain Symptom Manag. 2013, 46, 65–75. [Google Scholar] [CrossRef] [PubMed]
  71. Duan, P.; Fisher, J.W.; Yoshida, K.; Zhang, L.; Burckart, G.J.; Wang, J. Physiologically Based Pharmacokinetic Prediction of Linezolid and Emtricitabine in Neonates and Infants. Clin. Pharmacokinet. 2017, 56, 383–394. [Google Scholar] [CrossRef] [PubMed]
  72. Edginton, A.N.; Schmitt, W.; Voith, B.; Willmann, S. A Mechanistic Approach for the Scaling of Clearance in Children. Clin. Pharmacokinet. 2006, 45, 683–704. [Google Scholar] [CrossRef]
  73. Edginton, A.N.; Willmann, S. Physiology-based versus allometric scaling of clearance in children; an eliminating process based comparison. Paediatric Perinat. Drug Ther. 2006, 7, 146–153. [Google Scholar] [CrossRef]
  74. Kearns, G.L.; Abdel-Rahman, S.M.; Alander, S.W.; Blowey, D.L.; Leeder, J.S.; Kauffman, R.E. Developmental pharmacology--drug disposition, action, and therapy in infants and children. N. Engl. J. Med. 2003, 349, 1157–1167. [Google Scholar] [CrossRef]
  75. Kapil, R.P.; Cipriano, A.; Michels, G.H.; Perrino, P.; O’Keefe, S.A.; Shet, M.S.; Colucci, S.V.; Noveck, R.J.; Harris, S.C. Effect of Ketoconazole on the Pharmacokinetic Profile of Buprenorphine following Administration of a Once-Weekly Buprenorphine Transdermal System. Clin. Drug Investig. 2012, 32, 583–592. [Google Scholar] [CrossRef] [PubMed]
  76. Johnson, T.N.; Jamei, M.; Rowland-Yeo, K. How Does In Vivo Biliary Elimination of Drugs Change with Age? Evidence from In Vitro and Clinical Data Using a Systems Pharmacology Approach. Drug Metab. Dispos. 2016, 44, 1090–1098. [Google Scholar] [CrossRef]
  77. Zhang, H.; Kalluri, H.V.; Bastian, J.R.; Chen, H.; Alshabi, A.; Caritis, S.N.; Venkataramanan, R. Gestational changes in buprenorphine exposure: A physiologically-based pharmacokinetic analysis. Br. J. Clin. Pharmacol. 2018, 84, 2075–2087. [Google Scholar] [CrossRef] [PubMed] [Green Version]
  78. Ji, B.; Liu, S.; Xue, Y.; He, X.; Man, V.H.; Xie, X.-Q.; Wang, J. Prediction of Drug–Drug Interactions Between Opioids and Overdosed Benzodiazepines Using Physiologically Based Pharmacokinetic (PBPK) Modeling and Simulation. Drugs R D 2019, 19, 297–305. [Google Scholar] [CrossRef] [Green Version]
  79. Jensen, M.L.; Foster, D.; Upton, R.; Grant, C.; Martinez, A.; Somogyi, A. Comparison of cerebral pharmacokinetics of buprenorphine and norbuprenorphine in an in vivo sheep model. Xenobiotica 2007, 37, 441–457. [Google Scholar] [CrossRef] [PubMed]
  80. Ohtani, M.; Kotaki, H.; Nishitateno, K.; Sawada, Y.; Iga, T. Kinetics of respiratory depression in rats induced by buprenorphine and its metabolite, norbuprenorphine. J. Pharmacol. Exp. Ther. 1997, 281, 428–433. [Google Scholar] [PubMed]
  81. Strang, J.; Knight, A.; Baillie, S.; Reed, K.; Bogdanowicz, K.; Bell, J. Norbuprenorphine and respiratory depression: Exploratory analyses with new lyophilized buprenorphine and sublingual buprenorphine. Int. J. Clin. Pharmacol. Ther. 2018, 56, 81–85. [Google Scholar] [CrossRef]
  82. Hans, G.; Robert, D. Transdermal buprenorphine—A critical appraisal of its role in pain management. J. Pain Res. 2009, 2, 117–134. [Google Scholar] [CrossRef] [Green Version]
Figure 1. Implemented metabolic processes for buprenorphine and norbuprenorphine (a) and structural overview of the physiologically-based pharmacokinetic (PBPK) model (b). Boxes indicate compartments, black lines indicate metabolic processes, blue, grey and red lines denote in-/out-flows. CYP: cytochrome P450, GIT: gastrointestinal tract, UGT: uridine 5ʹ-diphospho-glucuronosyltransferase.
Pharmaceutics 12 00578 g001
Figure 2. Buprenorphine (blue: venous blood, red: arterial blood) and norbuprenorphine (green: venous blood) predicted and observed plasma concentration-time profiles after intravenous administration of buprenorphine in adults. (a,b): selection of internal training dataset, (cf): selection of external test dataset. Population simulations (n = 100) are shown as lines with shaded areas. Observed data are shown as circles ± standard deviation if available. References with numbers in parentheses link to a specific observed dataset described in the study table (Table 1). Predicted and observed area under the concentration-time curve from the first to the last data point (AUClast) and maximum plasma concentration (Cmax) values are compared in Table S6 of the Supplementary Materials. Predicted and observed plasma concentration-time profiles of all studies in adults are shown in Section 4.1 of the Supplementary Materials both on a linear and a semilogarithmic scale. iv: intravenous, m.d.: multiple dose.
Pharmaceutics 12 00578 g002
Figure 3. Predicted versus observed plasma concentrations (a) as well as predicted versus observed AUClast (b) and Cmax (c) values of buprenorphine and norbuprenorphine for the adult PBPK model. In (a), each symbol represents a single plasma concentration (circles: buprenorphine, triangles: norbuprenorphine). In (b,c), each symbol represents the AUClast or Cmax of a single plasma concentration-time profile (blue circles: buprenorphine, green triangles: norbuprenorphine). As stated in the materials and methods section, Cmax values were only calculated for long-term infusions and norbuprenorphine metabolite. The black solid lines mark the lines of identity. Black dotted lines indicate 1.25-fold, black dashed lines indicate 2-fold deviation. AUClast: area under the plasma concentration-time curve from the first to the last data point, Cmax: maximum plasma concentration.
Pharmaceutics 12 00578 g003
Figure 4. Buprenorphine (red: arterial blood, blue: venous blood) predicted and observed plasma concentration-time profiles after intravenous administration of buprenorphine in preterm neonates (ae) and children (f). Population simulations (n = 100) are shown as lines with shaded areas. Observed data are shown as circles. References with numbers in parentheses link to a specific observed dataset described in Table 1 and Table S2 of the Supplementary Materials. Predicted and observed area under the plasma concentration-time curve from the first to the last data point (AUClast) and maximum plasma concentration (Cmax) values are compared in Table S6 of the Supplementary Materials. Predicted and observed plasma concentration-time profiles of all studies in pediatrics are shown in Section 4.2 of the Supplementary Materials both on a linear and a semilogarithmic scale. iv: intravenous.
Pharmaceutics 12 00578 g004
Figure 5. Predicted versus observed AUClast (a) and Cmax (b) values of buprenorphine for the pediatric PBPK models as well as predicted versus observed plasma concentrations for children (c) (blue: PBPK modeling, grey: allometric scaling) and preterm neonates (d) (blue: PBPK modeling, grey: allometric scaling, dark grey: allometric scaling with ADE as suggested by Mahmood and Tegenge [69]). In (a,b), each symbol represents the AUClast or Cmax of a single concentration-time profile. In (c,d), each symbol represents a single plasma concentration. As stated in the materials and methods section, Cmax values were only calculated for long-term infusions. The black solid lines mark the lines of identity. Black dotted lines indicate 1.25-fold, black dashed lines indicate 2-fold deviation. ADE: age-dependent exponent, AUClast: area under the plasma concentration-time curve from the first to the last data point, Cmax: maximum plasma concentration.
Pharmaceutics 12 00578 g005
Figure 6. DDI scenarios for buprenorphine (blue, left panel) and norbuprenorphine (green, right panel) with the perpetrator drugs rifampicin ((a,b), semilogarithmic), clarithromycin ((c,d), linear) and itraconazole ((e,f), linear) in adults. Buprenorphine and norbuprenorphine plasma concentrations during concomitant administration of a DDI perpetrator drug are shown in purple. Population simulations (n = 100) are shown as lines with shaded areas. If available, observed data are shown as filled circles ± standard deviation (a). References link to a specific observed dataset described in Table 1. Information about dosing regimens as well as observed and predicted AUC ratios for buprenorphine and norbuprenorphine are depicted in Table 3. DDI, drug-drug interaction; iv, intravenous.
Pharmaceutics 12 00578 g006
Table 1. Overview of clinical studies used for building and evaluation of the PBPK models.
Clinical StudyDose [mg]AdministrationnFemale [%]Age [Years]Weight [kg]Blood Sample aNorbuprenorphine MeasurementsDatasetReference
Adults
Bai et al. 20160.3iv (2 min)252435.5 (20–53)76.1 (62.6–93.0)arterialnoe[54]
Bartlett et al. 19800.3iv (1 min) b1---arterialnoe[55]
Bullingham et al. 1980 (1)0.3iv (1 min)244264.5 ± 1.667.7 ± 2.4arterialnoe[56]
Bullingham et al. 1980 (2)0.3iv (1 min, m.d.)104067.5 ± 6.567.5 ± 2.1arterialnoe[56]
Bullingham et al. 1982 (1)0.3iv (1 min)56066.8 ± 2.965.0 ± 4.0arterialnoe[57]
Bullingham et al. 1982 (2)0.3iv (1 min)56064.2 ± 2.566.4 ± 2.9arterialnoi[57]
Bullingham et al. 1982 (3)0.3iv (1 min)56066.0 ± 3.264.8 ± 3.9arterialnoe[57]
Everhart et al. 19991iv (60 min)6----yesi[35]
Hagelberg et al. 2016 (1)1iv (bolus)1242- (19–23)- (57–95)venousnoe[26]
Hagelberg et al. 2016 (2) c1iv (bolus)1242- (19–23)- (57–95)venousnoe[26]
Harris et al. 20004iv (10 min)91134 (21–42)-venousnoe[58]
Huestis et al. 2013 (1)2iv (1 min)5-34.6 (32–39)74.7 (62.1–82.6)venousyesi[59]
Huestis et al. 2013 (2)4iv (1 min)5-34.6 (32–39)74.7 (62.1–82.6)venousyese[59]
Huestis et al. 2013 (3)8iv (1 min)5-34.6 (32–39)74.7 (62.1–82.6)venousyese[59]
Huestis et al. 2013 (4)12iv (1 min)5-34.6 (32–39)74.7 (62.1–82.6)venousyese[59]
Huestis et al. 2013 (5)16iv (1 min)5-34.6 (32–39)74.7 (62.1–82.6)venousyesi[59]
Kuhlman et al. 19961.2iv (1 min)5034.4 (27–40)67.7 (62.6–72.7)venousyesi[6]
Mendelson et al. 19971iv (30 min)61729 (21–38)-venousnoe[60]
Pediatrics
Barrett et al. 1993 d3 µg/kg + 0.72–2.16 µg/kg/hiv (30 min + 11–118 h)12-31 weeks (27–34) e1.5 (0.9–2.4)arterialnoe[51]
Olkkola et al. 19893 µg/kgiv (2 min)10-5.9 (4.6–7.5)21.4 (18.5–25)venousnoe[61]
-: not available, e: external test dataset, i: internal training dataset, iv: intravenous, m.d.: multiple dose, a if sample information was not specified, venous blood samples were assumed, b administration time not given; based on the observed data and information from other studies, an administration time of 1 min was assumed, c with concomitant administration of rifampicin, d detailed information on individual patient characteristics and dosing regimens is depicted in Table S2 of the Supplementary Materials, e postmenstrual age.
Table 2. Buprenorphine and norbuprenorphine drug-dependent parameters.
ParameterValueUnitSourceLiteratureReferenceValueUnitSourceLiteratureReferenceDescription
BuprenorphineNorbuprenorphine
MW467.64g/mollit.467.64[63] a413.55g/mollit.413.55[63] bMolecular weight
pKa1 (base)12.54 lit.12.54[63] a10.49 lit.10.49[63] bAcid dissociation constant
pKa2 (acid)7.50 lit.7.50[63] a9.80 lit.9.80[63] bAcid dissociation constant
logP3.40 lit.3.40[64]3.19 lit.3.19[65] cLipophilicity
fu (adults)4.0%lit.4.0[66]21.7%optim.--Fraction unbound
fu (children)5.1%calc.5.1[40,66] Fraction unbound
fu (preterm neonates)7.2%calc.7.2[40,66] Fraction unbound
CYP2C8 Km -> norbup5.2µmol/Llit.5.2[21] e Michaelis-Menten constant
CYP2C8 vmax -> norbupf1∙176.3pmol/min/mg proteinlit.176.3[21] Maximum reaction velocity
CYP3A4 Km -> norbup5.7µmol/Llit.5.7[21] e Michaelis-Menten constant
CYP3A4 vmax -> norbupf1∙520.0pmol/min/mg proteinlit.520.0[21] Maximum reaction velocity
CYP3A4 Km -> undef5.7µmol/Lass.-- Michaelis-Menten constant
CYP3A4 vmax -> undeff2∙1352.1pmol/min/mg proteincalc.d-- Maximum reaction velocity
CYP3A7 Km -> undef29.1µmol/Lcalc.d-- Michaelis-Menten constant
CYP3A7 vmax -> undeff2∙632.6pmol/min/mg proteincalc.d-- Maximum reaction velocity
UGT1A1 Km -> undef10.4µmol/Llit.10.4[34] e21.8µmol/Llit.21.8[34] eMichaelis-Menten constant
UGT1A1 vmax -> undeff2∙6726.8pmol/min/mg proteinlit.6726.8[34]f3∙714.6pmol/min/mg proteinlit.714.6[34]Maximum reaction velocity
UGT1A3 Km -> undef1.1µmol/Llit.1.1[34] e14.7µmol/Llit.14.7[34] eMichaelis-Menten constant
UGT1A3 vmax -> undeff2∙642.6pmol/min/mg proteinlit.642.6[34]f3∙387.0pmol/min/mg proteinlit.387.0[34]Maximum reaction velocity
UGT2B7 Km -> undef1.8µmol/Llit.1.8[34] e Michaelis-Menten constant
UGT2B7 vmax -> undeff2∙823.8pmol/min/mg proteinlit.823.8[34] Maximum reaction velocity
P-gp Km 3.4µmol/Loptim.- Michaelis-Menten constant
P-gp kcat 2.141/minoptim.- Transport rate constant
f12.80 optim.- Factor
f20.27 optim.- Factor
f3 0.43 optim.- Factor
GFR fraction1.00 ass.- 1.00 ass.- Filtered drug in the urine
UGT1A1 Ki14.8µmol/Llit.14.8[34] e Conc. for 50% inhibition
UGT1A3 Ki0.5µmol/Llit.0.5[34] e1.6µmol/Llit.1.6[34] eConc. for 50% inhibition
Partition coefficientsDiverse calc.Schmitt[67]Diverse calc.PK-Sim[38]Cell to plasma partitioning
Cellular permeability6.91E-03cm/mincalc.PK-Sim[38]8.91E-03cm/mincalc.PK-Sim[38]Perm. into the cellular space
-: not available, ass.: assumed, calc.: calculated, conc.: concentration, CYP: cytochrome P450, GFR: glomerular filtration rate, lit.: literature, norbup: norbuprenorphine, optim.: optimized, perm.: permeability, P-gp: P-glycoprotein, PK-Sim: PK-Sim standard calculation method, Schmitt: Schmitt calculation method, undef: undefined metabolite, UGT: uridine 5ʹ-diphospho-glucuronosyltransferase, a DrugBank entry for buprenorphine. https://www.drugbank.ca/drugs/DB00921, accessed 21 April 2020, b DrugBank entry for norbuprenorphine. https://www.drugbank.ca/metabolites/DBMET00174, accessed 21 April 2020, c HMDB entry for norbuprenorphine. https://hmdb.ca/metabolites/HMDB0060546, accessed 21 April 2020, d for detailed information please refer to Section 1 in the Supplementary Materials; e apparent Ki and Km literature values were corrected according to [68] using the free fractions of buprenorphine and norbuprenorphine in microsome assays from [36].
Table 3. DDI study dosing regimens with predicted and observed AUC ratios.
Victim Drug [Dose]Perpetrator Drug [Dose]Pred. AUC Ratio (Buprenorphine) with/without PerpetratorObs. AUC Ratio (Buprenorphine) with/without PerpetratorPred. AUC Ratio (Norbuprenorphine) with/without PerpetratorObs. AUC Ratio (Norbuprenorphine) with/without PerpetratorReference
Buprenorphine
[1.4 mg, 168 h iv infusion]
Clarithromycin
[250 mg, bid, po]
1.06-0.82-simulated a
Buprenorphine
[1.4 mg, 168 h iv infusion]
Itraconazole
[100 mg, bid, po] b
1.11-0.64-simulated a
Buprenorphine
[1 mg, iv bolus]
Rifampicin
[600 mg, qd, po]
0.890.851.11-[26]
-: not available, bid: twice daily, iv: intravenous, obs.: observed, po: oral, pred.: predicted, qd: once daily, a population simulations were carried out with a virtual population (n = 100) with an age range of 20–50 years and without specific body weight or height restrictions as implemented in PK-Sim®, b loading dose of 200 mg as first dose.

