Article

Physiologically-Based Pharmacokinetic (PBPK) Modeling Providing Insights into Fentanyl Pharmacokinetics in Adults and Pediatric Patients

1
Department of Clinical Pharmacy, Saarland University, 66123 Saarbrücken, Germany
2
Department of General Pediatrics and Neonatology, Saarland University Medical Center, 66421 Homburg, Germany
3
Fraunhofer Institute for Biomedical Engineering IBMT, 66280 Sulzbach, Germany
4
Department of Internal Medicine V, Saarland University, 66421 Homburg, Germany
5
Department of Pharmaceutical Sciences, College of Pharmacy, The University of Tennessee Health Science Center, Memphis, TN 38163, USA
*
Author to whom correspondence should be addressed.
Pharmaceutics 2020, 12(10), 908; https://doi.org/10.3390/pharmaceutics12100908
Submission received: 26 August 2020 / Revised: 16 September 2020 / Accepted: 21 September 2020 / Published: 23 September 2020
(This article belongs to the Special Issue Applications of Physiologically-Based Pharmacokinetic (PBPK) Modeling)

Abstract

:
Fentanyl is widely used for analgesia, sedation, and anesthesia both in adult and pediatric populations. Yet, only few pharmacokinetic studies of fentanyl in pediatrics exist as conducting clinical trials in this population is especially challenging. Physiologically-based pharmacokinetic (PBPK) modeling is a mechanistic approach to explore drug pharmacokinetics and allows extrapolation from adult to pediatric populations based on age-related physiological differences. The aim of this study was to develop a PBPK model of fentanyl and norfentanyl for both adult and pediatric populations. The adult PBPK model was established in PK-Sim® using data from 16 clinical studies and was scaled to several pediatric subpopulations. ~93% of the predicted AUClast values in adults and ~88% in pediatrics were within 2-fold of the corresponding value observed. The adult PBPK model predicted a fraction of fentanyl dose metabolized to norfentanyl of ~33% and a fraction excreted in urine of ~7%. In addition, the pediatric PBPK model was used to simulate differences in peak plasma concentrations after bolus injections and short infusions. The novel PBPK models could be helpful to further investigate fentanyl pharmacokinetics in both adult and pediatric populations.

1. Introduction

Fentanyl is a strong opioid—approximately 50- to 100-fold more potent compared to morphine—and is extensively used in the therapeutic fields of analgesia, sedation, and anesthesia both in adult and pediatric patients [1,2,3]. While clinical trials on the pharmacokinetics (PK) of fentanyl suggest several factors such as liver function impacting the dose–exposure relationship, the wide interindividual variability is still not completely understood [3]. As fentanyl is a substrate of the cytochrome P450 (CYP) iso-enzyme 3A4, fentanyl PK can be altered by concomitant administration of CYP3A4 inhibitors and inducers (drug–drug interactions, DDIs) [3].
The major route of metabolic clearance was assumed to be mediated via CYP3A4 metabolizing fentanyl to the inactive metabolite norfentanyl [3,4]. However, recent research activities have suggested a strong involvement of additional metabolic pathways and hypothesized unknown metabolites [5,6].
In critically ill neonates, analgesic therapy is commonly administered, since pain can act as a stressor increasing mortality in this population [1]. Indeed, fentanyl is the opioid analgesic most frequently used in neonatal intensive care units [1], which highlights the importance of fentanyl in pediatrics. Yet, there is still a lack of knowledge regarding fentanyl PK in children [2]. The desired analgesic and sedating effects resulting from administration of fentanyl usually lead to an improvement of respiratory compliance [7,8]. However, adverse drug reactions (ADRs), such as bradycardia, respiratory depression, and, in rare cases, chest wall rigidity, might occur even after low doses of fentanyl administration [1,8]. A recent meta-analysis by Ziesenitz and colleagues concluded the need for further research on fentanyl, especially in larger cohorts and special subpopulations such as preterm neonates and children with hepatic or renal impairment [2]. However, pediatric PK studies are difficult to conduct and are often impeded by ethical and logistic challenges, many of which are unique to pediatrics [9].
Physiologically-based pharmacokinetic (PBPK) modeling can be used for evaluating and extending existing knowledge on drug disposition derived from in vitro and in vivo investigations into unstudied subpopulations and clinical scenarios [10,11]. An increasing number of drug applications submitted to the US Food and Drug Administration (FDA) and the European Medicines Agency (EMA) have investigated the impact of hepatic disease, pharmacogenomics, and DDIs on drug PK with the help of PBPK modeling [10,12]. Previous PBPK efforts on fentanyl have focused on methodological aspects of simplifying PBPK models [13], on a PBPK approach to support the development of Provisional Advisory Levels (PALs) for hazardous agents [14], and on simulating thyroid and testes tissue concentrations [15], respectively.
In pediatrics, PBPK approaches have also proven its usefulness in designing and optimizing clinical trials and are supported by both the FDA and the EMA [12,16,17,18,19,20]. For a priori PBPK predictions in pediatrics, the PBPK model first needs to be informed and evaluated with published PK data in adults and subsequently extrapolated to pediatric populations—a workflow which has recently been implemented and successfully executed for several drugs [10,21,22,23,24,25].
The aim of the presented work was to develop a whole-body parent-metabolite intravenous PBPK model of fentanyl and norfentanyl in adults as a foundation for further assessment of fentanyl PK and to extrapolate the adult PBPK model for the prediction of plasma concentration–time profiles as well as individual clearance parameters in pediatric patients. The novel PBPK models are publicly available in the Open Systems Pharmacology (OSP) repository as clinical research tools to support the design of clinical trials in specific populations as well as the development of novel drug formulations. The Supplementary Materials serve as an additional reference manual including detailed model performance evaluation.

2. Materials and Methods

2.1. Software

The PBPK models were developed with the PK-Sim® modeling software (version 9.0, 2020, www.open-systems-pharmacology.org), which is part of the OSP Suite [11]. Clinical plasma data from scientific literature was digitized using GetData Graph Digitizer version 2.26.0.20 (S. Fedorov, 2013) according to best practices [26]. Model input parameters were optimized using the Monte Carlo algorithm implemented in PK-Sim®. PK parameter and model performance measure calculation as well as graph plotting were performed with the R programming language version 3.6.1 (R Foundation for Statistical Computing, Vienna, Austria, 2019) and R Studio® version 1.2.5019 (R Studio, Inc., Boston, MA, USA, 2019).

2.2. PBPK Model Building for Adult Populations

The adult fentanyl parent-metabolite model building was initiated with an extensive literature search to obtain information on physicochemical properties as well as distribution, metabolism and excretion processes of fentanyl and norfentanyl. The gathered information was utilized to implement relevant drug–protein interactions (i.e., for transport proteins and enzymes) and to inform drug-dependent model input parameters. Published clinical studies of intravenous fentanyl administration in single- and multiple-dose regimens were used to extract plasma profiles and measured fractions of fentanyl dose excreted unchanged in urine. The fentanyl and norfentanyl plasma profiles were divided into an internal training and an external test dataset. Studies for the training dataset were selected containing a wide range of profiles (i.e., different dosing regimens, timing and frequency of sampling, measurements of norfentanyl, measurements of arterial and venous plasma concentrations, etc.). The test dataset was used for model evaluation.
Distribution and elimination processes including CYP enzymes as well as drug transporters were implemented according to the literature [5,27,28]. For the fentanyl model, these included (1) metabolism of fentanyl to the inactive metabolite norfentanyl via CYP3A4 and CYP3A7, (2) an unspecific hepatic pathway metabolizing fentanyl to other non-specified metabolites, (3) distribution and excretion via P-glycoprotein (P-gp), and (4) renal excretion through glomerular filtration. It should be noted that the actual role of CYP3A7 in the metabolism of fentanyl is suspected but the true nature of involvement still remains unknown [27,29]. Since CYP3A4 and CYP3A7 exhibit a similar substrate spectrum and CYP3A7 is the major fetal form of CYP3A [30], CYP3A7 might be important for PK predictions of fentanyl in pediatric populations and was therefore incorporated in the model. Considering that norfentanyl is predominantly eliminated via urine, renal clearance was implemented and estimated during the parameter optimization step [5]. Tissue expression distribution of the metabolizing enzymes and P-gp in all model compartments was implemented according to the PK-Sim® expression database [31]. Model input parameters, which could not be adequately obtained from literature, were estimated by fitting the parent-metabolite model to the training dataset. For detailed information on PBPK model building see Section 1 in the Supplementary Materials.

2.3. PBPK Modeling in Pediatrics

For a priori predictions of plasma concentration–time profiles as well as clearance parameters in pediatrics, the adult PBPK model was scaled to pediatric populations of different age groups. For this, the adult virtual populations were replaced by pediatric virtual populations, changing the physiological and anatomic parameters describing the human body. As a result, anatomic and physiological parameters as well as CYP3A4 and CYP3A7 tissue concentrations were scaled to the particular pediatric target population taking age-related changes such as size of tissue compartments and maturation of enzyme abundances into account. The used ontogeny functions for CYP3A4 and CYP3A7 are depicted in the PK-Sim® ontogeny database [32]. Since ontogenetic information regarding the transport protein P-gp were not implemented in PK-Sim®, the age-dependent protein abundance was estimated via the published ontogeny function from Prasad et al. [33]. While changes in anatomy and physiology during liver maturation were considered, the rate constant of the implemented unspecific hepatic clearance process was assumed to be independent of age. The unbound fraction of fentanyl was scaled for each particular pediatric population using the method of McNamara and Alcorn for alpha-1-acid glycoprotein [34,35] and compared to a range of published literature values. The remaining drug-dependent parameters were fixed to the values of the adult PBPK model. Next, the extrapolated PBPK model was applied to predict plasma profiles in pediatric populations of different age ranges (i.e., preterm and full-term neonates, infants and children). Additionally, 65 individual clearance values from preterm and full-term neonates were predicted and compared to observed values from three clinical trials [36,37,38].

2.4. PBPK Model Evaluation and DDI Modeling

Predicted and observed plasma concentrations as well as predicted and observed areas under the plasma concentration–time curve from the first to the last data point (AUClast) were compared in goodness-of-fit plots for both the adult and the pediatric PBPK models. Moreover, all simulated fentanyl and norfentanyl plasma concentration–time trajectories were visually compared to the plasma profiles observed from the respective clinical trial. In order to visualize the interindividual variability of the model, virtual populations of 100 individuals were created covering the patient characteristics of the corresponding clinical study population. Detailed information on virtual populations can be found in Section 1.3 in the Supplementary Materials. For plasma profile simulation for individual patients, populations of 100 individuals with the same patient demographics were used, only allowing variability in the expression of the implemented enzymes, transporters and the unspecific hepatic clearance. Furthermore, two quantitative model performance measures were calculated for the adult and pediatric PBPK models: the mean relative deviation (MRD) of the predicted from the observed plasma concentrations for each plasma profile as well as the geometric mean fold error (GMFE) of the computed AUClast ratios. The sensitivity of the PBPK models to single-parameter changes (local sensitivity analysis) was estimated with PK-Sim®. Detailed information on the calculation of MRD, GMFE and sensitivity analysis can be found in Section 3 in the Supplementary Materials.
For further evaluation of the adult PBPK model, a DDI scenario of fentanyl and the CYP3A4 inhibitor voriconazole was predicted and compared with the plasma profiles observed in a clinical trial. For this, the developed fentanyl-norfentanyl PBPK model was coupled with a recently published PBPK model of voriconazole [39]. The mathematical implementation of the competitive and irreversible interaction is described in Section 2 in the Supplementary Materials.
For pediatrics, individual and population mean clearance values extracted from three clinical trials were compared to predictions from the pediatric PBPK model. Finally, for all models, the percentages of model-predicted AUClast and clearance values falling within 2-fold of the corresponding observed values were calculated.

3. Results

3.1. PK Data for PBPK Model Development and Pediatric Scaling

For adult PBPK model development, 16 clinical studies including 24 different treatment arms were utilized, covering a broad dosing range of 0.3–60 µg/kg body weight intravenous fentanyl in single- and multiple-dosing regimens. Here, three treatment arms also reported plasma concentrations of the metabolite norfentanyl. The dataset included one DDI study with voriconazole as the perpetrator drug as well as 14 study arms with fentanyl administration before or during surgeries. Nine treatment arms measured fentanyl concentrations in arterial blood, 14 in venous blood and one covered both sampling sites. Moreover, three clinical trials provided information on fractions of fentanyl dose excreted unchanged in urine [5,40,41]. All plasma profiles were digitized and split into an internal training (n = 9 profiles) and an external test dataset (n = 18 profiles). An overview of the included clinical studies in adults including study characteristics, dosing regimens, and the assignments to training and test dataset is shown in Table 1.
For predictive performance evaluation of the extrapolated pediatric PBPK model, five clinical trials investigating fentanyl plasma concentrations in preterm neonates, full-term neonates, infants and young children with mean age ranging from 32 weeks of gestational age to approximately three years of chronological age were identified. Moreover, individual clearance values of 65 preterm and full-term neonates were extracted from three published studies. An overview of the clinical studies in pediatrics including study characteristics and dosing regimens is provided in Table 2.

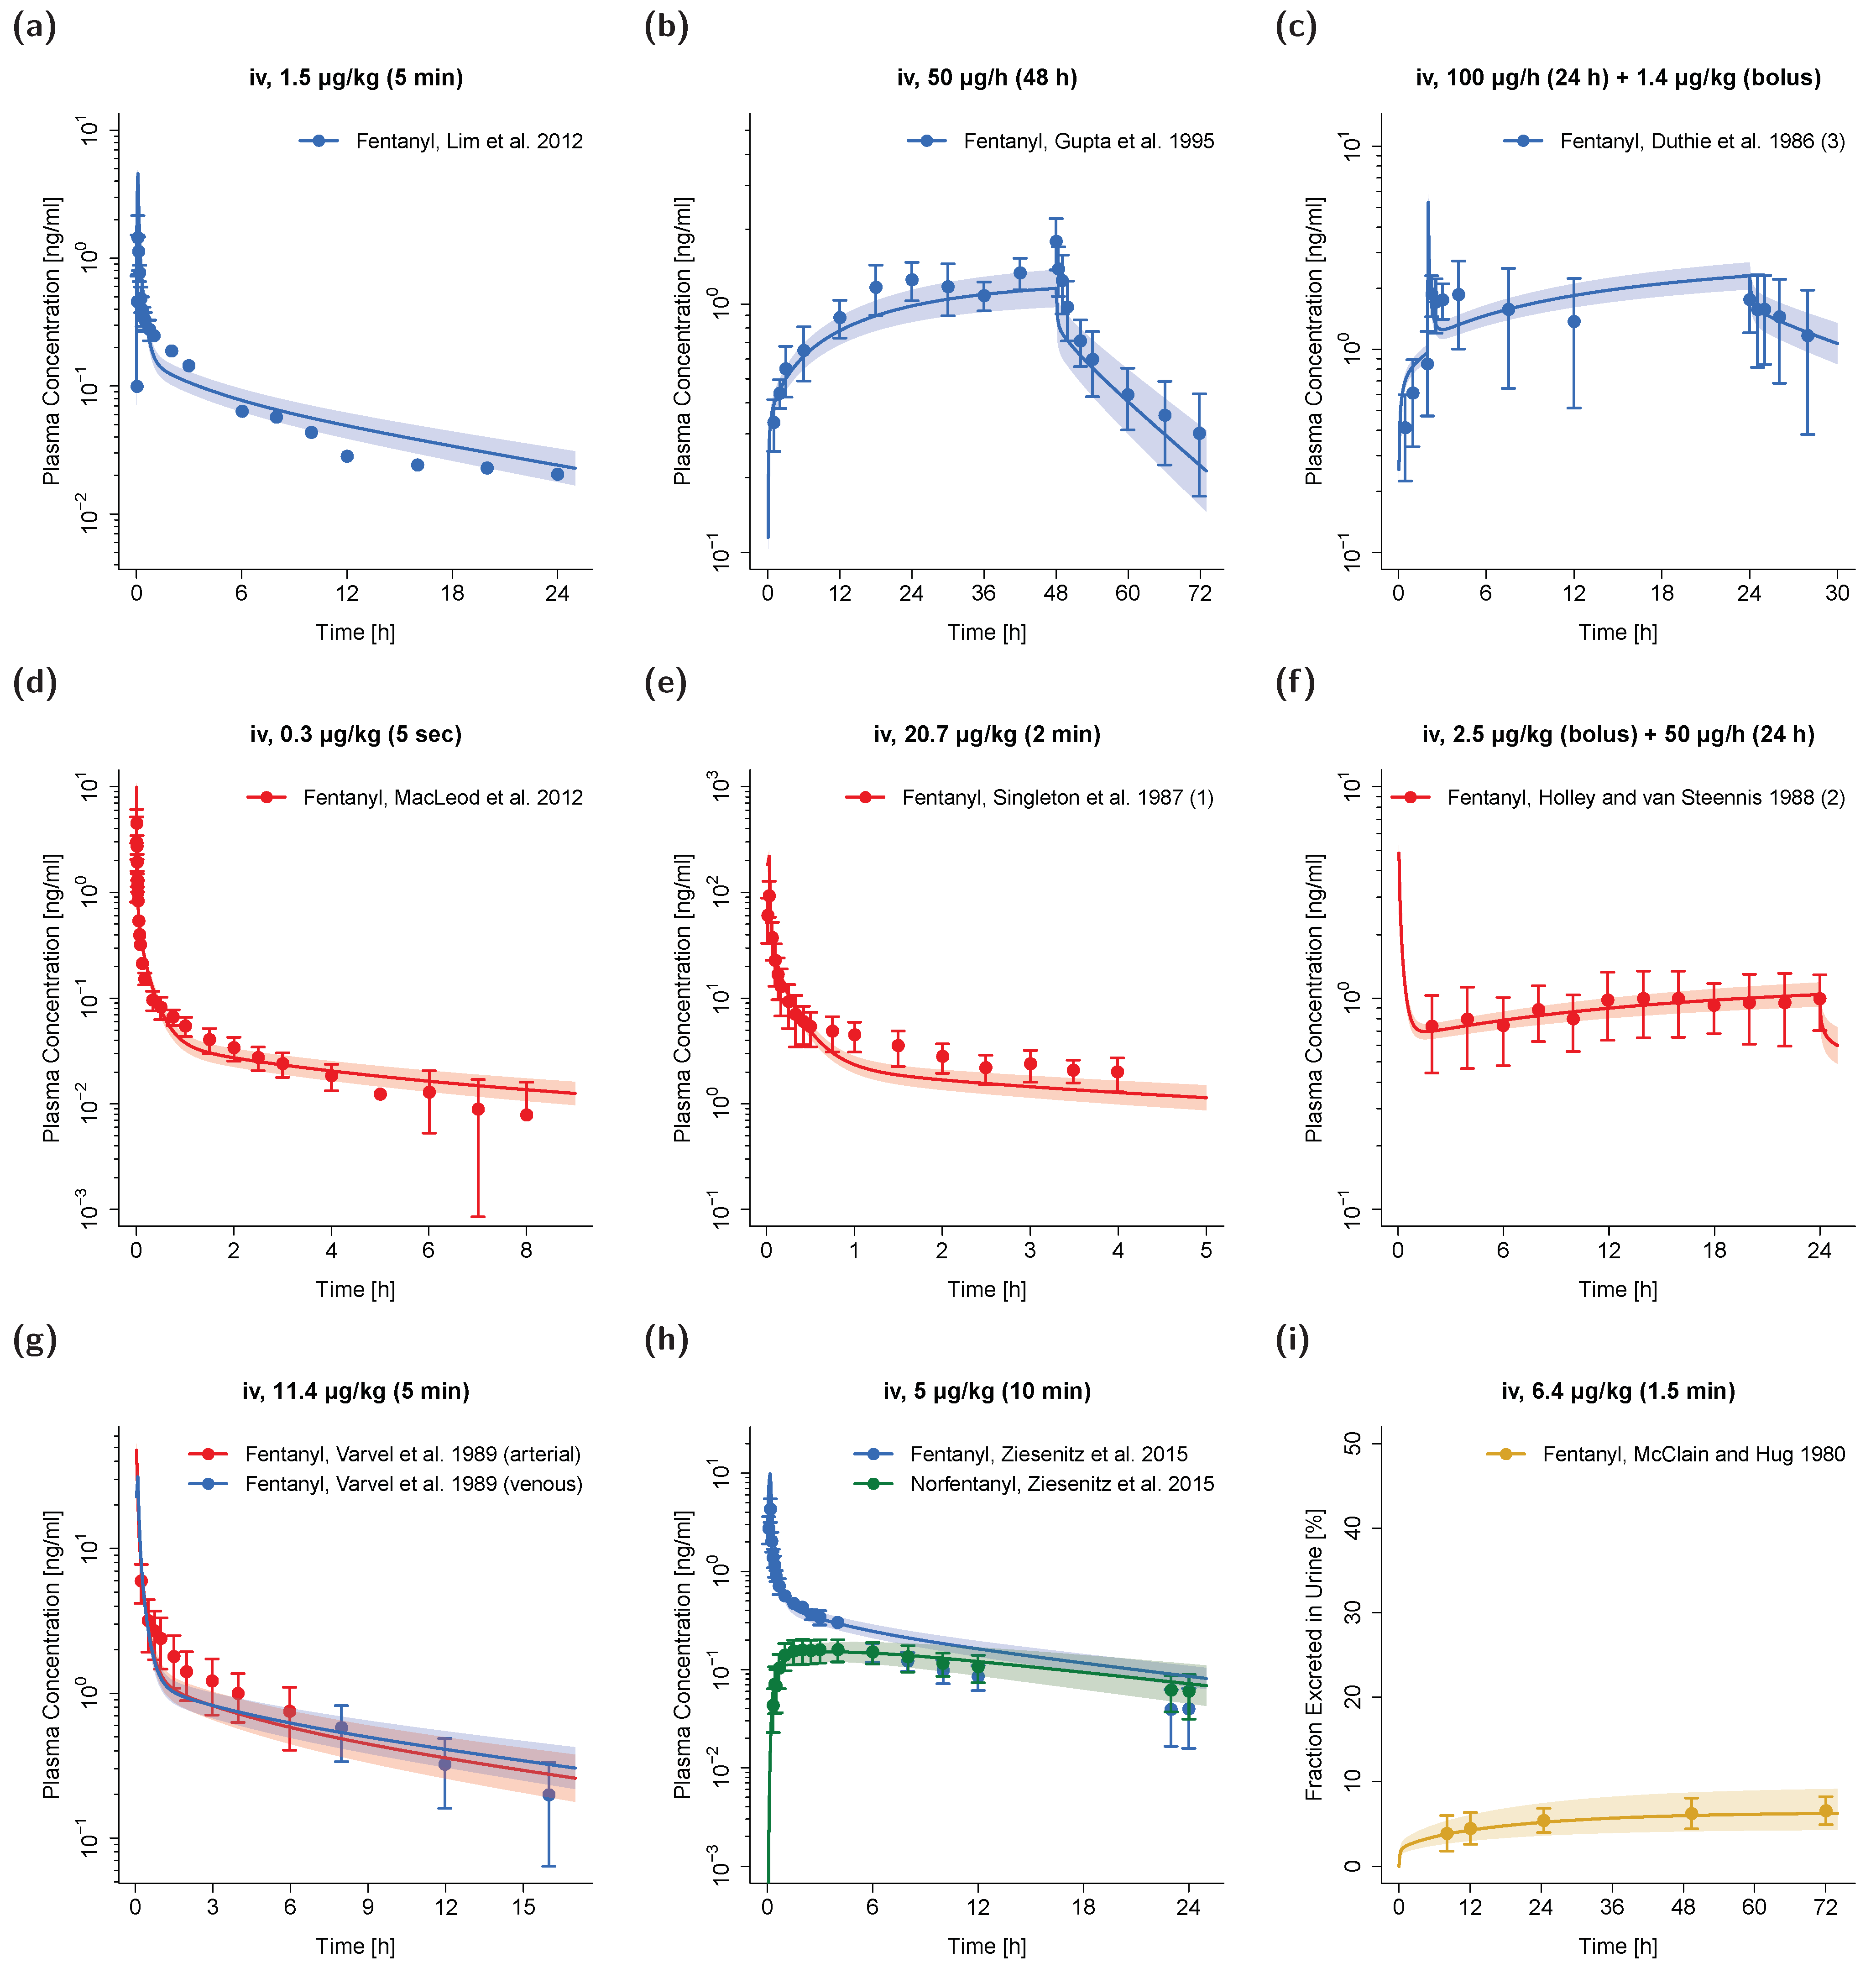
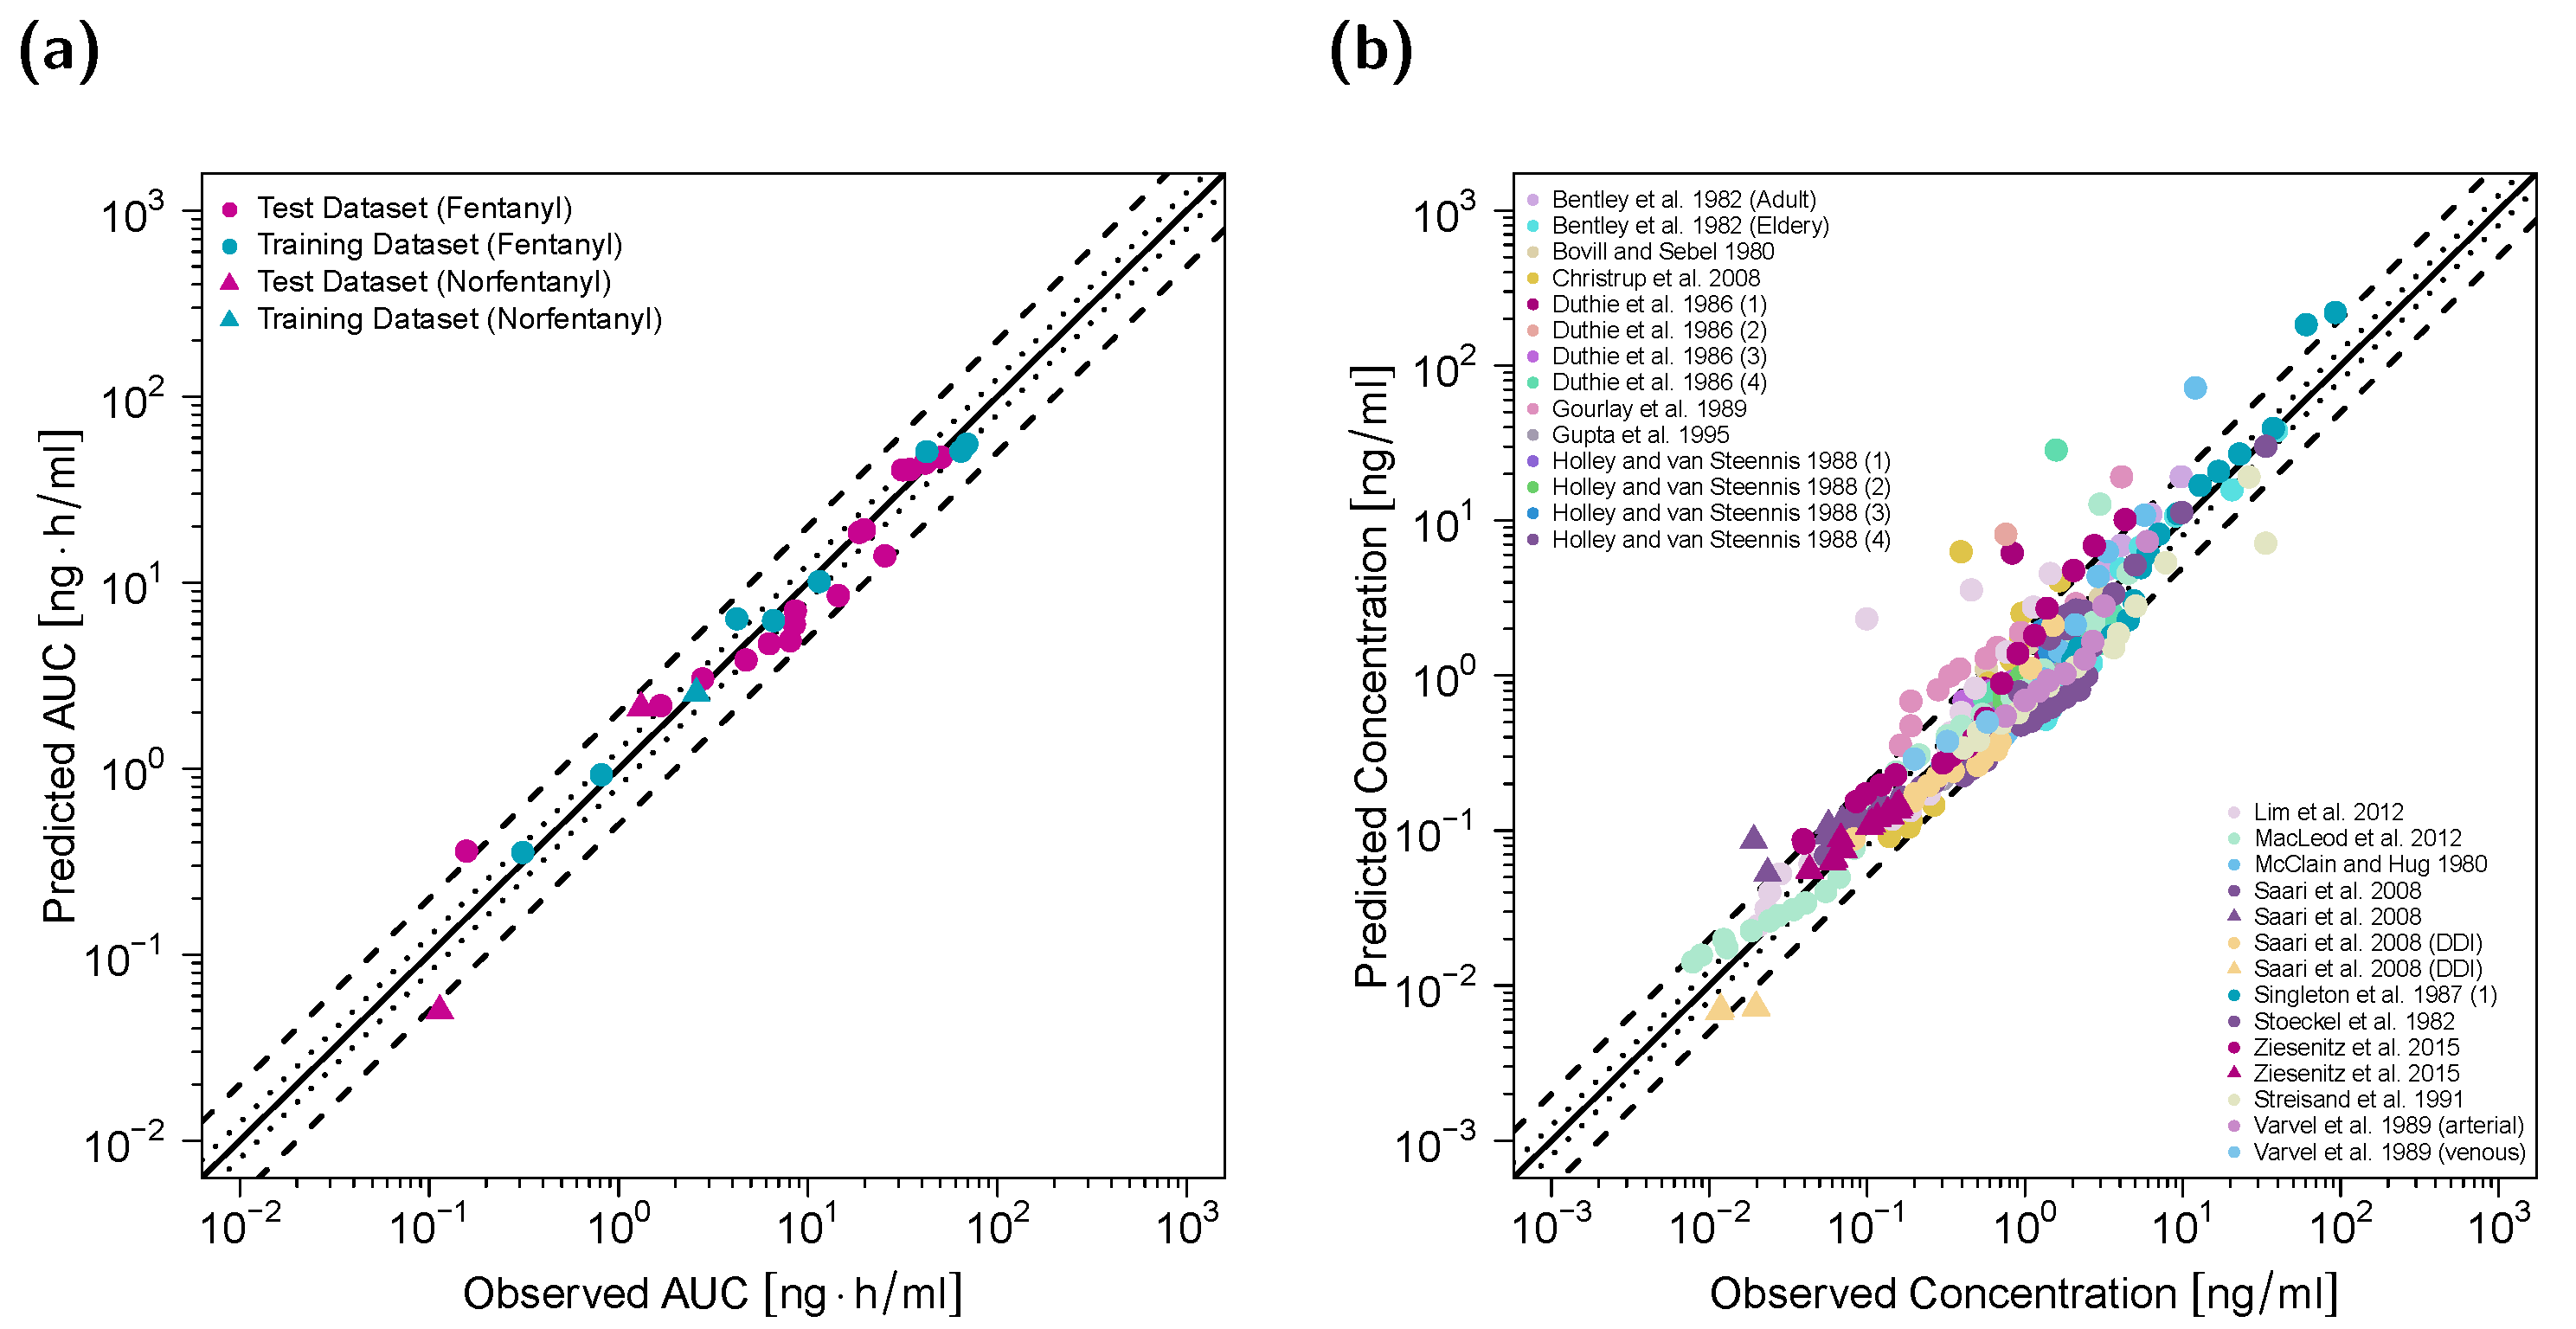
3.2. Adult PBPK Model Building and Evaluation

A whole-body adult PBPK model of fentanyl and its metabolite norfentanyl was built and comprehensively evaluated using arterial and venous plasma profiles as well as information on fraction of fentanyl dose excreted unchanged in urine. Model-predicted population profiles are compared to the corresponding study data in Figure 1 (selection of profiles from the training and test dataset) and in detail in Section 3.1 in the Supplementary Materials (all simulated studies, both on a semilogarithmic and linear scale). Simulated plasma profile trajectories of fentanyl for bolus/short-infusion administrations as well as long-term infusions are in close concordance with observed data. This holds true for both fentanyl venous and arterial blood plasma concentrations as well as for venous norfentanyl plasma concentrations.
Goodness-of-fit plots of predicted versus observed AUClast values and of predicted versus observed plasma concentrations are shown in Figure 2. Twenty-six out of 28 predicted AUClast values (~93%) fell within the 2-fold acceptance criterion with an overall GMFE of 1.30. One AUClast outside the 2-fold range was calculated for a venous fentanyl profile, which covered only the first 20 min after a fentanyl bolus administration [45]. The second outlier was calculated for a venous norfentanyl profile with observed norfentanyl concentrations close or below the lower limit of quantification (LLOQ) [6]. The MRD value for all plasma concentration simulations for the adult PBPK model was 1.77 with ~86% of all simulated plasma concentrations falling within 2-fold of the corresponding concentration observed. Detailed results on MRD values and AUC ratios calculated for all studies and results of the sensitivity analysis are presented in Sections 3.4–3.6 of the Supplementary Materials.
While the implemented unspecific hepatic clearance is responsible for approximately 60% of fentanyl elimination, the metabolism of fentanyl to norfentanyl via CYP3A4 and CYP3A7 covers approximately one-third of fentanyl elimination in the PBPK model. The urinary excretion is accountable for only a minor fraction of fentanyl elimination (~7%). Figure 3 shows a structural overview of the implemented elimination processes of fentanyl and norfentanyl as well as a structural overview of the PBPK model. Drug-dependent parameters of the final PBPK model are shown in Table 3. For detailed information including system-dependent model parameters, see Section 1 of the Supplementary Materials.

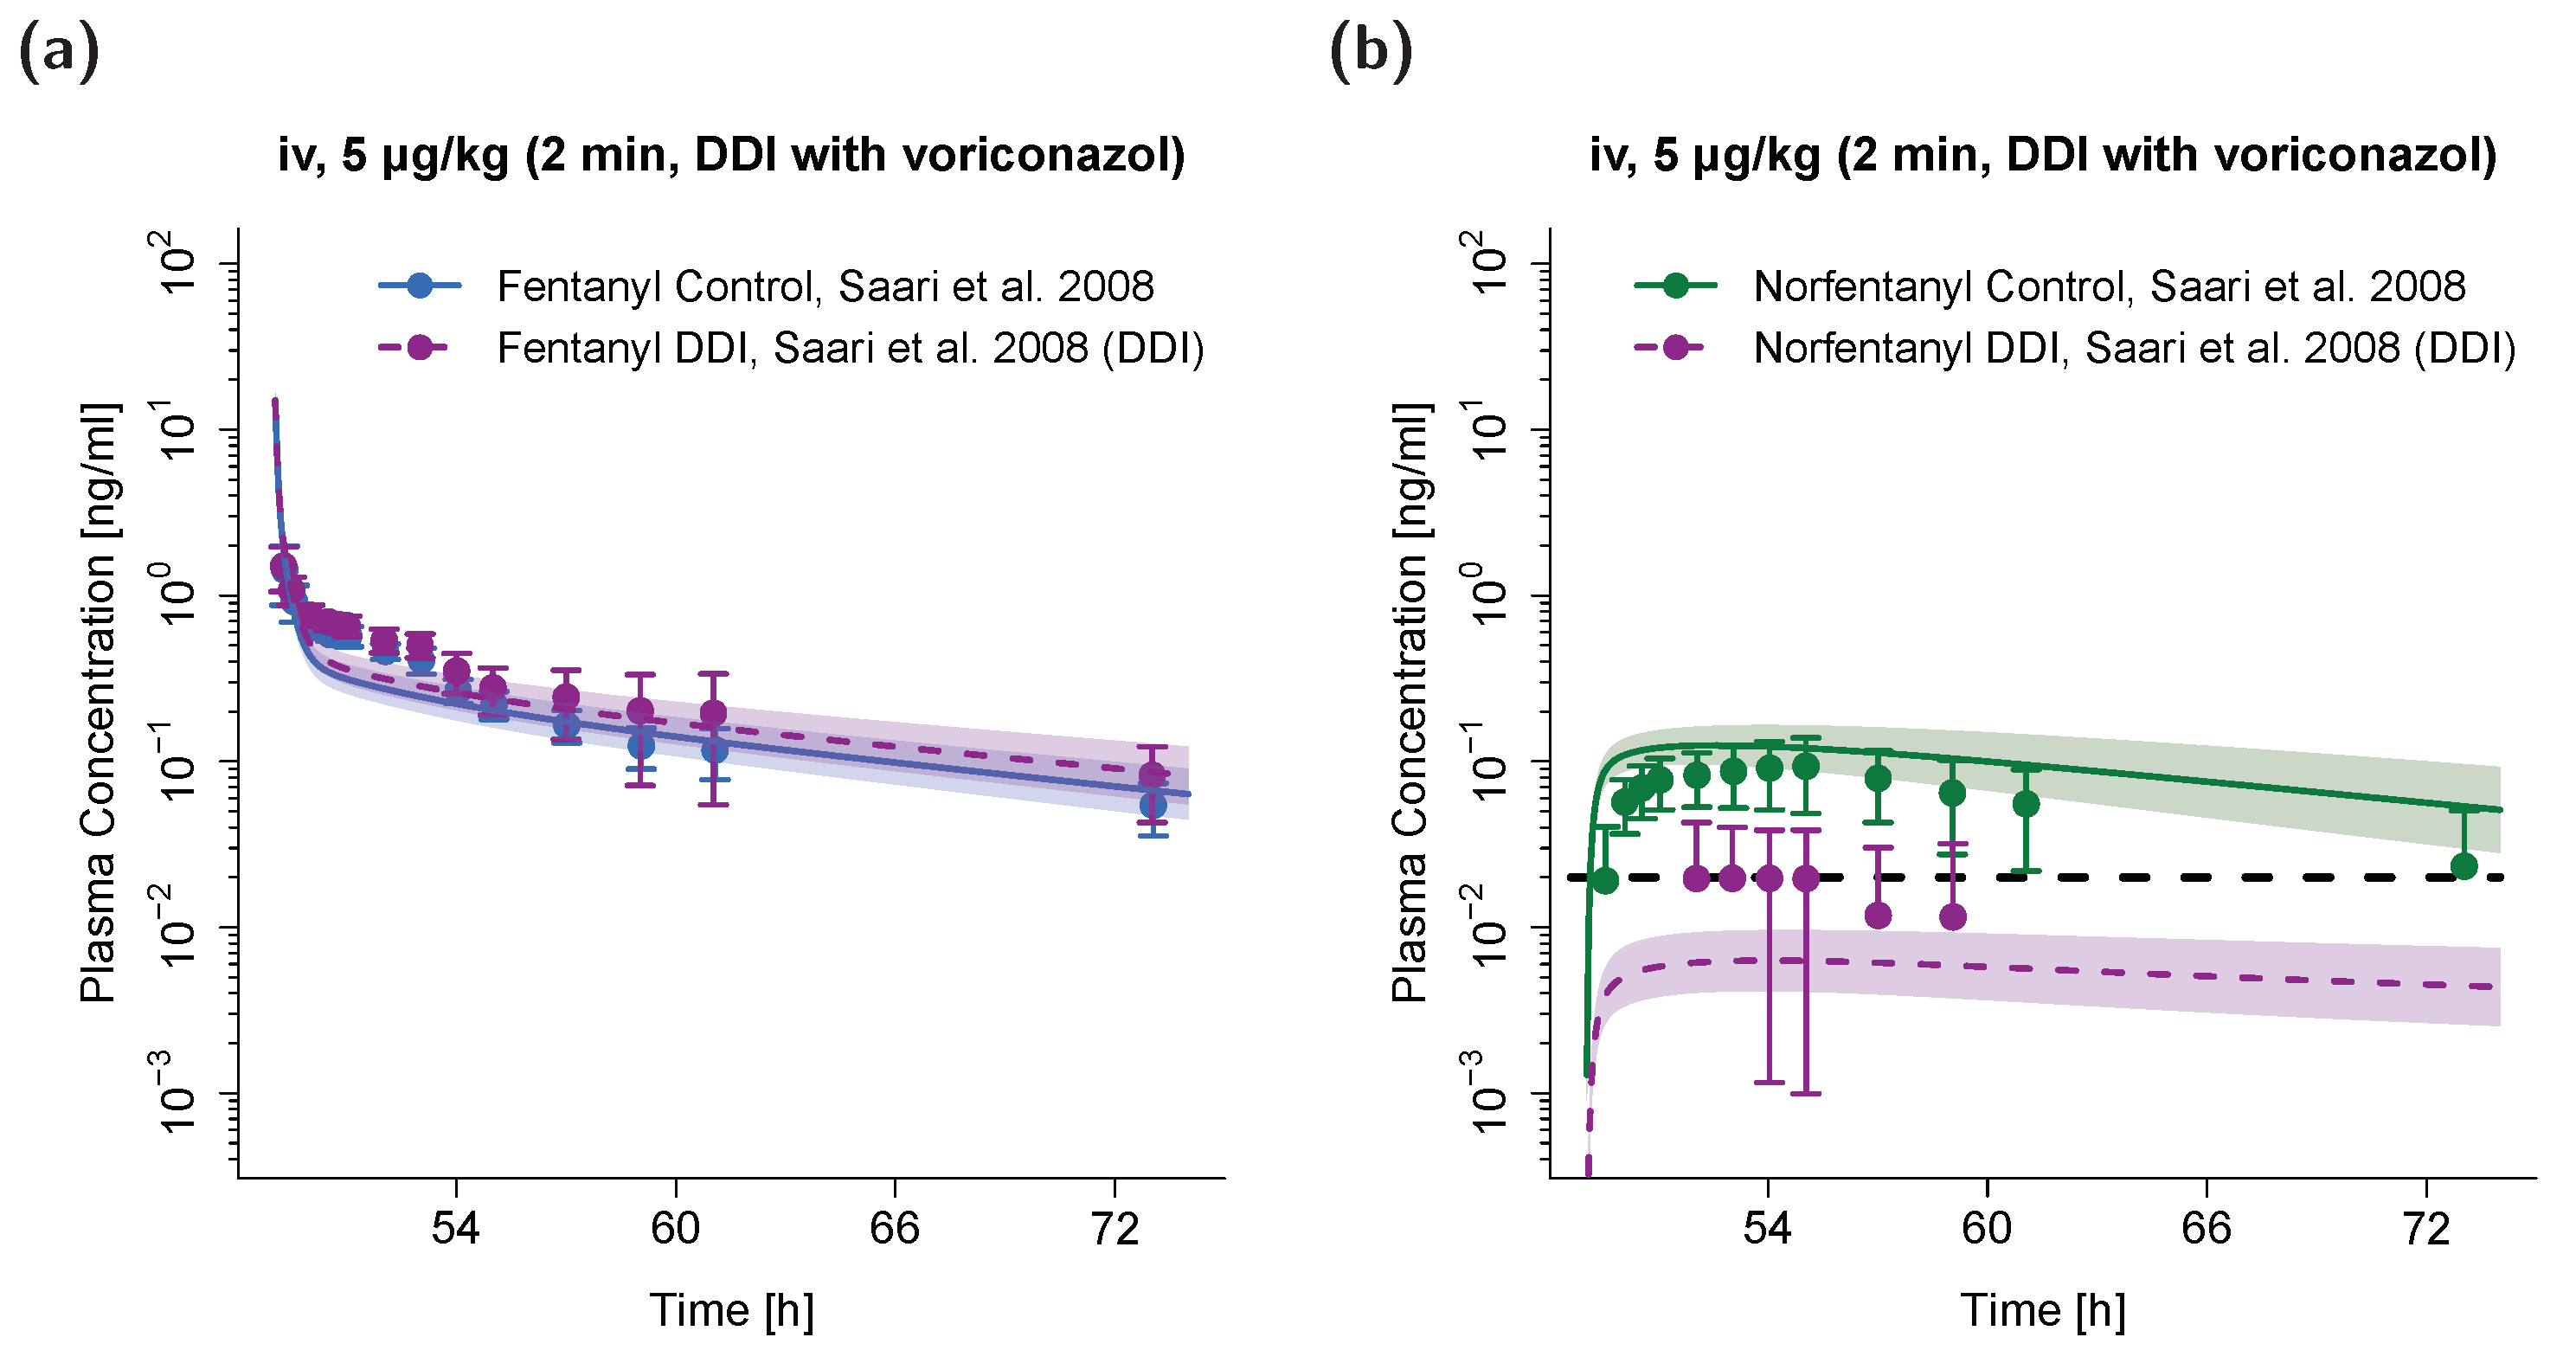
3.3. PBPK DDI Modeling

The adult PBPK model was used to predict a DDI scenario of fentanyl with concomitant administration of voriconazole. The simulated plasma concentration–time profiles are compared to the corresponding profiles observed from a clinical DDI study [6] in Figure 4. Here, a slight decrease in fentanyl AUC can be observed when simulating fentanyl administration with concomitant voriconazole compared to simulation of sole fentanyl administration. The corresponding predicted AUCratio (AUCinhibition, predicted/AUCcontrol, predicted = 1.22) and observed AUCratio (AUCinhibition, observed/AUCcontrol, observed = 1.33) were very similar. A strong relative decrease in norfentanyl AUC can be observed when simulating fentanyl administration with concomitant voriconazole compared to simulation of sole fentanyl administration. The predicted AUCratio for norfentanyl was 0.02 and the observed AUCratio 0.09. It should be noted that all observed plasma concentrations for norfentanyl during concomitant voriconazole administration were very close to or below the specified LLOQ (black dashed line in Figure 4b) [6].

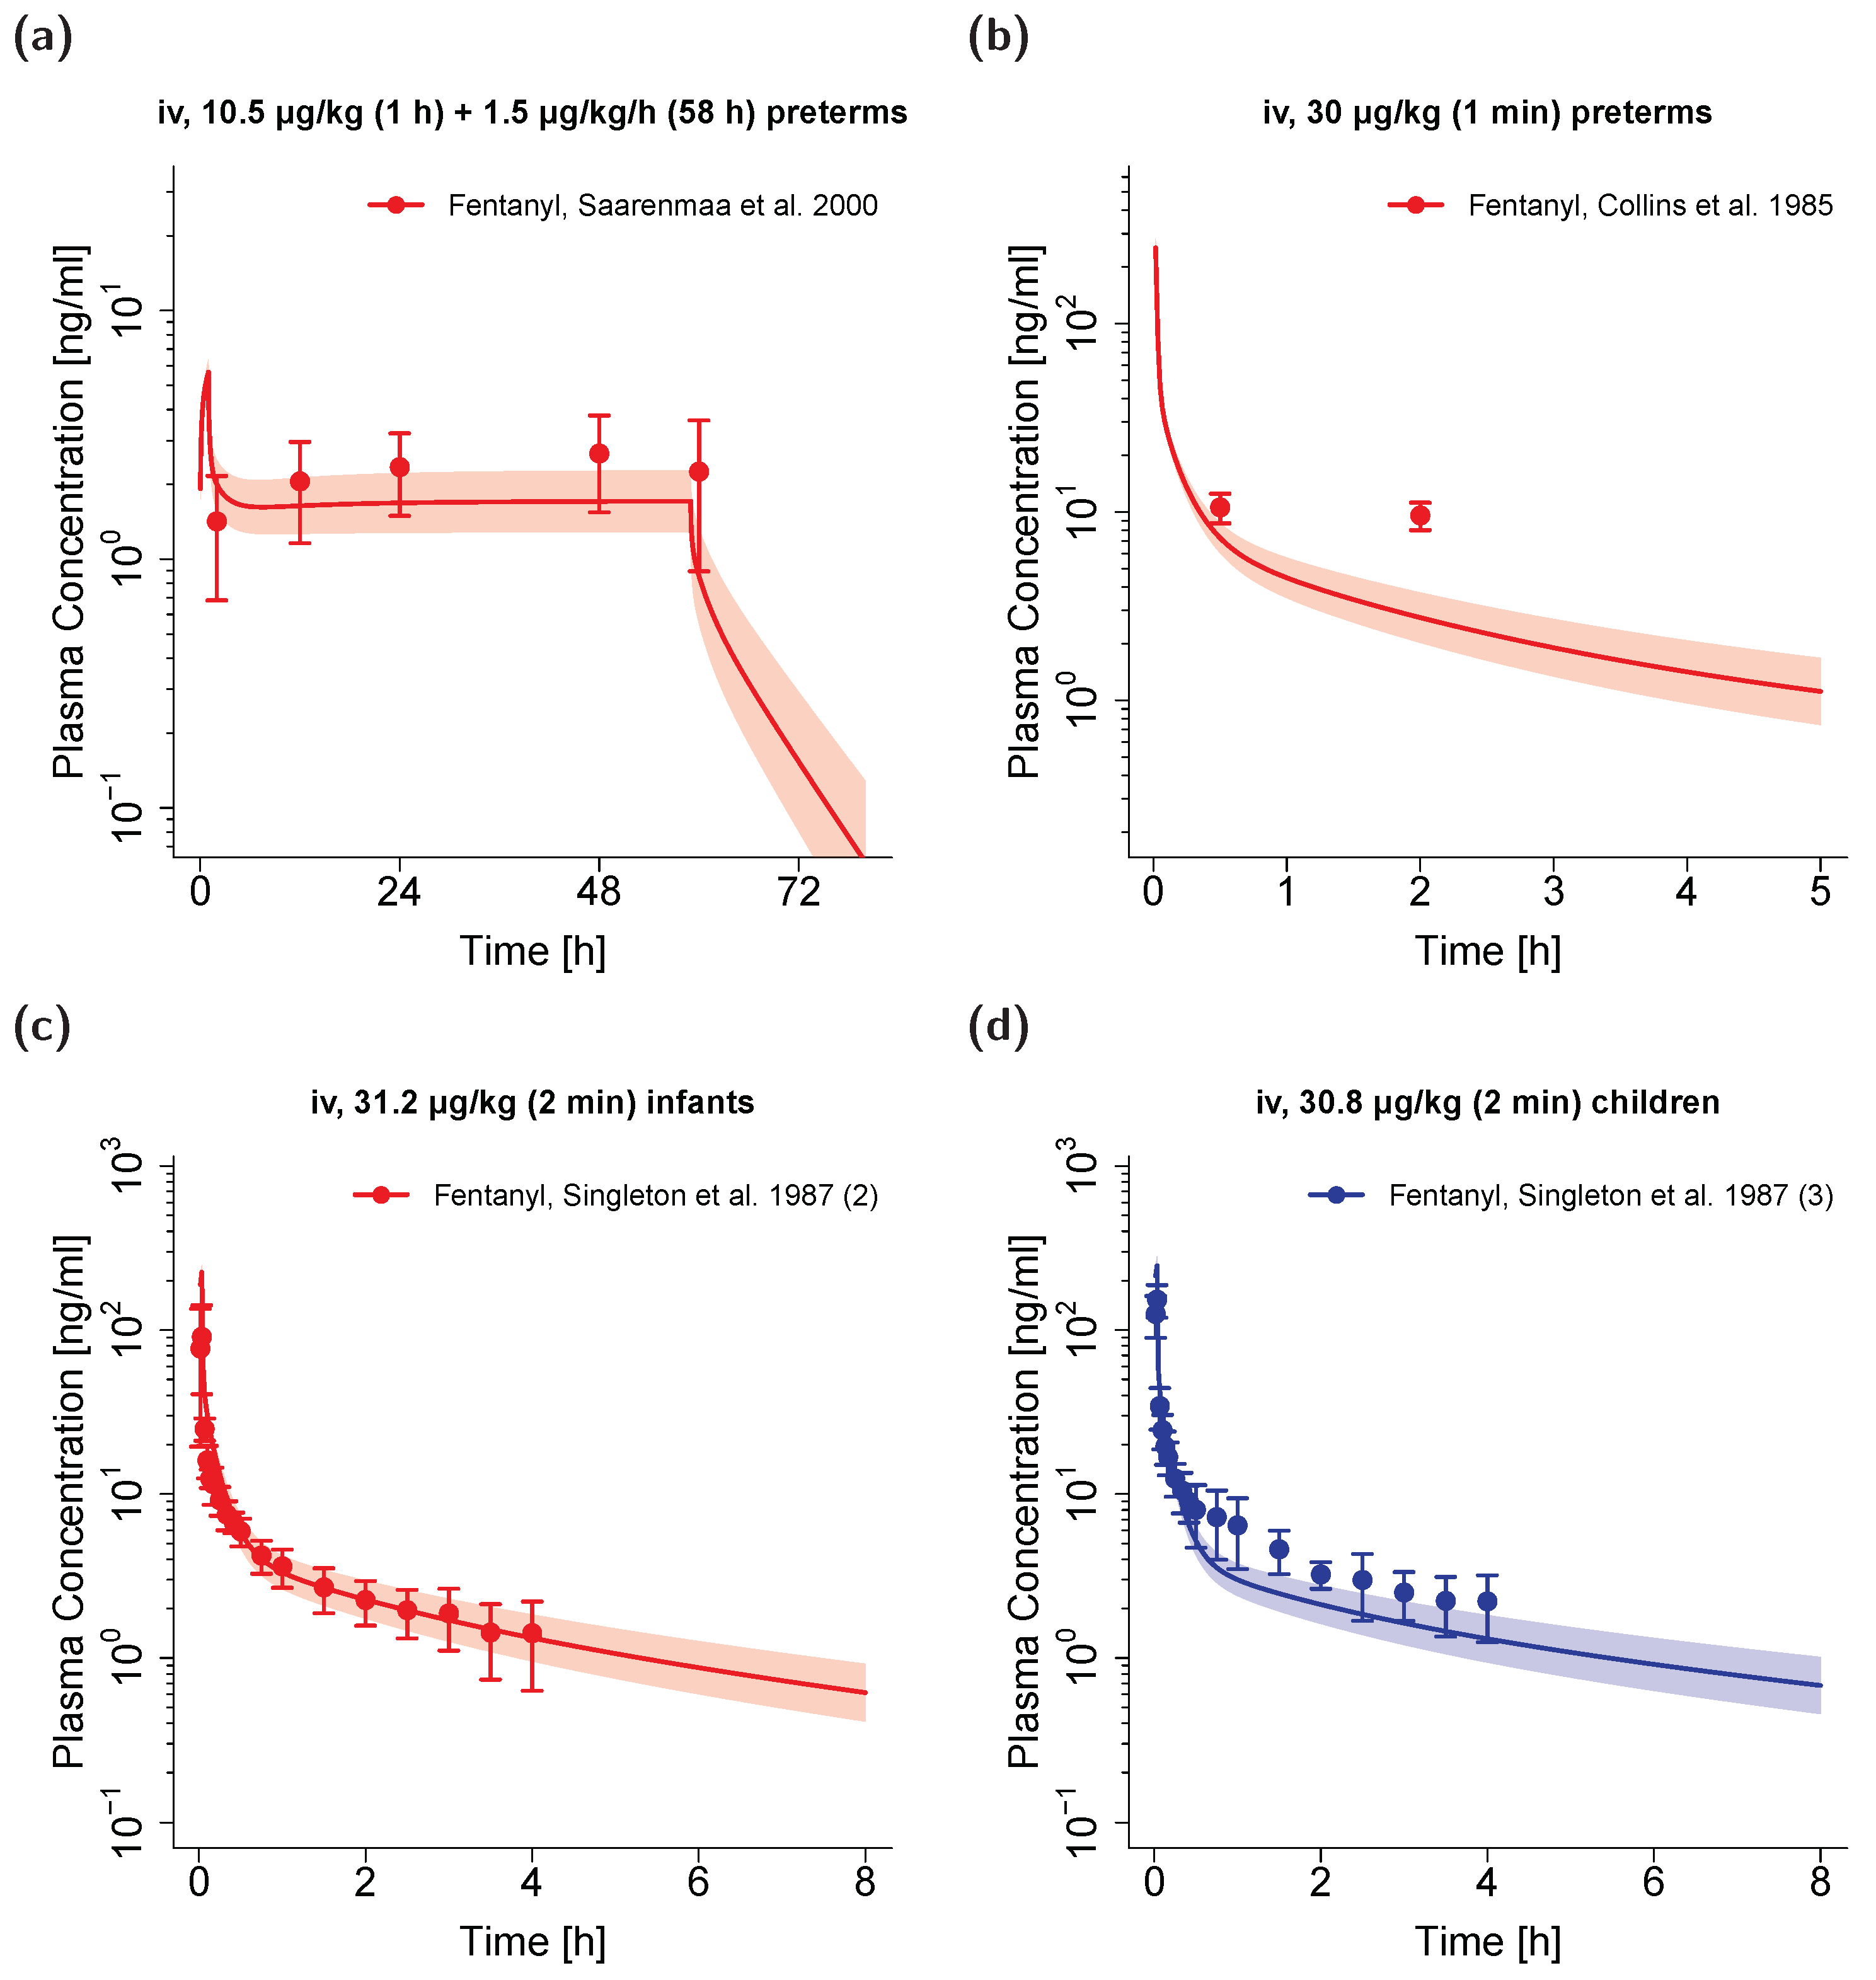
3.4. Pediatric PBPK Model Building and Evaluation

The adult PBPK model was extrapolated to pediatric populations with mean ages ranging from 32 weeks gestational age in a preterm neonate population up to 2.9 years in a population of young children. In total, plasma concentration–time profiles and clearance values were predicted and compared to observed data for pediatric mean populations and individuals from five different clinical trials.
The scaled unbound fraction of fentanyl resulted in values from 29% for the 2.9-year-old pediatric population to 33% in the preterm neonate populations. This range is in concordance with the measured unbound fentanyl fraction values in pediatrics from the literature (23–38%) [35,64,65]. All other drug-dependent parameters were fixed to the values of the adult PBPK model. Comparison of predicted and observed plasma concentration–time profiles are shown in Figure 5 (semilogarithmic, selection of plots) and in Section 3.2 of the Supplementary Materials (all plots, both linear and semilogarithmic).
The predicted and observed plasma concentrations as well as AUClast values are compared in goodness-of-fit plots in Figure 6, with 87.5% of AUClast predictions located within the 2-fold range of the respective observed values and a GMFE of 1.38. Overall, MRD for plasma concentration predictions in pediatrics was calculated to be 2.03. A detailed overview of all MRD and GMFE values for pediatric predictions can be found in Tables S4 and S5 in the Supplementary Materials.
Individual clearance values were predicted and compared to the corresponding values observed from three clinical trials (see Table 2). Here, 72% of the predicted individual values (Figure 7a,b) and 100% of mean values (Figure 7b) are located within the 2-fold range of the corresponding observed values.

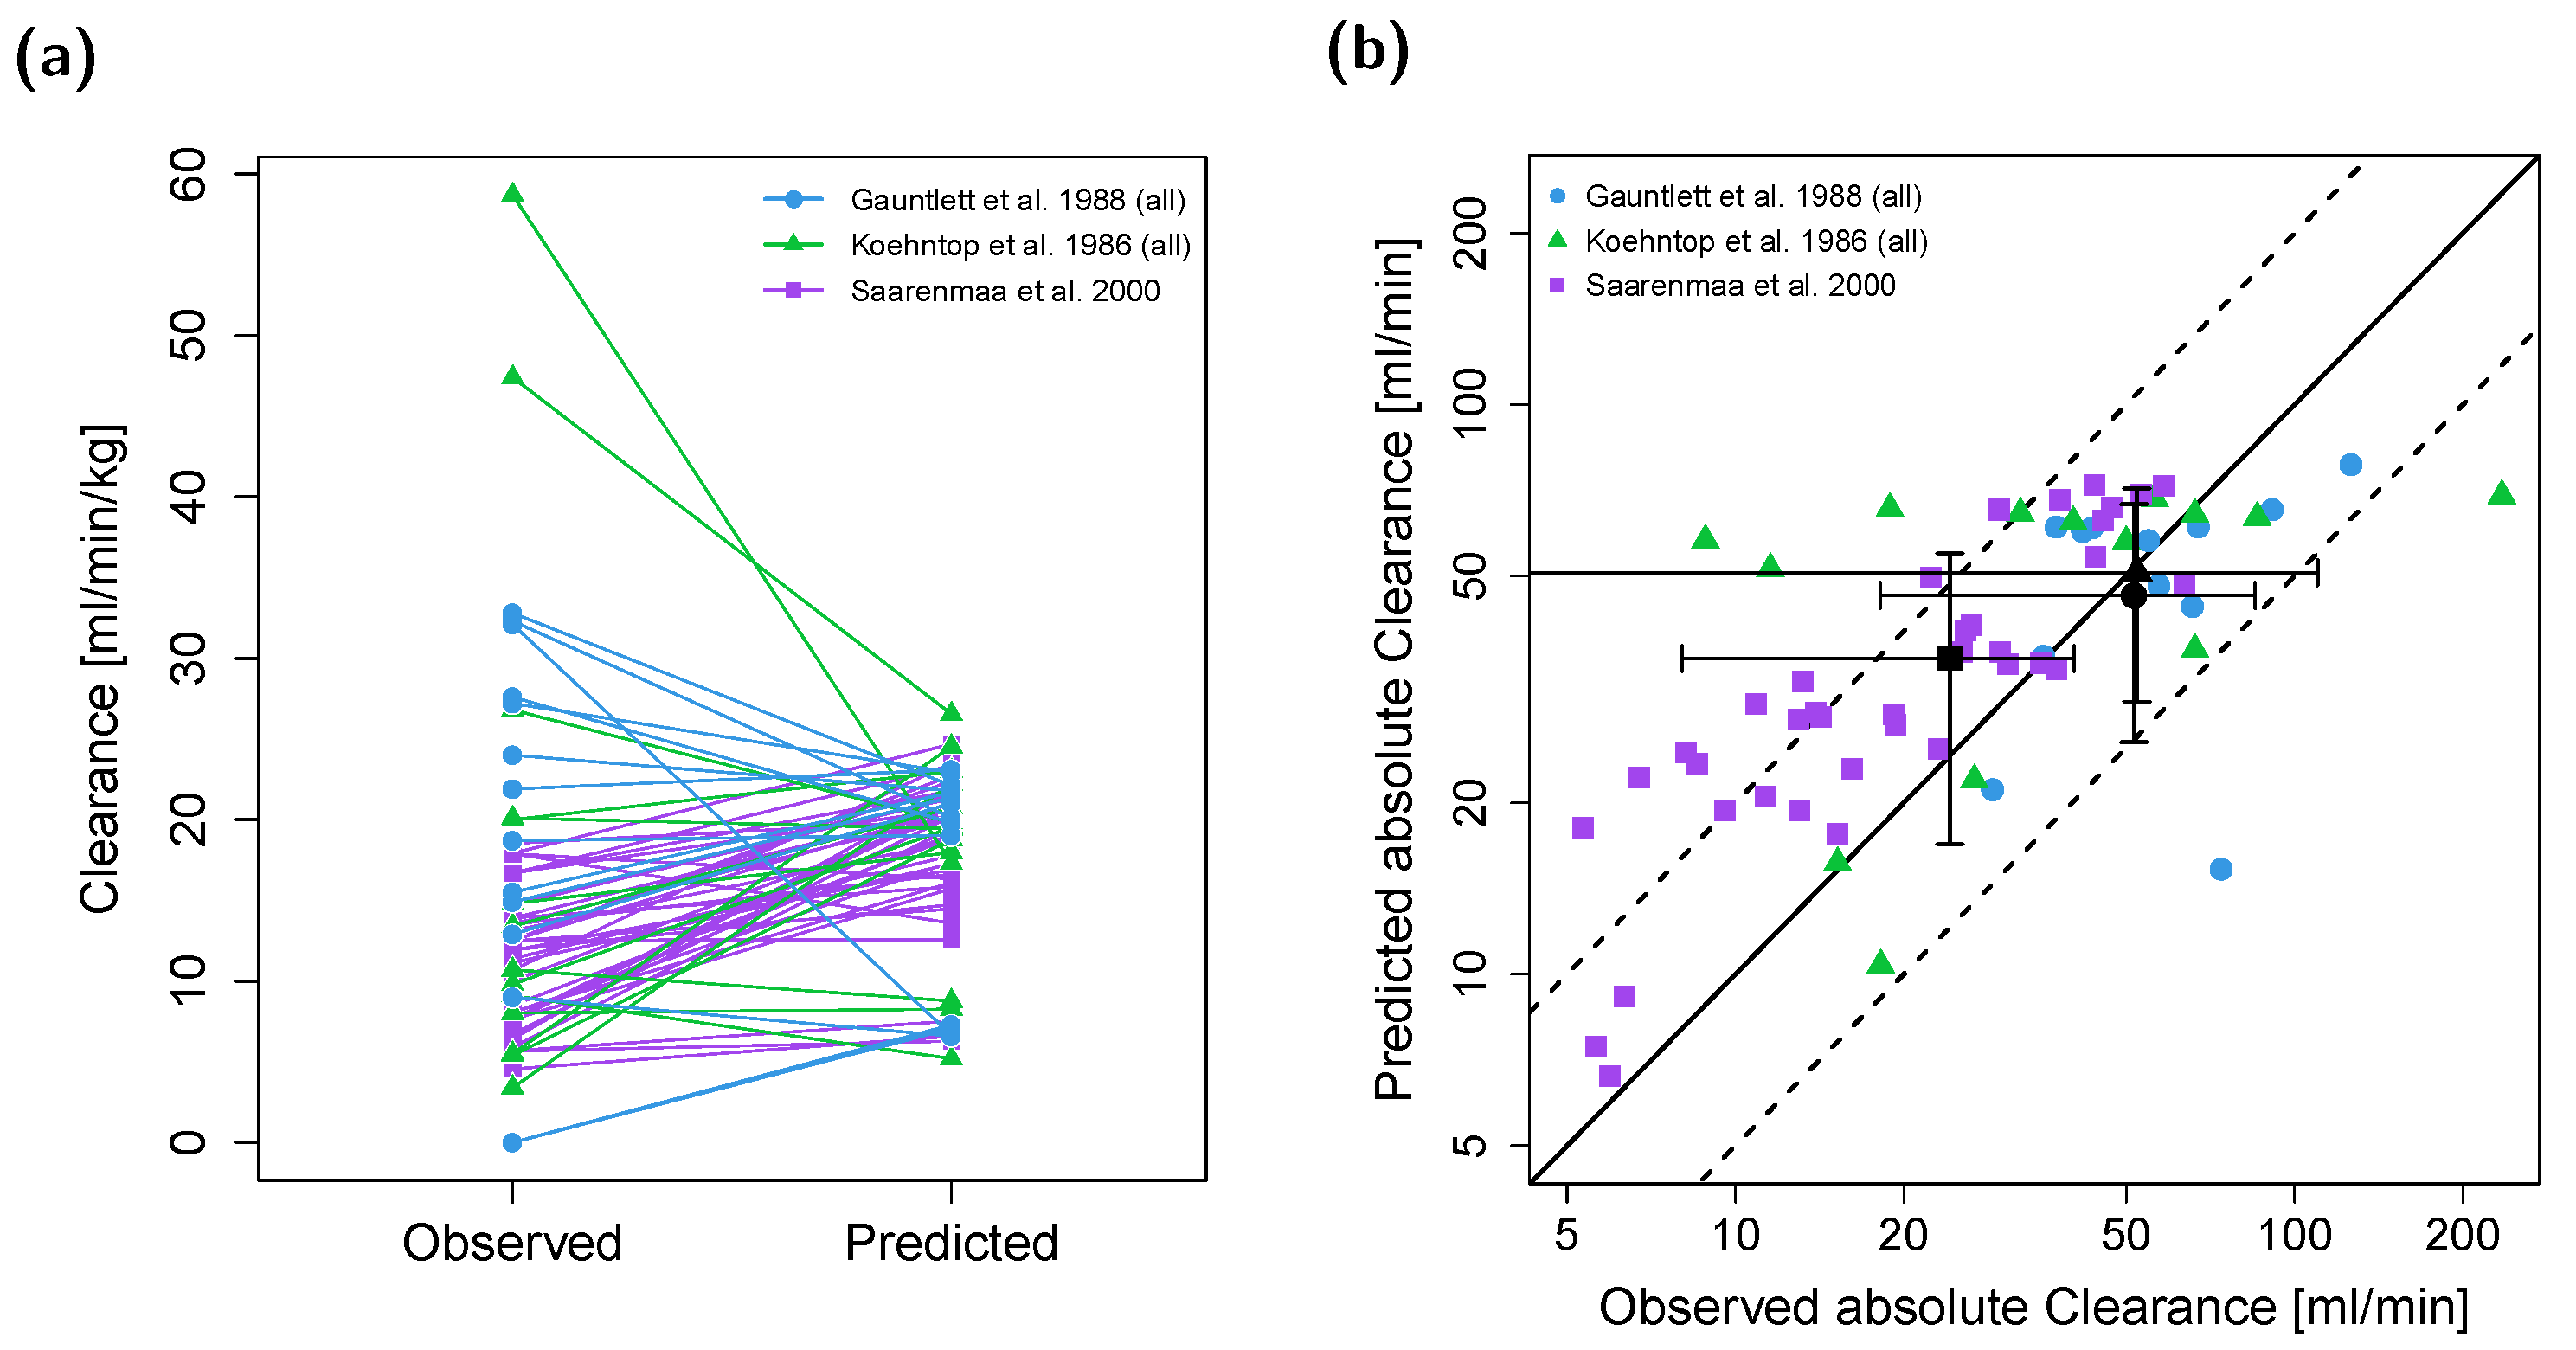
3.5. Clearance in Neonates with Increased Intraabdominal Pressure

In studies by Gauntlett et al., Koehntop et al. and Saarenmaa et al., several neonates, who had abdominal surgery, showed a significantly reduced fentanyl clearance [36,37,38] and four corresponding individual plasma profiles were presented in the respective studies [36,37]. The authors hypothesized that the decreased clearance might be due to an increased intraabdominal pressure resulting in a decreased hepatic clearance [36,37,38]. Hence, the four observed plasma profiles were digitized and used to estimate decreased clearance values for the CYP3A4, CYP3A7 and unspecific hepatic clearance pathways for each individual. This resulted in a mean reduction in the metabolic clearance of ~83%. For detailed information see Section 1.2 of the Supplementary Materials. The resulting four individual plasma profiles are displayed in Figures S5 and S6 in the Supplementary Materials.

4. Discussion

A whole-body PBPK model of fentanyl for adults has been built and evaluated by describing and predicting arterial (fentanyl) and venous (both fentanyl and norfentanyl) plasma concentration–time profiles as well as fractions of fentanyl dose excreted unchanged in urine following intravenous fentanyl administration. The utilized dataset comprised a wide dose range (0.3–60 µg/kg) including administrations ranging from an intravenous bolus to a 48-h continuous infusion. Following comprehensive evaluation, the adult PBPK model was applied to successfully predict a DDI scenario with voriconazole and was scaled to pediatric populations. Plasma concentration–time profiles and clearance parameters in pediatric patients were predicted with the extrapolated pediatric PBPK model and compared to observed data from five different clinical trials. The descriptive and predictive performance of the PBPK models has been demonstrated by (1) comparison of simulated to observed plasma profiles and clearance parameters, (2) the respective goodness-of-fit plots, (3) the calculation of MRD values as well as (4) the comparison of predicted to observed AUClast values including the calculation of the respective GMFE.
The adult PBPK model predicts the fraction of fentanyl dose metabolized to norfentanyl of ~33% and the fraction of fentanyl eliminated via an unspecific hepatic clearance of ~60% (hereinafter called “extra-norfentanyl metabolic pathway”). These findings are supported by the prediction results of the DDI study with the CYP3A4 inhibitor voriconazole as a perpetrator drug. Moreover, the fraction of fentanyl dose excreted unchanged in urine was calculated to be ~7%. While fraction excreted in urine is perfectly in accordance with the literature [5,40,41], reports about the fraction of fentanyl metabolized to norfentanyl are divergent. In vitro studies with liver microsomes from the 1990s suggested that metabolism to norfentanyl plays the major role in fentanyl elimination—mainly via CYP3A4 with little contribution of other CYP enzymes [4,27]. Yet, an in vivo DDI crossover study from 2015 showed that concomitant administration of the CYP3A4 and P-gp inhibitor ketoconazole significantly reduced norfentanyl AUC to 24% but increased fentanyl exposure by only ~33% [5]. This strong inhibition of norfentanyl production during ketoconazole treatment supports the assumption of a major involvement of CYP3A in norfentanyl formation [5]. However, Ziesenitz et al. calculated the metabolic clearance of fentanyl to norfentanyl to account only for ~23% of the systemic clearance and concluded that currently unknown metabolites exist [5]. With a fraction of fentanyl metabolized to norfentanyl of approximately one-third, our study supports the theory of an extra-norfentanyl metabolic pathway and currently unknown metabolites. The fact that ritonavir, a drug which interacts with numerous metabolizing enzymes and transporters, had a much more profound effect on fentanyl exposure (AUC increase by ~170%) than ketoconazole provides additional support for the involvement of other elimination pathways in addition to CYP3A4 [66]. It needs to be noted that, in this PBPK model, the extra-norfentanyl metabolic pathway was implemented as an unspecific clearance in the liver, but could also be located at various different sites. Further studies need to be conducted to investigate the characteristics of an extra-norfentanyl elimination pathway.
PBPK modeling permits rational scaling between adult and pediatric patients by defining the PK of a drug as a function of anatomy, physiology and biochemistry and successful applications have recently been shown in different modeling efforts [21,22,23]. This study demonstrates the applicability of PBPK modeling to predict both clearance values as well as plasma concentration–time profiles and the corresponding AUCs for the analgesic drug fentanyl for preterm neonates to up to 3-year-old children within a whole-body PBPK framework. Here, 87.5% of AUClast predictions and 100% of predicted population mean clearances were within 2-fold of the respective values observed. The predicted to observed mean clearance ratios (CLpredicted/CLobserved) for the three included clinical trials were 0.97 and 0.90 for the full-term neonate populations and 1.48 for the preterm neonate population. However, as individual fentanyl PK is highly variable [1,37], prediction of individual plasma profiles and clearance values remains challenging. The model predicted 47 of 65 individual clearance values within 2-fold range based on information on weight and age (chronological and gestational if available). The presented ladder plot (Figure 7a) depicts noticeable mispredictions for some clearance values. This might be attributed to unknown individual CYP3A4, CYP3A7 and P-gp expressions as well as heterogeneity for the unbound fraction, which all exhibit high interindividual variability [32,33,35]. In the model, mean values for enzyme and transporter expressions as well as the unbound fraction were assumed for individual clearance simulations.
As it remains unknown which physiologic elimination pathways the unspecific hepatic clearance covers, no ontogeny information regarding this elimination process was available. Hence, it needs to be noted that the rate constant of this clearance process was not scaled in the model. While the overall reasonable predictive performance of the PBPK scaling supports this approach, the overpredicted clearance values as well as the underprediction of plasma profiles for the preterm neonate population (see Figure 5a,b) could indicate that the unspecific hepatic clearance is less pronounced in preterm neonates. Certainly, these effects could also be mediated by other factors such as the impact of concomitant comedication or the influence of surgery on the PK of fentanyl.
Increased intraabdominal pressure can occur during abdominal surgery [37,67]. This might substantially decrease hepatic blood flow and eventually lead to a reduced fentanyl clearance [36,37,67]. In the PBPK model simulations, the clearance reduction for neonates with abdominal surgery and increased intraabdominal pressure (mean reduction in the metabolic clearance of ~83%) [36,37,38] showed an overall improvement of predictions. However, it should be noted that not all infants who had abdominal surgery showed a decreased clearance [36,37]. More research is required to further investigate the impact of abdominal surgery and intraabdominal pressure on the PK of fentanyl.
In most clinical scenarios, the administration of fentanyl leads to a desired analgesic and sedating effect, which, among others, usually results in an improvement of respiratory function [7,8]. However, in rare cases, fentanyl might cause a rigidity affecting the respiratory musculature, which can lead to chest wall rigidity—an ADR in pediatric as well as adult populations [1,8]. Albeit commonly assumed that chest wall rigidity occurs with rapid fentanyl administrations of high doses, Dewhirst et al. showed that the ADR may result from doses as low as 1 µg/kg, mostly from bolus injections lasting less than 15 s (15 of 21) [8]. Simulations with the developed PBPK model in neonates show a large difference in peak arterial plasma concentrations (Figure 8) after bolus injection (1 µg/kg, Cmax: 27.1 ng/mL), 2-and 4-min infusions (1 µg/kg, Cmax: 6.3 and 3.7 ng/mL, respectively), and even a 3 µg/kg 4 min infusion (Cmax: 11.2 ng/mL).
These large differences of up to 7-fold peak concentrations might partly explain the more frequent occurrence of chest wall rigidity during bolus administration of fentanyl. However, the impact of the high interindividual variability [1,37] should not be disregarded, which might explain the occurrence of the ADR in other case reports with longer infusions [8].
Previous modeling efforts on fentanyl neither included the metabolite norfentanyl nor predicted DDI scenarios [13,14,15]. Consequently, the fraction of fentanyl metabolized to norfentanyl could not be assessed. Moreover, scaling the PBPK models to pediatric subpopulations in order to predict plasma profiles and clearance values was not part of the scope of the above-mentioned PBPK modeling studies.
Some limitations of the model should be discussed. As no information about the blood-to-plasma ratio in the different pediatric populations was available, the literature value of 0.87 was assumed to be age-independent. However, since the unbound fraction changes age-dependently [34,35,65], the blood-to-plasma ratio could also differ in pediatric compared to adult patients. This could be one of the reasons for some deviations when predicting the plasma concentration–time profiles.
Moreover, measurements of norfentanyl plasma concentrations were scarce and only available in clinical studies with adults for PBPK model building and evaluation [5,6]. Hence, PBPK model simulations for norfentanyl were only evaluated in this population and should be interpreted with these limitations in mind.
The impact of the metabolic process of CYP3A7 in our PBPK model on fentanyl AUCs was negligible, as shown in the local sensitivity analyses. Solely in PBPK model simulations for neonates, the CYP3A7 elimination process had a small impact. However, as no in vitro studies investigating CYP3A7 metabolism of fentanyl with information on the maximum reaction velocity and Michaelis–Menten constant were available, this process needs further investigation.
The ontogeny function for P-gp was adapted from a recent publication [33]. However, the ontogenetic information might need further evaluation since the peptides quantified by the used liquid chromatography–tandem mass spectrometry technique are not only formed from active P-gp but also by splice variants as well as non-glycosylated and truncated proteins [33,68,69].
Many of the PK samples in the analyzed studies were taken during different surgical procedures with largely varying co-medications (e.g., atropine, isoflurane, pancuronium, succinylcholine, and thiopental) possibly affecting fentanyl plasma concentrations. Consequently, some differences in model-predicted and observed plasma concentrations and clearance values could be a result of the varying study conditions.
In addition to intravenous administration, fentanyl is also administered via the transdermal, sublingual and nasal routes [3]. In particular, the continuous administration of fentanyl with transdermal patches is an important analgesic treatment in diseases with chronic pain [70]. Transdermal fentanyl treatment is approved for opioid-tolerant adult patients as well as opioid-tolerant children over two years of age [2,71]. As a sustained-release formulation, transdermal patches can potentially reduce plasma concentration fluctuations, ADRs such as constipation and the risk for non-adherence [70]. Based on the good model performance, the fentanyl PBPK models developed in this analysis could be augmented to mechanistically model and simulate the delivery of fentanyl via more complex formulations, such as transdermal or sublingual vehicles [72].

5. Conclusions

A whole-body PBPK model of fentanyl and its metabolite norfentanyl has been developed to predict fentanyl and norfentanyl arterial and venous plasma concentration–time profiles as well as fentanyl urinary excretion after intravenous administration in adults. The model was further evaluated by predicting a DDI scenario with the CYP3A4 inhibitor voriconazole. The fraction of fentanyl metabolized to norfentanyl of ~33% has been predicted, supporting the idea of an extra-norfentanyl metabolic pathway. Subsequently, the adult PBPK model has been successfully scaled to preterm and full-term neonate, infant as well as child subpopulations for predictions of plasma profiles and clearance parameters. With that, we add confidence to the potential of PBPK modeling to predict the PK in pediatric patients. The models are publicly available in the OSP repository. Thereby, the models contribute to a library of PBPK models for predictions in other DDI scenarios, could help to develop models for sustained release from complex formulations, and support future investigations of fentanyl and norfentanyl PK both in adult and pediatric populations.

Supplementary Materials

The following are available online at https://www.mdpi.com/1999-4923/12/10/908/s1, Electronic Supplementary Materials: Additional model information including detailed model evaluation.

Author Contributions

Conceptualization, L.K., A.W., M.Z., B.M. and T.L.; funding acquisition, Y.K., R.B. and T.L.; investigation, L.K., A.W., D.S. and T.L.; methodology, L.K., A.W., D.S. and T.L.; visualization, L.K. and D.S.; writing—original draft, L.K., M.Z., B.M., D.S. and T.L.; writing—review and editing, L.K., A.W., M.Z., Y.K., R.B., B.M., D.S. and T.L. All authors have read and agreed to the published version of the manuscript.

Funding

This research was funded by the German Federal Ministry of Education and Research (BMBF), 031L0153 “Alternativmethoden zum Tierversuch” and 03XP0196 “NanoCare4.0–Anwendungssichere Materialinnovationen”. We acknowledge support by the Deutsche Forschungsgemeinschaft (DFG, German Research Foundation) and Saarland University within the funding program Open Access Publishing.

Acknowledgments

We thank Sebastian Dahmen for supporting this work during his internship at Saarland University.

Conflicts of Interest

Thorsten Lehr, Yvonne Kohl und Robert Bals have received research grants from the German Federal Ministry of Education and Research (BMBF). Lukas Kovar, Andreas Weber, Michael Zemlin, Bernd Meibohm and Dominik Selzer declare no conflicts of interest. The funders had no role in the design of the study; in the collection, analyses, or interpretation of data; in the writing of the manuscript, or in the decision to publish the results.

References

  1. Pacifici, G.M. Clinical Pharmacology of Fentanyl in Preterm Infants. A Review. Pediatr. Neonatol. 2015, 56, 143–148. [Google Scholar] [CrossRef] [PubMed] [Green Version]
  2. Ziesenitz, V.C.; Vaughns, J.D.; Koch, G.; Mikus, G.; van den Anker, J.N. Pharmacokinetics of Fentanyl and Its Derivatives in Children: A Comprehensive Review. Clin. Pharmacokinet. 2018, 57, 125–149. [Google Scholar] [CrossRef] [PubMed]
  3. Kuip, E.J.M.; Zandvliet, M.L.; Koolen, S.L.W.; Mathijssen, R.H.J.; van der Rijt, C.C.D. A review of factors explaining variability in fentanyl pharmacokinetics; focus on implications for cancer patients. Br. J. Clin. Pharmacol. 2017, 83, 294–313. [Google Scholar] [CrossRef] [PubMed] [Green Version]
  4. Guitton, J.; Buronfosse, T.; Désage, M.; Lepape, A.; Brazier, J.L.; Beaune, P. Possible involvement of multiple cytochrome P450S in fentanyl and sufentanil metabolism as opposed to alfentanil. Biochem. Pharmacol. 1997, 53, 1613–1619. [Google Scholar] [CrossRef]
  5. Ziesenitz, V.C.; König, S.K.; Mahlke, N.S.; Skopp, G.; Haefeli, W.E.; Mikus, G. Pharmacokinetic interaction of intravenous fentanyl with ketoconazole. J. Clin. Pharmacol. 2015, 55, 708–717. [Google Scholar] [CrossRef]
  6. Saari, T.I.; Laine, K.; Neuvonen, M.; Neuvonen, P.J.; Olkkola, K.T. Effect of voriconazole and fluconazole on the pharmacokinetics of intravenous fentanyl. Eur. J. Clin. Pharmacol. 2008, 64, 25–30. [Google Scholar] [CrossRef]
  7. Irazuzta, J.; Pascucci, R.; Perlman, N.; Wessel, D. Effects of fentanyl administration on respiratory system compliance in infants. Crit. Care Med. 1993, 21, 1001–1004. [Google Scholar] [CrossRef]
  8. Dewhirst, E.; Naguib, A.; Tobias, J.D. Chest wall rigidity in two infants after low-dose fentanyl administration. Pediatr. Emerg. Care 2012, 28, 465–468. [Google Scholar] [CrossRef]
  9. Ward, R.M.; Sherwin, C.M.T. Ethics of Drug Studies in the Newborn. Pediatr. Drugs 2014, 17, 37–42. [Google Scholar] [CrossRef]
  10. Maharaj, A.R.; Edginton, A.N. Physiologically Based Pharmacokinetic Modeling and Simulation in Pediatric Drug Development. CPT Pharmacometrics Syst. Pharmacol. 2014, 3, 1–13. [Google Scholar] [CrossRef] [Green Version]
  11. Lippert, J.; Burghaus, R.; Edginton, A.; Frechen, S.; Karlsson, M.; Kovar, A.; Lehr, T.; Milligan, P.; Nock, V.; Ramusovic, S.; et al. Open Systems Pharmacology Community—An Open Access, Open Source, Open Science Approach to Modeling and Simulation in Pharmaceutical Sciences. CPT Pharmacometrics Syst. Pharmacol. 2019, 8, 878–882. [Google Scholar] [CrossRef] [PubMed] [Green Version]
  12. Yellepeddi, V.; Rower, J.; Liu, X.; Kumar, S.; Rashid, J.; Sherwin, C.M.T. State-of-the-Art Review on Physiologically Based Pharmacokinetic Modeling in Pediatric Drug Development. Clin. Pharmacokinet. 2019, 58, 1–13. [Google Scholar] [CrossRef] [PubMed]
  13. Björkman, S. Reduction and Lumping of Physiologically Based Pharmacokinetic Models: Prediction of the Disposition of Fentanyl and Pethidine in Humans by Successively Simplified Models. J. Pharmacokinet. Pharmacodyn. 2003, 30, 285–307. [Google Scholar] [CrossRef] [PubMed]
  14. Shankaran, H.; Adeshina, F.; Teeguarden, J.G. Physiologically-based pharmacokinetic model for Fentanyl in support of the development of Provisional Advisory Levels. Toxicol. Appl. Pharmacol. 2013, 273, 464–476. [Google Scholar] [CrossRef]
  15. Pilari, S.; Gaub, T.; Block, M.; Görlitz, L. Development of physiologically based organ models to evaluate the pharmacokinetics of drugs in the testes and the thyroid gland. CPT Pharmacomet. Syst. Pharmacol. 2017, 6, 532–542. [Google Scholar] [CrossRef]
  16. Leong, R.; Vieira, M.L.T.; Zhao, P.; Mulugeta, Y.; Lee, C.S.; Huang, S.-M.; Burckart, G.J. Regulatory experience with physiologically based pharmacokinetic modeling for pediatric drug trials. Clin. Pharmacol. Ther. 2012, 91, 926–931. [Google Scholar] [CrossRef]
  17. Barrett, J.S.; Della Casa Alberighi, O.; Läer, S.; Meibohm, B. Physiologically Based Pharmacokinetic (PBPK) Modeling in Children. Clin. Pharmacol. Ther. 2012, 92, 40–49. [Google Scholar] [CrossRef]
  18. Templeton, I.E.; Jones, N.S.; Musib, L. Pediatric Dose Selection and Utility of PBPK in Determining Dose. AAPS J. 2018, 20, 31. [Google Scholar] [CrossRef]
  19. Michelet, R.; Bocxlaer, J.V.; Vermeulen, A. PBPK in Preterm and Term Neonates: A Review. Curr. Pharm. Des. 2018, 23, 5943–5954. [Google Scholar] [CrossRef]
  20. Johnson, T.N.; Rostami-Hodjegan, A. Resurgence in the use of physiologically based pharmacokinetic models in pediatric clinical pharmacology: Parallel shift in incorporating the knowledge of biological elements and increased applicability to drug development and clinical practice. Pediatr. Anesth. 2011, 21, 291–301. [Google Scholar] [CrossRef]
  21. Maharaj, A.R.; Barrett, J.S.; Edginton, A.N. A workflow example of PBPK modeling to support pediatric research and development: Case study with lorazepam. AAPS J. 2013, 15, 455–464. [Google Scholar] [CrossRef] [PubMed] [Green Version]
  22. Ince, I.; Solodenko, J.; Frechen, S.; Dallmann, A.; Niederalt, C.; Schlender, J.; Burghaus, R.; Lippert, J.; Willmann, S. Predictive Pediatric Modeling and Simulation Using Ontogeny Information. J. Clin. Pharmacol. 2019, 59, S95–S103. [Google Scholar] [CrossRef] [PubMed] [Green Version]
  23. Kovar, L.; Schräpel, C.; Selzer, D.; Kohl, Y.; Bals, R.; Schwab, M.; Lehr, T. Physiologically-Based Pharmacokinetic (PBPK) Modeling of Buprenorphine in Adults, Children and Preterm Neonates. Pharmaceutics 2020, 12, 578. [Google Scholar] [CrossRef] [PubMed]
  24. Hanke, N.; Kunz, C.; Thiemann, M.; Fricke, H.; Lehr, T. Translational PBPK Modeling of the Protein Therapeutic and CD95L Inhibitor Asunercept to Develop Dose Recommendations for Its First Use in Pediatric Glioblastoma Patients. Pharmaceutics 2019, 11, 152. [Google Scholar] [CrossRef] [Green Version]
  25. Moj, D.; Britz, H.; Burhenne, J.; Stewart, C.F.; Egerer, G.; Haefeli, W.E.; Lehr, T. A physiologically based pharmacokinetic and pharmacodynamic (PBPK/PD) model of the histone deacetylase (HDAC) inhibitor vorinostat for pediatric and adult patients and its application for dose specification. Cancer Chemother. Pharmacol. 2017, 80, 1013–1026. [Google Scholar] [CrossRef]
  26. Wojtyniak, J.-G.; Britz, H.; Selzer, D.; Schwab, M.; Lehr, T. Data Digitizing: Accurate and Precise Data Extraction for Quantitative Systems Pharmacology and Physiologically-Based Pharmacokinetic Modeling. CPT Pharmacomet. Syst. Pharmacol. Pharmacol. 2020. accepted for publication. [Google Scholar] [CrossRef]
  27. Feierman, D.E.; Lasker, J.M. Metabolism of fentanyl, a synthetic opioid analgesic, by human liver microsomes. Role of CYP3A4. Drug Metab. Dispos. 1996, 24, 932–939. [Google Scholar]
  28. Yu, C.; Yuan, M.; Yang, H.; Zhuang, X.; Li, H. P-glycoprotein on blood-brain barrier plays a vital role in fentanyl brain exposure and respiratory toxicity in rats. Toxicol. Sci. 2018, 164, 353–362. [Google Scholar] [CrossRef] [Green Version]
  29. Lötsch, J.; Walter, C.; Parnham, M.J.; Oertel, B.G.; Geisslinger, G. Pharmacokinetics of non-intravenous formulations of fentanyl. Clin. Pharmacokinet. 2013, 52, 23–36. [Google Scholar] [CrossRef]
  30. Andrew Williams, J.; Ring, B.J.; Cantrell, V.E.; Jones, D.R.; Eckstein, J.; Ruterbories, K.; Hamman, M.A.; Hall, S.D.; Wrighton, S.A. Comparative metabolic capabilities of CYP3A4, CYP3A5, and CYP3A7. Drug Metab. Dispos. 2002, 30, 883–891. [Google Scholar] [CrossRef]
  31. Open Systems Pharmacology Suite Community Open Systems Pharmacology Suite Manual, Version 7.4. Available online: https://github.com/Open-Systems-Pharmacology/OSPSuite.Documentation/blob/master/Open Systems Pharmacology Suite.pdf (accessed on 25 March 2020).
  32. PK-Sim® Ontogeny Database, Version 7.3. Available online: https://github.com/Open-Systems-Pharmacology/OSPSuite.Documentation/blob/master/PK-Sim (accessed on 25 March 2020).
  33. Prasad, B.; Gaedigk, A.; Vrana, M.; Gaedigk, R.; Leeder, J.; Salphati, L.; Chu, X.; Xiao, G.; Hop, C.; Evers, R.; et al. Ontogeny of Hepatic Drug Transporters as Quantified by LC-MS/MS Proteomics. Clin. Pharmacol. Ther. 2016, 100, 362–370. [Google Scholar] [CrossRef] [PubMed] [Green Version]
  34. McNamara, P.J.; Alcorn, J. Protein binding predictions in infants. AAPS PharmSci 2002, 4, 19–26. [Google Scholar] [CrossRef] [PubMed] [Green Version]
  35. Wilson, A.S.; Stiller, R.L.; Davis, P.J.; Fedel, G.; Chakravorti, S.; Israel, B.A.; McGowan, F.X. Fentanyl and Alfentanil Plasma Protein Binding in Preterm and Term Neonates. Anesth. Analg. 1997, 84, 315–318. [Google Scholar] [CrossRef] [PubMed]
  36. Gauntlett, I.S.; Fisher, D.M.; Hertzka, R.E.; Kuhis, E.; Spellman, M.J.; Rudolph, C. Pharmacokinetics of Fentanyl in Neonatal Humans and Lambs. Anesthesiology 1988, 69, 683–687. [Google Scholar] [CrossRef] [PubMed]
  37. Koehntop, D.E.; Rodman, J.H.; Brundage, D.M.; Hegland, M.G.; Buckley, J.J. Pharmacokinetics of fentanyl in neonates. Anesth. Analg. 1986, 65, 227–232. [Google Scholar] [CrossRef]
  38. Saarenmaa, E.; Neuvonen, P.J.; Fellman, V. Gestational age and birth weight effects on plasma clearance of fentanyl in newborn infants. J. Pediatr. 2000, 136, 767–770. [Google Scholar] [CrossRef]
  39. Li, X.; Frechen, S.; Moj, D.; Lehr, T.; Taubert, M.; Hsin, C.-h.; Mikus, G.; Neuvonen, P.J.; Olkkola, K.T.; Saari, T.I.; et al. A Physiologically Based Pharmacokinetic Model of Voriconazole Integrating Time-Dependent Inhibition of CYP3A4, Genetic Polymorphisms of CYP2C19 and Predictions of Drug–Drug Interactions. Clin. Pharmacokinet. 2020, 59, 781–808. [Google Scholar] [CrossRef]
  40. McClain, D.A.; Hug, C.C. Intravenous fentanyl kinetics. Clin. Pharmacol. Ther. 1980, 28, 106–114. [Google Scholar] [CrossRef]
  41. Bovill, J.G.; Sebel, P.S. Pharmacokinetics of high-dose fentanyl. Br. J. Anaesth. 1980, 52, 795–801. [Google Scholar] [CrossRef]
  42. Bentley, J.B.; Borel, J.D.; Nenad, R.E.; Gillespie, T.J. Age and Fentanyl Pharmacokinetics. Anesth. Analg. 1982, 61, 968–971. [Google Scholar] [CrossRef]
  43. Christrup, L.; Foster, D.; Popper, L.; Troen, T.; Upton, R. Pharmacokinetics, efficacy, and tolerability of fentanyl following intranasal versus intravenous administration in adults undergoing third-molar extraction: A randomized, double-blind, double-dummy, two-way, crossover study. Clin. Ther. 2008, 30, 469–481. [Google Scholar] [CrossRef] [PubMed]
  44. Duthie, D.J.R.; McLaren, A.D.; Nimmo, W.S. Pharmacokinetics of fentanyl during constant rate i.v. infusion for the relief of pain after surgery. Br. J. Anaesth. 1986, 58, 950–956. [Google Scholar] [CrossRef]
  45. Gourlay, G.K.; Murphy, T.M.; Plummer, J.L.; Kowalski, S.R.; Cherry, D.A.; Cousins, M.J. Pharmacokinetics of fentanyl in lumbar and cervical CSF following lumbar epidural and intravenous administration. Pain 1989, 38, 253–259. [Google Scholar] [CrossRef]
  46. Gupta, S.K.; Southam, M.A.; Hwang, S.S. Evaluation of Diurnal Variation in Fentanyl Clearance. J. Clin. Pharmacol. 1995, 35, 159–162. [Google Scholar] [CrossRef] [PubMed]
  47. Holley, F.O.; Van Steennis, C. Postoperative analgesia with fentanyl: Pharmacokinetics and pharmacodynamics of constant-rate I.V. and transdermal delivery. Br. J. Anaesth. 1988, 60, 608–613. [Google Scholar] [CrossRef] [PubMed]
  48. Lim, C.B.S.; Schug, S.A.; Sunderland, V.B.; Paech, M.J.; Liu, Y. A Phase I Pharmacokinetic and Bioavailability Study of a Sublingual Fentanyl Wafer in Healthy Volunteers. Anesth. Analg. 2012, 115, 1. [Google Scholar] [CrossRef]
  49. MacLeod, D.B.; Habib, A.S.; Ikeda, K.; Spyker, D.A.; Cassella, J.V.; Ho, K.Y.; Gan, T.J. Inhaled Fentanyl Aerosol in Healthy Volunteers. Anesth. Analg. 2012, 115, 1071–1077. [Google Scholar] [CrossRef]
  50. Singleton, M.A.; Rosen, J.I.; Fisher, D.M. Plasma concentrations of fentanyl in infants, children and adults. Can. J. Anaesth. 1987, 34, 152–155. [Google Scholar] [CrossRef]
  51. Stoeckel, H.; Schüttler, J.; Magnussen, H.; Hengstmann, J.H. Plasma fentanyl concentrations and the occurrence of respiratory depression in volunteers. Br. J. Anaesth. 1982, 54, 1087–1095. [Google Scholar] [CrossRef]
  52. Streisand, J.B.; Varvel, J.R.; Stanski, D.R.; Le Maire, L.; Ashburn, M.A.; Hague, B.I.; Tarver, S.D.; Stanley, T.H. Absorption and Bioavailability of Oral Transmucosal Fentanyl Citrate. Anesthesiology 1991, 75, 223–229. [Google Scholar] [CrossRef]
  53. Varvel, J.R.; Shafer, S.L.; Hwang, S.S.; Coen, P.A.; Stanski, D.R. Absorption Characteristics of Transdermally Administered Fentanyl. Anesthesiology 1989, 70, 928–934. [Google Scholar] [CrossRef] [PubMed]
  54. Collins, C.; Koren, G.; Crean, P.; Klein, J.; Roy, W.L.; MacLeod, S.M. Fentanyl pharmacokinetics and hemodynamic effects in preterm infants during ligation of patent ductus arteriosus. Anesth. Analg. 1985, 64, 1078–1080. [Google Scholar] [CrossRef]
  55. Wishart, D.S.; Knox, C.; Guo, A.C.; Shrivastava, S.; Hassanali, M.; Stothard, P.; Chang, Z.; Woolsey, J. DrugBank: A comprehensive resource for in silico drug discovery and exploration. Nucleic Acids Res. 2006, 34, D668–D672. [Google Scholar] [CrossRef] [PubMed]
  56. Magee, P. Percutaneous absorption: Critical factors in transdermal transport. In Dermatotoxicology; Marzulli, F., Maibach, H., Eds.; Hemisphere Publishing Corporation: New York, NY, USA, 1991; pp. 1–35. [Google Scholar]
  57. Bower, S. Plasma protein binding of fentanyl. J. Pharm. Pharmacol. 1981, 33, 507–514. [Google Scholar] [CrossRef] [PubMed]
  58. Bista, S.R.; Haywood, A.; Hardy, J.; Lobb, M.; Tapuni, A.; Norris, R. Protein binding of fentanyl and its metabolite nor-fentanyl in human plasma, albumin and α-1 acid glycoprotein. Xenobiotica 2015, 45, 207–212. [Google Scholar] [CrossRef]
  59. Jantos, R.; Schuhmacher, M.; Veldstra, J.L.; Bosker, W.M.; Klöpping-Ketelaars, I.; Touliou, K.; Sardi, G.M.; Brookhuis, K.A.; Ramaekers, J.G.; Mattern, R.; et al. Determination of blood/serum ratios of different forensically relevant analytes in authentic samples. Arch. Kriminol. 2011, 227, 188–203. [Google Scholar]
  60. Rodgers, T.; Rowland, M. Physiologically-based Pharmacokinetic Modeling 2: Predicting the tissue distribution of acids, very weak bases, neutrals and zwitterions. J. Pharm. Sci. 2006, 95, 1238–1257. [Google Scholar] [CrossRef]
  61. Rodgers, T.; Rowland, M. Mechanistic approaches to volume of distribution predictions: Understanding the processes. Pharm. Res. 2007, 24, 918–933. [Google Scholar] [CrossRef]
  62. Rodgers, T.; Leahy, D.; Rowland, M. Physiologically based pharmacokinetic modeling 1: Predicting the tissue distribution of moderate-to-strong bases. J. Pharm. Sci. 2005, 94, 1259–1276. [Google Scholar] [CrossRef]
  63. Schmitt, W. General approach for the calculation of tissue to plasma partition coefficients. Toxicol. In Vitro 2008, 22, 457–467. [Google Scholar] [CrossRef]
  64. Fachinformation Fentanyl HEXAL® Injektionslösung. Available online: https://www.hexal.biz/praeparate/dokumente/fi/fentanyl_hx_inj_spc-1575534009.pdf (accessed on 19 August 2020).
  65. Rosaeg, O.P.; Kitts, J.B.; Koren, G.; Byford, L.J. Maternal and fetal effects of intravenous patient-controlled fentanyl analgesia during labour in a thrombocytopenic parturient. Can. J. Anaesth. 1992, 39, 277–281. [Google Scholar] [CrossRef] [PubMed] [Green Version]
  66. Olkkola, K.T.; Palkama, V.J.; Neuvonen, P.J. Ritonavir’s role in reducing fentanyl clearance and prolonging its half- life. Anesthesiology 1999, 91, 681–685. [Google Scholar] [CrossRef] [PubMed]
  67. Diebel, L.N.; Wilson, R.F.; Dulchavsky, S.A.; Saxe, J. Effect of increased intra-abdominal pressure on hepatic arterial, portal venous, and hepatic microcirculatory blood flow. J. Trauma 1992, 33, 279–282; discussion 282–283. [Google Scholar] [CrossRef] [PubMed]
  68. Thomson, M.M.S.; Hines, R.N.; Schuetz, E.G.; Meibohm, B. Expression patterns of organic anion transporting polypeptides 1B1 and 1B3 protein in human pediatric liver. Drug Metab. Dispos. 2016, 44, 999–1004. [Google Scholar] [CrossRef] [Green Version]
  69. Wilson, C.; Li, Q.; Gaedigk, R.; Bi, C.; De Wildt, S.N.; Leeder, J.S.; Fridley, B.L. Ontogeny related changes in the pediatric liver metabolome. Front. Pediatr. 2020, in press. [Google Scholar] [CrossRef]
  70. Hadley, G.; Derry, S.; Moore, R.A.; Wiffen, P.J. Transdermal fentanyl for cancer pain. Cochrane Database Syst. Rev. 2013, 28, 264–265. [Google Scholar] [CrossRef]
  71. DURAGESIC® (Fentanyl Transdermal System) Full Prescribing Information. Available online: https://www.accessdata.fda.gov/drugsatfda_docs/label/2005/19813s039lbl.pdf (accessed on 14 August 2020).
  72. Kovar, L.; Selzer, D.; Britz, H.; Benowitz, N.; St. Helen, G.; Kohl, Y.; Bals, R.; Lehr, T. Comprehensive Parent–Metabolite PBPK/PD Modeling Insights into Nicotine Replacement Therapy Strategies. Clin. Pharmacokinet. 2020. [Google Scholar] [CrossRef] [Green Version]
Figure 1. Fentanyl (blue: venous blood; red: arterial blood; orange: urine) and norfentanyl (green: venous blood) predicted and observed plasma concentration–time as well as fraction excreted in urine–time profiles after intravenous administration of fentanyl in adults. (a,c,eg): selection of external test dataset; (b,d,h,i): selection of internal training dataset. Population simulations (n = 100) are shown as lines with shaded areas (geometric mean and geometric standard deviation). Observed data is shown as circles ± standard deviation if available. References with numbers in parentheses link to a specific observed dataset ID described in the study table (Table 1). Predicted and observed areas under the plasma concentration–time curve from the first to the last data point (AUClast) are compared in Table S5 of the Supplementary Materials. Predicted and observed plasma concentration–time profiles of all studies in adults (linear and semilogarithmic) are shown in Section 3.1 in the Supplementary Materials. iv: intravenous.
Pharmaceutics 12 00908 g001
Figure 2. Predicted versus observed AUClast values of fentanyl and norfentanyl grouped by test and training dataset (a) and predicted versus observed plasma concentrations (b) for the adult PBPK model. In (a), each symbol represents the AUClast of a single plasma concentration–time profile (circles: fentanyl; triangles: norfentanyl). In (b), each symbol represents a single plasma concentration (circles: fentanyl; triangles: norfentanyl). The black solid lines mark the lines of identity. Black dotted lines indicate 1.25-fold, black dashed lines indicate 2-fold deviation. AUClast: area under the plasma concentration–time curve from the first to the last data point.
Pharmaceutics 12 00908 g002
Figure 3. Structural overview of the whole-body physiologically-based pharmacokinetic (PBPK) model (a) and implemented elimination processes for fentanyl and norfentanyl (b). Each organ consists of a vascular space (containing plasma and red blood cells), interstitial space, and intracellular space. In (a,c), boxes indicate compartments, arrows denote in-/outflows, blue circles represent molecules, orange circles represent plasma proteins, and blue crescents denote enzymes. In (b), grey arrows indicate metabolic processes and yellow arrows indicate urinary excretion processes. CYP: cytochrome P450; GIT: gastrointestinal tract; Gallbl: gallbladder.
Pharmaceutics 12 00908 g003
Figure 4. DDI scenario for fentanyl (a) and norfentanyl (b) with the perpetrator drug voriconazole in adults. Fentanyl and norfentanyl plasma concentrations during concomitant administration of voriconazole are shown in purple. Plasma concentrations during sole fentanyl administration are shown in blue (fentanyl) and green (norfentanyl), respectively. Population simulations (n = 100) are shown as lines with shaded areas (geometric mean and geometric standard deviation). Observed data is shown as filled circles ± standard deviation. References link to a specific observed dataset described in Table 1. Black dashed line depicts the specified lower limit of quantification (LLOQ) for norfentanyl [6]. Predicted and observed areas under the plasma concentration–time curve from the first to the last data point (AUClast) are compared in Table S5 of the Supplementary Materials. DDI, drug–drug interaction; iv, intravenous.
Pharmaceutics 12 00908 g004
Figure 5. Fentanyl (red: arterial blood; blue: venous blood from central venous catheters) predicted and observed plasma concentration–time profiles after intravenous administration in preterm neonates (a,b), infants (c) and young children (d). Population simulations (n = 100) are shown as lines with shaded areas (geometric mean and geometric standard deviation). Observed data is shown as circles with standard deviation. References with numbers in parentheses link to a specific observed dataset ID described in Table 2. Predicted and observed area under the plasma concentration–time curve from the first to the last data point (AUClast) values are compared in Table S5 of the Supplementary Materials. Predicted and observed plasma concentration–time profiles of all studies in pediatrics are shown in Section 3.2 of the Supplementary Materials both on a linear and a semilogarithmic scale. iv: intravenous, preterms: preterm neonates.
Pharmaceutics 12 00908 g005
Figure 6. Predicted versus observed AUClast (a) and plasma concentrations (b) of fentanyl for the pediatric PBPK model. Squares depict values for individual patients with adjusted clearances due to increased intraabdominal pressure as explained in Section 3.4; circles depict values for study populations without adjustment of clearances. In (a), each symbol represents the AUClast of a single plasma concentration–time profile. In (b), each symbol represents a single plasma concentration. The black solid lines mark the lines of identity. Black dotted lines indicate 1.25-fold deviation; black dashed lines indicate 2-fold deviation. AUClast: area under the plasma concentration–time curve from the first to the last data point; abdom.: abdominal.
Pharmaceutics 12 00908 g006
Figure 7. Predicted and observed clearance per bodyweight (a) as well as predicted versus observed absolute clearance values for the pediatric PBPK model (b). Each colored symbol represents the individual clearance of a patient; black symbols represent the mean clearances with standard deviations (circles refer to data from Gauntlett et al. [36]; triangles refer to data from Koehntop et al. [37]; squares refer to data from Saarenmaa et al. [38]). In (b), the black solid line marks the line of identity; black dashed lines indicate 2-fold deviation.
Pharmaceutics 12 00908 g007
Figure 8. Simulations of arterial plasma concentration–time profiles after intravenous fentanyl bolus injection as well as 2- and 4-min infusions of different doses. Lines depict population geometric means (n = 100). iv: intravenous.
Pharmaceutics 12 00908 g008
Table 1. Overview of clinical studies used for building and evaluation of the adult PBPK model of fentanyl and norfentanyl.
Clinical Study IDDose a [µg/kg]Dose b [µg/h]AdministrationnFemale [%]Age [Years]Weight [kg]Blood SampleSurgeryDatasetReference
Bentley et al., 1982 (Adult)10.0 iv (bolus)510036 ± 464 ± 3arterialyese[42]
Bentley et al., 1982 (Eldery)10.0 iv (bolus)410067 ± 268 ± 7arterialyese[42]
Bovill and Sebel 198060.0 iv (2 min)54057 (45–65)71 (53–87)venousyese[41]
Christrup et al., 20081.5 iv (-)74324 (22–28)68 (52–82)venousyesi[43]
Duthie et al., 1986 (1)1.4100.0iv (24 h + bolus)10-61 ± 869 ± 12venousyese[44]
Duthie et al., 1986 (2)1.5100.0iv (24 h + bolus)13-49 ± 1465 ± 14venousyese[44]
Duthie et al., 1986 (3)1.4100.0iv (24 h + bolus)10-58 ± 1169 ± 11venousyese[44]
Duthie et al., 1986 (4)7.2100.0iv (26 h + bolus)12-55 ± 1269 ± 9venousyesi[44]
Gourlay et al., 19891.0 iv (1 min)6--70 (40–85)venous cnoe[45]
Gupta et al., 1995 50.0iv (48 h)60--venous dnoi[46]
Holley and van Steennis 1988 (1)1.325.0iv (loading dose + 24 h)10054 ± 1276 ± 12arterialyesi[47]
Holley and van Steennis 1988 (2)2.550.0iv (loading dose + 24 h)10044 ± 1581 ± 16arterialyese[47]
Holley and van Steennis 1988 (3)5.0100.0iv (loading dose + 24 h)10056 ± 1280 ± 17arterialyese[47]
Holley and van Steennis 1988 (4)6.5125.0iv (loading dose + 24 h)9054 ± 1277 ± 5arterialyesi[47]
Lim et al., 20121.5 iv (5 min)225823 (19–32)67 (51–101)venousnoe[48]
MacLeod et al., 20120.3 iv (5 sec)105125 (18–55)73 ± 13arterialnoi[49]
McClain and Hug 19806.4 iv (1.5 min)50- (22–29)75 (65–85)arterialnoi[40]
Saari et al., 2008 e5.0 iv (2 min)1242--venousnoe[6]
Saari et al., 2008 (DDI) e,f5.0 iv (2 min)1242--venousnoe[6]
Singleton et al., 1987 (1)20.7 iv (2 min)7-33 (18–41)-arterialyese[50]
Stoeckel et al., 19827.6 iv (bolus)33322 (20–26)66 (59–77)venousnoe[51]
Streisand et al., 199115.0 iv (8 min)10027 (23–31)76 (68–85)arterialnoe[52]
Varvel et al., 198911.4 iv (5 min)86345 (33–57)68 (52–100)arterial/venousyese[53]
Ziesenitz et al., 2015 e5.0 iv (10 min)162533 (22–49)73 (61–85)venousnoi[5]
-: not available, e: external test dataset, i: internal training dataset, iv: intravenous. Age and weight are reported as the mean with standard deviation or range if available. a Dose of bolus injection and short infusion, respectively; b dose of long-term infusion; c venous blood samples from a central venous catheter; d sample information was not specified and venous blood samples were assumed; e norfentanyl concentrations measured; f with concomitant administration of voriconazole.
Table 2. Overview of clinical studies used for evaluation of the pediatric PBPK model predictions of fentanyl.
Clinical Study IDDose a [µg/kg]Dose b [µg/kg/h]AdministrationnFemale [%]Chronological AgeGestational AgeWeight [kg]Blood SampleSurgeryReference
Collins et al., 198530.0 iv (1 min)922-32 (23–38)1.1 (0.7–1.6)arterialyes[54]
Gauntlett et al., 1988 (1)52.5 iv (2 min)1-1 day382.8arterialyes[36]
Gauntlett et al., 1988 (2)56.5 iv (2 min)1-3 days402.5arterialyes[36]
Gauntlett et al., 1988 (all) c54.1 ± 2.3 iv (2 min)14-18.0 (1–71) days38 (32–40)2.7 (1.9–3.9)arterialyes[36]
Koehntop et al., 1986 (1)25.0 iv (1–3 min)1-2 days-2.0arterialyes[37]
Koehntop et al., 1986 (2)50.0 iv (1–3 min)1-2 days-3.5arterialyes[37]
Koehntop et al., 1986 (all) c10.0–50.0 iv (1–3 min)14-3.0 (0.5–14) days-2.9 (1.9–3.8)arterialyes[37]
Saarenmaa et al., 2000 c10.51.5iv (1 h + 58 h)38260.4 (0–2) days32 (26–42)1.8 (0.9–3.6) darterialyes[38]
Singleton et al., 1987 (2)31.2 iv (2 min)7-6.5 (3–10) months--arterialyes[50]
Singleton et al., 1987 (3)30.8 iv (2 min)7-2.7 (1–9) years--venous eyes[50]
-: not available, iv: intravenous. Age and weight are reported as the mean with range if available. a Dose of bolus injection and short infusion, respectively; b dose of long-term infusion; c studies from which observed individual clearance values were extracted; d median and range; e venous blood samples from a central venous catheter.
Table 3. Fentanyl and norfentanyl drug-dependent model parameters.
ParameterFentanylNorfentanylDescription
ValueUnitSourceLiteratureReferenceValueUnitSourceLiteratureReference
MW336.5g/mollit.336.5[55] a232.3g/mollit.232.3[55] bMolecular weight
pKa (base)8.99 lit.8.99[55] a10.03 lit.10.03[55] bAcid dissociation constant
logP3.49 lit.3.49[56]2.00 lit.2.00[55] bLipophilicity
fu (adults)20.8%lit.20.8[57]81.9%lit.81.9[58]Unbound fraction
fu (pediatrics)29.0–33.0%calc. [34] Unbound fraction
CYP3A4 Km → norfen117µmol/Llit.117[27] Michaelis–Menten constant
CYP3A4 kcat → norfen20.61/minoptim.-- Catalytic rate constant
CYP3A7 Km → norfen596µmol/Lcalc.c-- Michaelis–Menten constant
CYP3A7 kcat → norfen5.221/mincalc.c-- Catalytic rate constant
Unspecific hepatic clearance → undef1.461/minlit.-- Elimination from plasma
(first-order process in the liver)
P-gp Km5.72µmol/Loptim.-- Michaelis–Menten constant
P-gp kcat1.711/minoptim.-- Transport rate constant
B/P ratio0.87 lit.0.87[59]1.26 calc.--Blood-to-plasma ratio
GFR fraction1.00 asm.--4.30 optim.--Filtered drug in the urine
Partition coefficientsDiverse d calc.R&R[60,61,62]Diverse d calc.Schmitt[63]Cell to plasma partitioning
Cellular permeabilityDiverse dcm/mincalc.Ch.-dep. Schmitt[31]1.80 × 10⁻²cm/mincalc.PK-Sim[31]Perm. into the cellular space
CYP3A4 KI of voriconazole9.33µmol/Llit.9.33[39] The inhibitor concentration
when reaching half of kinact
CYP3A4 kinact of voriconazole0.0151/minlit.0.015[39] The maximum inactivation rate constant
-: not available; asm.: assumed; calc.: calculated; Ch.-dep. Schmitt: Charge-dependent Schmitt calculation method; CYP: cytochrome P450; GFR: glomerular filtration rate; lit.: literature; norfen: norfentanyl; optim.: optimized; P-gp: P-glycoprotein; Perm.: permeability; PK-Sim: PK-Sim standard calculation method; Schmitt: Schmitt calculation method; R&R: Rodgers and Rowland calculation method; undef: undefined metabolite; a DrugBank entry for fentanyl: https://www.drugbank.ca/drugs/DB00813, accessed 30 July 2020; b DrugBank entry for norfentanyl: https://www.drugbank.ca/metabolites/DBMET00341, accessed 30 July 2020; c for detailed information on calculations, please refer to Section 1 in the Supplementary Materials; d different values for different organs estimated by the corresponding calculation method.

