Semi-Mechanism-Based Pharmacokinetic-Toxicodynamic Model of Oxaliplatin-Induced Acute and Chronic Neuropathy


Abstract
:1. Introduction
2. Materials and Methods
2.1. PK and TD Data Source
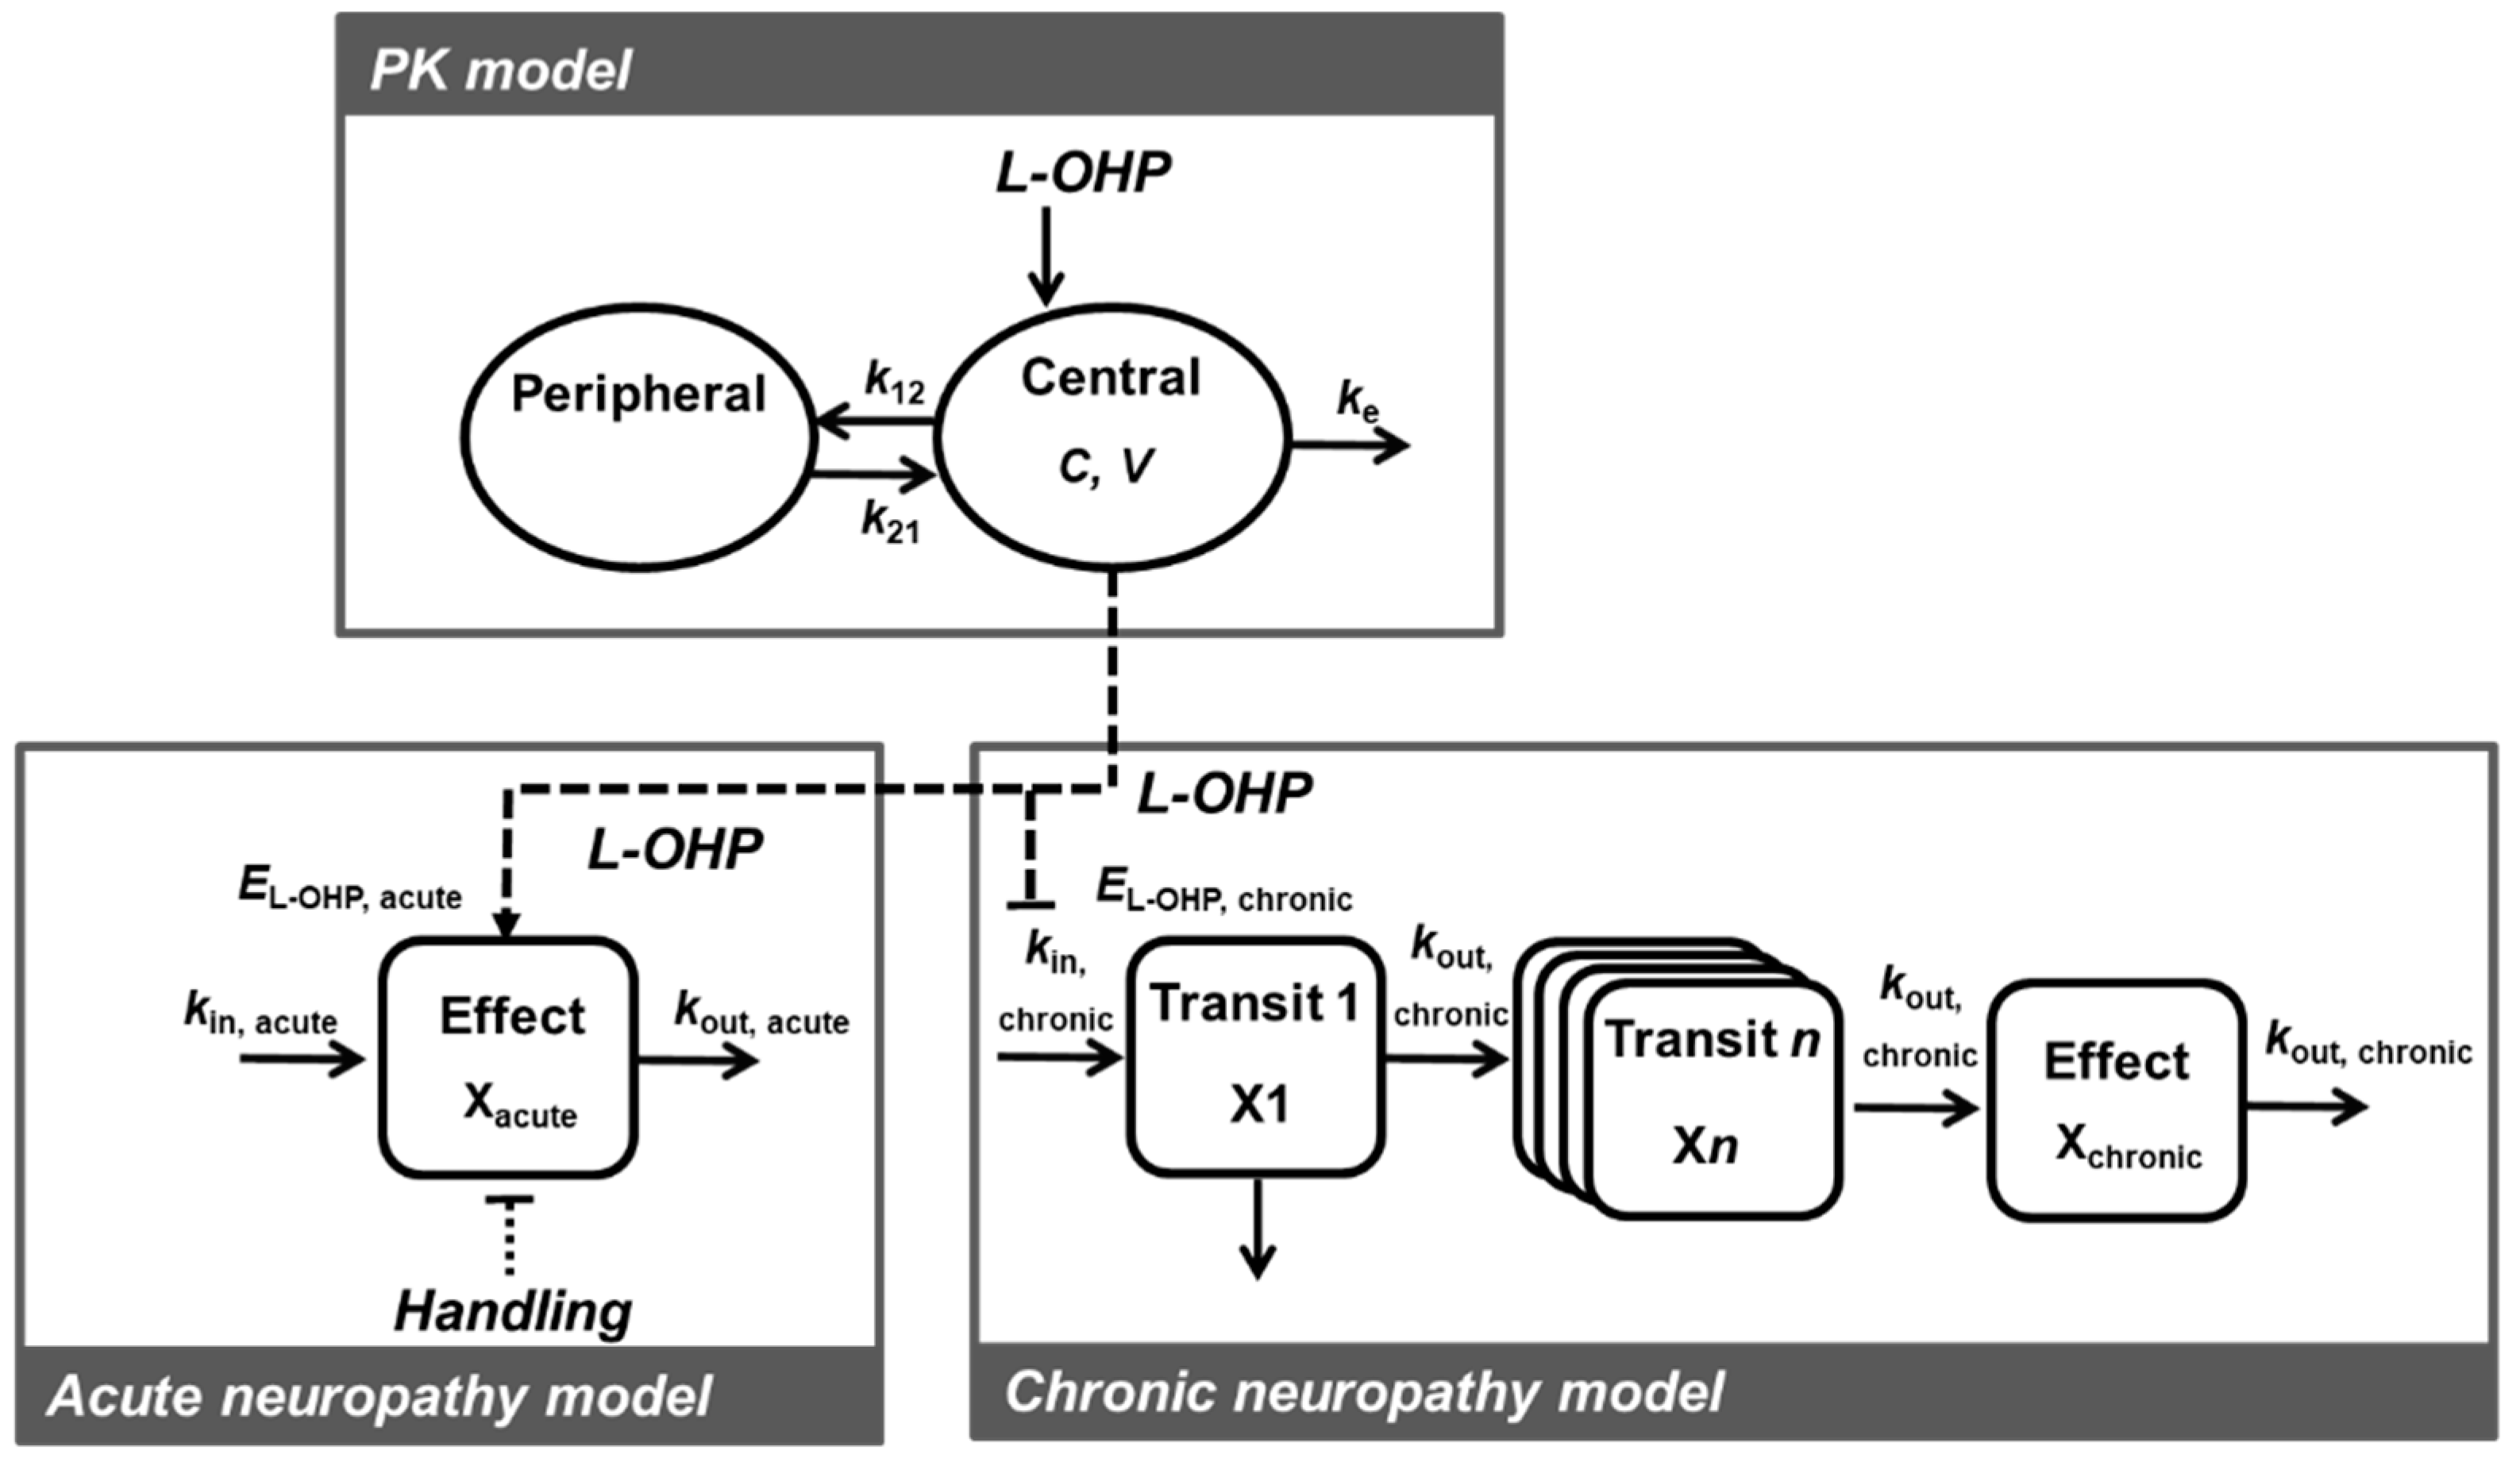
2.2. PK-TD Model Development
2.2.1. Software and Criteria
2.2.2. PK Model
2.2.3. TD Model for Acute Neuropathy
2.2.4. TD Model for Chronic Neuropathy
2.3. Model Evaluation
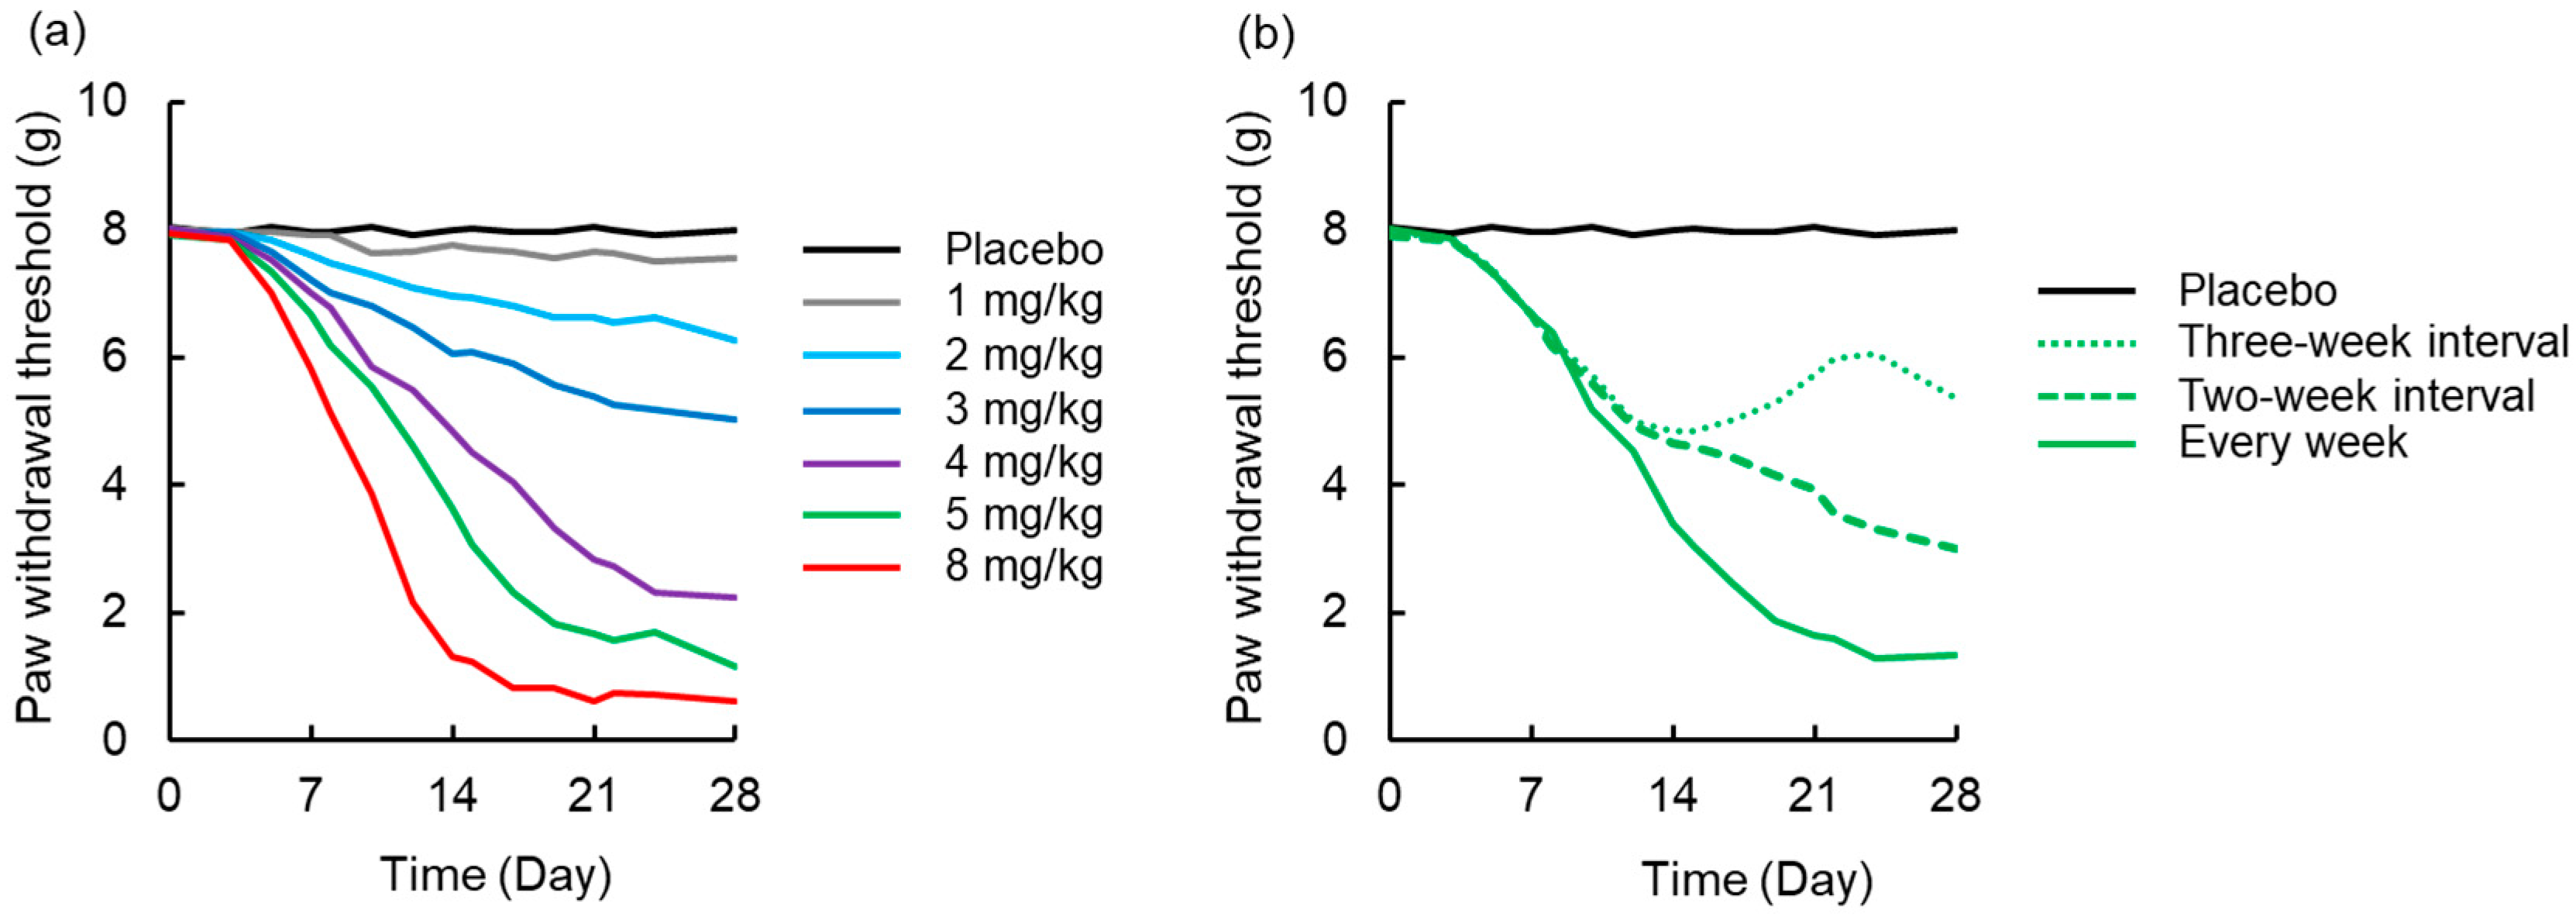
2.4. Simulation to Assess the Effects of Dosing Schedule on Neuropathy
3. Results
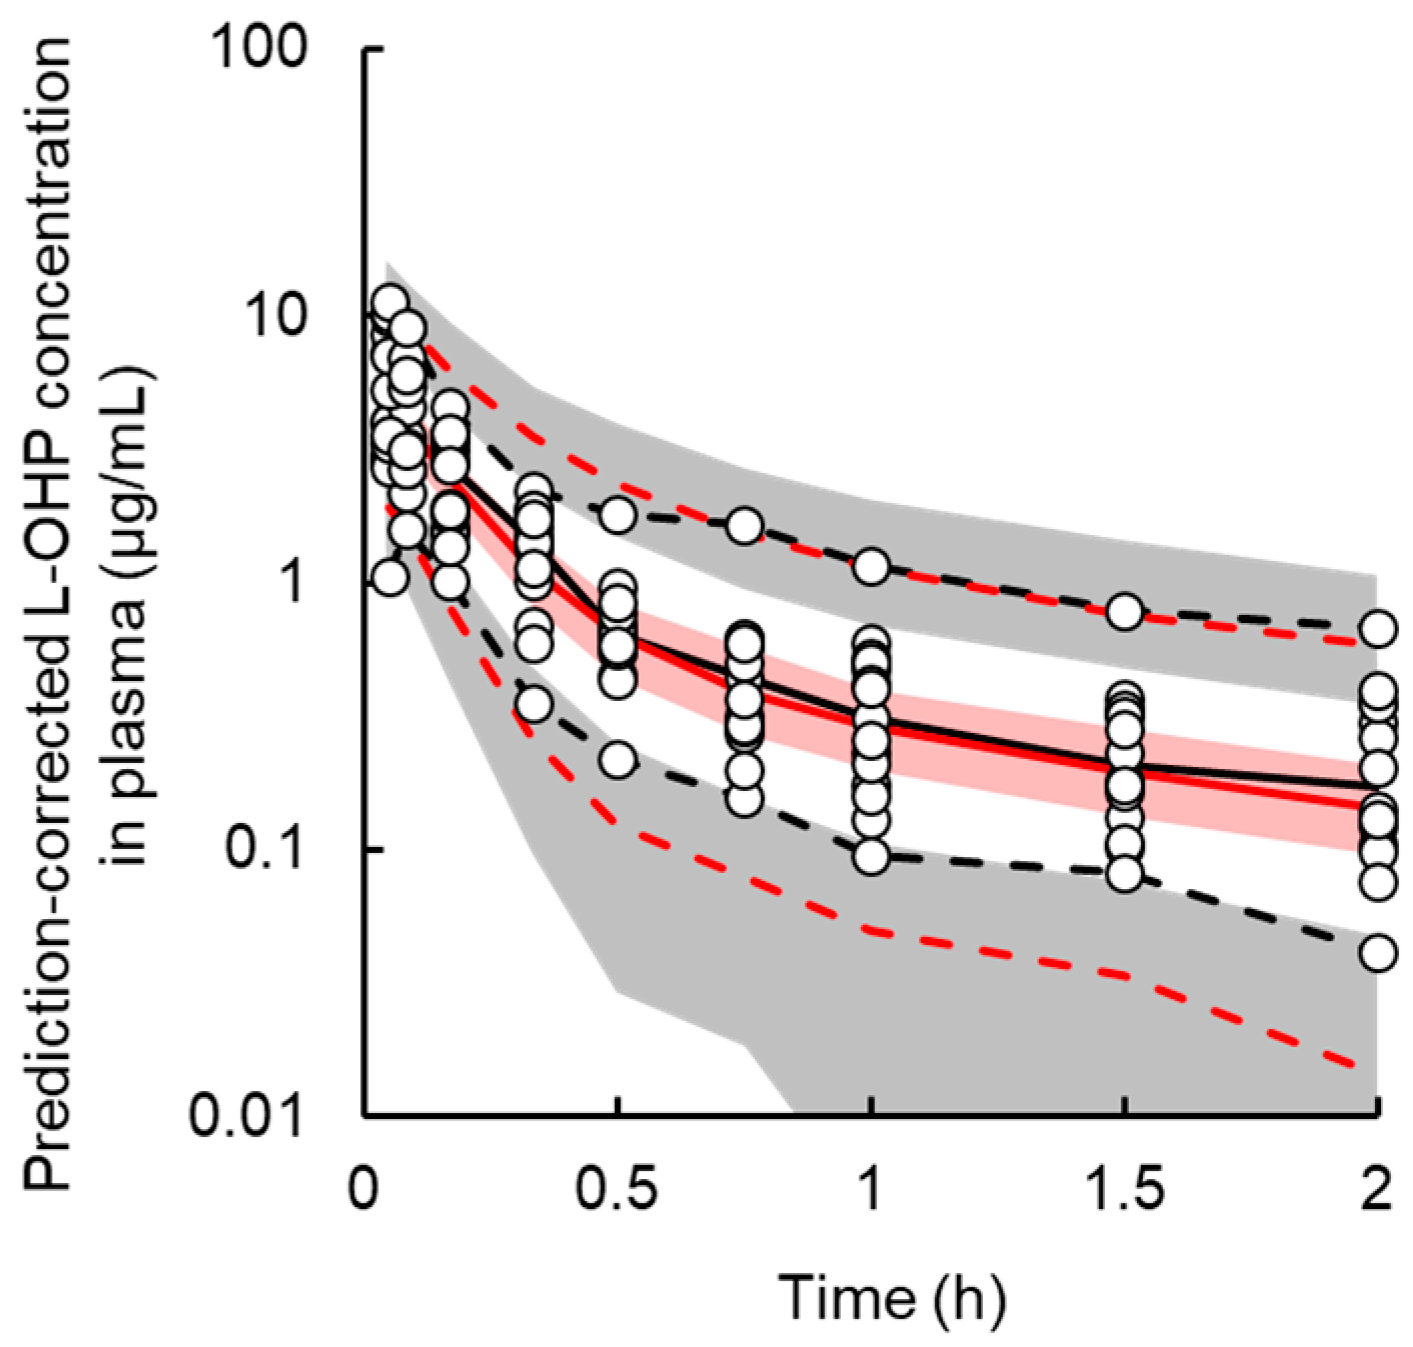
3.1. PK Model
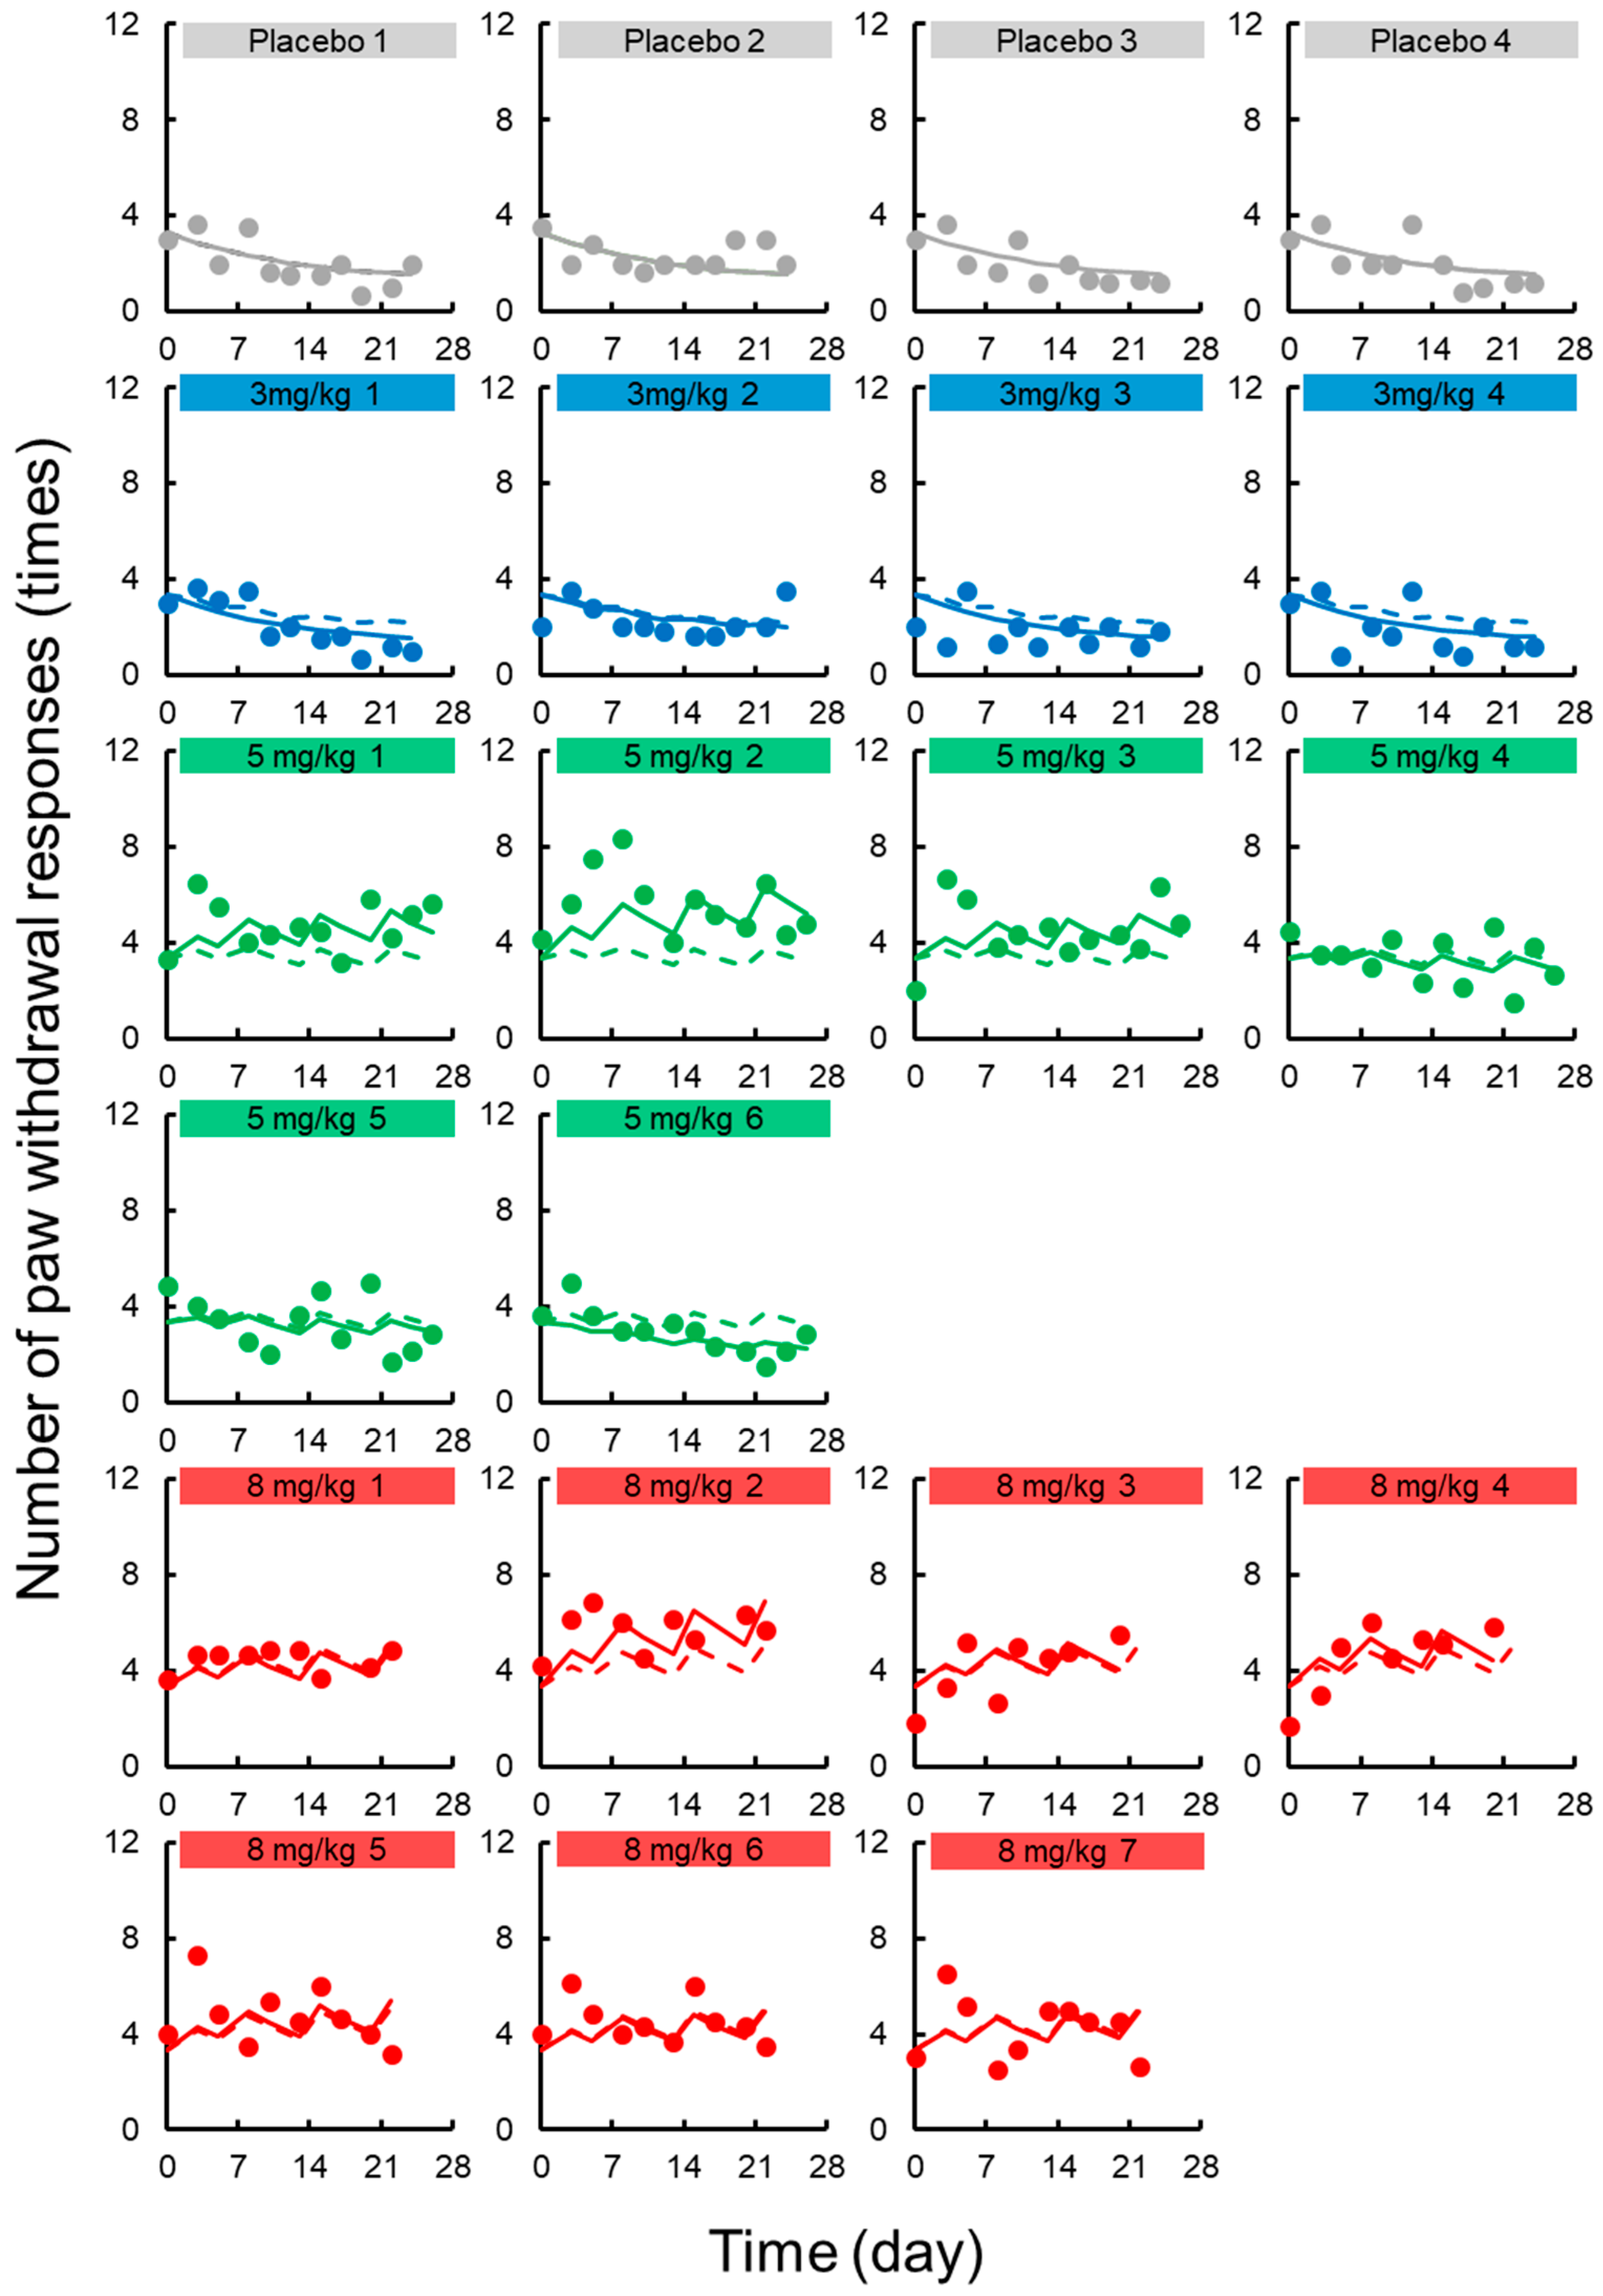
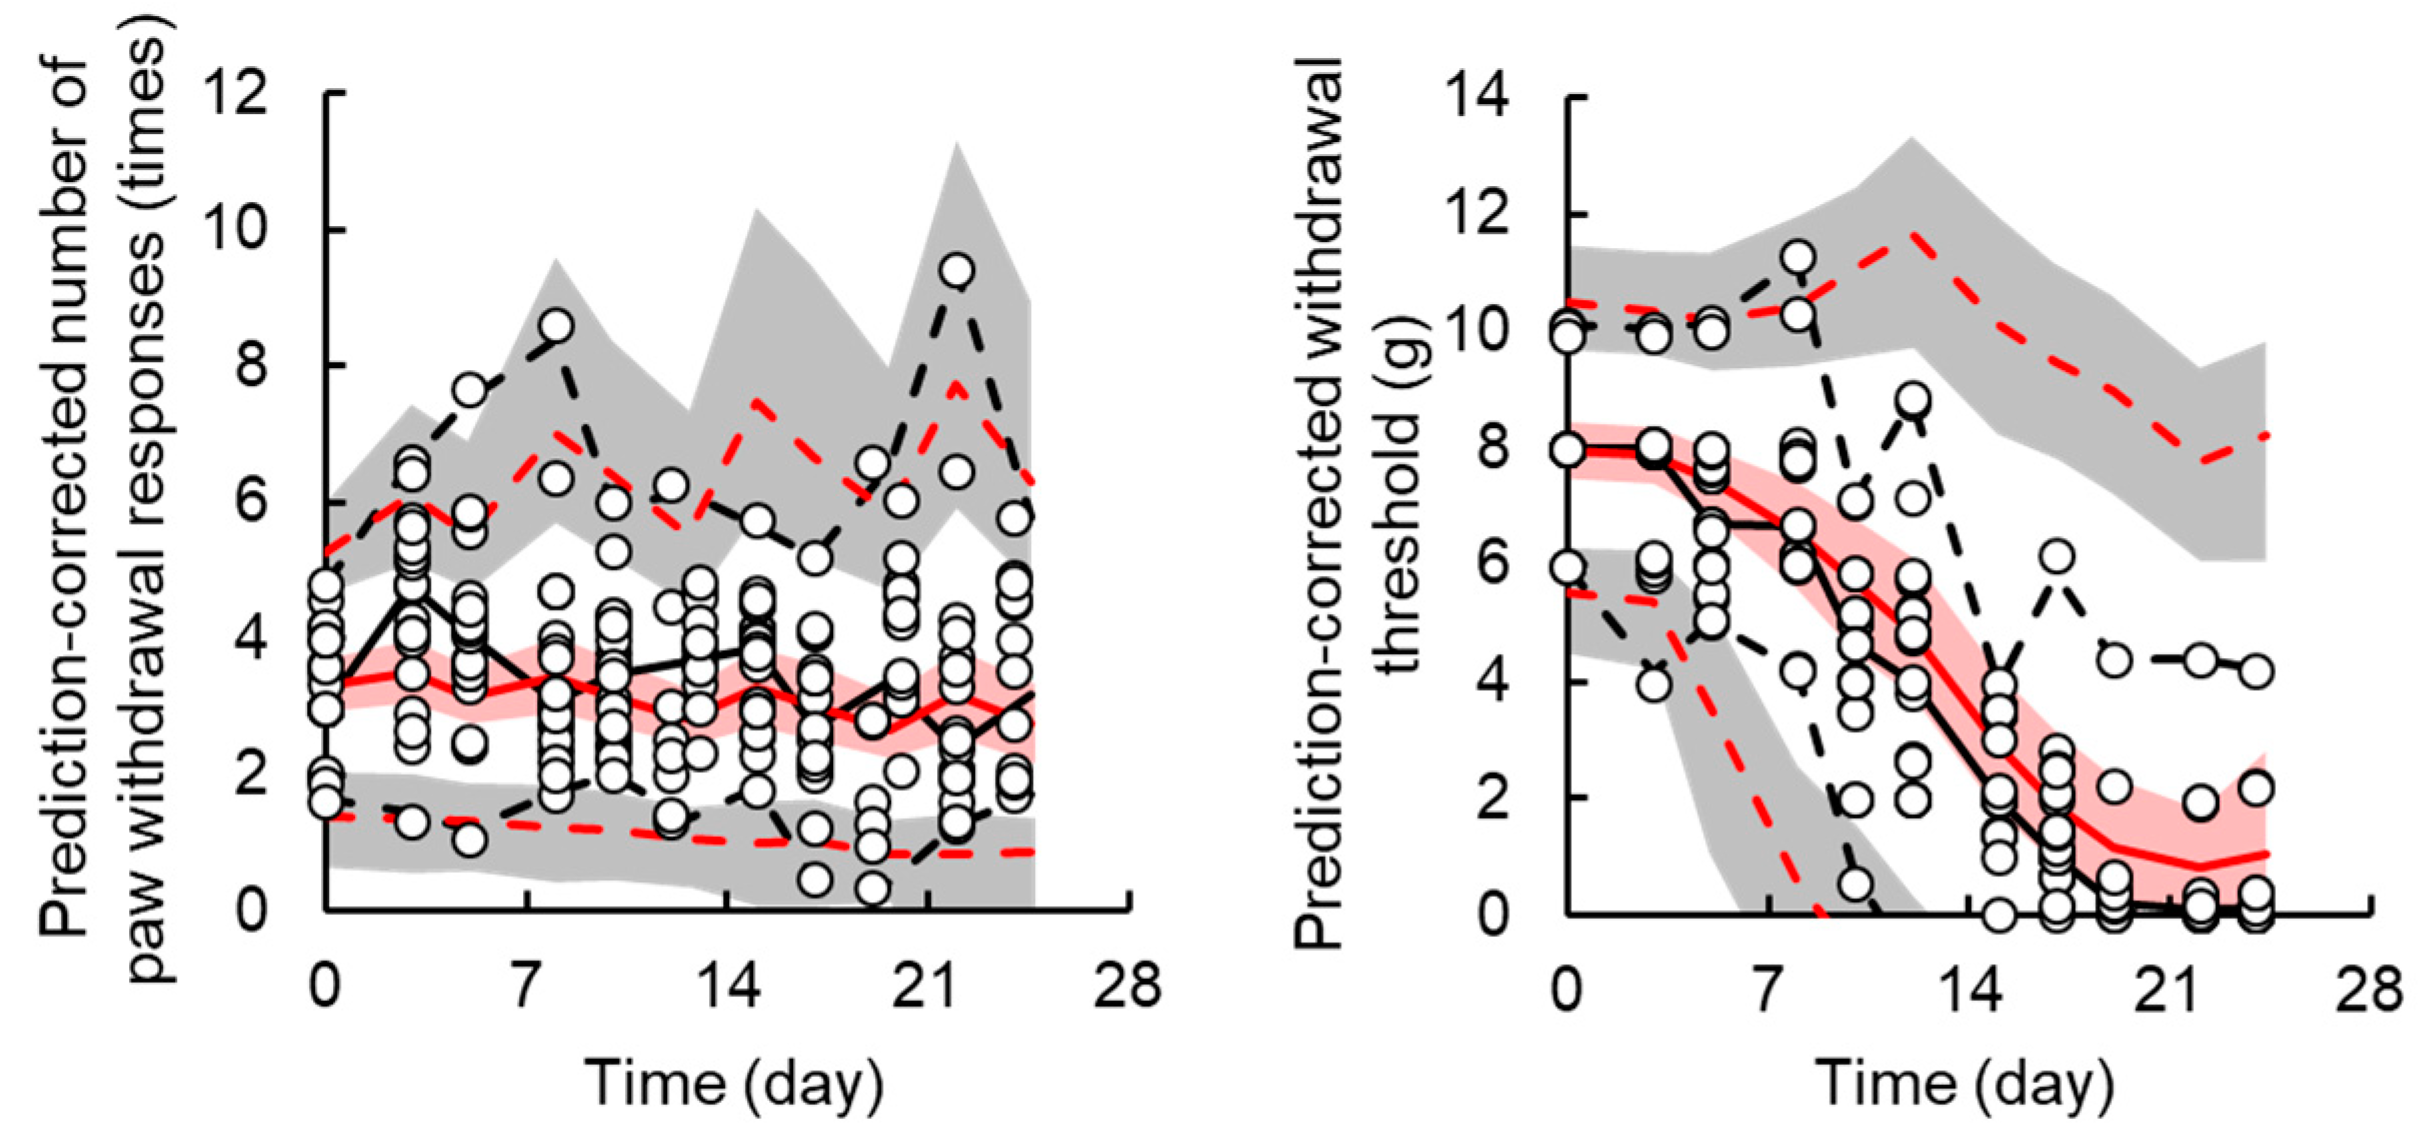
3.2. TD Model for Acute Neuropathy
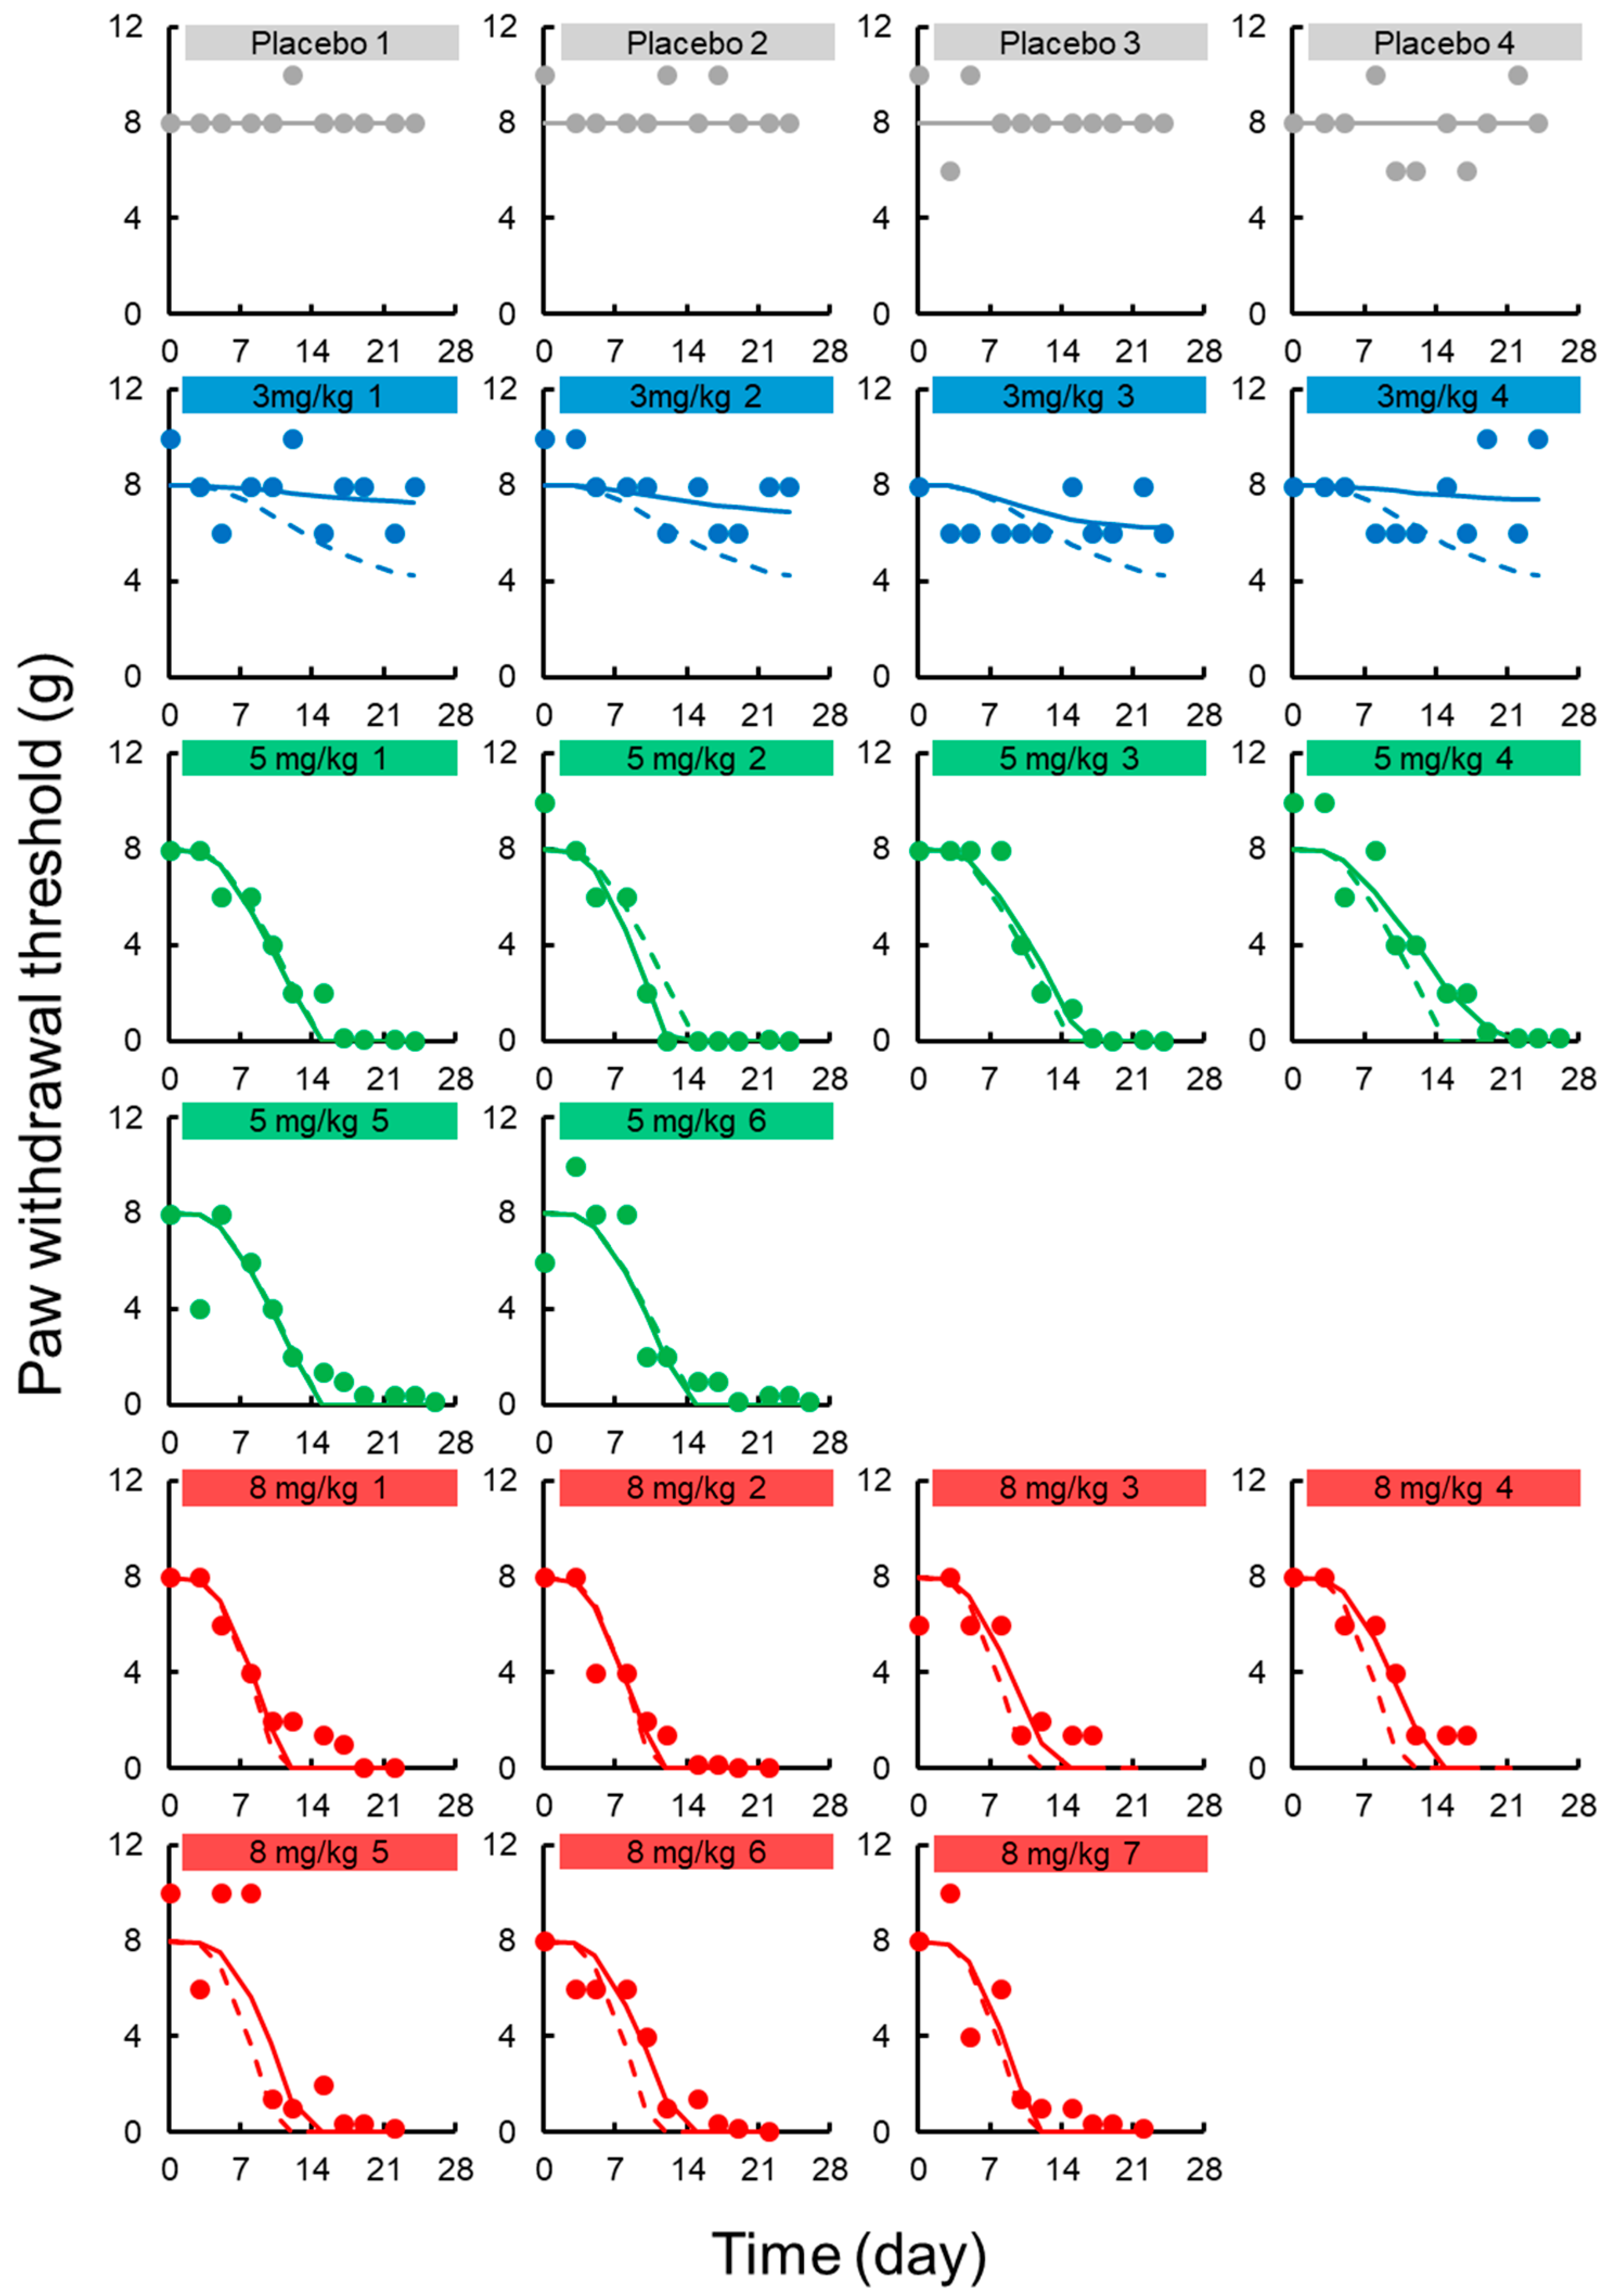
3.3. TD Model for Chronic Neuropath
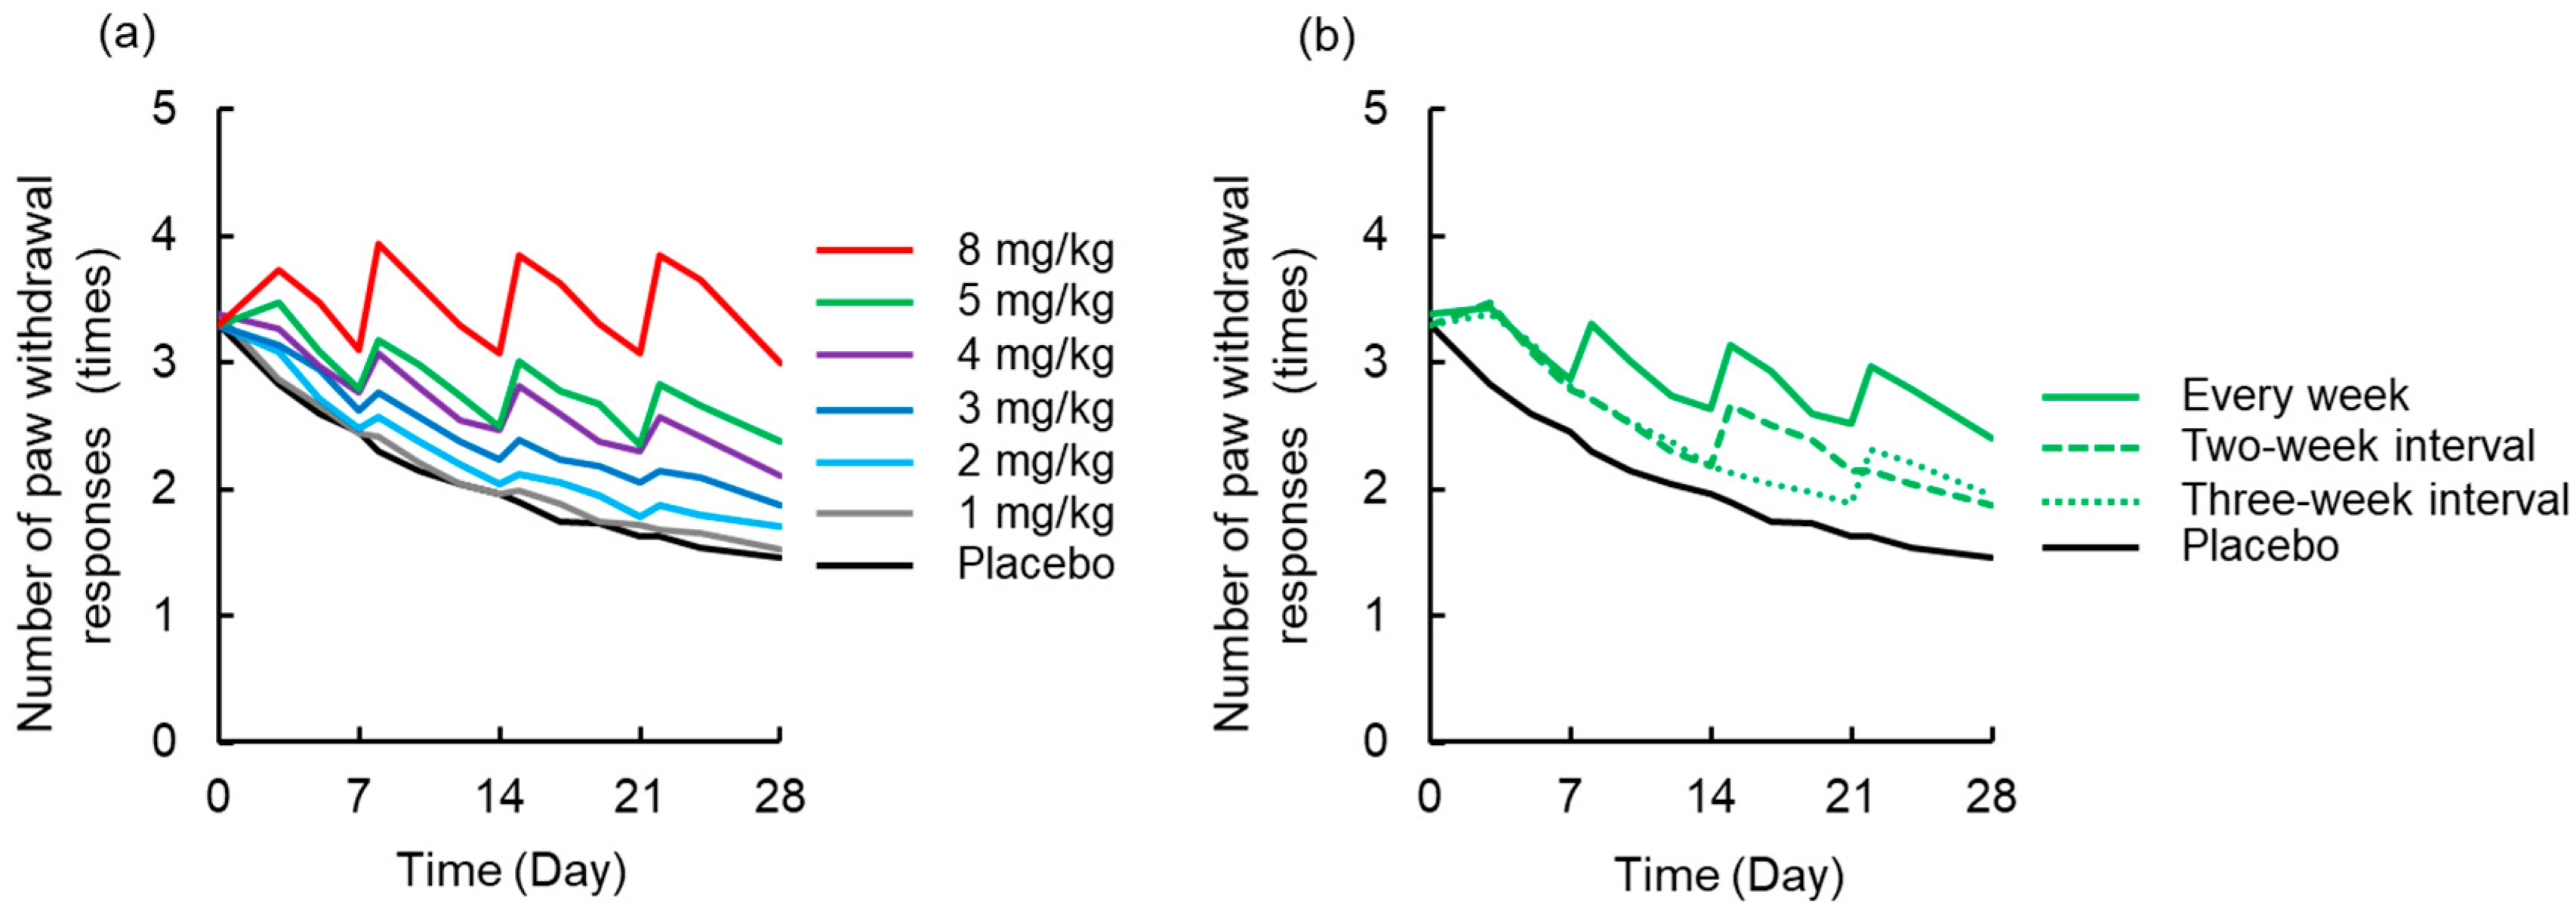
3.4. Simulation to Assess the Effects of Dosing Schedule on Neuropathy
4. Discussion
5. Conclusions
Supplementary Materials
Author Contributions
Funding
Acknowledgments
Conflicts of Interest
References
- TAndré, T.; Boni, C.; Mounedji-Boudiaf, L.; Navarro, M.; Tabernero, J.; Hickish, T.; Topham, C.; Zaninelli, M.; Clingan, P.; Bridgewater, J.; et al. Multicenter International Study of Oxaliplatin/5-Fluorouracil/Leucovorin in the Adjuvant Treatment of Colon Cancer (MOSAIC) Investigators. Oxaliplatin, fluorouracil, and leucovorin as adjuvant treatment for colon cancer. N. Engl. J. Med. 2004, 350, 2343–2351. [Google Scholar] [CrossRef] [PubMed] [Green Version]
- Pinter, T.; Klippel, Z.; Cesas, A.; Croitoru, A.; Decaestecker, J.; Gibbs, P.; Hotko, Y.; Jassem, J.; Kurteva, G.; Novotny, J.; et al. Phase III, Randomized, Double-Blind, Placebo-Controlled Trial of Pegfilgrastim in Patients Receiving First-Line FOLFOX/Bevacizumab or FOLFIRI/Bevacizumab for Locally Advanced or Metastatic Colorectal Cancer: Final Results of the Pegfilgrastim and Anti-VEGF Evaluation Study (PAVES). Clin. Colorectal Cancer 2017, 16, 103–114. [Google Scholar] [PubMed]
- Degirmencioglu, S.; Tanrıverdi, O.; Demiray, A.G.; Senol, H.; Dogu, G.G.; Yaren, A. Retrospective comparison of efficacy and safety of CAPOX and FOLFOX regimens as adjuvant treatment in patients with stage III colon cancer. J. Int. Med. Res. 2019, 47, 2507–2515. [Google Scholar] [CrossRef] [PubMed]
- Chen, L.; Hao, Y.; Cong, X.; Zou, M.; Li, S.; Zhu, L.; Song, H.; Xue, Y. Peripheral Venous Blood Platelet-to-Lymphocyte Ratio (PLR) for Predicting the Survival of Patients with Gastric Cancer Treated with SOX or XELOX Regimen Neoadjuvant Chemotherapy. Technol. Cancer Res. Treat. 2019, 18. [Google Scholar] [CrossRef] [PubMed]
- Ahmed, F.; Kumari, S.; Kondapi, A.K. Evaluation of Antiproliferative Activity, Safety and Biodistribution of Oxaliplatin and 5-Fluorouracil Loaded Lactoferrin Nanoparticles for the Management of Colon Adenocarcinoma: An In Vitro and an In Vivo Study. Pharm. Res. 2018, 35, 178. [Google Scholar] [CrossRef]
- Hanada, K.; Suda, M.; Kanai, N.; Ogata, H. Pharmacokinetics and toxicodynamics of oxaliplatin in rats: Application of a toxicity factor to explain differences in the nephrotoxicity and myelosuppression induced by oxaliplatin and the other platinum antitumor derivatives. Pharm. Res. 2010, 27, 1893–1899. [Google Scholar] [CrossRef]
- McWhinney, S.R.; Goldberg, R.M.; McLeod, H.L. Platinum neurotoxicity pharmacogenetics. Mol. Cancer Ther. 2009, 8, 10–16. [Google Scholar] [CrossRef] [Green Version]
- Avan, A.; Postma, T.J.; Ceresa, C.; Avan, A.; Cavaletti, G.; Giovannetti, E.; Peters, G.J. Platinum-induced neurotoxicity and preventive strategies: Past, present, and future. Oncologist 2015, 20, 411–432. [Google Scholar] [CrossRef] [Green Version]
- Nakagawa, T.; Kaneko, S. Roles of Transient Receptor Potential Ankyrin 1 in Oxaliplatin-Induced Peripheral Neuropathy. Biol. Pharm. Bull. 2017, 40, 947–953. [Google Scholar] [CrossRef] [Green Version]
- Adelsberger, H.; Quasthoff, S.; Grosskreutz, J.; Lepier, A.; Eckel, F.; Lersch, C. The chemotherapeutic oxaliplatin alters voltage-gated Na(+) channel kinetics on rat sensory neurons. Eur. J. Pharmacol. 2000, 406, 25–32. [Google Scholar] [CrossRef]
- Benoit, E.; Brienza, S.; Dubois, J.M. Oxaliplatin, an anticancer agent that affects both Na+ and K+ channels in frog peripheral myelinated axons. Gen. Physiol. Biophys. 2006, 25, 263–276. [Google Scholar] [PubMed]
- Grolleau, F.; Gamelin, L.; Boisdron-Celle, M.; Lapied, B.; Pelhate, M.; Gamelin, E. A possible explanation for a neurotoxic effect of the anticancer agent oxaliplatin on neuronal voltage-gated sodium channels. J. Neurophysiol. 2001, 85, 2293–2297. [Google Scholar] [CrossRef] [PubMed]
- Kagiava, A.; Tsingotjidou, A.; Emmanouilides, C.; Theophilidis, G. The effects of oxaliplatin, an anticancer drug, on potassium channels of the peripheral myelinated nerve fibres of the adult rat. Neurotoxicology 2008, 29, 1100–1116. [Google Scholar] [CrossRef] [PubMed]
- Cersosimo, R.J. Oxaliplatin-associated neuropathy: A review. Ann. Pharmacother. 2005, 39, 128–135. [Google Scholar] [CrossRef]
- Argyriou, A.A.; Cavaletti, G.; Antonacopoulou, A.; Genazzani, A.A.; Briani, C.; Bruna, J.; Terrazzino, S.; Velasco, R.; Alberti, P.; Campagnolo, M.; et al. Voltage-gated sodium channel polymorphisms play a pivotal role in the development of oxaliplatin-induced peripheral neurotoxicity: Results from a prospective multicenter study. Cancer 2013, 119, 3570–3577. [Google Scholar] [CrossRef]
- Grothey, A.; Nikcevich, D.A.; Sloan, J.A.; Kugler, J.W.; Silberstein, P.T.; Dentchev, T.; Wender, D.B.; Novotny, P.J.; Chitaley, U.; Alberts, S.R.; et al. Intravenous calcium and magnesium for oxaliplatin-induced sensory neurotoxicity in adjuvant colon cancer: NCCTG N04C7. J. Clin. Oncol. 2011, 29, 421–427. [Google Scholar] [CrossRef]
- Kurniali, P.C.; Luo, L.G.; Weitberg, A.B. Role of calcium/magnesium infusion in oxaliplatin-based chemotherapy for colorectal cancer patients. Oncology 2010, 24, 289–292. [Google Scholar]
- Dworkin, R.H.; O’Connor, A.B.; Backonja, M.; Farrar, J.T.; Finnerup, N.B.; Jensen, T.S.; Kalso, E.A.; Loeser, J.D.; Miaskowski, C.; Nurmikko, T.J.; et al. Pharmacologic management of neuropathic pain: Evidence-based recommendations. Pain 2007, 132, 237–251. [Google Scholar] [CrossRef]
- Rao, R.D.; Michalak, J.C.; Sloan, J.A.; Loprinzi, C.L.; Soori, G.S.; Nikcevich, D.A.; Warner, D.O.; Novotny, P.; Kutteh, L.A.; Wong, G.Y. North Central Cancer Treatment Group. Efficacy of gabapentin in the management of chemotherapy-induced peripheral neuropathy: A phase 3 randomized, double-blind, placebo-controlled, crossover trial (N00C3). Cancer 2007, 110, 2110–2118. [Google Scholar] [CrossRef]
- Kanat, O.; Ertas, H.; Caner, B. Platinum-induced neurotoxicity: A review of possible mechanisms. World J Clin. Oncol. 2017, 8, 329–335. [Google Scholar] [CrossRef]
- Saif, M.W.; Reardon, J. Management of oxaliplatin-induced peripheral neuropathy. Ther. Clin. Risk Manag. 2005, 1, 249–258. [Google Scholar] [PubMed]
- Jamieson, S.M.; Liu, J.; Connor, B.; McKeage, M.J. Oxaliplatin causes selective atrophy of a subpopulation of dorsal root ganglion neurons without inducing cell loss. Cancer Chemother. Pharmacol. 2005, 56, 391–399. [Google Scholar] [CrossRef] [PubMed]
- Ito, Y.; Kobuchi, S.; Shimizu, R.; Katsuyama, Y. Pharmacokinetic and toxicodynamic evaluation of oxaliplatin-induced neuropathy and hematological toxicity in rats. Cancer Chemother. Pharmacol. 2018, 81, 155–161. [Google Scholar] [CrossRef] [PubMed]
- Kobuchi, S.; Katsuyama, Y.; Ito, Y. Mechanism-based pharmacokinetic-pharmacodynamic (PK-PD) modeling and simulation of oxaliplatin for hematological toxicity in rats. Xenobiotica 2019, in press. [Google Scholar] [CrossRef] [PubMed]
- Kobuchi, S.; Ito, Y.; Hayakawa, T.; Nishimura, A.; Shibata, N.; Takada, K.; Sakaeda, T. Pharmacokinetic-pharmacodynamic (PK-PD) modeling and simulation of 5-fluorouracil for erythropenia in rats. J. Pharmacol. Toxicol. Methods 2014, 70, 134–144. [Google Scholar] [CrossRef]
- Friberg, L.E.; Freijs, A.; Sandström, M.; Karlsson, M.O. Semiphysiological model for the time course of leukocytes after varying schedules of 5-fluorouracil in rats. J. Pharmacol. Exp. Ther. 2000, 295, 734–740. [Google Scholar]
- Fujita, S.; Ushio, S.; Ozawa, N.; Masuguchi, K.; Kawashiri, T.; Oishi, R.; Egashira, N. Exenatide Facilitates Recovery from Oxaliplatin-Induced Peripheral Neuropathy in Rats. PLoS ONE 2015, 10, e0141921. [Google Scholar] [CrossRef]
- Minakata, K.; Nozawa, H.; Suzuki, M.; Gonmori, K.; Yamagishi, I.; Watanabe, K.; Suzuki, O. Trace analysis of platinum in blood and urine by ESI-MS-MS. Forensic Toxicol. 2007, 25, 84–87. [Google Scholar] [CrossRef]
- Flatters, S.J.; Bennett, G.J. Ethosuximide reverses paclitaxeland vincristine-induced painful peripheral neuropathy. Pain 2004, 109, 150–161. [Google Scholar] [CrossRef]
- Di Cesare Mannelli, L.; Pacini, A.; Bonaccini, L.; Zanardelli, M.; Mello, T.; Ghelardini, C. Morphologic features and glial activation in rat oxaliplatin-dependent neuropathic pain. J. Pain 2013, 14, 1585–1600. [Google Scholar] [CrossRef]
- Mould, D.R.; Upton, R.N. Basic concepts in population modeling, simulation, and model-based drug development-part 2: Introduction to pharmacokinetic modeling methods. CPT Pharmacometri. Syst. Pharmacol. 2013, 2, e38. [Google Scholar] [CrossRef] [PubMed]
- Mas-Fuster, M.I.; Ramon-Lopez, A.; Lacueva, F.J.; Arroyo, A.; Más-Serrano, P.; Nalda-Molina, R. Population pharmacokinetics of oxaliplatin after intraperitoneal administration with hyperthermia in Wistar rats. Eur. J. Pharm. Sci. 2018, 119, 22–30. [Google Scholar] [CrossRef] [PubMed]
- Kobuchi, S.; Ito, Y.; Sakaeda, T. Population Pharmacokinetic-Pharmacodynamic Modeling of 5-Fluorouracil for Toxicities in Rats. Eur. J. Drug Metab. Pharmacokinet. 2017, 42, 707–718. [Google Scholar] [CrossRef] [PubMed]
- Chen, J.; Lu, Q.; Balthasar, J.P. Mathematical modeling of topotecan pharmacokinetics and toxicodynamics in mice. J. Pharmacokinet. Pharmacodyn. 2007, 34, 829–847. [Google Scholar] [CrossRef] [PubMed]
- Gao, W.; Jusko, W.J. Modeling disease progression and rosiglitazone intervention in type 2 diabetic Goto-Kakizaki rats. J. Pharmacol. Exp. Ther. 2012, 341, 617–625. [Google Scholar] [CrossRef] [Green Version]
- Sharma, A.; Jusko, W.J. Characteristics of indirect pharmacodynamic models and applications to clinical drug responses. Br. J. Clin. Pharmacol. 1998, 45, 229–239. [Google Scholar] [CrossRef] [Green Version]
- Mager, D.E.; Jusko, W.J. Pharmacodynamic modeling of time-dependent transduction systems. Clin. Pharmacol. Ther. 2001, 70, 210–216. [Google Scholar] [CrossRef]
- Bergstrand, M.; Hooker, A.C.; Wallin, J.E.; Karlsson, M.O. Prediction-corrected visual predictive checks for diagnosing nonlinear mixed-effects models. AAPS J. 2011, 13, 143–151. [Google Scholar] [CrossRef] [Green Version]
- Chalret du Rieu, Q.; White-Koning, M.; Picaud, L.; Lochon, I.; Marsili, S.; Gladieff, L.; Chatelut, E.; Ferron, G. Population pharmacokinetics of peritoneal, plasma ultrafiltrated and protein-bound oxaliplatin concentrations in patients with disseminated peritoneal cancer after intraperitoneal hyperthermic chemoperfusion of oxaliplatin following cytoreductive surgery: Correlation between oxaliplatin exposure and thrombocytopenia. Cancer Chemother. Pharmacol. 2014, 74, 571–582. [Google Scholar]
- Nikanjam, M.; Stewart, C.F.; Takimoto, C.H.; Synold, T.W.; Beaty, O.; Fouladi, M.; Capparelli, E.V. Population pharmacokinetic analysis of oxaliplatin in adults and children identifies important covariates for dosing. Cancer Chemother. Pharmacol. 2015, 75, 495–503. [Google Scholar] [CrossRef] [Green Version]
- Gauchan, P.; Andoh, T.; Kato, A.; Kuraishi, Y. Involvement of increased expression of transient receptor potential melastatin 8 in oxaliplatin-induced cold allodynia in mice. Neurosci. Lett. 2009, 458, 93–95. [Google Scholar] [CrossRef] [PubMed]
- Zhao, M.; Nakamura, S.; Miyake, T.; So, K.; Shirakawa, H.; Tokuyama, S.; Narita, M.; Nakagawa, T.; Kaneko, S. Pharmacological characterization of standard analgesics on oxaliplatin-induced acute cold hypersensitivity in mice. J. Pharmacol. Sci. 2014, 124, 514–517. [Google Scholar] [CrossRef] [PubMed] [Green Version]
- Ushio, S.; Egashira, N.; Sada, H.; Kawashiri, T.; Shirahama, M.; Masuguchi, K.; Oishi, R. Goshajinkigan reduces oxaliplatin-induced peripheral neuropathy without affecting anti-tumour efficacy in rodents. Eur. J. Cancer 2012, 48, 1407–1413. [Google Scholar] [CrossRef] [PubMed]
- Storey, D.J.; Sakala, M.; McLean, C.M.; Phillips, H.A.; Dawson, L.K.; Wall, L.R.; Fallon, M.T.; Clive, S. Capecitabine combined with oxaliplatin (CapOx) in clinical practice: How significant is peripheral neuropathy? Ann. Oncol. 2010, 21, 1657–1661. [Google Scholar] [CrossRef]
- Schmoll, H.J.; Cartwright, T.; Tabernero, J.; Nowacki, M.P.; Figer, A.; Maroun, J.; Price, T.; Lim, R.; Van Cutsem, E.; Park, Y.S.; et al. Phase III trial of capecitabine plus oxaliplatin as adjuvant therapy for stage III colon cancer: A planned safety analysis in 1864 patients. J. Clin. Oncol. 2007, 25, 102–109. [Google Scholar] [CrossRef]
- Gebremedhn, E.G.; Shortland, P.J.; Mahns, D.A. The incidence of acute oxaliplatin-induced neuropathy and its impact on treatment in the first cycle: A systematic review. BMC Cancer 2018, 18, 410. [Google Scholar] [CrossRef] [Green Version]
- Sun, Y.N.; Jusko, W.J. Transit compartments versus gamma distribution function to model signal transduction processes in pharmacodynamics. J. Pharm. Sci. 1998, 87, 732–737. [Google Scholar] [CrossRef]
- Simeoni, M.; Magni, P.; Cammia, C.; De Nicolao, G.; Croci, V.; Pesenti, E.; Germani, M.; Poggesi, I.; Rocchetti, M. Predictive pharmacokinetic–pharmacodynamic modeling of tumor growth kinetics in xenograft models after administration of anticancer agents. Cancer Res. 2004, 64, 1094–1101. [Google Scholar] [CrossRef] [Green Version]
- Friberg, L.E.; Henningsson, A.; Maas, H.; Nguyen, L.; Karlsson, M.O. Model of chemotherapy-induced myelosuppression with parameter consistency across drugs. J. Clin. Oncol. 2002, 20, 4713–4721. [Google Scholar] [CrossRef]
- Carozzi, V.A.; Canta, A.; Chiorazzi, A. Chemotherapy-induced peripheral neuropathy: What do we know about mechanisms? Neurosci. Lett. 2015, 596, 90–107. [Google Scholar] [CrossRef]
- Puchalski, T.A.; Krzyzanski, W.; Blum, R.A.; Jusko, W.J. Pharmacodynamic modeling of lansoprazole using an indirect irreversible response model. J. Clin. Pharmacol. 2001, 41, 251–258. [Google Scholar] [CrossRef] [PubMed]
- Park, S.R.; Kim, M.J.; Nam, B.H.; Kim, C.G.; Lee, J.Y.; Cho, S.J.; Kong, S.Y.; Park, Y.I. A randomised phase II study of continuous versus stop-and-go S-1 plus oxaliplatin following disease stabilisation in first-line chemotherapy in patients with metastatic gastric cancer. Eur. J. Cancer 2017, 83, 32–42. [Google Scholar] [CrossRef] [PubMed]
- Starobova, H.; Vetter, I. Pathophysiology of Chemotherapy-Induced Peripheral Neuropathy. Front. Mol. Neurosci. 2017, 10, 174. [Google Scholar] [CrossRef] [PubMed]


| Parameters | Unit | Final Model | Bootstrap | ||||
|---|---|---|---|---|---|---|---|
| Estimate | CV% | Median | 5th–95th Percentiles | ||||
| Fixed effect parameters, θ | |||||||
| V | mL·kg−1 | 357.8 | 15.7 | 354.8 | 284.2 | - | 410.9 |
| ke | h−1 | 3.4 | 15.1 | 3.4 | 2.5 | - | 4.2 |
| k12 | h−1 | 2.6 | 34.2 | 2.7 | 1.9 | - | 4.3 |
| k21 | h−1 | 1.1 | 30.1 | 1.1 | 0.6 | - | 1.5 |
| Inter-individual variability, ω | |||||||
| V | % | 42.4 | 47.0 | 41.5 | 24.1 | - | 50.4 |
| ke | % | 40.6 | 93.9 | 36.4 | 0.01 | - | 57.0 |
| k12 | % | 54.3 | 148.5 | 50.2 | 0.01 | - | 95.2 |
| k21 | % | 91.0 | 56.8 | 91.0 | 58.5 | - | 130.8 |
| Residual variability, σ | |||||||
| C | % | 21.9 | 13.1 | 22.0 | 17.9 | - | 25.7 |
| Parameters | Unit | Final Model | Bootstrap | ||||
|---|---|---|---|---|---|---|---|
| Estimate | CV% | Median | 2.5th–97.5th Percentiles | ||||
| Acute neuropathy | |||||||
| Fixed effect parameters, θ | |||||||
| x0,acute | times | 3.1 | Fix | 3.1 | Fix | ||
| kin,acute | times·day−1 | 0.004 | 47.2 | 0.004 | 0.0001 | - | 0.019 |
| kout,acute | day−1 | 0.06 | 24.2 | 0.06 | 0.03 | - | 0.09 |
| khandling | day−1 | 0.08 | Fix | 0.08 | Fix | ||
| Emax,acute | times·day−1 | 10.1 | 20.5 | 9.9 | 5.3 | - | 14.0 |
| EC50,acute | μg·mL−1 | 0.36 | 11.3 | 0.35 | 0.23 | - | 0.40 |
| γacute | 6 | Fix | 6 | Fix | |||
| Residual variability, σ | |||||||
| xacute in Proportional error | % | 32.1 | 3.5 | 31.9 | 29.9 | - | 33.9 |
| Chronic neuropathy | |||||||
| Fixed effect parameters, θ | |||||||
| x0,chronic | g | 8 | Fix | 8 | Fix | ||
| kin,chronic | g·day−1 | 2.7 | 0.66 | 2.8 | 2.4 | - | 3.7 |
| Emax,chronic | 168.0 | 0.67 | 127.7 | 29.8 | - | 169.3 | |
| EC50,chronic | μg·mL−1 | 0.43 | 0.67 | 0.35 | 0.21 | - | 0.68 |
| γchronic | 4 | Fix | 4 | Fix | |||
| Inter-individual variability, ω | |||||||
| kin,chronic | % | 25.2 | 27.8 | 25.1 | 4.4 | - | 25.5 |
| EC50,chronic | % | 28.2 | 40.5 | 27.9 | 0.001 | - | 28.2 |
| Residual variability, σ | |||||||
| xchronic in Additive error | g | 1.3 | 5.9 | 1.3 | 1.1 | - | 1.4 |
© 2020 by the authors. Licensee MDPI, Basel, Switzerland. This article is an open access article distributed under the terms and conditions of the Creative Commons Attribution (CC BY) license (http://creativecommons.org/licenses/by/4.0/).
Share and Cite
Kobuchi, S.; Shimizu, R.; Ito, Y. Semi-Mechanism-Based Pharmacokinetic-Toxicodynamic Model of Oxaliplatin-Induced Acute and Chronic Neuropathy. Pharmaceutics 2020, 12, 125. https://doi.org/10.3390/pharmaceutics12020125
Kobuchi S, Shimizu R, Ito Y. Semi-Mechanism-Based Pharmacokinetic-Toxicodynamic Model of Oxaliplatin-Induced Acute and Chronic Neuropathy. Pharmaceutics. 2020; 12(2):125. https://doi.org/10.3390/pharmaceutics12020125
Chicago/Turabian StyleKobuchi, Shinji, Risa Shimizu, and Yukako Ito. 2020. "Semi-Mechanism-Based Pharmacokinetic-Toxicodynamic Model of Oxaliplatin-Induced Acute and Chronic Neuropathy" Pharmaceutics 12, no. 2: 125. https://doi.org/10.3390/pharmaceutics12020125
APA StyleKobuchi, S., Shimizu, R., & Ito, Y. (2020). Semi-Mechanism-Based Pharmacokinetic-Toxicodynamic Model of Oxaliplatin-Induced Acute and Chronic Neuropathy. Pharmaceutics, 12(2), 125. https://doi.org/10.3390/pharmaceutics12020125