Elevated Cytokines, Thrombin and PAI-1 in Severe HCPS Patients Due to Sin Nombre Virus
Abstract
:1. Introduction
2. Experimental Section
2.1. Study Subjects
2.2. Materials
2.3. Cell Culture
2.4. Production of Sin Nombre Virus
2.5. Measurement of Transmonolayer Cell Resistance Electric Cell-Substrate Impedance Sensing
2.6. Transmonolayer Electrical Resistance Measurements of Monolayer Integrity
2.7. TER and Infectivity Assays
2.8. Plasma Cytokines and Chemokines
2.9. Confocal Microscopy Imaging
2.10. 2D Gel Loading and Sample Preparation
2.11. Computerized Comparisons
2.12. Data Analysis
2.13. In-Gel Digestion of Proteins
2.14. MALDI-MS Analysis
2.15. Peptide Mass Search
2.16. PAI-1 Expression in HCPS Samples
3. Results and Discussion
3.1. Cell Barrier Dysfunction Is Induced by Thrombin and Other Factors Present in HCPS Patient Plasma Samples

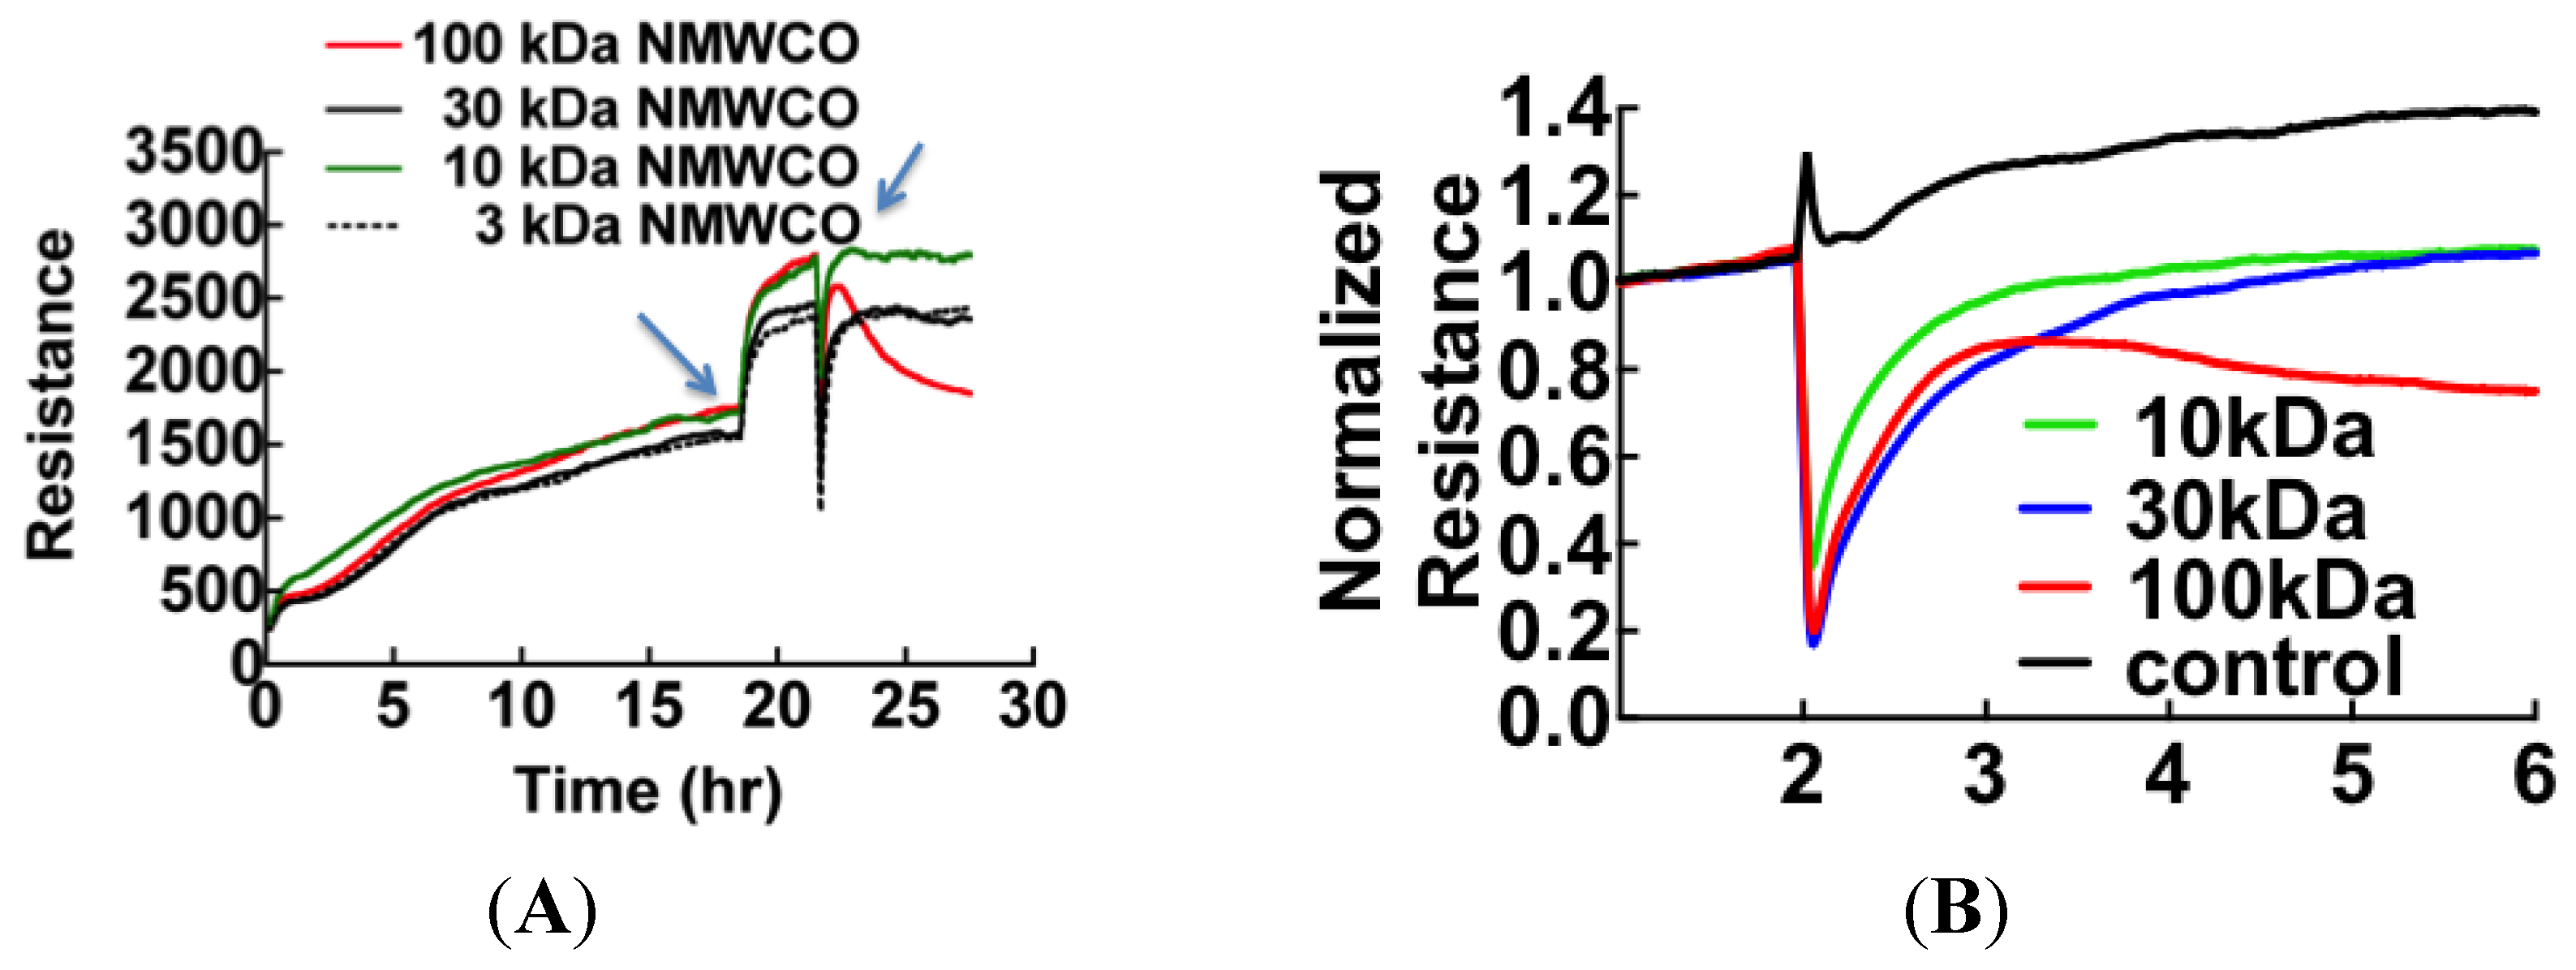
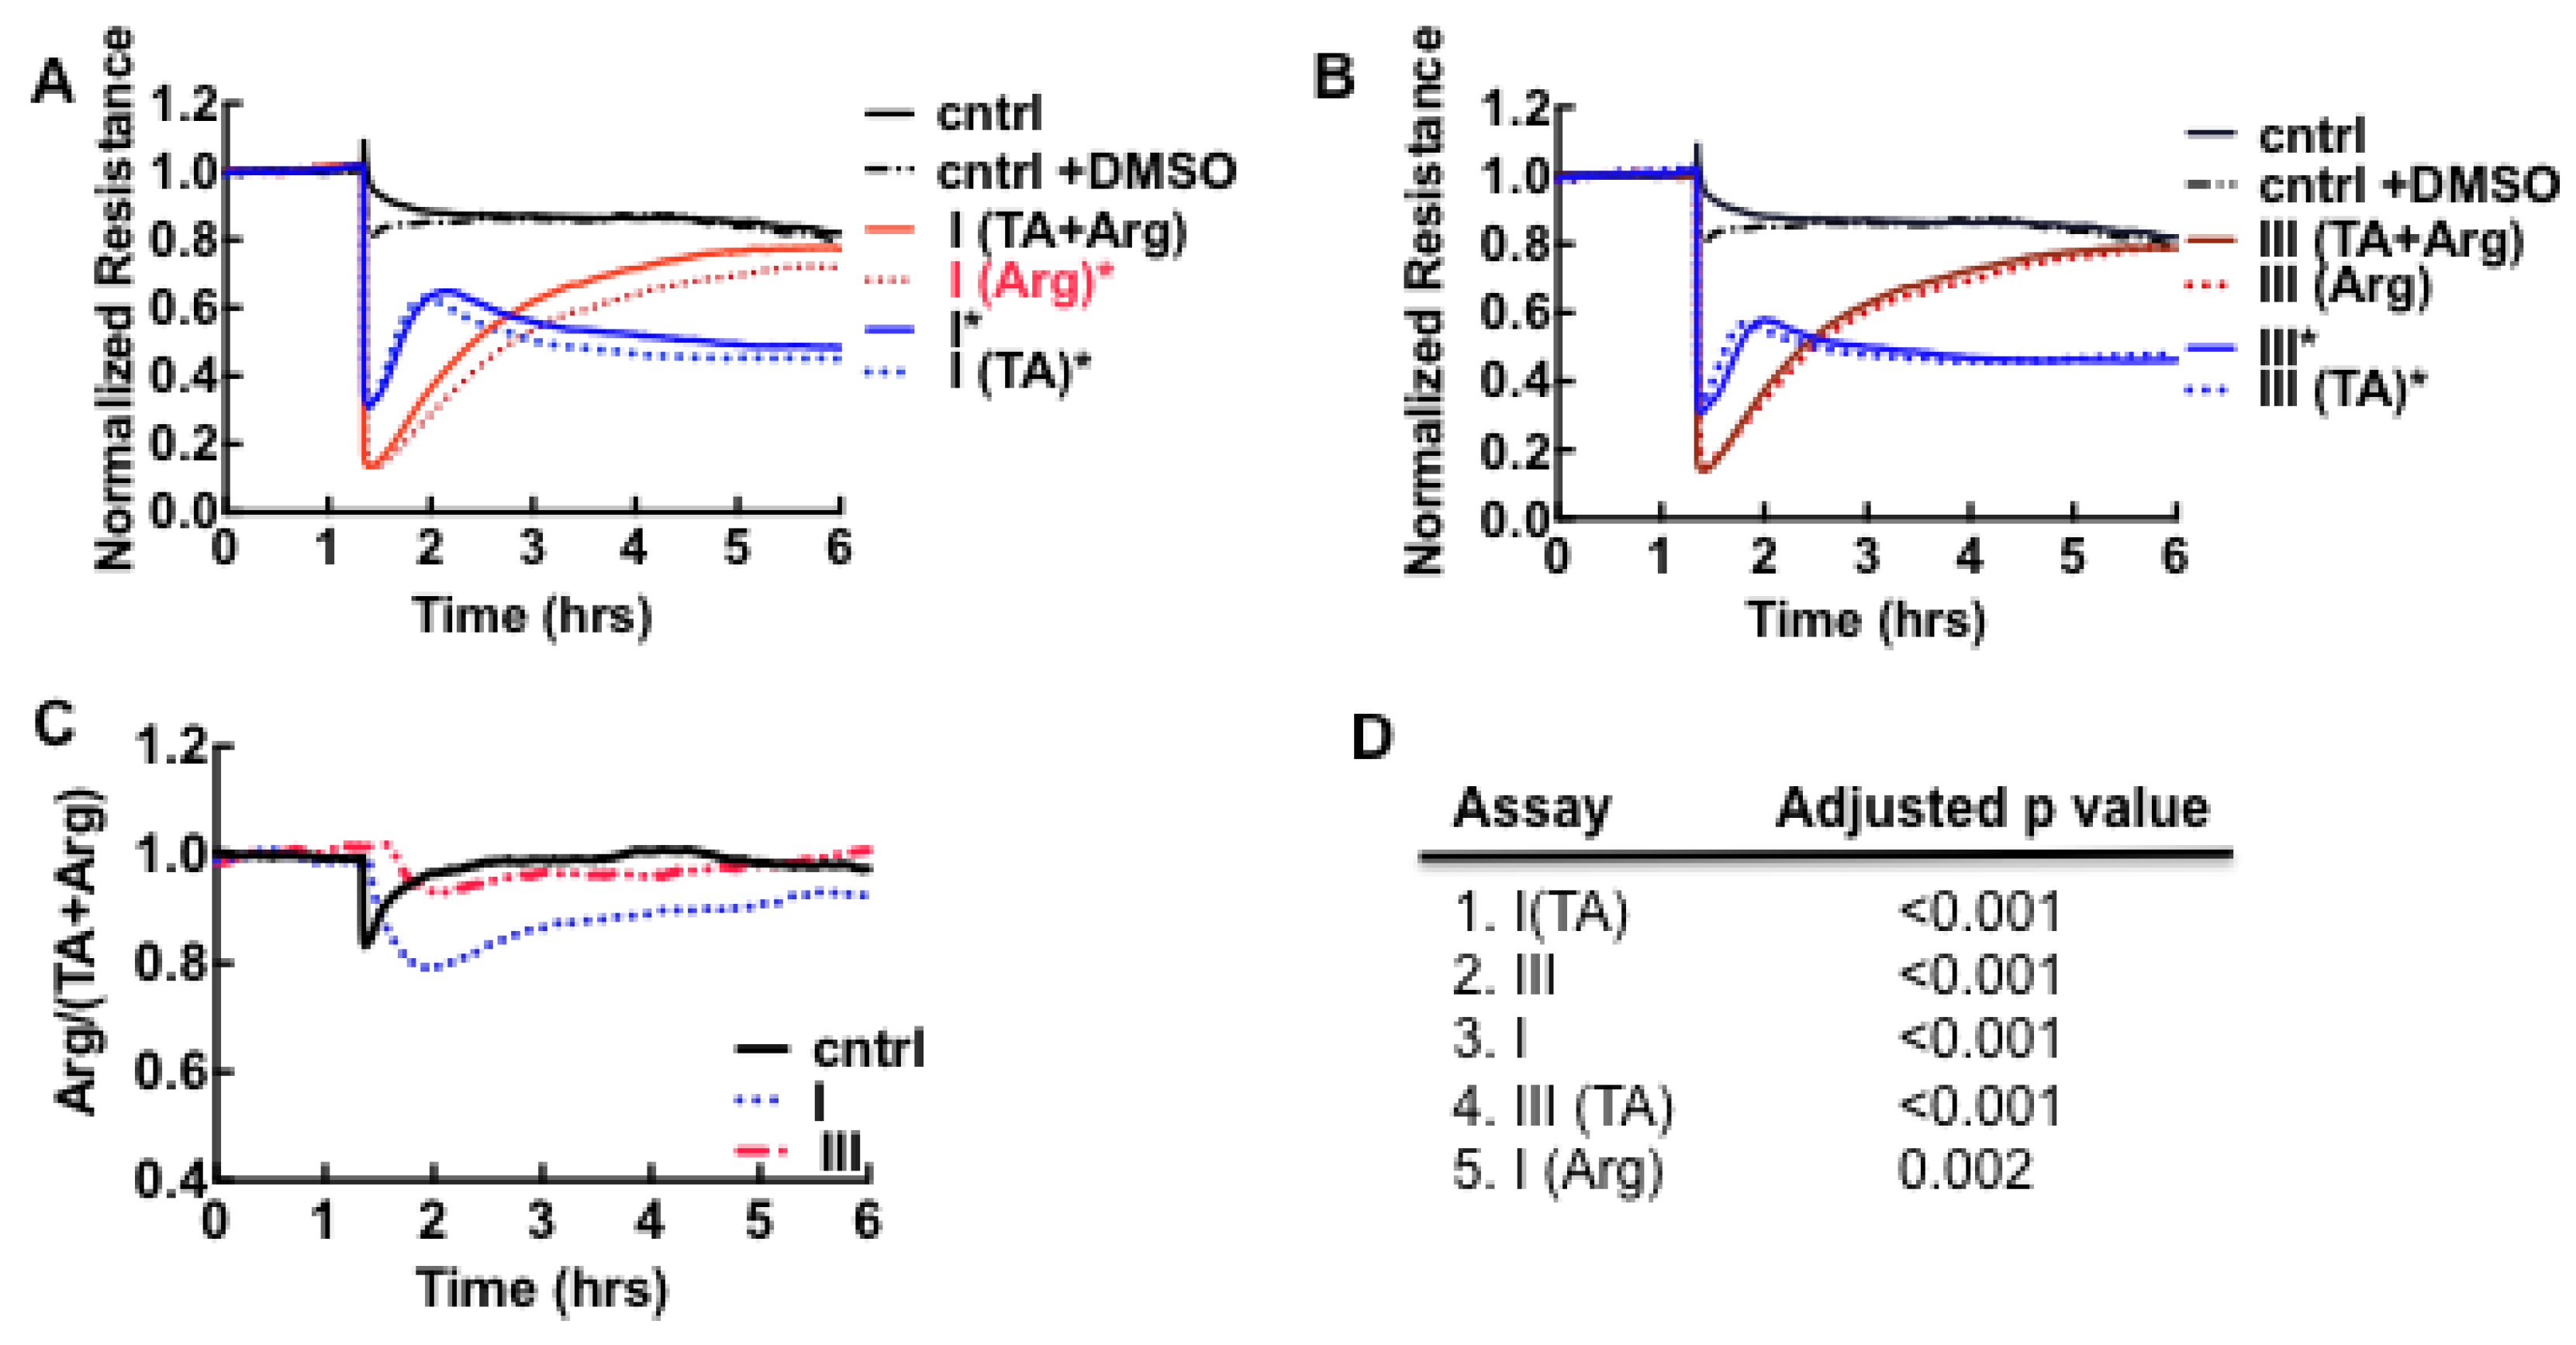

3.2. Sin Nombre Virus Disrupts Cell Barrier Function Vero E6 and Endothelial Cells in Vitro
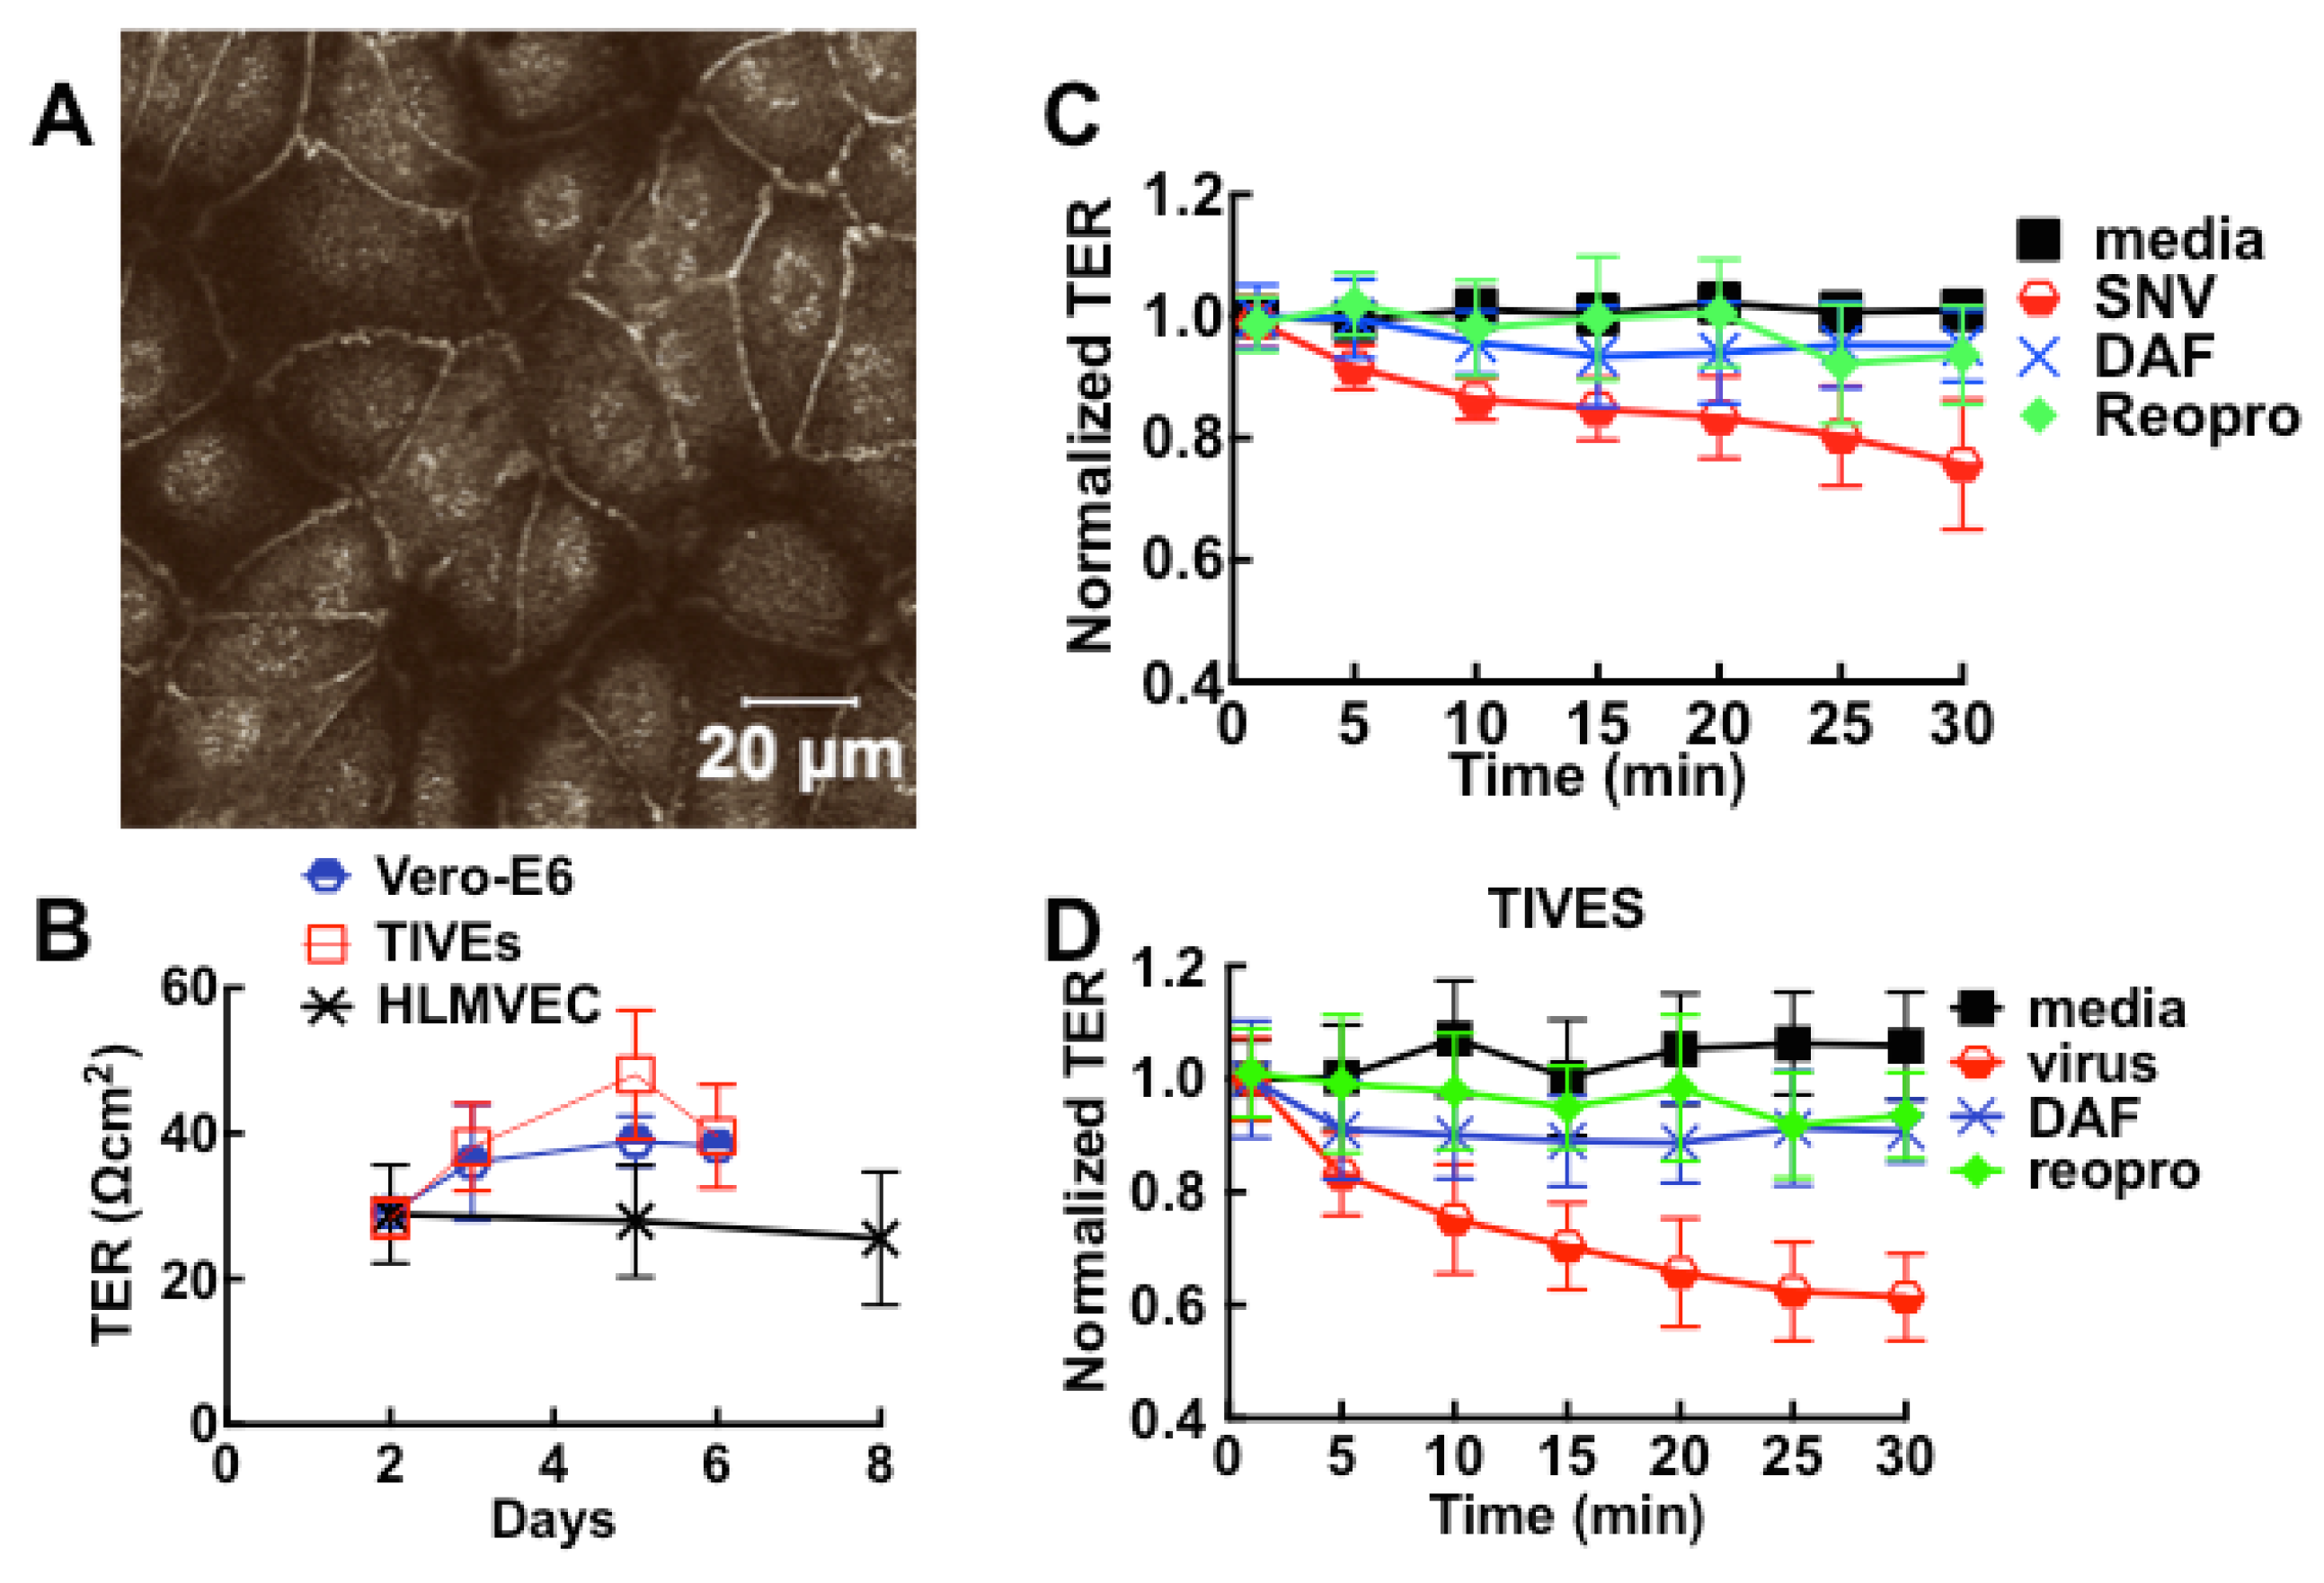
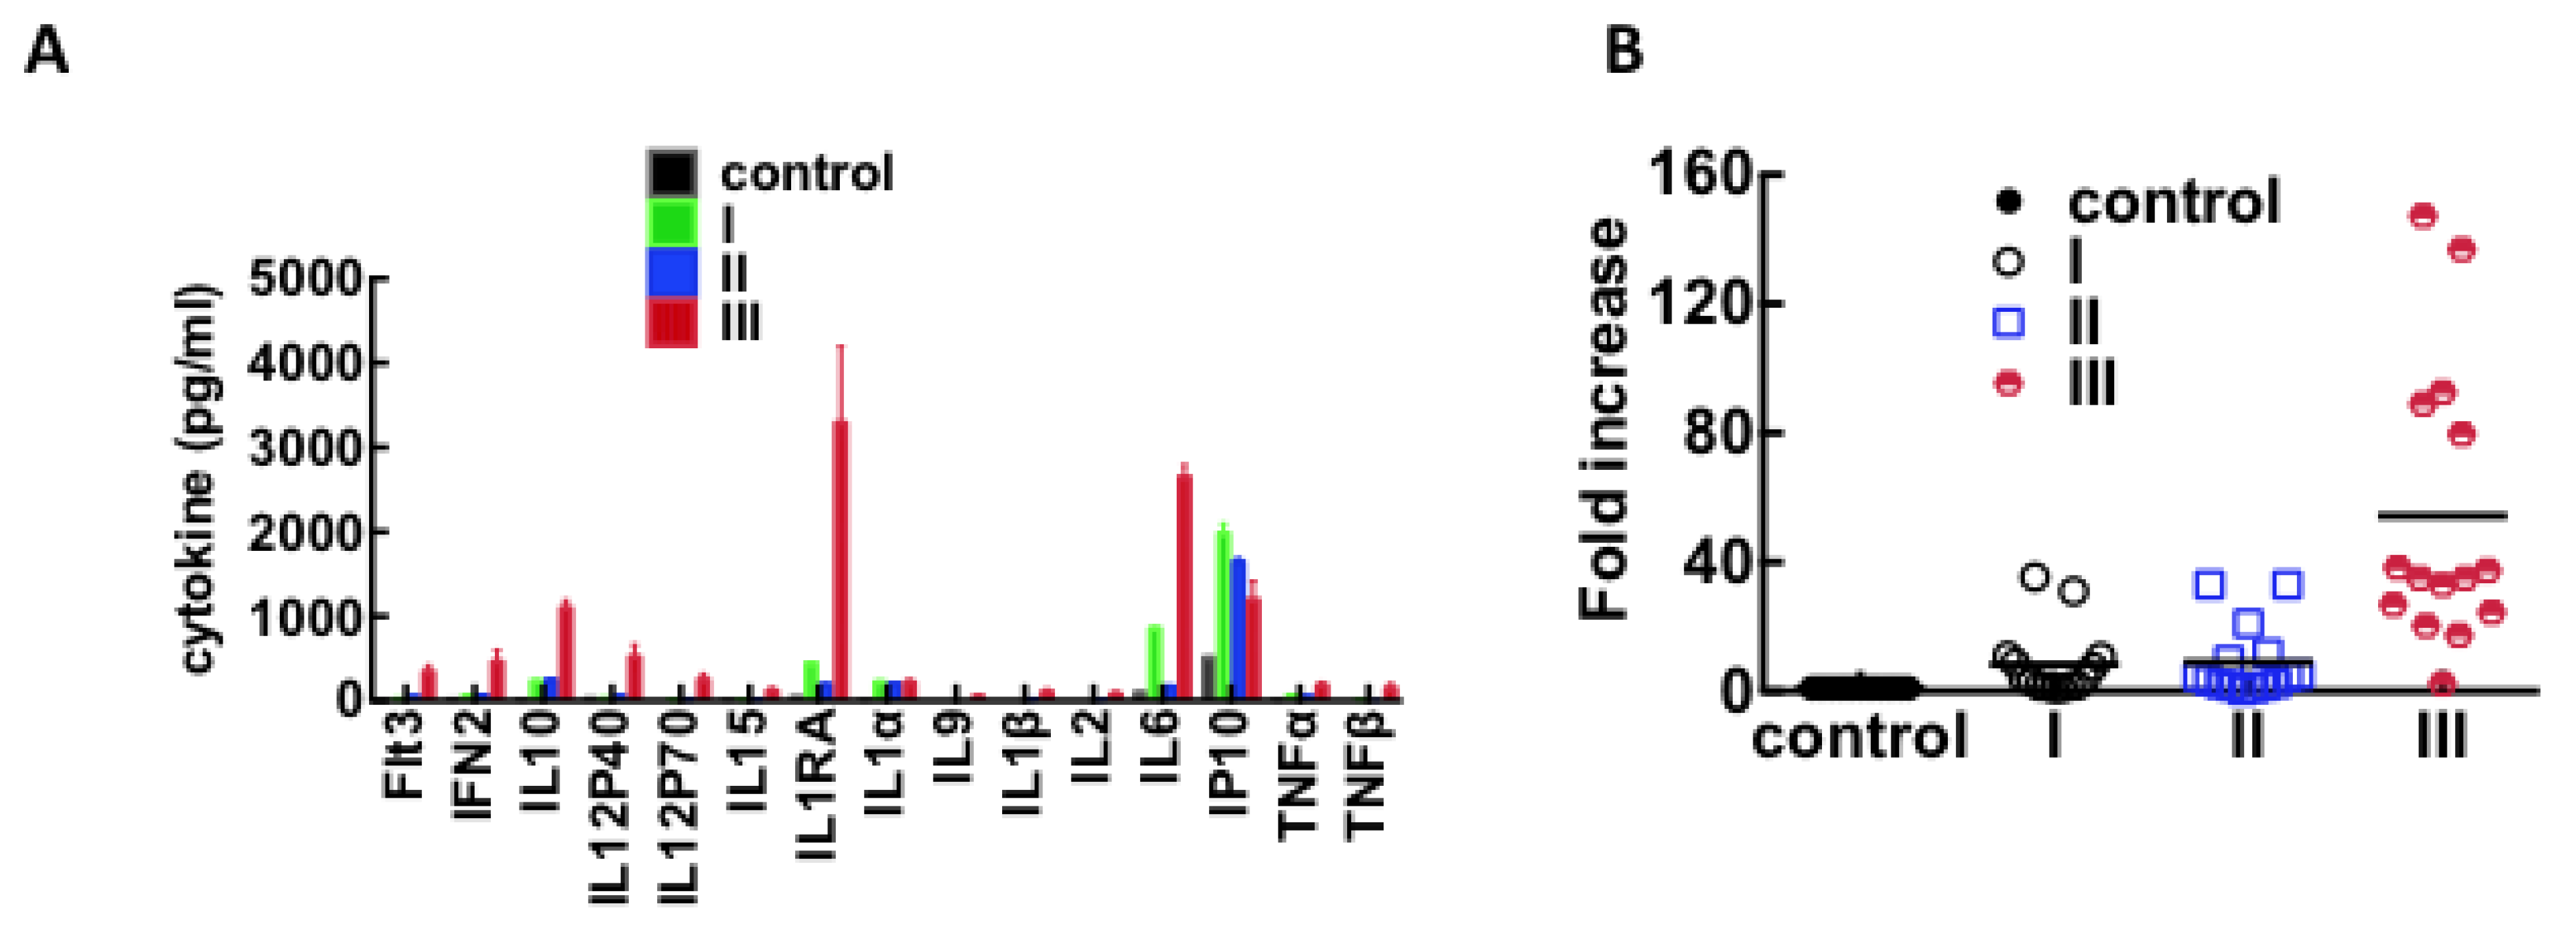
3.3. Immunological Response to Hantavirus Infection
| Cytokine | Adjusted p-Value |
|---|---|
| Flt3 | |
| control vs. II | 0.0002 |
| control vs. III | <0.0001 |
| IFN2 | |
| control vs. III | <0.0001 |
| IL10 | |
| control vs. I | <0.0001 |
| control vs. II | <0.0001 |
| control vs. III | <0.0001 |
| IL12P40 | |
| control vs. III | <0.0001 |
| IL12P70 | |
| control vs. III | <0.0001 |
| IL15 | |
| control vs. III | 0.0029 |
| IL1RA | |
| control vs. III | <0.0001 |
| IL1α | |
| control vs. I | <0.0001 |
| control vs. II | <0.0001 |
| control vs. III | <0.0001 |
| IL9 | |
| control vs. III | 0.0003 |
| IL1β | |
| control vs. III | <0.0001 |
| IL2 | |
| control vs. III | <0.0001 |
| IL6 | |
| control vs. III | <0.0001 |
| IP10 | |
| control vs. I | <0.0001 |
| control vs. II | <0.0001 |
| control vs. III | 0.0003 |
| TNFα | |
| control vs. III | <0.0001 |
| TNFβ | |
| control vs. III | <0.0001 |
3.4. Plasma Protein Profiles of HCPS Patients by 2D Gel Analysis Show that the Largest Differential Changes in Protein Expression Occurred in Class III Patients
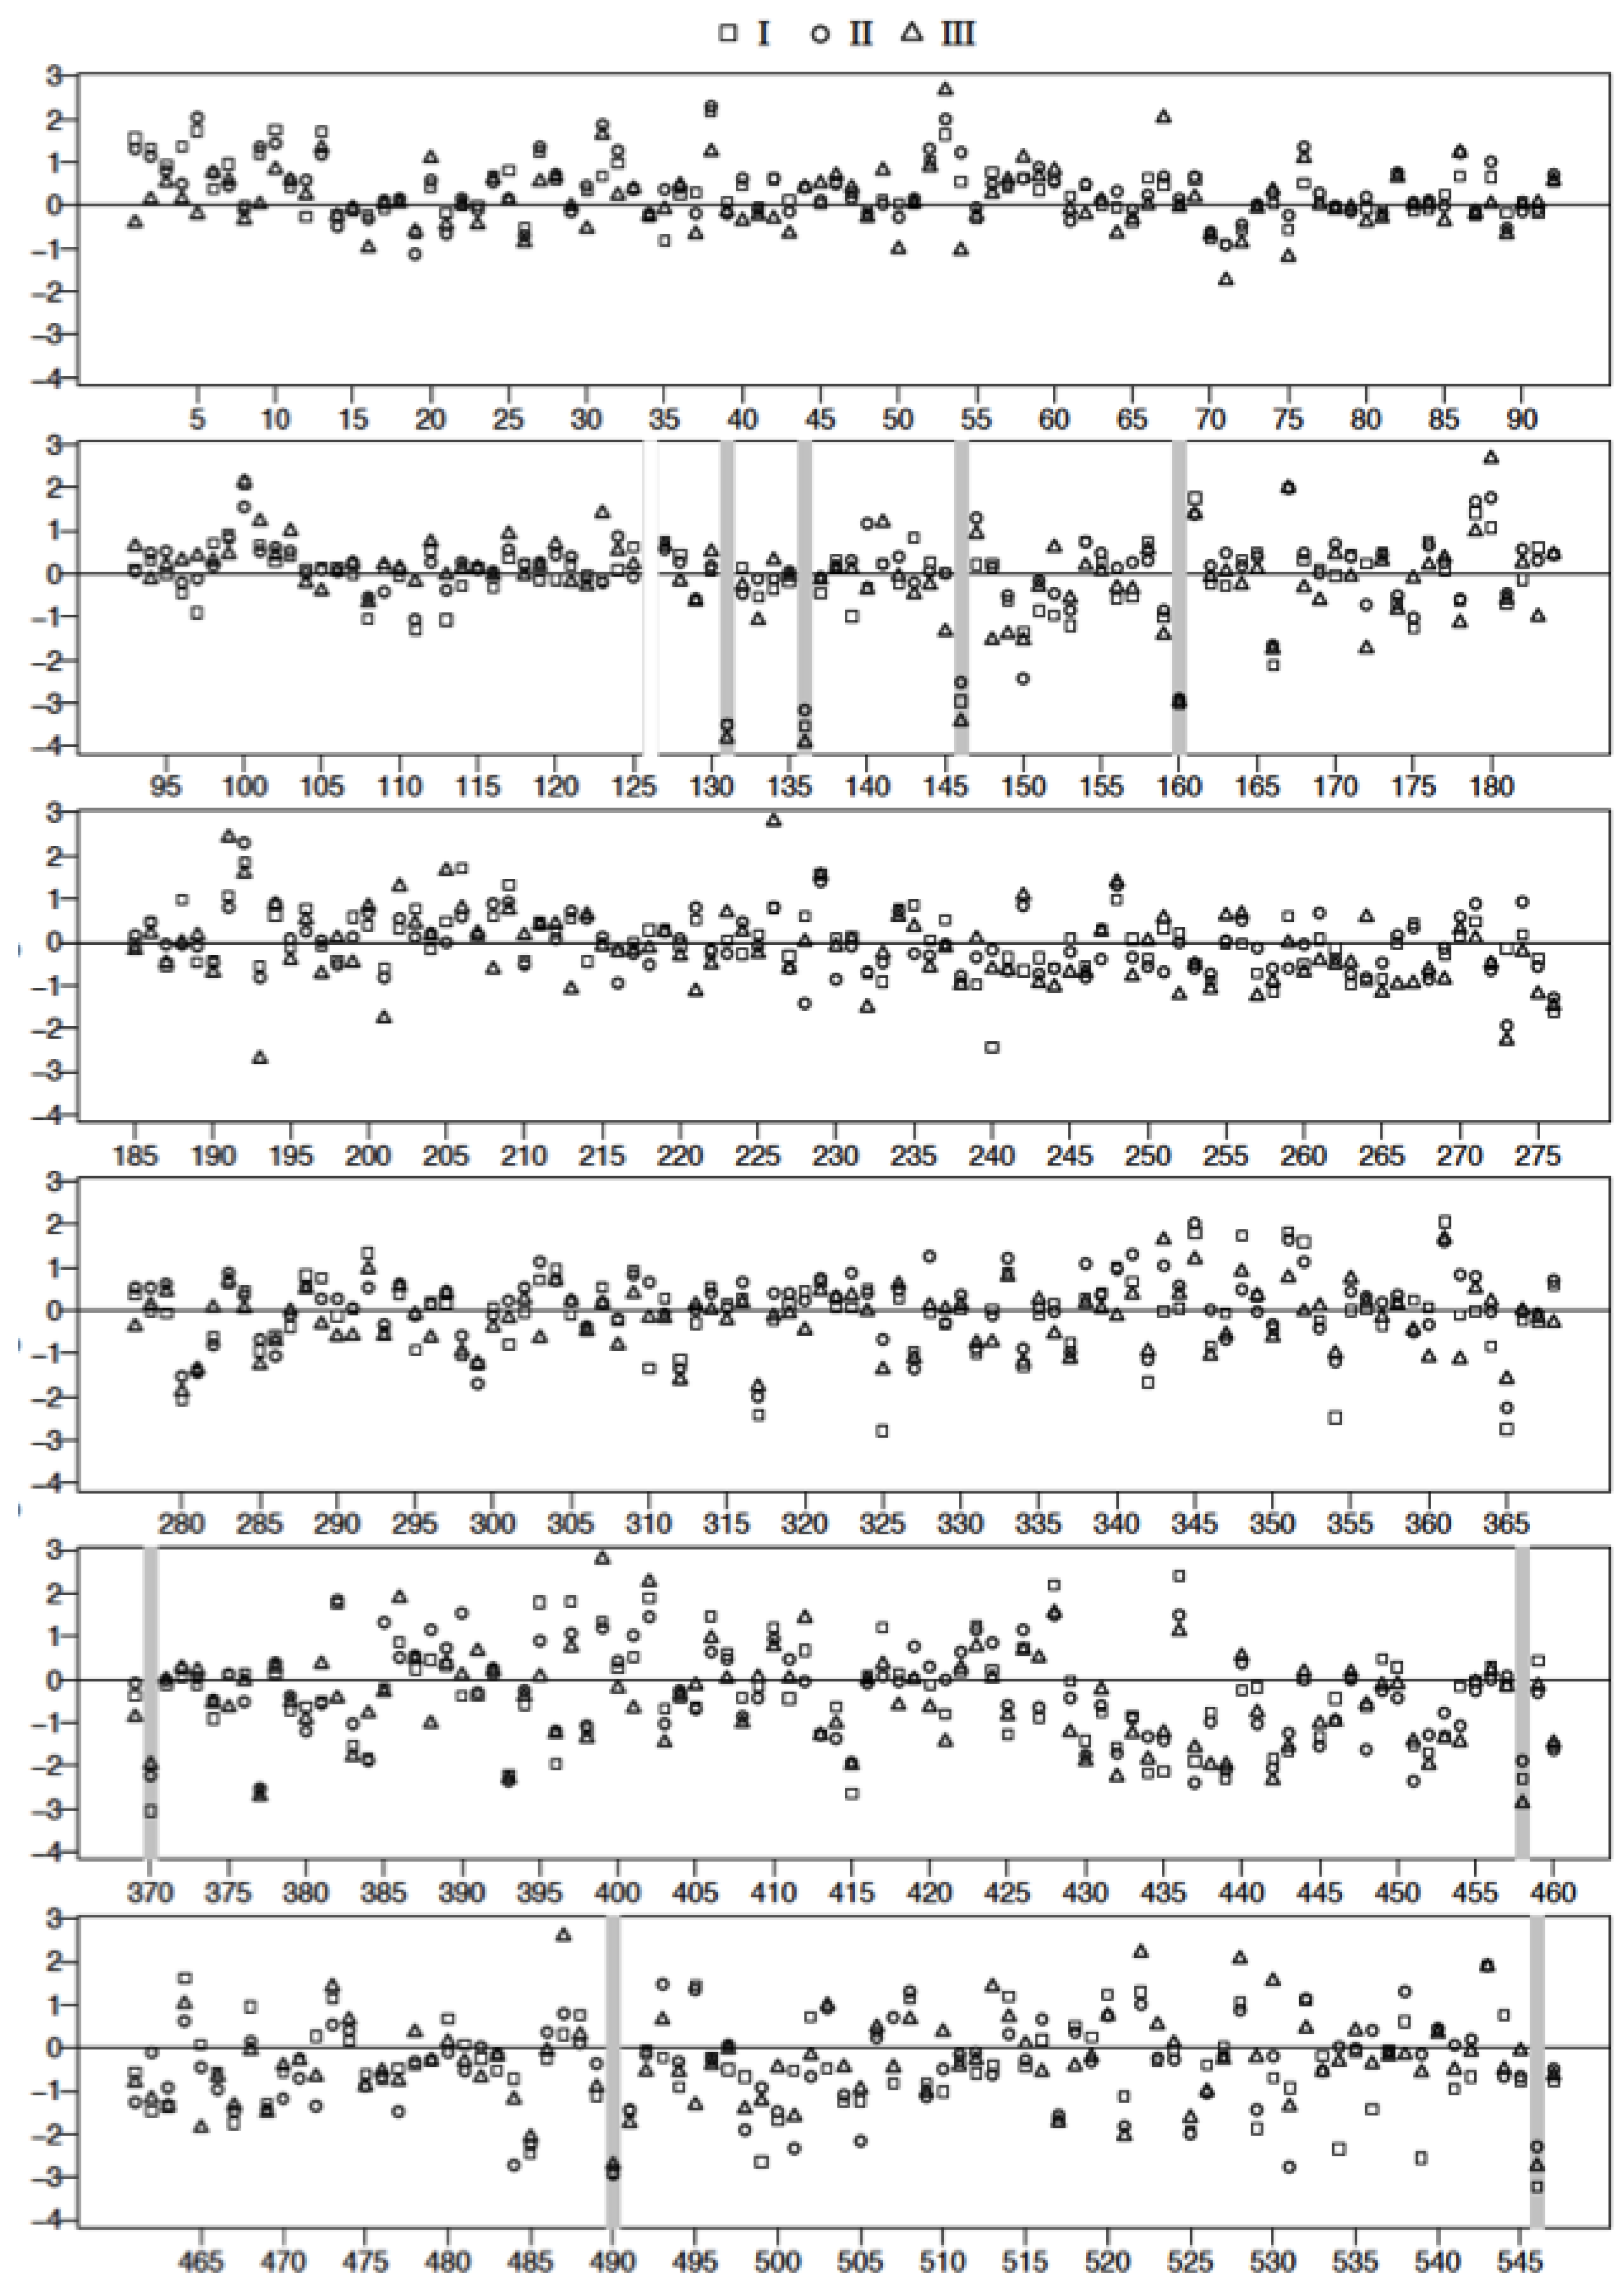
| Spot | FDR Adjusted p-Value I vs. C | FDR Adjusted p-Value II vs. C | FDR Adjusted p-Value III vs. C | Mol. Wt | ∆ Fold I | ∆ Fold II | ∆ Fold III | |
|---|---|---|---|---|---|---|---|---|
| 1 | 131 | 0.001 | 0.001 | 0.000 | 62,450 | −33.0 | −34.2 | −45.7 |
| 2 | 136 | 0.001 | 0.006 | 0.000 | 59,941 | −34.2 | −24.2 | −50.2 |
| 3 | 146 | 0.009 | 0.001 | 55,874 | −19.2 | −12.5 | −30.6 | |
| 4 | 160 | 0.008 | 0.016 | 0.012 | 54,420 | −20.3 | −18.2 | −19.4 |
| 5 | 370 | 0.007 | 26,948 | −21.2 | −9.4 | −7.2 | ||
| 6 | 458 | 0.016 | 19,388 | −9.9 | −6.7 | −17.7 | ||
| 7 | 490 | 0.012 | 0.016 | 16,089 | −17.5 | −19.1 | −15.0 | |
| 8 | 546 | 0.003 | 6744 | −25.3 | −9.9 | −15.5 |
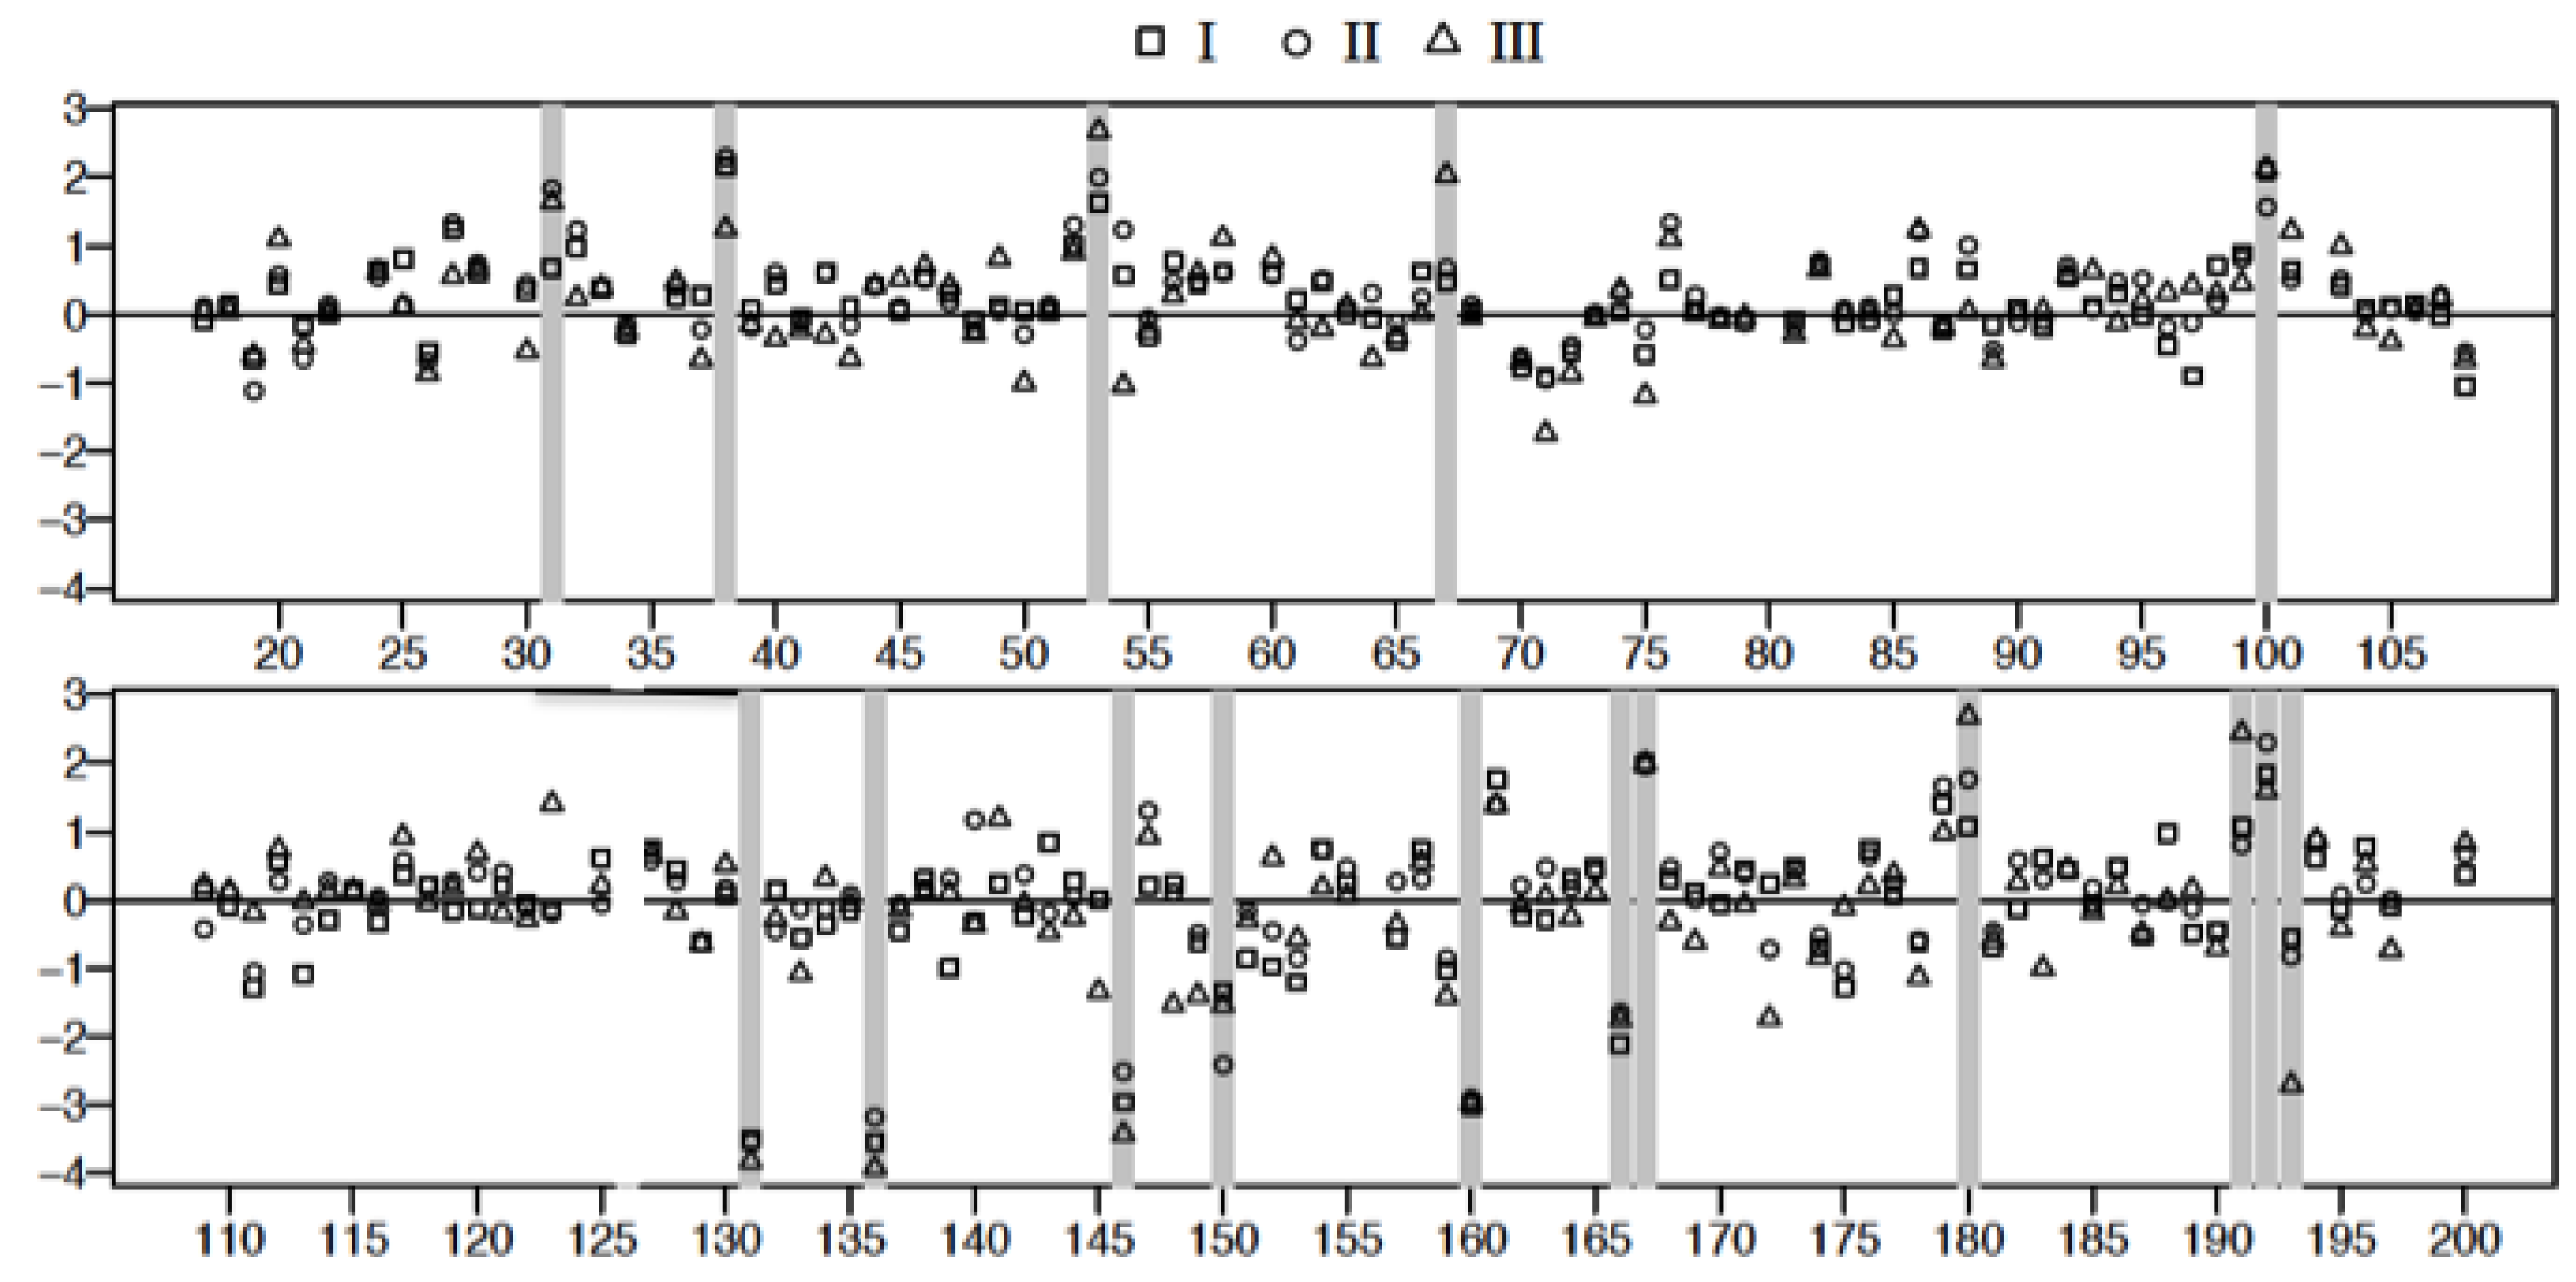
| Spot | FDR Adjusted p-Value I vs. C | FDR Adjusted p-Value II vs. C | FDR Adjusted p-Value III vs. C | Mol. Wt | ∆ Fold I | ∆ Fold II | ∆ Fold III | |
|---|---|---|---|---|---|---|---|---|
| 1 | 31 | 0.016 | 170,054 | 2.0 | 6.3 | 5.2 | ||
| 2 | 38 | 0.003 | 0.001 | 149,443 | 8.7 | 9.9 | 3.5 | |
| 3 | 53 | 0.007 | 0.000 | 117,167 | 5.1 | 7.4 | 14.5 | |
| 4 | 67 | 0.004 | 92,464 | 1.6 | 1.9 | 7.6 | ||
| 5 | 100 | 0.004 | 0.003 | 71,422 | 8.2 | 4.8 | 8.4 | |
| 6 | 131 | 0.000 | 0.000 | 0.000 | 62,450 | −33.0 | −34.2 | −45.7 |
| 7 | 136 | 0.000 | 0.000 | 0.000 | 59,941 | −34.2 | −24.2 | −50.2 |
| 8 | 146 | 0.000 | 0.000 | 0.000 | 55,874 | −19.2 | −12.5 | −30.6 |
| 9 | 150 | 0.000 | 54,232 | −3.8 | −11.4 | −4.7 | ||
| 10 | 160 | 0.000 | 0.000 | 0.000 | 54,420 | −20.3 | −18.2 | −19.4 |
| 11 | 166 | 0.004 | 52,793 | −8.3 | −5.3 | −5.8 | ||
| 12 | 167 | 0.007 | 0.007 | 0.005 | 55,228 | 7.3 | 7.2 | 7.3 |
| 13 | 180 | 0.005 | 54,005 | 2.9 | 5.8 | 14.5 | ||
| 14 | 191 | 0.000 | 52,322 | 2.9 | 2.2 | 11.4 | ||
| 15 | 192 | 0.001 | 50,890 | 6.3 | 9.8 | 4.9 | ||
| 16 | 193 | 0.000 | 52,090 | −1.7 | −2.3 | −14.9 |
3.5. Mass Spectrometric Analysis Shows that Prothrombotic Factors Are Significantly Upregulated in Class III Patients
| Spot # | Name | UniProt or NCBI Accession | Biological Function |
|---|---|---|---|
| (+) 31 | pregnancy zone protein | P20742 | a |
| (+) 38 | α-1-antitrypsin | P01009 | b |
| (+) 53 | elongation factor 2 | EF2 | c |
| (+) 67 | prothrombin/hemopexin | P00734/P02790 | d |
| (+) 100 | 6-phosphofructo-2-kinase/fructose-2,6-bisphosphatase | Q16877 | e |
| (−) 131, 136,146,160 | α-1-antitrypsin | P01009 | f |
| (−) 150,166 | complement component C4B | gi:187771 | g |
| (+) 167 | C3 complement component | gi:194384410 | h |
| (+) 180 | plasminogen activator inhibitor | P05121 | i |
| (+) 191 | isocitrate dehydrogenase | O75874 | j |
| (+) 192 | haptoglobin | P00738 | k |
| (−) 193 | carboxypeptidase N catalytic chain | P15169 | l |
| (−) 370 | chain B, complement C3C | gi:78101270 | m |
| (−) 458, 490 | apolipoprotein A-1 | P02647 | n |
3.6. Acute Derangement of PAI-1 Expression in All Class III Patients Preceded Death

3.7. Model of Factors Influencing PAI-1 Upregulation
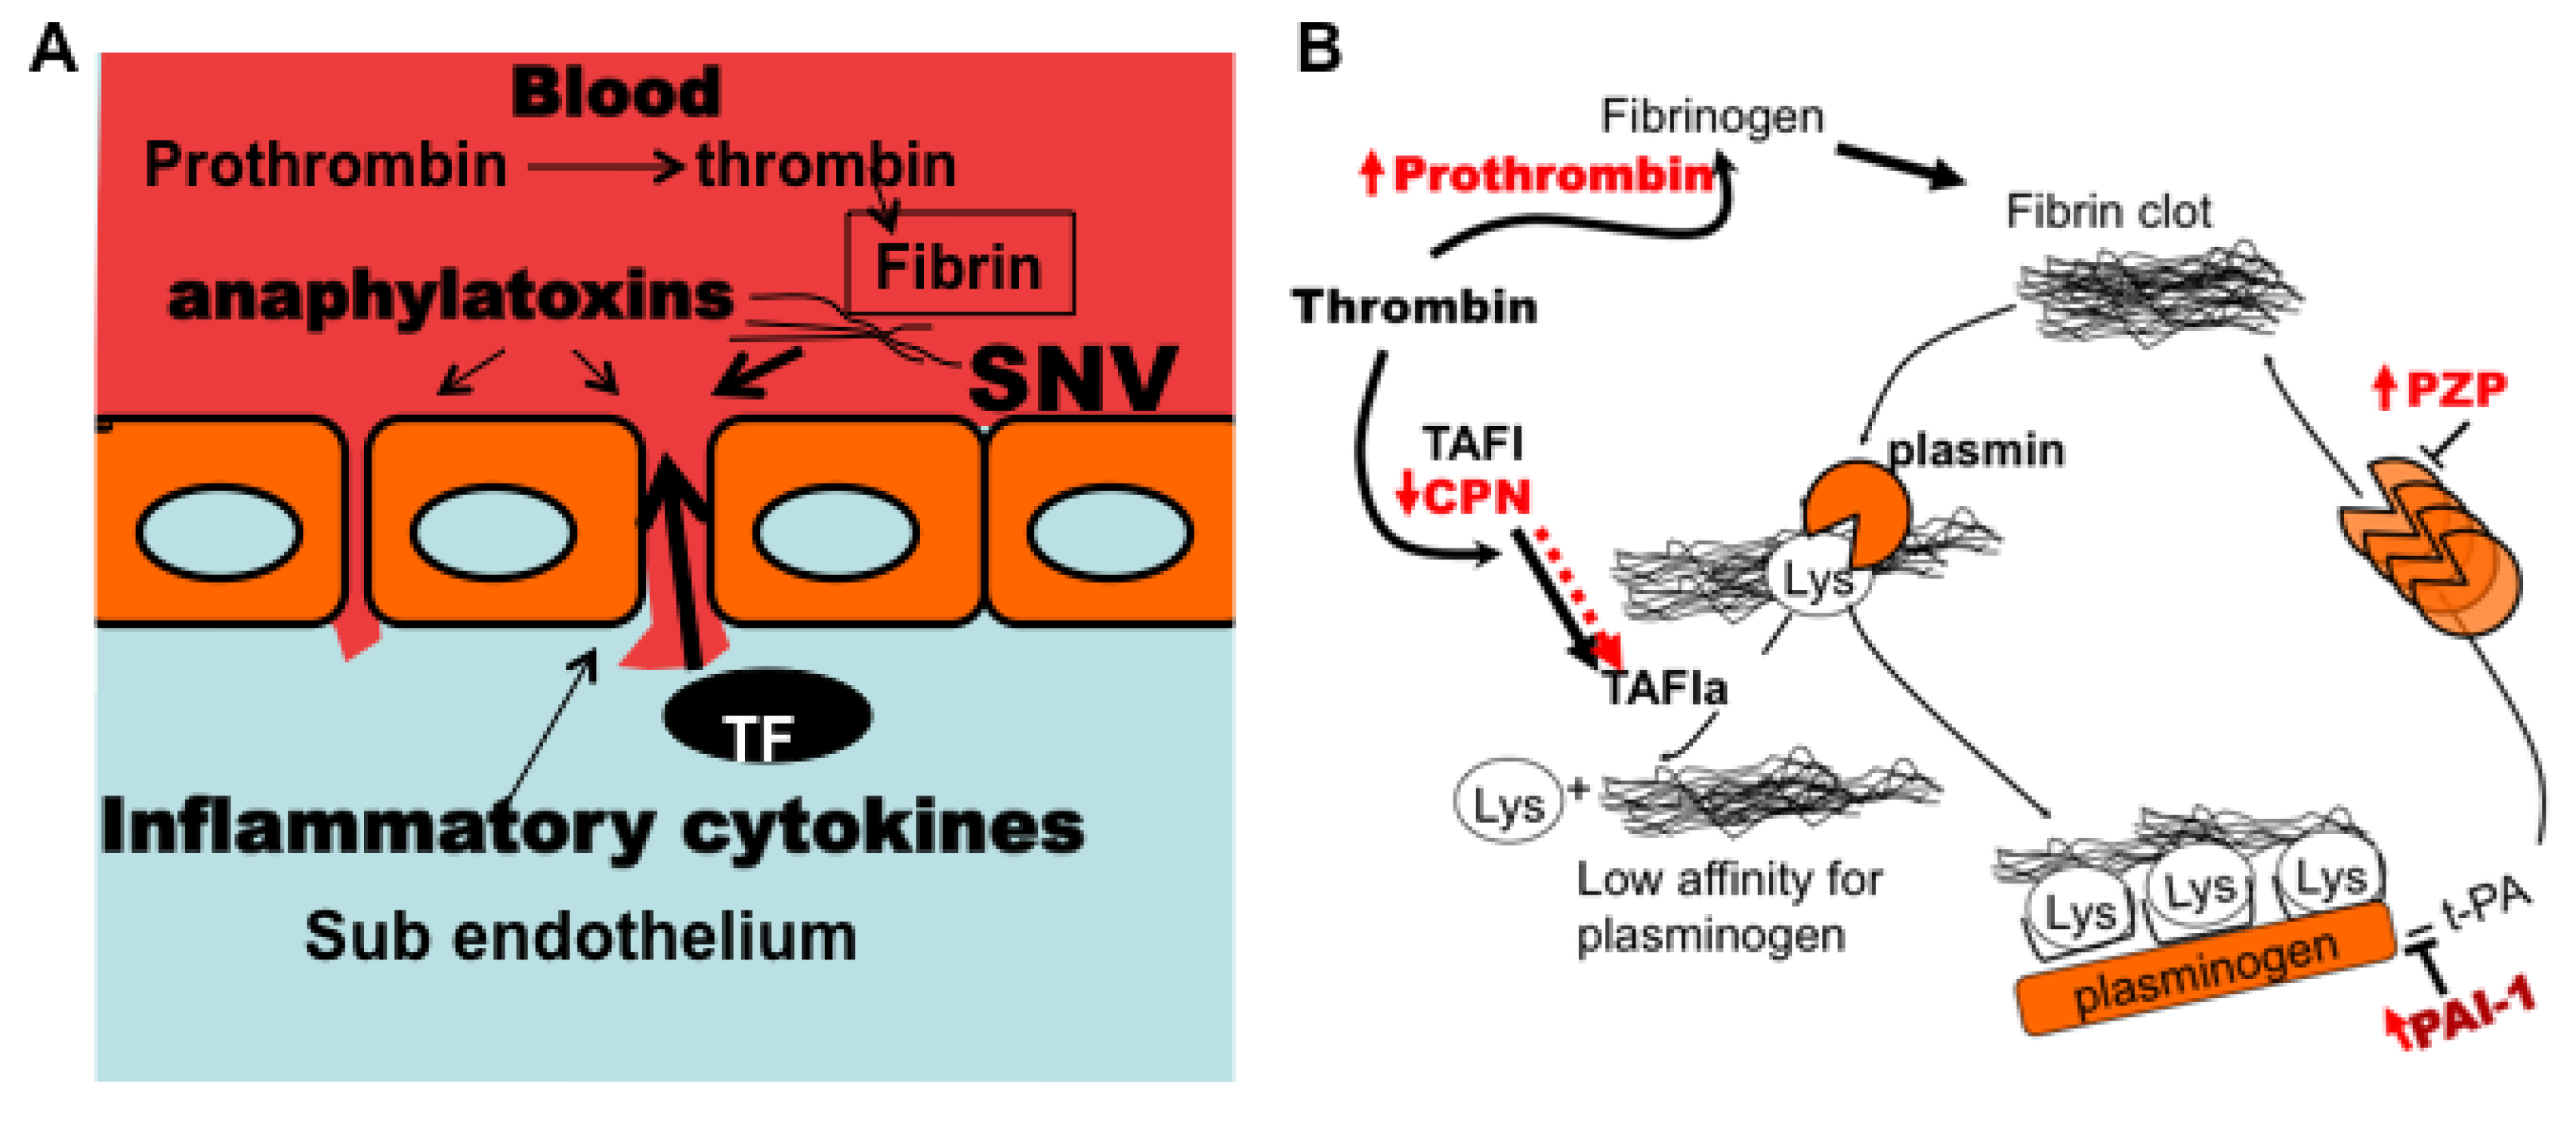
4. Conclusions
Supplementary Files
Supplementary File 1Acknowledgments
Author Contributions
Conflicts of Interest
References
- Schmaljohn, C.; Hjelle, B. Hantaviruses: A global disease problem. Emerg. Infect. Dis. 1997, 3, 95–104. [Google Scholar] [CrossRef] [PubMed]
- Vaheri, A.; Strandin, T.; Hepojoki, J.; Sironen, T.; Henttonen, H.; Makela, S.; Mustonen, J. Uncovering the mysteries of hantavirus infections. Nat. Rev. Microbiol. 2013, 11, 539–550. [Google Scholar] [CrossRef] [PubMed]
- Hjelle, B. Epidemiology and diagnosis of hantavirus infections. In UpToDate; Rose, B.D., Ed.; Wolters Kluwer: Wellesley, MA, USA, 2014. [Google Scholar]
- Botten, J.; Mirowsky, K.; Kusewitt, D.; Bharadwaj, M.; Yee, J.; Ricci, R.; Feddersen, R.M.; Hjelle, B. Experimental infection model for sin nombre hantavirus in the deer mouse (peromyscus maniculatus). Proc. Natl. Acad. Sci. USA 2000, 97, 10578–10583. [Google Scholar] [CrossRef] [PubMed]
- Botten, J.; Mirowsky, K.; Kusewitt, D.; Ye, C.; Gottlieb, K.; Prescott, J.; Hjelle, B. Persistent sin nombre virus infection in the deer mouse ( peromyscus maniculatus ) model: Sites of replication and strand specific expression. J. Virol. 2003, 77, 1540–1550. [Google Scholar] [CrossRef] [PubMed]
- Centers for Disease Control. Update: Hantavirus pulmonary syndrome—United States, 1993. MMWR Morb. Mortal. Wkly. Rep. 1993, 42, 816–820. [Google Scholar]
- Centers for Disease Control. Update: Hantavirus disease—Southwestern United States, 1993. MMWR Morb. Mortal. Wkly. Rep. 1993, 42, 570–572. [Google Scholar]
- Unexplained respiratory distress syndrome in the south-west of the United States. Commun. Dis. Rep. CDR Wkly. 1993, 3, 111.
- Paessler, S.; Walker, D.H. Pathogenesis of the viral hemorrhagic fevers. Ann. Rev. Pathol. 2013, 8, 411–440. [Google Scholar] [CrossRef]
- Koster, F.; Mackow, E. Pathogenesis of the hantavirus pulmonary syndrome. Future Virol. 2012, 7, 41–51. [Google Scholar] [CrossRef]
- Jenison, S.; Hjelle, B.; Simpson, S.; Hallin, G.; Feddersen, R.; Koster, F. Hantavirus pulmonary syndrome: Clinical, diagnostic, and virologic aspects. Semin. Respir. Infect. 1995, 10, 259–269. [Google Scholar] [PubMed]
- Wernly, J.A.; Dietl, C.A.; Tabe, C.E.; Pett, S.B.; Crandall, C.; Milligan, K.; Crowley, M.R. Extracorporeal membrane oxygenation support improves survival of patients with hantavirus cardiopulmonary syndrome refractory to medical treatment. Eur. J. Cardio-Thorac. 2011, 40, 1334–1340. [Google Scholar] [CrossRef]
- Terajima, M.; Hendershot, J.D., 3rd; Kariwa, H.; Koster, F.T.; Hjelle, B.; Goade, D.; DeFronzo, M.C.; Ennis, F.A. High levels of viremia in patients with the hantavirus pulmonary syndrome. J. Infect. Dis. 1999, 180, 2030–2034. [Google Scholar] [CrossRef] [PubMed]
- Xiao, R.; Yang, S.; Koster, F.; Ye, C.; Stidley, C.; Hjelle, B. Sin nombre viral rna load in patients with hantavirus cardiopulmonary syndrome. J. Infect. Dis. 2006, 194, 1403–1409. [Google Scholar] [CrossRef] [PubMed]
- Taylor, S.L.; Wahl-Jensen, V.; Copeland, A.M.; Jahrling, P.B.; Schmaljohn, C.S. Endothelial cell permeability during hantavirus infection involves factor xii-dependent increased activation of the kallikrein-kinin system. PLOS Pathog. 2013, 9, e1003470. [Google Scholar] [CrossRef] [PubMed]
- Stefansson, S.; Lawrence, D.A. Old dogs and new tricks: Proteases, inhibitors, and cell migration. Sci. STKE 2003, 2003, pe24. [Google Scholar] [PubMed]
- Stefansson, S.; Haudenschild, C.C.; Lawrence, D.A. Beyond fibrinolysis: The role of plasminogen activator inhibitor-1 and vitronectin in vascular wound healing. Trends Cardiovasc. Med. 1998, 8, 175–180. [Google Scholar] [CrossRef] [PubMed]
- Czekay, R.P.; Wilkins-Port, C.E.; Higgins, S.P.; Freytag, J.; Overstreet, J.M.; Klein, R.M.; Higgins, C.E.; Samarakoon, R.; Higgins, P.J. Pai-1: An integrator of cell signaling and migration. Int. J. Cell Biol. 2011, 2011, e562481. [Google Scholar] [CrossRef]
- Koster, F.; Foucar, K.; Hjelle, B.; Scott, A.; Chong, Y.Y.; Larson, R.; McCabe, M. Rapid presumptive diagnosis of hantavirus cardiopulmonary syndrome by peripheral blood smear review. Am. J. Clin. Pathol. 2001, 116, 665–672. [Google Scholar] [CrossRef] [PubMed]
- An, F.Q.; Folarin, H.M.; Compitello, N.; Roth, J.; Gerson, S.L.; McCrae, K.R.; Fakhari, F.D.; Dittmer, D.P.; Renne, R. Long-term-infected telomerase-immortalized endothelial cells: A model for kaposi’s sarcoma-associated herpesvirus latency in vitro and in vivo. J. Virol. 2006, 80, 4833–4846. [Google Scholar] [CrossRef] [PubMed]
- Bharadwaj, M.; Lyons, C.R.; Wortman, I.A.; Hjelle, B. Intramuscular inoculation of sin nombre hantavirus cdnas induces cellular and humoral immune responses in balb/c mice. Vaccine 1999, 17, 2836–2843. [Google Scholar] [CrossRef] [PubMed]
- Buranda, T.; Wu, Y.; Perez, D.; Jett, S.D.; Bondu-Hawkins, V.; Ye, C.; Lopez, G.P.; Edwards, B.; Hall, P.; Larson, R.S.; et al. Recognition of daf and avb3 by inactivated hantaviruses, towards the development of hts flow cytometry assays. Anal. Biochem. 2010, 402, 151–160. [Google Scholar] [CrossRef] [PubMed]
- Mitra, P.; Keese, C.R.; Giaever, I. Electric measurements can be used to monitor the attachment and spreading of cells in tissue-culture. BioTechniques 1991, 11, 504–510. [Google Scholar] [PubMed]
- Moy, A.B.; VanEngelenhoven, J.; Bodmer, J.; Kamath, J.; Keese, C.; Giaever, I.; Shasby, S.; Shasby, D.M. Histamine and thrombin modulate endothelial focal adhesion through centripetal and centrifugal forces. J. Clin. Investig. 1996, 97, 1020–1027. [Google Scholar] [CrossRef] [PubMed]
- Buranda, T.; Swanson, S.; Bondu, V.; Schaefer, L.; Maclean, J.; Mo, Z.Z.; Wycoff, K.; Belle, A.; Hjelle, B. Equilibrium and kinetics of sin nombre hantavirus binding at daf/cd55 functionalized bead surfaces. Viruses 2014, 6, 1091–1111. [Google Scholar] [CrossRef] [PubMed]
- Medina, R.A.; Mirowsky-Garcia, K.; Hutt, J.; Hjelle, B. Ribavirin, human convalescent plasma and anti-beta3 integrin antibody inhibit infection by Sin Nombre virus in the deer mouse model. J. Gen. Virol. 2007, 88, 493–505. [Google Scholar] [CrossRef] [PubMed]
- Sassoli, P.M.; Emmell, E.L.; Tam, S.H.; Trikha, M.; Zhou, Z.; Jordan, R.E.; Nakada, M.T. 7e3 f(ab')2, an effective antagonist of rat alphaiibbeta3 and alphavbeta3, blocks in vivo thrombus formation and in vitro angiogenesis. Thromb. Haemost. 2001, 85, 896–902. [Google Scholar] [PubMed]
- Chigaev, A.; Buranda, T.; Dwyer, D.C.; Prossnitz, E.R.; Sklar, L.A. Fret detection of cellular alpha 4-integrin conformational activation. Biophys. J. 2003, 85, 3951–3962. [Google Scholar] [CrossRef] [PubMed]
- Smith, P.K.; Krohn, R.I.; Hermanson, G.T.; Mallia, A.K.; Gartner, F.H.; Provenzano, M.D.; Fujimoto, E.K.; Goeke, N.M.; Olson, B.J.; Klenk, D.C.; et al. Measurement of protein using bicinchoninic acid. Anal. Biochem. 1985, 150, 76–85. [Google Scholar] [CrossRef] [PubMed]
- Burgesscassler, A.; Johansen, J.J.; Santek, D.A.; Ide, J.R.; Kendrick, N.C. Computerized quantitative-analysis of coomassie-blue-stained serum-proteins separated by 2-dimensional electrophoresis. Clin. Chem. 1989, 35, 2297–2304. [Google Scholar] [PubMed]
- Oakley, B.R.; Kirsch, D.R.; Morris, N.R. A simplified ultrasensitive silver stain for detecting proteins in polyacrylamide gels. Anal. Biochem. 1980, 105, 361–363. [Google Scholar] [CrossRef] [PubMed]
- Benjamini, Y.; Hochberg, Y. Controlling the false discovery rate—A practical and powerful approach to multiple testing. J. R. Stat. Soc. B Methodol. 1995, 57, 289–300. [Google Scholar]
- Benjamini, Y.; Drai, D.; Elmer, G.; Kafkafi, N.; Golani, I. Controlling the false discovery rate in behavior genetics research. Behav. Brain Res. 2001, 125, 279–284. [Google Scholar] [CrossRef] [PubMed]
- Team, R.C. R: A Language and Environment for Statistical Computing. R Foundation for Statistical Computing: Vienna, Austria. Available online: http://www.R-project.org/ (accessed on 1 September 2013).
- Kramer, M.S.; Tange, S.M.; Mills, E.L.; Ciampi, A.; Bernstein, M.L.; Drummond, K.N. Role of the complete blood count in detecting occult focal bacterial infection in the young febrile child. J. Clin. Epidemiol. 1993, 46, 349–357. [Google Scholar] [CrossRef] [PubMed]
- Walters, M.C.; Abelson, H.T. Interpretation of the complete blood count. Pediatr. Clin. N. Am. 1996, 43, 599–622. [Google Scholar] [CrossRef]
- Shivanna, M.; Jalimarada, S.S.; Srinivas, S.P. Lovastatin inhibits the thrombin-induced loss of barrier integrity in bovine corneal endothelium. J. Ocul. Pharmacol. Ther. 2010, 26, 1–10. [Google Scholar] [CrossRef] [PubMed]
- Ishii, K.; Hein, L.; Kobilka, B.; Coughlin, S.R. Kinetics of thrombin receptor cleavage on intact-cells—Relation to signaling. J. Biol. Chem. 1993, 268, 9780–9786. [Google Scholar] [PubMed]
- Levi, M.; Keller, T.T.; van Gorp, E.; ten Cate, H. Infection and inflammation and the coagulation system. Cardiovasc. Res. 2003, 60, 26–39. [Google Scholar] [CrossRef] [PubMed]
- Kumar, P.; Shen, Q.; Pivetti, C.D.; Lee, E.S.; Wu, M.H.; Yuan, S.Y. Molecular mechanisms of endothelial hyperpermeability: Implications in inflammation. Expert Rev. Mol. Med. 2009, 11. [Google Scholar] [CrossRef]
- Escolar, G.; Bozzo, J.; Maragall, S. Argatroban: A direct thrombin inhibitor with reliable and predictable anticoagulant actions. Drugs Today 2006, 42, 223–236. [Google Scholar] [CrossRef] [PubMed]
- Carbajal, J.M.; Gratrix, M.L.; Yu, C.H.; Schaeffer, R.C., Jr. Rock mediates thrombin’s endothelial barrier dysfunction. Am. J. Physiol. Cell Physiol. 2000, 279, C195–C204. [Google Scholar] [PubMed]
- Anwar, K.N.; Fazal, F.; Malik, A.B.; Rahman, A. RhoA/Rho-associated kinase pathway selectively regulates thrombin-induced intercellular adhesion molecule-1 expression in endothelial cells via activation of I kappa B kinase beta and phosphorylation of RelA/p65. J. Immunol. 2004, 173, 6965–6972. [Google Scholar] [CrossRef] [PubMed]
- Sosothikul, D.; Seksarn, P.; Pongsewalak, S.; Thisyakorn, U.; Lusher, J. Activation of endothelial cells, coagulation and fibrinolysis in children with dengue virus infection. Thromb. Haemost. 2007, 97, 627–634. [Google Scholar] [PubMed]
- Laine, O.; Makela, S.; Mustonen, J.; Huhtala, H.; Szanto, T.; Vaheri, A.; Lassila, R.; Joutsi-Korhonen, L. Enhanced thrombin formation and fibrinolysis during acute puumala hantavirus infection. Thromb. Res. 2010, 126, 154–158. [Google Scholar] [CrossRef] [PubMed]
- Talens, S.; Lebbink, J.H.G.; Malfliet, J.J.M.C.; Demmers, J.A.A.; de Willige, S.U.; Leebeek, F.W.G.; Rijken, D.C. Binding of carboxypeptidase n to fibrinogen and fibrin. Biochem. Biophys. Res. Commun. 2012, 427, 421–425. [Google Scholar] [CrossRef] [PubMed]
- Wang, W.; Boffa, P.B.; Bajzar, L.; Walker, J.B.; Nesheim, M.E. A study of the mechanism of inhibition of fibrinolysis by activated thrombin-activable fibrinolysis inhibitor. J. Biol. Chem. 1998, 273, 27176–27181. [Google Scholar] [CrossRef] [PubMed]
- Walker, J.B.; Binette, T.M.; Mackova, M.; Lambkin, G.R.; Mitchell, L.; Bajzar, L. Proteolytic cleavage of carboxypeptidase n markedly increases its antifibrinolytic activity. J. Thromb. Haemost. 2008, 6, 848–855. [Google Scholar] [CrossRef] [PubMed]
- Walker, J.B.; Bajzar, L. Complete inhibition of fibrinolysis by sustained carboxypeptidase b activity: The role and requirement of plasmin inhibitors. J. Thromb. Haemost. 2007, 5, 1257–1264. [Google Scholar] [CrossRef] [PubMed]
- Van Nieuw Amerongen, G.P.; van Delft, S.; Vermeer, M.A.; Collard, J.G.; van Hinsbergh, V.W. Activation of RhoA by thrombin in endothelial hyperpermeability: Role of Rho kinase and protein tyrosine kinases. Circ. Res. 2000, 87, 335–340. [Google Scholar]
- Van Nieuw Amerongen, G.P.; Musters, R.J.; Eringa, E.C.; Sipkema, P.; van Hinsbergh, V.W. Thrombin-induced endothelial barrier disruption in intact microvessels: Role of RhoA/Rho kinase-myosin phosphatase axis. Am. J. Physiol. Cell Physiol. 2008, 294, C1234–C1241. [Google Scholar]
- Rosenfeldt, H.; Castellone, M.D.; Randazzo, P.A.; Gutkind, J.S. Rac inhibits thrombin-induced Rho activation: Evidence of a Pak-dependent GTPase crosstalk. J. Mol. Signal. 2006, 1, 8. [Google Scholar] [CrossRef] [PubMed]
- Gavard, J.; Gutkind, J.S. Protein kinase C-related kinase and rock are required for thrombin-induced endothelial cell permeability downstream from galpha12/13 and galpha11/q. J. Biol. Chem. 2008, 283, 29888–29896. [Google Scholar] [CrossRef] [PubMed]
- Vogel, S.M.; Gao, X.P.; Mehta, D.; Ye, R.D.; John, T.A.; Andrade-Gordon, P.; Tiruppathi, C.; Malik, A.B. Abrogation of thrombin-induced increase in pulmonary microvascular permeability in par-1 knockout mice. Phys. Genomics 2000, 4, 137–145. [Google Scholar]
- Duchin, J.S.; Koster, F.T.; Peters, C.J.; Simpson, G.L.; Tempest, B.; Zaki, S.R.; Ksiazek, T.G.; Rollin, P.E.; Nichol, S.; Umland, E.T.; et al. Hantavirus pulmonary syndrome: A clinical description of 17 patients with a newly recognized disease. The hantavirus study group [see comments]. N. Engl. J. Med. 1994, 330, 949–955. [Google Scholar] [CrossRef] [PubMed]
- Jonsson, C.B.; Figueiredo, L.T.M.; Vapalahti, O. A global perspective on hantavirus ecology, epidemiology, and disease. Clin. Microbiol. Rev. 2010, 23, 412–441. [Google Scholar] [CrossRef] [PubMed]
- Greinacher, A.; Lubenow, N. Recombinant hirudin in clinical practice: Focus on lepirudin. Circulation 2001, 103, 1479–1484. [Google Scholar] [CrossRef] [PubMed]
- Boling, B.; Moore, K. Tranexamic acid (txa) use in trauma. J. Emerg. Nurs. 2012, 38, 496–497. [Google Scholar] [CrossRef] [PubMed]
- Kamio, N.; Hashizume, H.; Nakao, S.; Matsushima, K.; Sugiya, H. Plasmin is involved in inflammation via protease-activated receptor-1 activation in human dental pulp. Biochem. Pharmacol. 2008, 75, 1974–1980. [Google Scholar] [CrossRef]
- Coughlin, S.R. How the protease thrombin talks to cells. Proc. Natl. Acad. Sci. USA 1999, 96, 11023–11027. [Google Scholar] [CrossRef] [PubMed]
- Coughlin, S.R. Thrombin signalling and protease-activated receptors. Nature 2000, 407, 258–264. [Google Scholar] [CrossRef] [PubMed]
- Kawkitinarong, K.; Linz-McGillem, L.; Birukov, K.G.; Garcia, J.G. Differential regulation of human lung epithelial and endothelial barrier function by thrombin. Am. J. Respir. Cell Mol. Biol. 2004, 31, 517–527. [Google Scholar] [CrossRef]
- Macneil, A.; Nichol, S.T.; Spiropoulou, C.F. Hantavirus pulmonary syndrome. Virus Res. 2011, 162, 138–147. [Google Scholar] [CrossRef] [PubMed]
- Woodson, S.E.; Freiberg, A.N.; Holbrook, M.R. Coagulation factors, fibrinogen and plasminogen activator inhibitor-1, are differentially regulated by yellow fever virus infection of hepatocytes. Virus Res. 2013, 175, 155–159. [Google Scholar] [CrossRef] [PubMed]
- Vaughan, D.E. Pai-1 and atherothrombosis. J. Thromb. Haemost. 2005, 3, 1879–1883. [Google Scholar] [CrossRef] [PubMed]
- Stefansson, S.; Lawrence, D.A. The serpin pai-1 inhibits cell migration by blocking integrin alpha v beta 3 binding to vitronectin. Nature 1996, 383, 441–443. [Google Scholar] [CrossRef] [PubMed]
- Degryse, B.; Sier, C.F.; Resnati, M.; Conese, M.; Blasi, F. Pai-1 inhibits urokinase-induced chemotaxis by internalizing the urokinase receptor. FEBS Lett. 2001, 505, 249–254. [Google Scholar] [CrossRef] [PubMed]
- Binder, B.R.; Mihaly, J.; Prager, G.W. uPAR-uPA-PAI-1 interactions and signaling: A vascular biologist's view. Thromb. Haemost. 2007, 97, 336–342. [Google Scholar] [PubMed]
- Shrivastava-Ranjan, P.; Rollin, P.E.; Spiropoulou, C.F. Andes virus disrupts the endothelial cell barrier by induction of vascular endothelial growth factor and downregulation of VE-cadherin. J. Virol. 2011, 84, 11227–11234. [Google Scholar] [CrossRef]
- Gavrilovskaya, I.N.; Gorbunova, E.E.; Mackow, N.A.; Mackow, E.R. Hantaviruses direct endothelial cell permeability by sensitizing cells to the vascular permeability factor VEGF, while angiopoietin 1 and sphingosine 1-phosphate inhibit hantavirus-directed permeability. J. Virol. 2008, 82, 5797–5806. [Google Scholar] [CrossRef] [PubMed]
- Gorbunova, E.E.; Gavrilovskaya, I.N.; Pepini, T.; Mackow, E.R. VEGFR2 and Src kinase inhibitors suppress Andes virus-induced endothelial cell permeability. J. Virol. 2011, 85, 2296–2303. [Google Scholar] [CrossRef] [PubMed]
- Drubin, D.G.; Nelson, W.J. Origins of cell polarity. Cell 1996, 84, 335–344. [Google Scholar] [CrossRef] [PubMed]
- Krautkramer, E.; Zeier, M. Hantavirus causing hemorrhagic fever with renal syndrome enters from the apical surface and requires decay-accelerating factor (DAF/CD55). J. Virol. 2008, 82, 4257–4264. [Google Scholar] [CrossRef] [PubMed]
- Larson, R.S.; Brown, D.C.; Ye, C.; Hjelle, B. Peptide antagonists that inhibit sin nombre virus and hantaan virus entry through the beta3-integrin receptor. J. Virol. 2005, 79, 7319–7326. [Google Scholar] [CrossRef] [PubMed]
- Hall, P.R.; Malone, L.; Sillerud, L.O.; Ye, C.; Hjelle, B.L.; Larson, R.S. Characterization and nmr solution structure of a novel cyclic pentapeptide inhibitor of pathogenic hantaviruses. Chem. Biol. Drug Des. 2007, 69, 180–190. [Google Scholar] [CrossRef] [PubMed]
- Buranda, T.; Basuray, S.; Swanson, S.; Bondu-Hawkins, V.; Agola, J.; Wandinger-Ness, A. Rapid parallel flow cytometry assays of active gtpases using effector beads. Anal. Biochem. 2013, 144, 149–157. [Google Scholar] [CrossRef]
- Ye, C.; Prescott, J.; Nofchissey, R.; Goade, D.; Hjelle, B. Neutralizing antibodies and sin nombre virus RNA after recovery from hantavirus cardiopulmonary syndrome. Emerg. Infect. Dis. 2004, 10, 478–482. [Google Scholar] [PubMed]
- White, D.J.; Means, R.G.; Birkhead, G.S.; Bosler, E.M.; Grady, L.J.; Chatterjee, N.; Woodall, J.; Hjelle, B.; Rollin, P.E.; Ksiazek, T.G.; et al. Human and rodent hantavirus infection in New York State: Public health significance of an emerging infectious disease. Arch. Intern. Med. 1996, 156, 722–726. [Google Scholar] [CrossRef] [PubMed]
- Ramos, M.M.; Overturf, G.D.; Crowley, M.R.; Rosenberg, R.B.; Hjelle, B. Infection with sin nombre hantavirus: Clinical presentation and outcome in children and adolescents. Pediatrics 2001, 108, e27. [Google Scholar] [CrossRef] [PubMed]
- Bharadwaj, M.; Nofchissey, R.; Goade, D.; Koster, F.; Hjelle, B. Humoral immune responses in the hantavirus cardiopulmonary syndrome. J. Infect. Dis. 2000, 182, 43–48. [Google Scholar] [CrossRef] [PubMed]
- Gavrilovskaya, I.; Gorbunova, E.; Koster, F.; Mackow, E. Elevated vegf levels in pulmonary edema fluid and pbmcs from patients with acute hantavirus pulmonary syndrome. Adv. Virol. 2012, 2012, e674360. [Google Scholar]
- Safronetz, D.; Prescott, J.; Feldmann, F.; Haddock, E.; Rosenke, R.; Okumura, A.; Brining, D.; Dahlstrom, E.; Porcella, S.F.; Ebihara, H.; et al. Pathophysiology of hantavirus pulmonary syndrome in rhesus macaques. Proc. Natl. Acad. Sci. USA 2014, 111, 7114–7119. [Google Scholar] [CrossRef] [PubMed]
- Dvorak, H.F.; Sioussat, T.M.; Brown, L.F.; Berse, B.; Nagy, J.A.; Sotrel, A.; Manseau, E.J.; van de Water, L.; Senger, D.R. Distribution of vascular permeability factor (vascular endothelial growth factor) in tumors: Concentration in tumor blood vessels. J. Exp. Med. 1991, 174, 1275–1278. [Google Scholar] [CrossRef] [PubMed]
- Nolte, K.B.; Feddersen, R.M.; Foucar, K.; Zaki, S.R.; Koster, F.T.; Madar, D.; Merlin, T.L.; McFeeley, P.J.; Umland, E.T.; Zumwalt, R.E.; et al. Hantavirus pulmonary syndrome in the united states: A pathological description of a disease caused by a new agent. Hum. Pathol. 1995, 26, 110–120. [Google Scholar] [CrossRef] [PubMed]
- Zaki, S.R.; Greer, P.W.; Coffield, L.M.; Goldsmith, C.S.; Nolte, K.B.; Foucar, K.; Feddersen, R.M.; Zumwalt, R.E.; Miller, G.L.; Khan, A.S.; et al. Hantavirus pulmonary syndrome. Pathogenesis of an emerging infectious disease. Am. J. Pathol. 1995, 146, 552–579. [Google Scholar] [PubMed]
- Mori, M.; Rothman, A.L.; Kurane, I.; Montoya, J.M.; Nolte, K.B.; Norman, J.E.; Waite, D.C.; Koster, F.T.; Ennis, F.A. High levels of cytokine-producing cells in the lung tissues of patients with fatal hantavirus pulmonary syndrome. J. Infect. Dis. 1999, 179, 295–302. [Google Scholar] [CrossRef] [PubMed]
- Li, W.; Klein, S.L. Seoul virus-infected rat lung endothelial cells and alveolar macrophages differ in their ability to support virus replication and induce regulatory t cell phenotypes. J. Virol. 2012, 86, 11845–11855. [Google Scholar] [CrossRef] [PubMed]
- Guivier, E.; Galan, M.; Salvador, A.R.; Xuereb, A.; Chaval, Y.; Olsson, G.E.; Essbauer, S.; Henttonen, H.; Voutilainen, L.; Cosson, J.F.; et al. Tnf-alpha expression and promoter sequences reflect the balance of tolerance/resistance to Puumala hantavirus infection in european bank vole populations. Infect. Genet. Evol. J. Mol. Epidemiol. Evol. Genet. Infect. Dis. 2010, 10, 1208–1217. [Google Scholar] [CrossRef]
- Valnickova, Z.; Thogersen, I.B.; Christensen, S.; Chu, C.T.; Pizzo, S.V.; Enghild, J.J. Activated human plasma carboxypeptidase b is retained in the blood by binding to alpha2-macroglobulin and pregnancy zone protein. J. Biol. Chem. 1996, 271, 12937–12943. [Google Scholar] [CrossRef] [PubMed]
- Sanchez, M.C.; Chiabrando, G.A.; Vides, M.A. Pregnancy zone protein-tissue-type plasminogen activator complexes bind to low-density lipoprotein receptor-related protein (lrp). Arch. Biochem. Biophys. 2001, 389, 218–222. [Google Scholar] [CrossRef] [PubMed]
- Liang, X.Y.; Lin, T.; Sun, G.J.; Beasley-Topliffe, L.; Cavaillon, J.M.; Warren, H.S. Hemopexin down-regulates LPS-induced proinflammatory cytokines from macrophages. J. Leukoc. Biol. 2009, 86, 229–235. [Google Scholar] [CrossRef] [PubMed]
- Fink, M.P. Hemopexin: Newest member of the anti-inflammatory mediator club. J. Leukoc. Biol. 2009, 86, 203–204. [Google Scholar] [CrossRef] [PubMed]
- Stefansson, S.; Yepes, M.; Gorlatova, N.; Day, D.E.; Moore, E.G.; Zabaleta, A.; McMahon, G.A.; Lawrence, D.A. Mutants of plasminogen activator inhibitor-1 designed to inhibit neutrophil elastase and cathepsin g are more effective in vivo than their endogenous inhibitors. J. Biol. Chem. 2004, 279, 29981–29987. [Google Scholar] [CrossRef] [PubMed]
- Dvorscak, L.; Czuchlewski, D.R. Successful triage of suspected hantavirus cardiopulmonary syndrome by peripheral blood smear review: A decade of experience in an endemic region. Am. J. Clin. Pathol. 2014, 142, 196–201. [Google Scholar] [CrossRef] [PubMed]
- Vukovich, T.C.; Hamwi, A.; Bieglmayer, C. D-dimer testing within the routine clinical chemistry profile. Clin. Chem. 1998, 44, 1557–1558. [Google Scholar] [PubMed]
- Naski, M.C.; Lawrence, D.A.; Mosher, D.F.; Podor, T.J.; Ginsburg, D. Kinetics of inactivation of alpha-thrombin by plasminogen activator inhibitor-1. Comparison of the effects of native and urea-treated forms of vitronectin. J. Biol. Chem. 1993, 268, 12367–12372. [Google Scholar] [PubMed]
- Czekay, R.P.; Aertgeerts, K.; Curriden, S.A.; Loskutoff, D.J. Plasminogen activator inhibitor-1 detaches cells from extracellular matrices by inactivating integrins. J. Cell Biol. 2003, 160, 781–791. [Google Scholar] [CrossRef] [PubMed]
- Huang, D.W.; Sherman, B.T.; Lempicki, R.A. Systematic and integrative analysis of large gene lists using DAVID bioinformatics resources. Nat. Protoc. 2009, 4, 44–57. [Google Scholar] [CrossRef] [PubMed]
- Huang, D.W.; Sherman, B.T.; Lempicki, R.A. Bioinformatics enrichment tools: Paths toward the comprehensive functional analysis of large gene lists. Nucleic Acids Res. 2009, 37, 1–13. [Google Scholar] [CrossRef] [PubMed]
- Van der Poll, T.; Herwald, H. The coagulation system and its function in early immune defense. Thromb. Haemost. 2014, 112, 640–648. [Google Scholar] [CrossRef] [PubMed]
- Ten Cate, H.; Timmerman, J.J.; Levi, M. The pathophysiology of disseminated intravascular coagulation. Thromb. Haemost. 1999, 82, 713–717. [Google Scholar] [PubMed]
- Tanaka, K.A.; Key, N.S.; Levy, J.H. Blood coagulation: Hemostasis and thrombin regulation. Anesth. Analg. 2009, 108, 1433–1446. [Google Scholar] [CrossRef] [PubMed]
- Mackavey, C.L.; Hanks, R. Hemostasis, coagulation abnormalities, and liver disease. Crit. Care Nurs. Clin. N. Am. 2013, 25, 435–446. [Google Scholar] [CrossRef]
- Goldenberg, N.A.; Hathaway, W.E.; Jacobson, L.; Manco-Johnson, M.J. A new global assay of coagulation and fibrinolysis. Thromb. Res. 2005, 116, 345–356. [Google Scholar] [CrossRef] [PubMed]
- Stefansson, S.; Lawrence, D.A.; Herren, T.; Plow, E.F. Novel approaches to thrombolysis based on modulation of endogenous fibrinolysis. Coron. Artery Dis. 1998, 9, 99–104. [Google Scholar] [PubMed]
- Relja, B.; Lustenberger, T.; Puttkammer, B.; Jakob, H.; Morser, J.; Gabazza, E.C.; Takei, Y.; Marzi, I. Thrombin-activatable fibrinolysis inhibitor (TAFI) is enhanced in major trauma patients without infectious complications. Immunobiology 2013, 218, 470–476. [Google Scholar] [CrossRef] [PubMed]
- Foley, J.H.; Cook, P.F.; Nesheim, M.E. Kinetics of activated thrombin-activatable fibrinolysis inhibitor (TAFIa)-catalyzed cleavage of C-terminal lysine residues of fibrin degradation products and removal of plasminogen-binding sites. J. Biol. Chem. 2011, 286, 19280–19286. [Google Scholar] [CrossRef] [PubMed]
- Reade, M.C.; Pitt, V.; Gruen, R.L. Tranexamic acid and trauma: Current status and knowledge gaps with recommended research priorities. Shock 2013, 40, 160–161. [Google Scholar] [CrossRef] [PubMed]
- Marx, P.F.; Meijers, J.C.M. Mechanism of action of carboxypeptidase U: Staying above the threshold. J. Thromb. Haemost. 2004, 2, 414–415. [Google Scholar] [CrossRef] [PubMed]
- Leurs, J.; Nerme, V.; Sim, Y.; Hendriks, D. Carboxypeptidase U (TAFIa) prevents lysis from proceeding into the propagation phase through a threshold-dependent mechanism. J. Thromb. Haemost. 2004, 2, 416–423. [Google Scholar] [CrossRef] [PubMed]
- Bouma, B.N.; Borne, P.A.K.V.; Meijers, J.C.M. Discovery of thrombin activatable fibrinolysis inhibitor (TAFI). J. Thromb. Haemost. 2006, 4, 257–258. [Google Scholar] [CrossRef]
- Van Gorp, E.C.; Setiati, T.E.; Mairuhu, A.T.; Suharti, C.; Cate Ht, H.; Dolmans, W.M.; van der Meer, J.W.; Hack, C.E.; Brandjes, D.P. Impaired fibrinolysis in the pathogenesis of dengue hemorrhagic fever. J. Med. Virol. 2002, 67, 549–554. [Google Scholar] [CrossRef] [PubMed]
- Meesters, E.W.; Hansen, H.; Spronk, H.M.; Hamulyak, K.; Rosing, J.; Rowshani, A.T.; ten Berge, I.J.; ten Cate, H. The inflammation and coagulation cross-talk in patients with systemic lupus erythematosus. Blood Coagul. Fibrinolysis Int. J. Haemost. Thromb. 2007, 18, 21–28. [Google Scholar] [CrossRef]
- Keller, T.T.; Mairuhu, A.T.; de Kruif, M.D.; Klein, S.K.; Gerdes, V.E.; ten Cate, H.; Brandjes, D.P.; Levi, M.; van Gorp, E.C. Infections and endothelial cells. Cardiovasc. Res. 2003, 60, 40–48. [Google Scholar] [CrossRef] [PubMed]
- Laine, O.; Joutsi-Korhonen, L.; Makela, S.; Mikkelsson, J.; Pessi, T.; Tuomisto, S.; Huhtala, H.; Libraty, D.; Vaheri, A.; Karhunen, P.; et al. Polymorphisms of PAI-1 and platelet GP Ia may associate with impairment of renal function and thrombocytopenia in puumala hantavirus infection. Thromb. Res. 2012, 129, 611–615. [Google Scholar] [CrossRef] [PubMed]
© 2015 by the authors; licensee MDPI, Basel, Switzerland. This article is an open access article distributed under the terms and conditions of the Creative Commons Attribution license (http://creativecommons.org/licenses/by/4.0/).
Share and Cite
Bondu, V.; Schrader, R.; Gawinowicz, M.A.; McGuire, P.; Lawrence, D.A.; Hjelle, B.; Buranda, T. Elevated Cytokines, Thrombin and PAI-1 in Severe HCPS Patients Due to Sin Nombre Virus. Viruses 2015, 7, 559-589. https://doi.org/10.3390/v7020559
Bondu V, Schrader R, Gawinowicz MA, McGuire P, Lawrence DA, Hjelle B, Buranda T. Elevated Cytokines, Thrombin and PAI-1 in Severe HCPS Patients Due to Sin Nombre Virus. Viruses. 2015; 7(2):559-589. https://doi.org/10.3390/v7020559
Chicago/Turabian StyleBondu, Virginie, Ron Schrader, Mary Ann Gawinowicz, Paul McGuire, Daniel A. Lawrence, Brian Hjelle, and Tione Buranda. 2015. "Elevated Cytokines, Thrombin and PAI-1 in Severe HCPS Patients Due to Sin Nombre Virus" Viruses 7, no. 2: 559-589. https://doi.org/10.3390/v7020559
APA StyleBondu, V., Schrader, R., Gawinowicz, M. A., McGuire, P., Lawrence, D. A., Hjelle, B., & Buranda, T. (2015). Elevated Cytokines, Thrombin and PAI-1 in Severe HCPS Patients Due to Sin Nombre Virus. Viruses, 7(2), 559-589. https://doi.org/10.3390/v7020559


