Article

Predictive Value of Hepatitis B Core-Related Antigen for Multiple Recurrence Outcomes After Treatment Cessation in Chronic Hepatitis B: A Meta-Analysis Study

1
Department of Laboratory Medicine, Naval Medical Centre, Naval Medical University, Shanghai 200052, China
2
Department of Epidemiology, Naval Medical University, Shanghai 200433, China
*
Authors to whom correspondence should be addressed.
These authors contributed equally to this work.
Viruses 2025, 17(7), 929; https://doi.org/10.3390/v17070929
Submission received: 20 May 2025 / Revised: 13 June 2025 / Accepted: 23 June 2025 / Published: 30 June 2025
(This article belongs to the Special Issue Hepatitis B Core-Related Antigen)

Abstract

Background: Hepatitis B core-related antigen (HBcrAg), a novel serum biomarker reflecting the activity of intrahepatic covalently closed circular DNA (cccDNA), has generated conflicting evidence regarding its clinical utility for predicting post-antiviral therapy relapse in chronic hepatitis B (CHB) patients. Methods: We systematically analyzed 13 studies (15 cohorts, n = 1529 patients) from PubMed, Web of Science, Wanfang, and CNKI (through April 2025). A bivariate model evaluated HBcrAg’s predictive performance for relapse outcomes, including virological relapse, clinical relapse, and hepatitis flares. Results: HBcrAg demonstrated a pooled sensitivity of 0.81 (95% CI: 0.75–0.86) and specificity of 0.72 (95% CI: 0.67–0.76) for relapse prediction, with a diagnostic odds ratio of 10.66 (95% CI: 7.36–15.42) and summary AUC of 0.83 (95% CI: 0.80–0.86). Subgroup analysis identified threshold effects as the primary source of heterogeneity, which resolved (I2 < 13%) after excluding studies with outlier cutoff values. Meta-regression established that HBcrAg’s predictive value was unaffected by age, sex, hepatitis B e antigen status, or detection methods (p > 0.05). Conclusions: HBcrAg is validated as a robust non-invasive biomarker to optimize treatment cessation strategies, with high sensitivity providing strong negative predictive value in CHB populations. Future research should prioritize multi-marker models to enhance prediction accuracy.

1. Introduction

According to 2022 data, chronic hepatitis B virus (HBV) infection affects approximately 257 million individuals globally, contributing to over 800,000 annual deaths from complications including cirrhosis and hepatocellular carcinoma (HCC) [1]. Significant diagnostic and therapeutic gaps persist: only 13% of chronic hepatitis B (CHB) patients are diagnosed, and fewer than 3% receive antiviral therapy [2,3,4].
A key barrier to cure is the persistence of covalently closed circular DNA (cccDNA) in hepatocytes. Resisting elimination by current antivirals, cccDNA serves as a molecular reservoir that maintains viral persistence for decades—even after apparent infection resolution. This reservoir can reactivate viral replication, triggering disease relapse following therapy cessation [5,6].
Hepatitis B core-related antigen (HBcrAg) has recently emerged as a serum biomarker strongly correlated with intrahepatic cccDNA activity (r = 0.641, 95% confidence interval [CI]: 0.510–0.743, p < 0.001), outperforming hepatitis B surface antigen (HBsAg) as a virological indicator [5]. Unlike cccDNA quantification requiring invasive liver biopsy, HBcrAg offers a non-invasive surrogate for intrahepatic viral replication [7]. Growing evidence suggests that is has prognostic value for predicting HCC risk and post-treatment recurrence in CHB patients [8], with high sensitivity even at low viral loads (<2000 IU/mL) [9].
Despite these advances, current research focuses predominantly on single recurrence endpoints. No systematic evaluation exists for HBcrAg’s predictive efficacy across multidimensional outcomes (e.g., virological relapse [VR], clinical relapse [CR], hepatitis flares). Existing meta-analyses [10,11,12] remain limited to traditional biomarkers, overlooking HBcrAg’s unique advantages. This meta-analysis comprehensively evaluates HBcrAg’s predictive capacity for diverse recurrence outcomes, providing evidence to optimize individualized treatment cessation strategies and risk-stratified management in high-risk populations.

2. Method

2.1. Search Strategy

To evaluate the clinical utility of HBcrAg, we conducted a comprehensive literature search across four databases: PubMed, Web of Science (WOS), Wanfang, and China National Knowledge Infrastructure (CNKI). The specific search strategies were as follows:
(1)
PubMed: Articles published before 1 April 2025 were retrieved using the search terms “HBcrAg” OR “Hepatitis B core-related Antigen.”
(2)
WOS: Literature indexed between 1 January 1900 and 1 April 2025 was identified using the keywords “hepatitis B core-related antigen” OR “HBcrAg.”
(3)
Wanfang: Journal articles, dissertations, and conference papers published from 1 January 1900 to 7 May 2025 were searched for with the terms “hepatitis B core-related antigen,” “HBcrAg,” or “hepatitis B core-related antigen (in Chinese)”.
(4)
CNKI: All literature from 1 January 1900 to 1 April 2025 was retrieved using the keywords “hepatitis B core-related antigen” OR “HBcrAg” OR “hepatitis B core-related antigen (in Chinese)”.
Following the search, duplicate records were removed, and manual screening was performed to exclude review articles, systematic reviews, practice guidelines, letters, editorials, and non-human studies.
Initial categorization based on study outcomes and designs revealed a substantial number of articles investigating the prognostic value of HBcrAg in post-treatment outcomes in CHB patients. Given the ongoing controversy and divergent findings regarding HBcrAg’s predictive efficacy in clinical outcomes, we focused on studies evaluating HBcrAg as a prognostic biomarker for predicting post-treatment relapse in CHB patients.

2.2. Quality Assessment

In this meta-analysis, the Quality in Prognostic Studies (QUIPS) [13] tool, a validated risk of bias assessment instrument, was employed to ensure the methodological rigor of included studies. The updated QUIPS tool categorizes potential biases in prognostic studies into six domains: study participation, study attrition, prognostic factor measurement, outcome measurement, study confounding, and statistical analysis and reporting. Based on descriptions provided in the original studies, the risk of bias within each domain was classified as high, moderate, or low. The QUIPS tool incorporates detailed signaling questions for each dimension, addressing critical aspects such as comprehensive characterization of the study population, recruitment methodology of participants, and reliability of prognostic factor and outcome measurements. By systematically considering these elements, the tool effectively identifies potential biases arising from study design, implementation, and reporting processes, thereby ensuring the scientific validity and reliability of studies included in the analysis.

2.3. Data Analysis

Sensitivity, specificity, positive predictive value (PPV), and negative predictive value (NPV) [14] are critical metrics for evaluating the performance of diagnostic tests. In this study, we extracted reported values of PPV, NPV, sensitivity, and specificity from the included articles. Using these metrics alongside the total sample size and the number of positive outcomes, we back-calculated the values of true positives (TP), false positives (FP), true negatives (TN), and false negatives (FN) based on the following formulas. Sensitivity refers to the proportion of true–positive cases correctly identified among all actual positive cases, calculated as TP/(TP + FN). Specificity represents the proportion of true–negative cases correctly identified among all actual negative cases, calculated as TN/(TN + FP). PPV indicates the proportion of true–positive cases among all samples classified as positive, calculated as TP/(TP + FP). NPV denotes the proportion of true–negative cases among all samples classified as negative, calculated as TN/(TN + FN).
The positive likelihood ratio (PLR) and negative likelihood ratio (NLR) were employed to further assess the diagnostic performance. A higher PLR value signifies a stronger ability of the test to differentiate between diseased and non-diseased populations, whereas a lower NLR value suggests superior performance in excluding the disease.
The diagnostic odds ratio (DOR), calculated as the ratio of true positives multiplied by true negatives to false positives multiplied by false negatives (DOR = [TP × TN]/[FP × FN]), integrates information from both sensitivity and specificity to holistically reflect the accuracy of a diagnostic test. A higher DOR value indicates superior diagnostic performance, underscoring its critical role in evaluating the efficacy of diagnostic methodologies. This metric serves as a robust indicator for quantifying test reliability and discriminatory power in clinical decision-making contexts.
The bivariate model was employed to synthesize effect sizes in atypical meta-analyses [15]. This approach enables simultaneous analysis of sensitivity and specificity while accounting for their intrinsic correlation through joint modeling of their distributions. The model generates a summary receiver operating characteristic (SROC) curve, which graphically plots sensitivity on the y-axis against 1-specificity on the x-axis. This visualization effectively illustrates the distribution of sensitivity–specificity pairs across studies, offering a comprehensive and methodologically rigorous evaluation of diagnostic test performance by integrating multidimensional accuracy metrics into a unified analytical framework.
Furthermore, threshold effects were examined using Spearman’s correlation analysis between sensitivity and 1-specificity. Statistical significance was determined by a p-value threshold of <0.05, with values below this threshold indicating the presence of significant threshold effects. Concurrently, heterogeneity attributable to covariates beyond threshold effects was quantified through the I2 statistic, which estimates the proportion of total variation across studies that reflects genuine differences rather than random chance. The I2 index was interpreted using established thresholds: values < 25% denote low heterogeneity, 25–50% suggest moderate heterogeneity, and >50% indicate substantial heterogeneity. This dual analytical approach enables systematic differentiation between threshold-induced variability and other sources of study-level heterogeneity, thereby enhancing the interpretative validity of pooled diagnostic accuracy estimates.
Subgroup analysis stratifies study populations according to predefined variables and conducts independent meta-analyses within each stratum, with the objective of investigating between-subgroup heterogeneity in effect magnitudes and identifying potential sources of variability.
Meta-regression extends this approach by modeling study-level effect sizes as dependent variables and incorporating covariates of interest as independent predictors. This regression-based framework quantitatively evaluates the association between explanatory variables and effect estimates, enabling precise quantification of covariate effects on observed heterogeneity. Both methodologies synergistically address the decomposition of variance components in pooled effect estimates, distinguishing clinically meaningful effect modifiers from stochastic variation.
All statistical analyses were conducted using STATA software (version 17.0; StataCorp., College Station, TX, USA) with the MIDAS module for meta-analytical modeling and Review Manager (version 5.3; The Cochrane Collaboration) for systematic review management. This dual-platform approach ensured methodological rigor in both quantitative synthesis (STATA) and evidence organization (RevMan), aligning with best practices for diagnostic accuracy meta-analyses.

3. Results

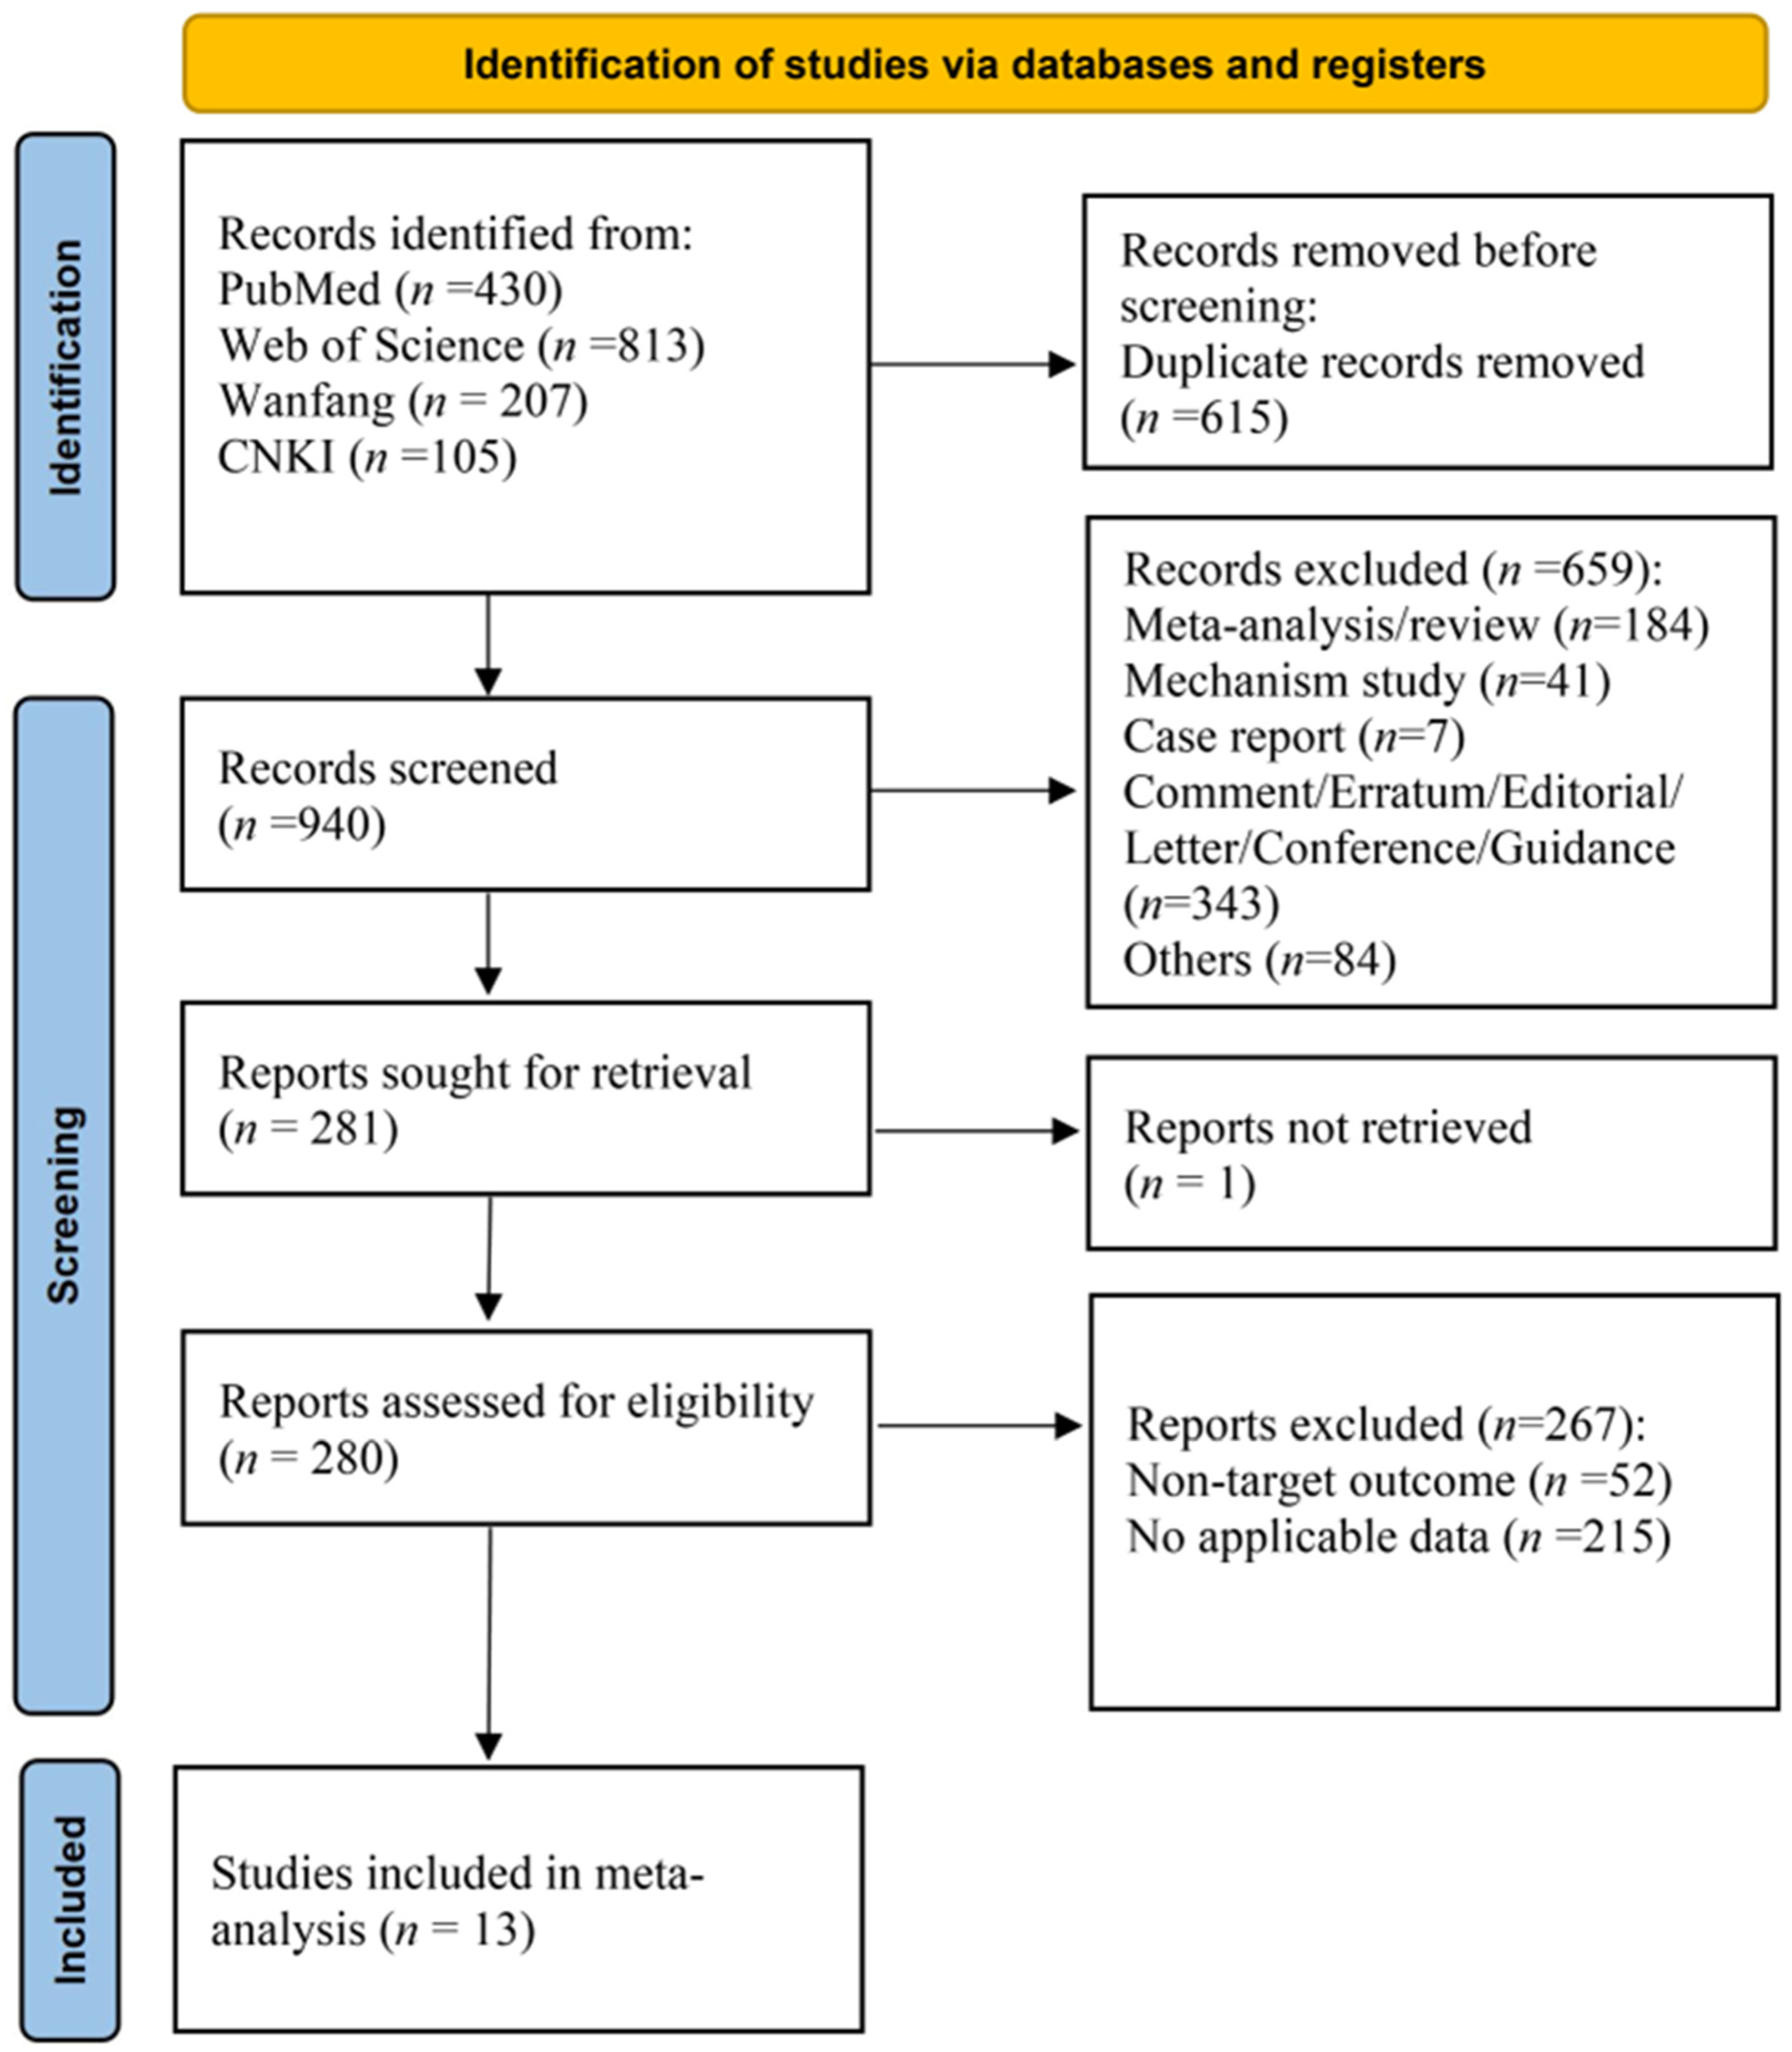
3.1. Study Selection and Characteristics

Initial database searches identified 1555 potentially relevant records. Following deduplication, 940 unique records underwent manual screening. Exclusion criteria encompassed systematic reviews/meta-analyses, mechanistic investigations (e.g., animal/cell studies, non-patient research), case reports, editorial commentaries, conference guidelines, errata, and other non-qualifying publication types. Subsequent full-text review of 280 articles excluded studies focusing on non-target clinical endpoints (e.g., HCC, hepatic fibrosis, cirrhosis, hepatitis staging) or those with inaccessible outcome data (e.g., missing effect estimates, undocumented treatment histories, or non-predictive analyses). Ultimately, 13 articles met the inclusion criteria for quantitative synthesis.
The study selection process based on PRISMA flow reporting standards is detailed in Figure 1, with study characteristics presented in Table 1. The inclusion and exclusion criteria for the literature are detailed in Table S1.

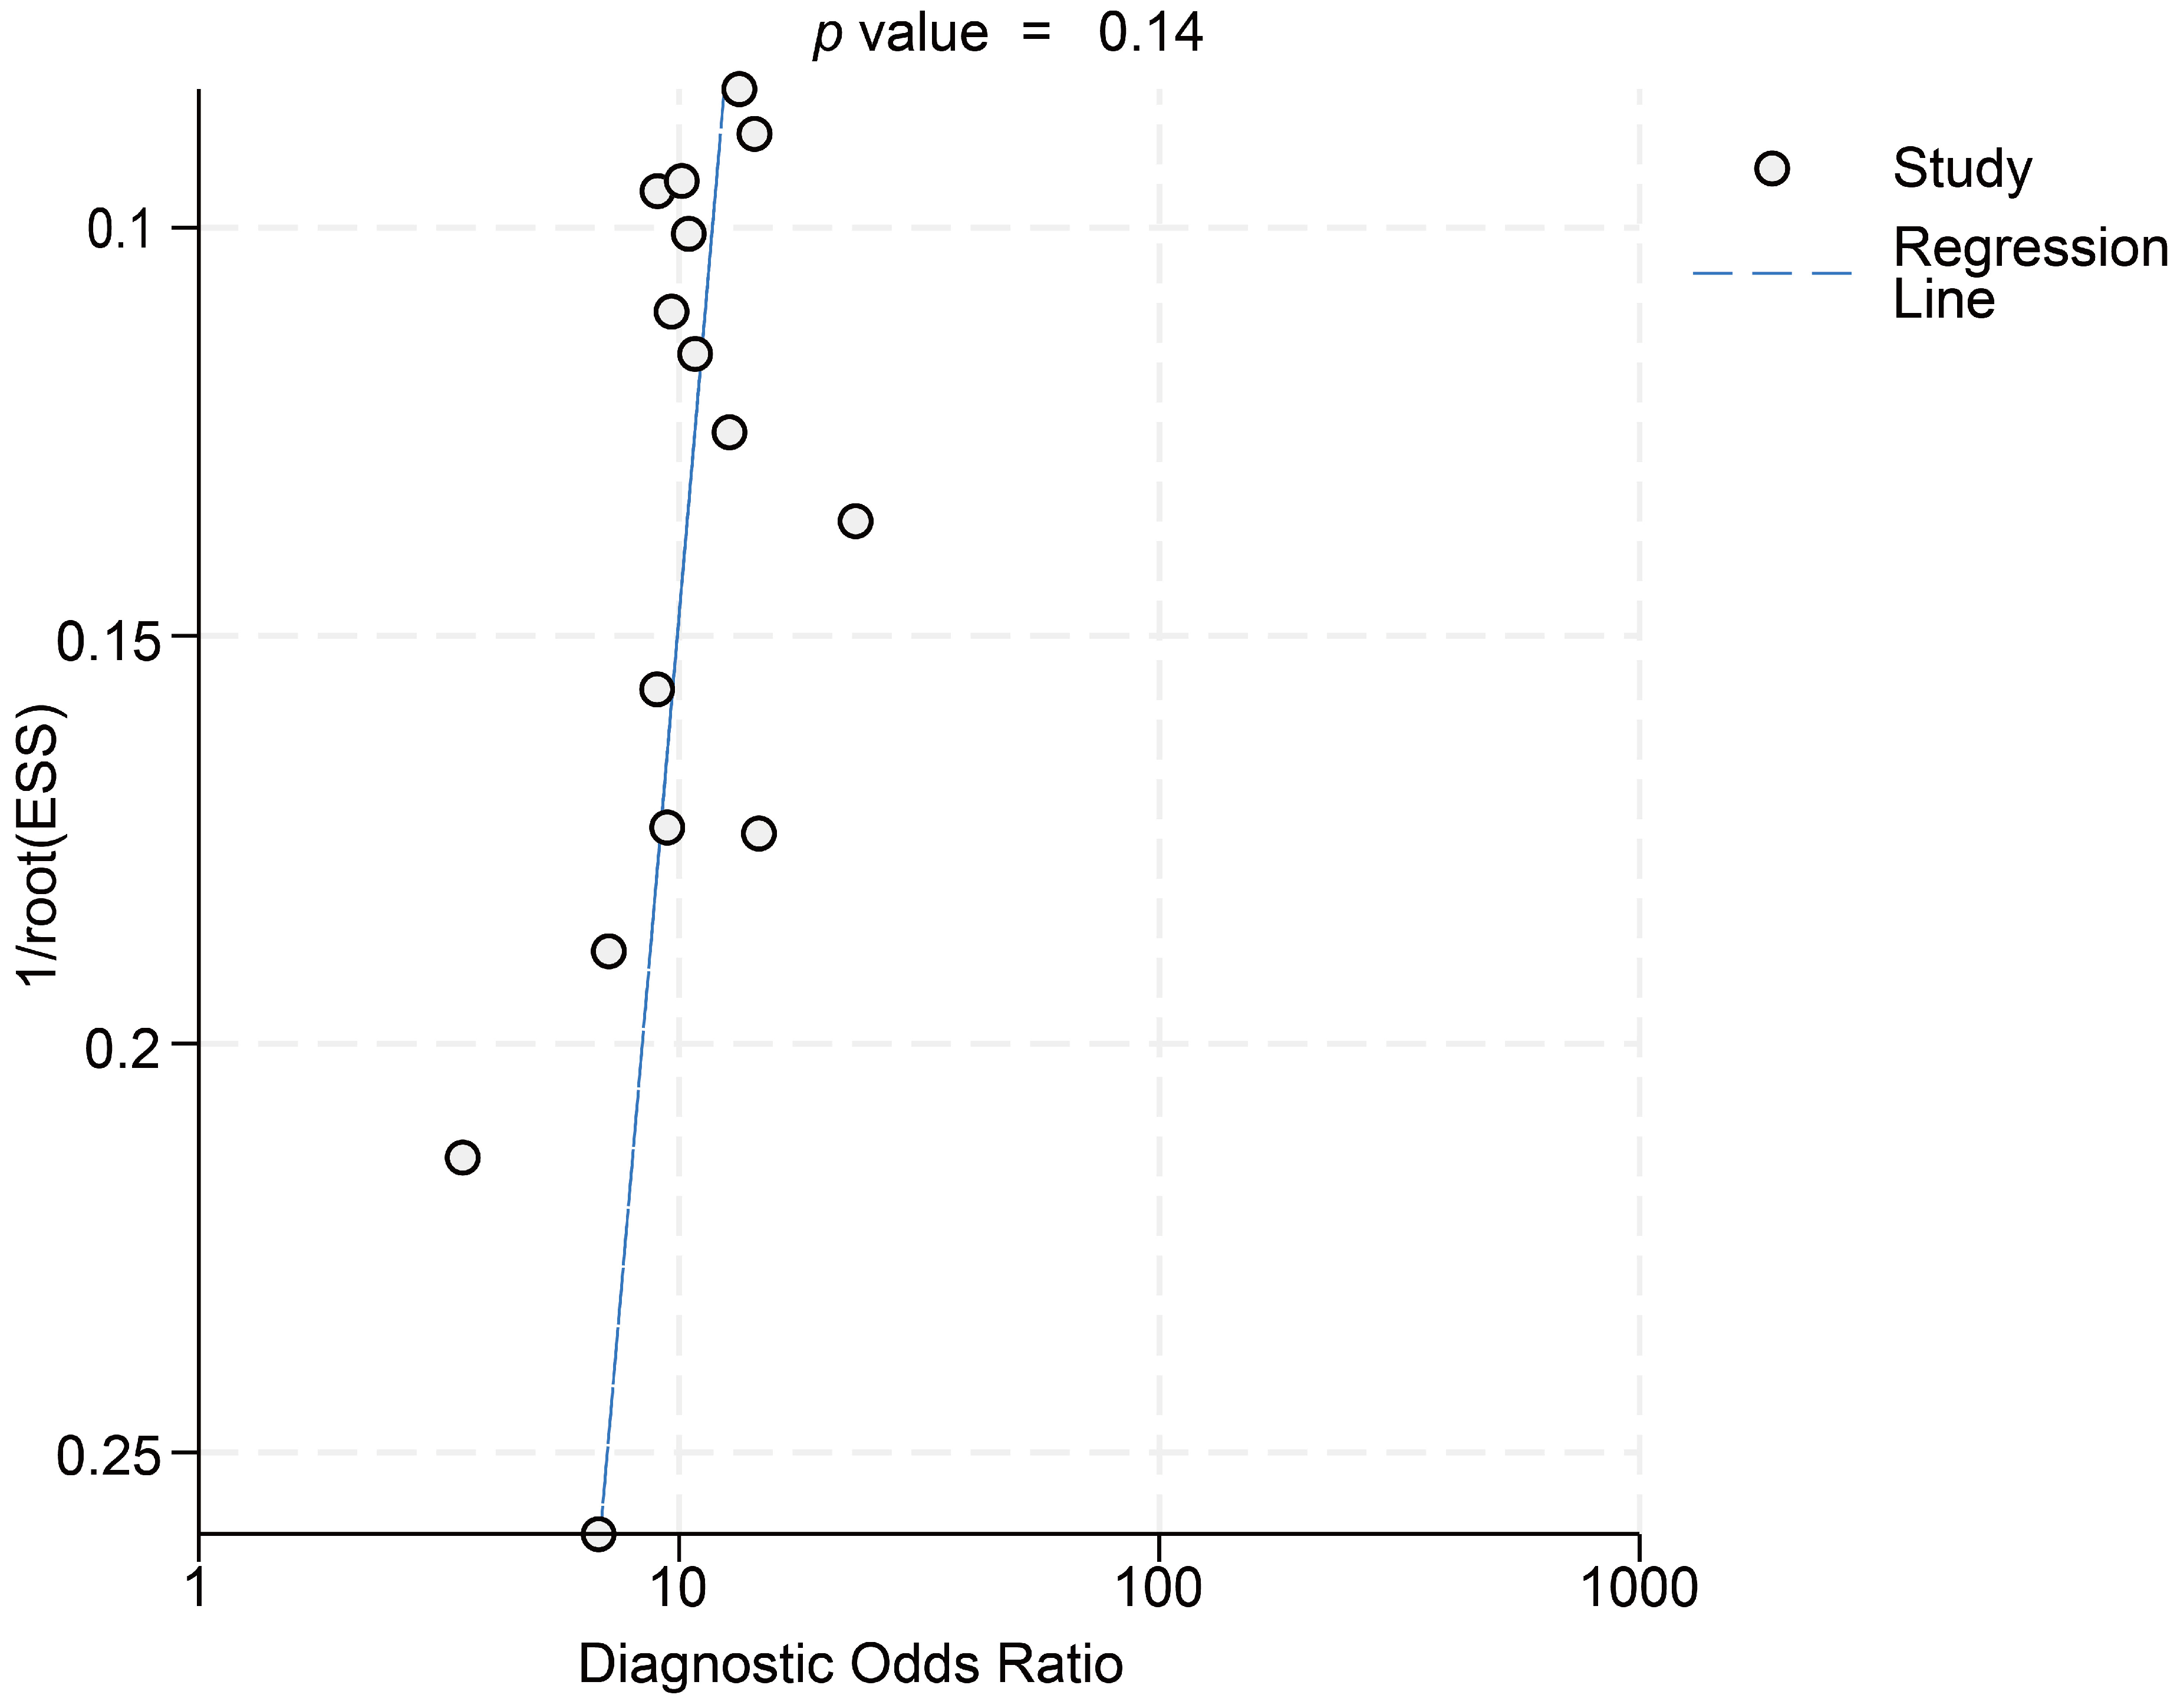
3.2. Risk of Bias Analysis

Risk of bias assessment for the 13 included articles was conducted using the QUIPS tool. Among the studies evaluating HBcrAg’s predictive capacity for post-treatment relapse in CHB patients, six demonstrated low risk of bias, six moderate risk, and one high risk. Detailed results are presented in Table 2.

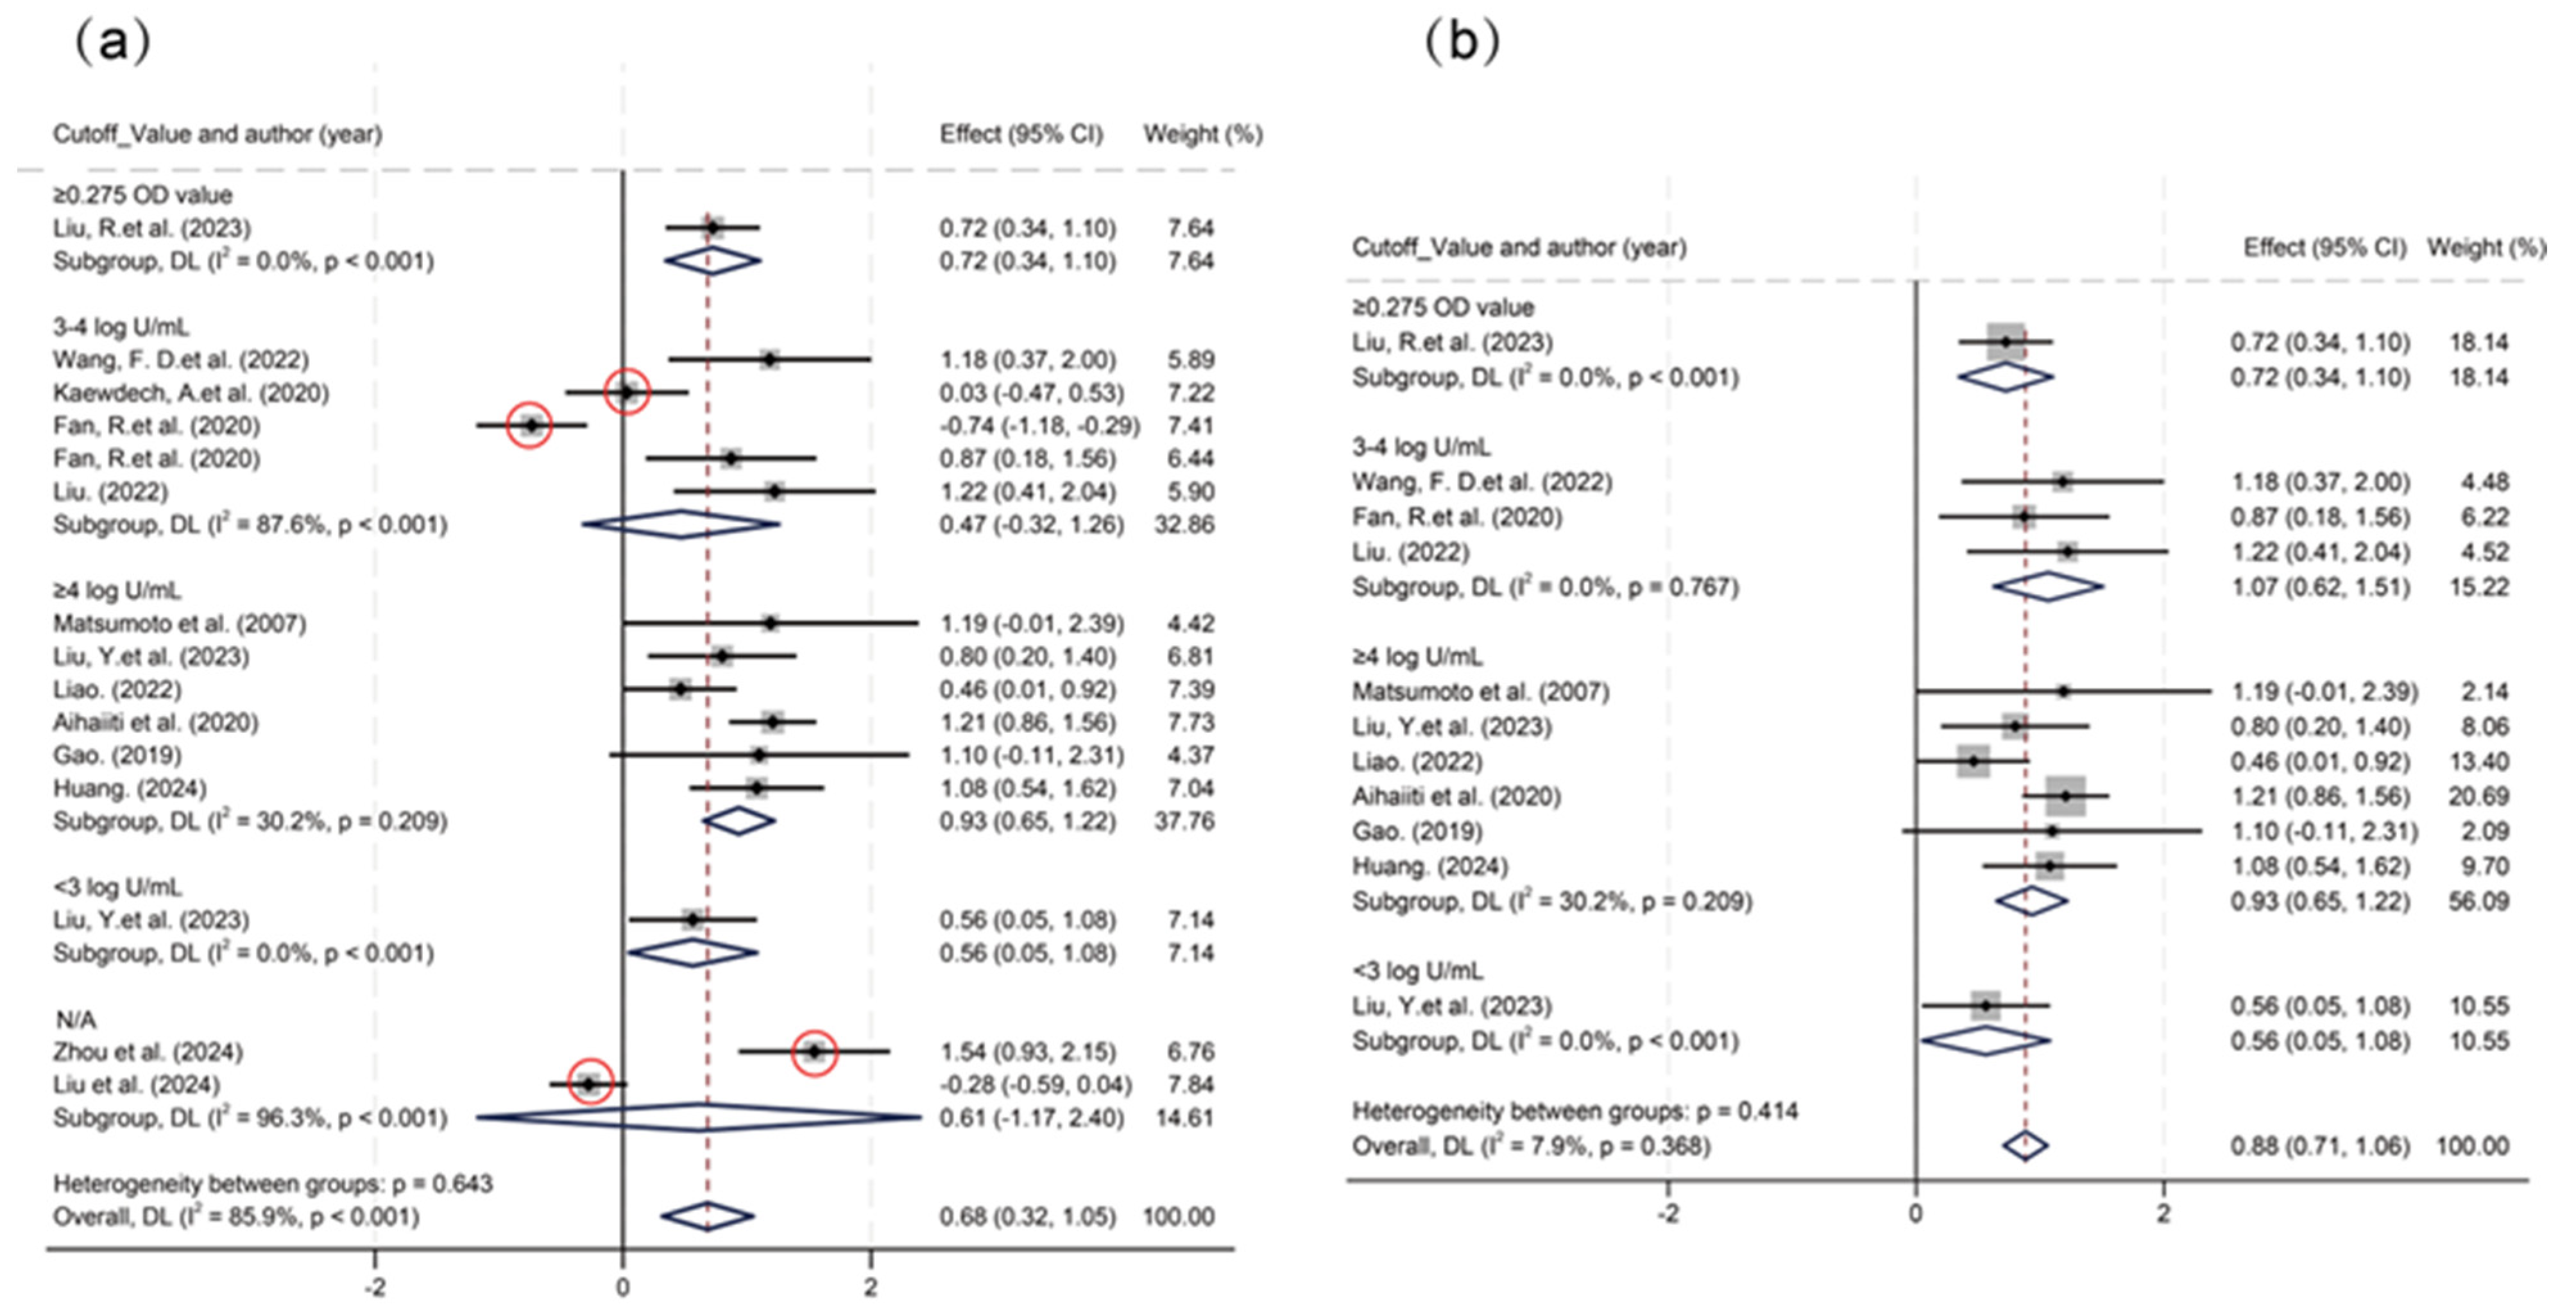
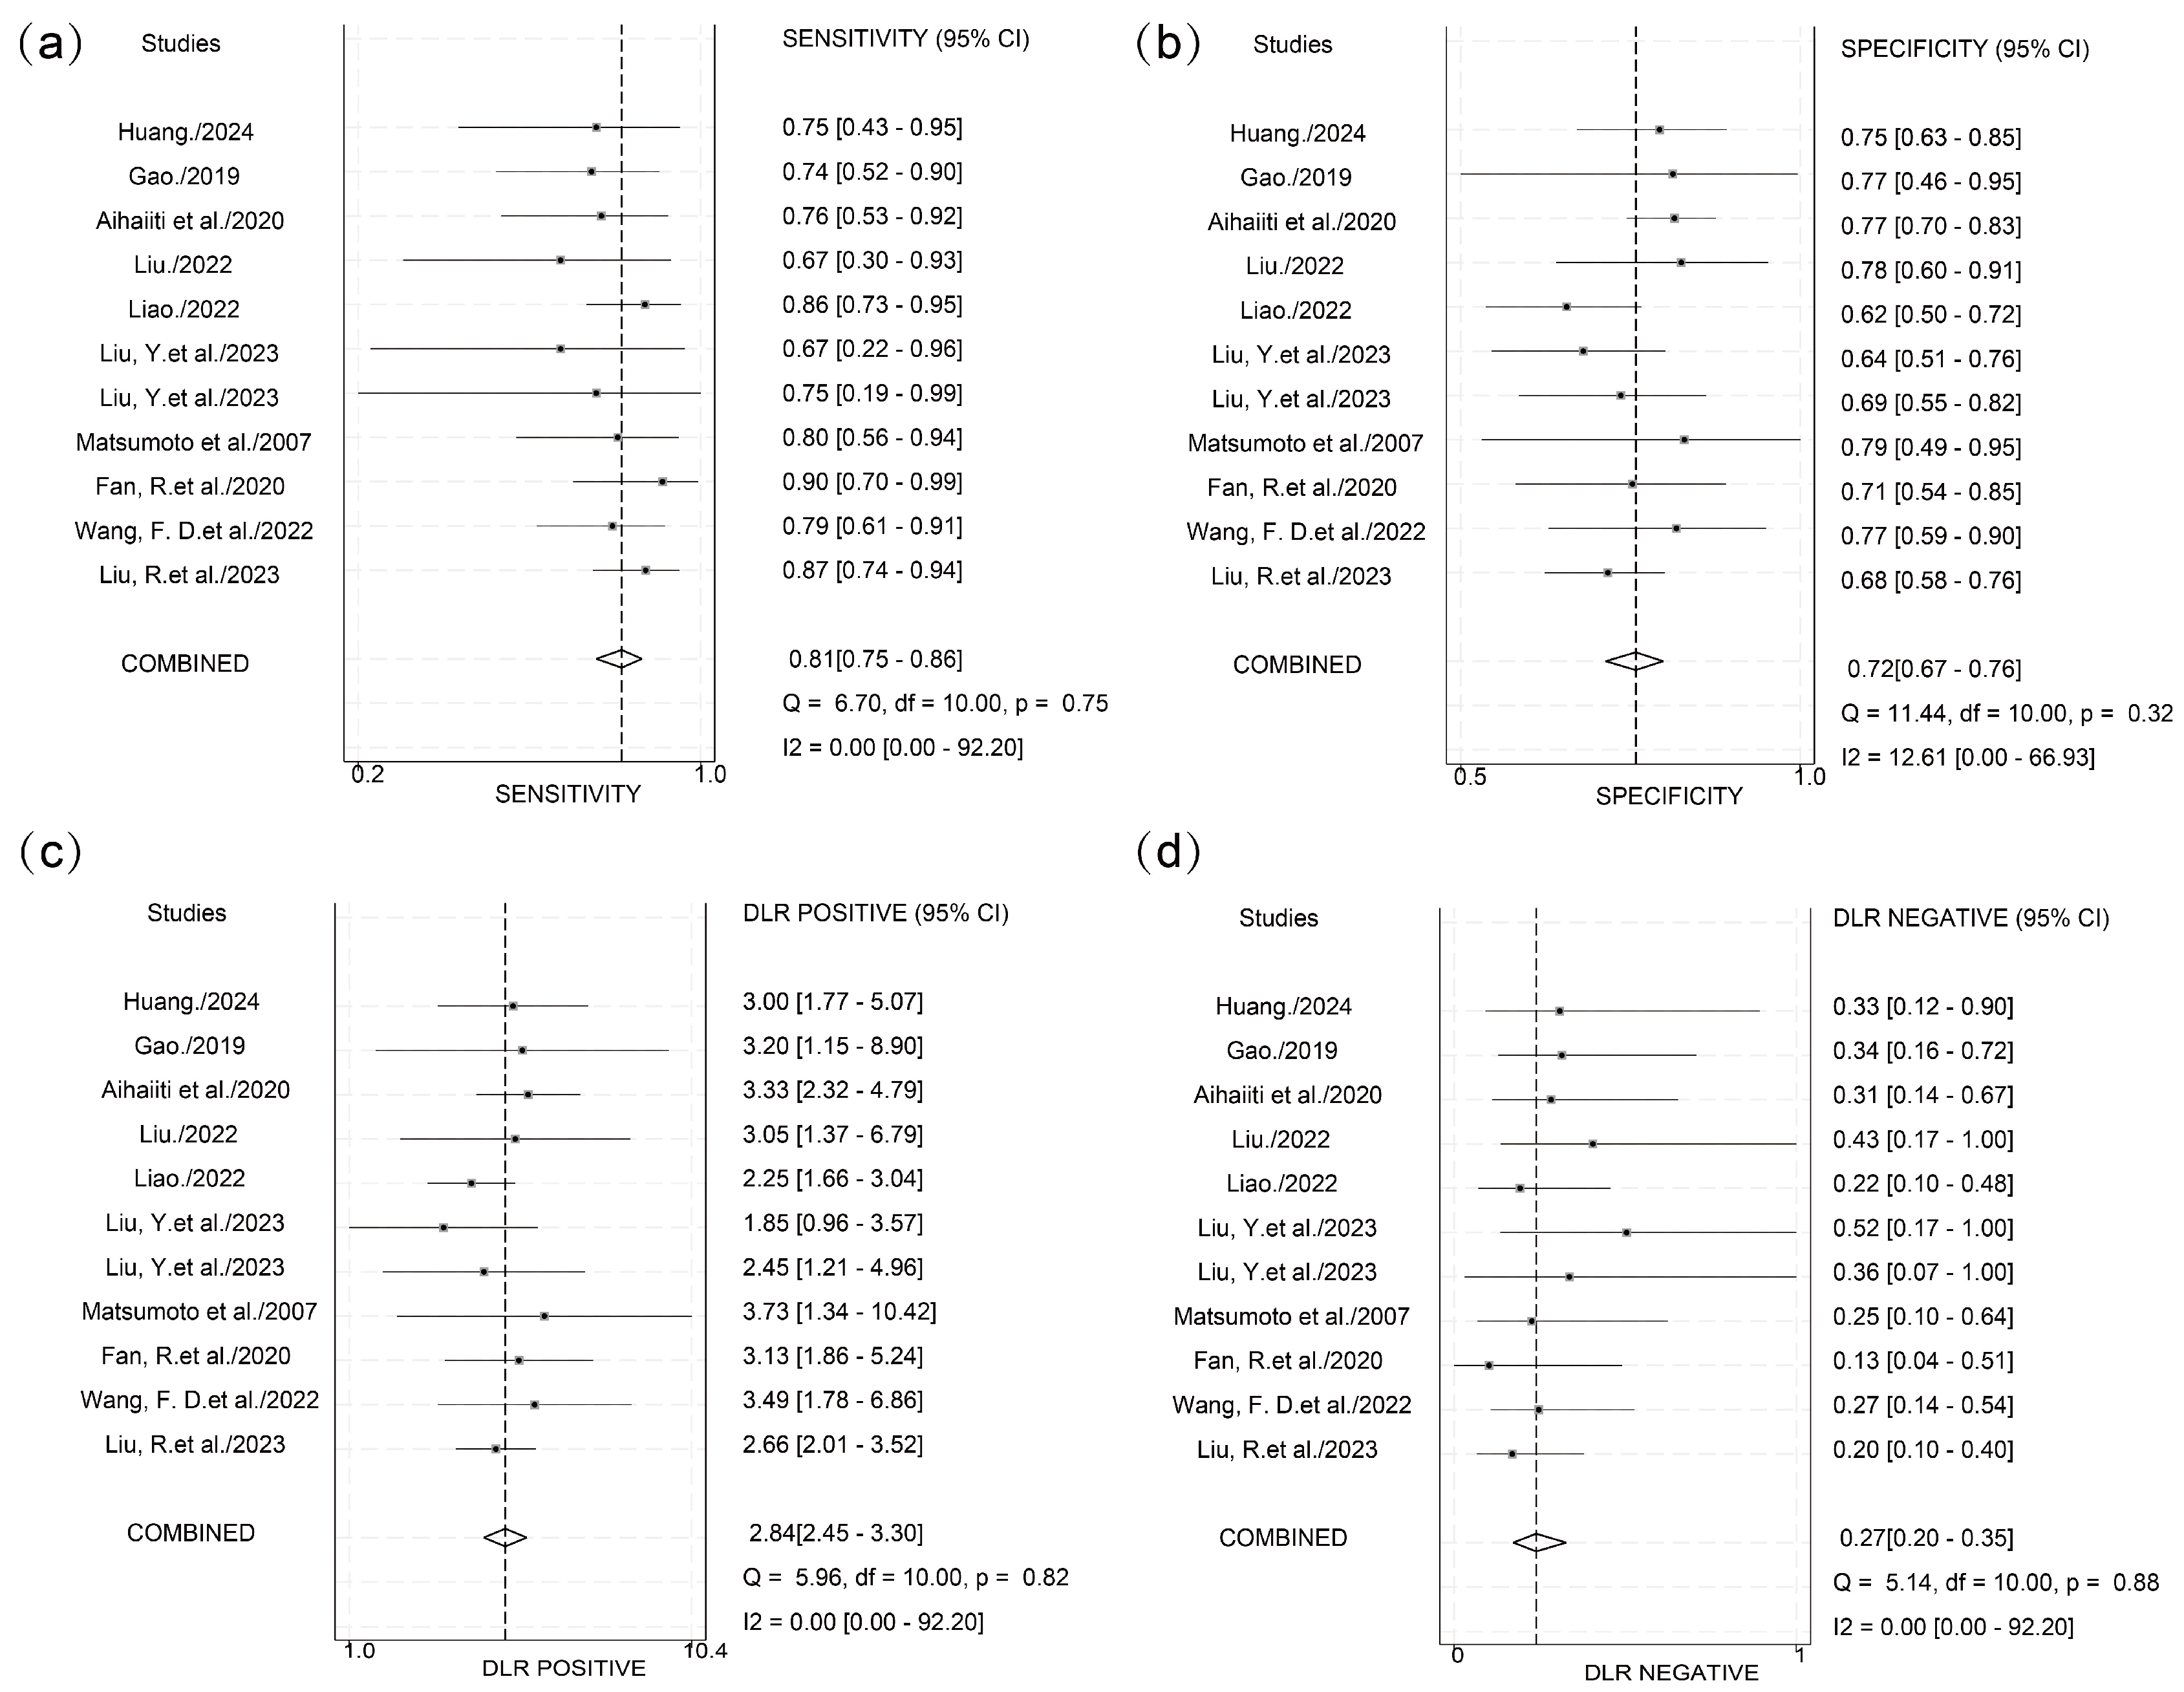
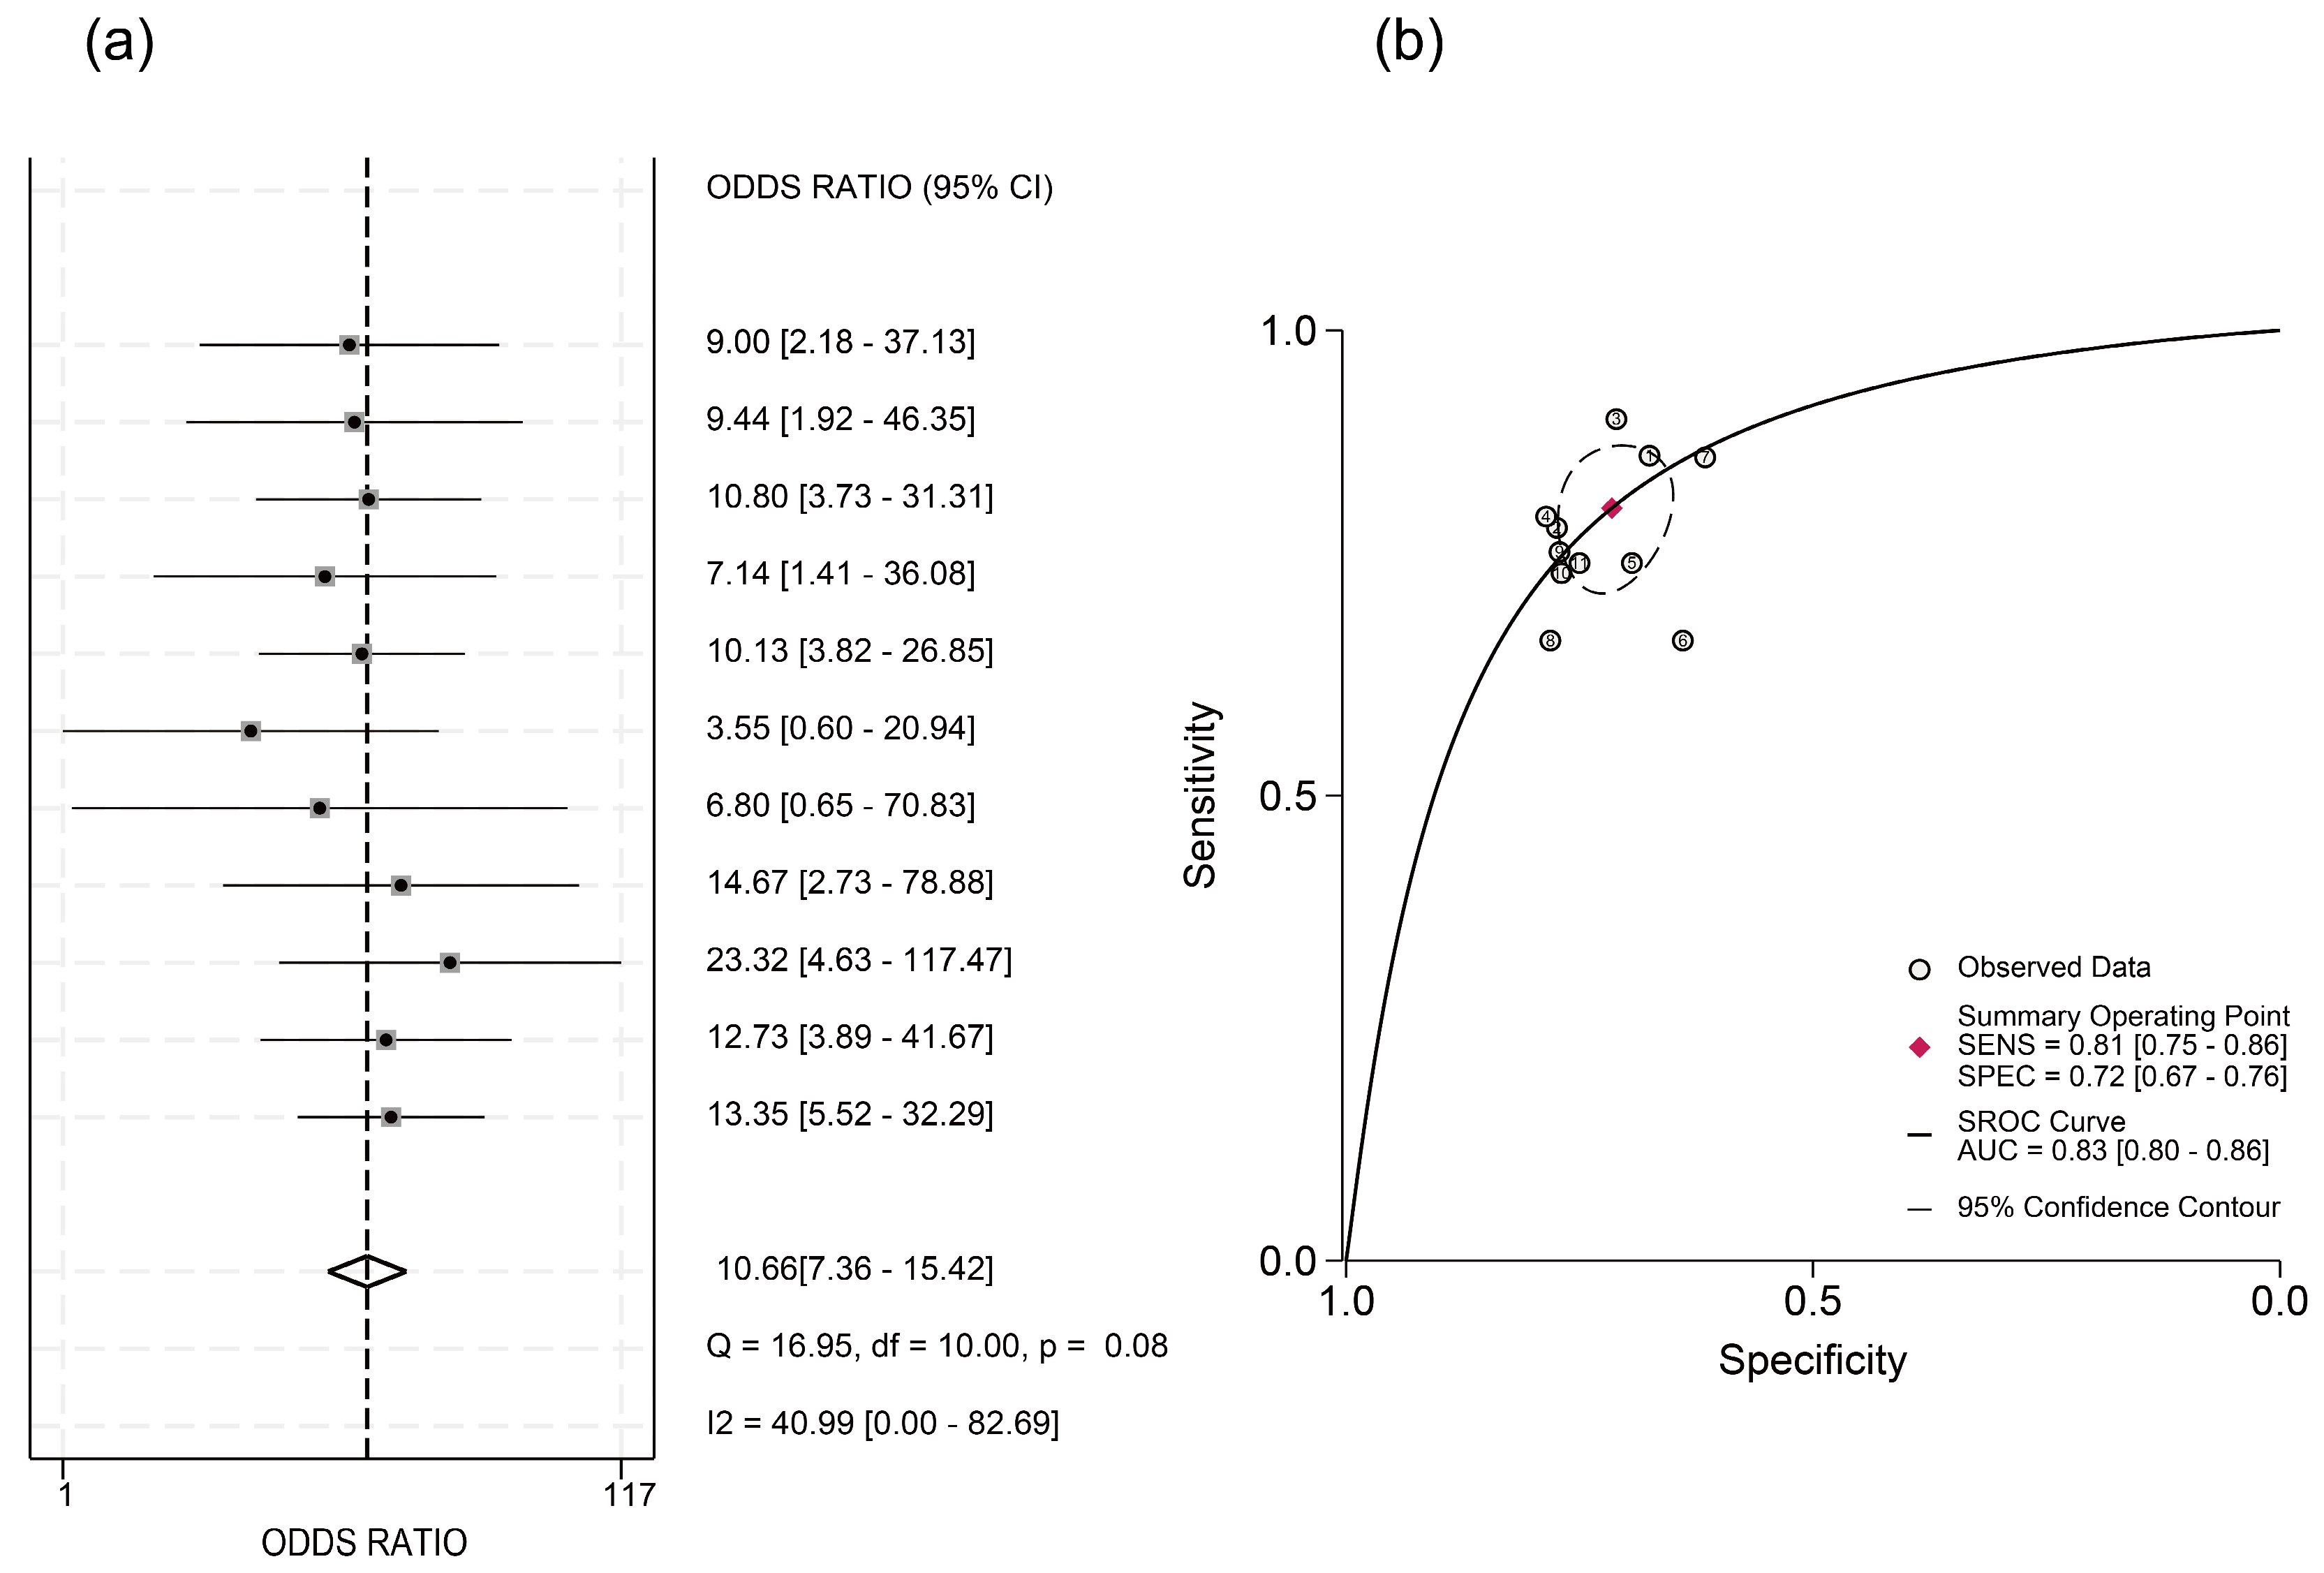
3.3. Predictive Efficacy of HBcrAg Across Various Recurrence Outcomes

This meta-analysis incorporated data from 15 cohorts, utilizing effect sizes corresponding to maximal area under the curve (AUC) values reported in individual studies. For predicting all recurrence outcomes, HBcrAg demonstrated a pooled sensitivity of 0.84 (95% CI, 0.77–0.88; I2 = 45.8%) and specificity of 0.67 (95% CI, 0.59–0.74; I2 = 87.5%). Diagnostic likelihood ratios included a PLR of 2.56 (95% CI, 2.10–3.11; I2 = 74.6%) and NLR of 0.24 (95% CI, 0.18–0.32; I2 = 0%), with DOR of 10.53 (95% CI, 7.62–14.57; I2 = 33.5%). Bivariate modeling revealed substantial heterogeneity (overall I2 = 96.44; 95% CI, 93.81–99.06), predominantly driven by specificity heterogeneity (I2 = 87.5%) (Figures S1 and S2). Deeks’ funnel plot analysis indicated no significant publication bias (p > 0.05) (Figure 2).
Significant threshold effects were identified via Spearman’s correlation analysis of logit-transformed sensitivity and specificity (ρ = −0.6381, p < 0.05). Subgroup analysis stratified by cutoff value ranges showed significant heterogeneity in the 3–4 log U/mL group (I2 = 87.6%) and the N/A group (I2 = 96.3%) (Figure 3). Within the 3–4 log U/mL subgroup, studies by Kaewdech et al. and Fan et al. were outliers, showing results contradicting the pooled estimate with significantly non-overlapping 95% CIs. After exclusion of the N/A group and these two outlier studies, threshold effects were eliminated (ρ = −0.1758, p = 0.6218), and heterogeneity was reduced. Pooled analysis demonstrated that HBcrAg achieved a sensitivity of 0.81 (95% CI, 0.75–0.86; I2 = 0), specificity of 0.72 (95% CI, 0.67–0.76; I2 = 12.61), PLR of 2.8 (95% CI, 2.4–3.3; I2 = 0), NLR of 0.27 (95% CI, 0.20–0.35; I2 = 0), and DOR of 10.66 (95% CI, 7.36–15.42; I2 = 40.99) for predicting recurrence outcomes. The summary AUC was 0.83 (95% CI: 0.80–0.86) (Figure 4 and Figure 5).
Meta-regression analysis of potential confounders (including age, sex, HBeAg positivity rate, HBsAg/HBcrAg levels, publication year, detection timing, and endpoint events) showed no significant impact on HBcrAg’s predictive performance (Tables S2 and S3), suggesting robust diagnostic utility across diverse populations and methodological contexts. Furthermore, sensitivity analysis confirmed result stability with <10% variation in the DOR upon sequential study exclusion (Figure 6).

4. Discussion

Although NAs effectively suppress HBV replication and delay disease progression, most patients require long-term or lifelong therapy. This challenge stems from the persistence of cccDNA in hepatocytes, which serves as a molecular reservoir for viral reactivation. Even patients achieving serological HBV DNA clearance may experience virological rebound and hepatitis recurrence after treatment cessation. Recently, HBcrAg, a novel biomarker reflecting cccDNA activity and viral reservoir dynamics, has gained significant attention. Studies demonstrate strong correlations between HBcrAg and cccDNA (r = 0.70), intrahepatic total HBV DNA (r = 0.67), and serum HBV DNA (r = 0.69) [29]. Furthermore, declining serum HBcrAg levels correlate with increasing HBsAg seroclearance rates over time [30], and HBcrAg reliably reflects persistent viral reservoir activity during long-term NAs therapy. These properties support its theoretical role in predicting post-treatment relapse.
This meta-analysis systematically evaluated HBcrAg’s predictive performance for multidimensional HBV recurrence outcomes (VR, CR, acute hepatitis flares, and HBV reactivation [HBVr]) using data from 13 studies involving 1529 patients. Results revealed excellent predictive value for endpoints including ALT flares, CR, VR, and HBVr, with a pooled AUC of 0.83 (81% sensitivity and 72% specificity). Meta-regression analysis indicated robust clinical generalizability: covariates including age, sex, HBeAg status, HBsAg levels, and study design variations did not significantly affect predictive stability (interaction tests, p > 0.05). Thus, in NA-treated patients meeting current cessation criteria, elevated baseline or EOT serum HBcrAg levels (minimum cutoff: 2.54 log IU/mL in this analysis) may significantly increase relapse risk. This aligns with the Japan Society of Hepatology (JSH) risk stratification strategy, which categorizes HBcrAg levels into three intervals (<3.0 log U/mL, 3.0–4.0 log U/mL, and ≥4.0 log U/mL), assigning relapse risk scores of 0, 1, and 2, respectively. Patients with total scores ≥ 1 exhibit < 50% relapse-free rates and require individualized extended therapy [31].
Current HBV relapse prediction research emphasizes HBsAg, HBV RNA, and HBV DNA. One study found HBsAg significantly inferior to HBcrAg in predicting ALT flares (AUC difference > 0.15, p < 0.01) [32]. Although HBV RNA shows comparable predictive potential [32,33], its reliance on complex nucleic acid amplification techniques (e.g., RT-qPCR) limits utility in primary care. Conversely, HBcrAg detection via routine ELISA or CLEIA offers advantages in simplicity, cost-effectiveness, and standardization, enhancing clinical monitoring feasibility.
This study has several limitations. First, the included studies had relatively high bias risk (six moderate-risk, one high-risk), potentially compromising internal validity. Second, while EOT HBcrAg levels are critical for cessation decisions, insufficient data precluded dedicated analysis of this pivotal timepoint. Third, mild specificity heterogeneity persisted even after excluding four studies with aberrant thresholds; potential sources (e.g., detection methods or viral genotype distribution) remain underexplored. Finally, despite robust statistical predictive performance, HBcrAg alone remains insufficient for clinical decisions. JSH guidelines emphasize comprehensive evaluation including HBV DNA, HBsAg quantification, and histological indicators—though this study did not systematically explore multi-marker models.

5. Conclusions and Perspectives

Although HBcrAg demonstrates robust predictive utility, its standalone application faces inherent limitations. Future research should prioritize multicenter prospective studies employing standardized HBcrAg assays with predefined thresholds. Such studies incorporate diverse patient cohorts spanning viral genotypes, ethnicities, and liver disease stages to improve generalizability. Furthermore, investigating combinatorial strategies integrating HBcrAg with other virological markers (e.g., HBV RNA and intrahepatic cccDNA) to develop multidimensional predictive models is warranted. This integrated approach will establish a refined risk stratification framework essential for guiding evidence-based antiviral treatment cessation decisions.

Supplementary Materials

The following supporting information can be downloaded at: https://www.mdpi.com/article/10.3390/v17070929/s1, Figure S1: Integrated Sensitivity, Specificity, Positive Likelihood Ratio, Negative Likelihood Ratio before exclusion; Figure S2: Diagnostic Odds Ratio (DOR) and Summary Receiver Operating Characteristic (SROC) before exclusion; Table S1: Characteristics of the included studies; Table S2: Meta-Regression analysis of HBcrAg in predicting HBV recurrence outcomes: after exclusion of studies; Table S3: Meta-Regression analysis of HBcrAg in predicting HBV recurrence outcomes: before exclusion of studies.

Author Contributions

W.Y. and J.Y. designed the study. G.Y., M.C. and Y.D. collected and curated the data. G.Y. performed statistical analysis. G.Y., M.C., Y.D., M.K., N.J., W.Y. and J.Y. critically edited the manuscript. G.Y., M.C. and Y.D. accessed and verified the data in the study. All authors have read and agreed to the published version of the manuscript.

Funding

This work was supported by Program of Shanghai Academic Research Leader (22XD1404800 to J.Y.).

Institutional Review Board Statement

Not applicable.

Informed Consent Statement

Not applicable.

Data Availability Statement

The datasets used and/or analyzed during the current study are available from the corresponding authors on reasonable request. Please contact yinjh@smmu.edu.cn for data access inquiries.

Conflicts of Interest

The authors have declared that they have no conflicts of interest.

References

  1. The Polaris Observatory Collaborators. Global prevalence, cascade of care, and prophylaxis coverage of hepatitis B in 2022: A modelling study. Lancet Gastroenterol. Hepatol. 2023, 8, 879–907. [Google Scholar] [CrossRef] [PubMed]
  2. The Polaris Observatory Collaborators. Global prevalence, treatment, and prevention of hepatitis B virus infection in 2016: A modelling study. Lancet Gastroenterol. Hepatol. 2018, 3, 383–403. [Google Scholar] [CrossRef] [PubMed]
  3. Hosaka, T.; Suzuki, F.; Kobayashi, M.; Fujiyama, S.; Kawamura, Y.; Sezaki, H.; Akuta, N.; Kobayashi, M.; Suzuki, Y.; Saitoh, S.; et al. Ultrasensitive Assay for Hepatitis B Core-Related Antigen Predicts Hepatocellular Carcinoma Incidences During Entecavir. Hepatol. Commun. 2022, 6, 36–49. [Google Scholar] [CrossRef] [PubMed]
  4. Lin, C.L.; Kao, J.H. Development of hepatocellular carcinoma in treated and untreated patients with chronic hepatitis B virus infection. Clin. Mol. Hepatol. 2023, 29, 605–622. [Google Scholar] [CrossRef]
  5. Caviglia, G.P.; Armandi, A.; Rosso, C.; Ribaldone, D.G.; Pellicano, R.; Fagoonee, S. Hepatitis B Core-Related Antigen as Surrogate Biomarker of Intrahepatic Hepatitis B Virus Covalently-Closed-Circular DNA in Patients with Chronic Hepatitis B: A Meta-Analysis. Diagnostics 2021, 11, 187. [Google Scholar] [CrossRef]
  6. Nassal, M. HBV cccDNA: Viral persistence reservoir and key obstacle for a cure of chronic hepatitis B. Gut 2015, 64, 1972–1984. [Google Scholar] [CrossRef]
  7. Mak, L.Y.; Wong, D.K.; Cheung, K.S.; Seto, W.K.; Lai, C.L.; Yuen, M.F. Review article: Hepatitis B core-related antigen (HBcrAg): An emerging marker for chronic hepatitis B virus infection. Aliment. Pharmacol. Ther. 2018, 47, 43–54. [Google Scholar] [CrossRef]
  8. Cao, Q.H.; Liu, H.; Yan, L.J.; Wang, H.C.; Ding, Z.N.; Mao, X.C.; Li, R.Z.; Pan, G.Q.; Zhang, X.; Tian, B.W.; et al. Role of hepatitis B core-related antigen in predicting the occurrence and recurrence of hepatocellular carcinoma in patients with chronic hepatitis B: A systemic review and meta-analysis. J. Gastroenterol. Hepatol. 2024, 39, 1464–1475. [Google Scholar] [CrossRef]
  9. Mukherjee, R.; Reddy, P.B.; Arava, J.; Rao, P.; Mitnala, S.; Gupta, R.; Reddy, D. Relationship between serum HBsAg level, HBV DNA level, and peripheral immune cells in patients with chronic hepatitis B virus infection. Hepat. Med. 2010, 2, 157–162. [Google Scholar] [CrossRef]
  10. Lim, S.G.; Teo, A.E.; Chan, E.S.; Phyo, W.W.; Chen, D.H.Y.; Hargreaves, C.A. Stopping Nucleos(t)ide Analogues in Chronic Hepatitis B Using HBsAg Thresholds: A Meta-Analysis and Meta-Regression. Clin. Gastroenterol. Hepatol. 2024, 22, 2403–2412. [Google Scholar] [CrossRef]
  11. Liu, Y.; Jia, M.; Wu, S.; Jiang, W.; Feng, Y. Predictors of relapse after cessation of nucleos(t)ide analog treatment in HBeAg-negative chronic hepatitis B patients: A meta-analysis. Int. J. Infect. Dis. 2019, 86, 201–207. [Google Scholar] [CrossRef] [PubMed]
  12. Hall, S.A.L.; Vogrin, S.; Wawryk, O.; Burns, G.S.; Visvanathan, K.; Sundararajan, V.; Thompson, A. Discontinuation of nucleot(s)ide analogue therapy in HBeAg-negative chronic hepatitis B: A meta-analysis. Gut 2022, 71, 1629–1641. [Google Scholar] [CrossRef]
  13. Hayden, J.A.; van der Windt, D.A.; Cartwright, J.L.; Cote, P.; Bombardier, C. Assessing bias in studies of prognostic factors. Ann. Intern. Med. 2013, 158, 280–286. [Google Scholar] [CrossRef] [PubMed]
  14. Jones, C.M.; Ashrafian, H.; Skapinakis, P.; Arora, S.; Darzi, A.; Dimopoulos, K.; Athanasiou, T. Diagnostic accuracy meta-analysis: A review of the basic principles of interpretation and application. Int. J. Cardiol. 2010, 140, 138–144. [Google Scholar] [CrossRef]
  15. Chu, H.; Guo, H.; Zhou, Y. Bivariate random effects meta-analysis of diagnostic studies using generalized linear mixed models. Med. Decis. Mak. 2010, 30, 499–508. [Google Scholar] [CrossRef]
  16. Kaewdech, A.; Tangkijvanich, P.; Sripongpun, P.; Witeerungrot, T.; Jandee, S.; Tanaka, Y.; Piratvisuth, T. Hepatitis B surface antigen, core-related antigen and HBV RNA: Predicting clinical relapse after NA therapy discontinuation. Liver Int. 2020, 40, 2961–2971. [Google Scholar] [CrossRef]
  17. Liu, R.; Yang, L.; Jiang, T.; Lu, Y.; Zhang, L.; Shen, G.; Wu, S.; Chang, M.; Hao, H.; Hu, L.; et al. Hepatitis B core-related antigen serum levels may be a predictor of acute flare of chronic hepatitis B among pregnant women in the immune-tolerant phase of chronic HBV infection after short-course antiviral therapy. Virulence 2023, 14, 2186335. [Google Scholar] [CrossRef]
  18. Wang, F.D.; Zhou, J.; Li, L.Q.; Wang, M.L.; Tao, Y.C.; Wang, Y.H.; Zhang, D.M.; Chen, E.Q. Serum Pregenomic RNA Combined With Hepatitis B Core-Related Antigen Helps Predict the Risk of Virological Relapse After Discontinuation of Nucleos(t)ide Analogs in Patients With Chronic Hepatitis B. Front. Microbiol. 2022, 13, 901233. [Google Scholar] [CrossRef]
  19. Matsumoto, A.; Tanaka, E.; Minami, M.; Okanoue, T.; Yatsuhashi, H.; Nagaoka, S.; Suzuki, F.; Kobayashi, M.; Chayama, K.; Imamura, M.; et al. Low serum level of hepatitis B core-related antigen indicates unlikely reactivation of hepatitis after cessation of lamivudine therapy. Hepatol. Res. 2007, 37, 661–666. [Google Scholar] [CrossRef]
  20. Fan, R.; Peng, J.; Xie, Q.; Tan, D.; Xu, M.; Niu, J.; Wang, H.; Ren, H.; Chen, X.; Wang, M.; et al. Combining Hepatitis B Virus RNA and Hepatitis B Core-Related Antigen: Guidance for Safely Stopping Nucleos(t)ide Analogues in Hepatitis B e Antigen-Positive Patients With Chronic Hepatitis B. J. Infect. Dis. 2020, 222, 611–618. [Google Scholar] [CrossRef]
  21. Liu, Y.; Nuersulitan, R.; Zhang, C.; Huo, N.; Li, J.; Song, Y.; Zhu, J.; Liu, W.; Zhao, H. Steady Decline of HBV DNA Load under NAs in Lymphoma Patients and a Higher Level of qAnti-HBc Predict HBV Reactivation. J. Clin. Med. 2023, 13, 23. [Google Scholar] [CrossRef] [PubMed]
  22. Huang, D.; Yuan, Z.; Wu, D.; Yuan, W.; Chang, J.; Chen, Y.; Ning, Q.; Yan, W. HBV Antigen-Guided Switching Strategy From Nucleos(t)ide Analogue to Interferon: Avoid Virologic Breakthrough and Improve Functional Cure. J. Med. Virol. 2024, 96, e70021. [Google Scholar] [CrossRef] [PubMed]
  23. Zhou, F.; Wang, Y.; Ouyang, Y. Predictive value of HBV pgRNA combined with HBcrAg on the relapse of patients with chronic hepatitis B after drug withdrawal. Chin. J. Liver Dis. (Electron. Version) 2024, 16, 42–47. [Google Scholar]
  24. Liu Yaodan, L.M. Construction of a risk prediction model for postpartum hepatitis flare in HBV-infected pregnant women with mother-to-child transmission prevention. Prog. Obstet. Gynecol. 2024, 33, 196–200+204. [Google Scholar] [CrossRef]
  25. Liao, G. Effects of Hepatitis B Core-related Antigen and T cell Receptor Dynamic Changes on Relapse After Discontinuation of Nucleos(t)ide Analogues Treatment in Chronic Hepatitis B Patients. Ph.D. Thesis, Southern Medical University, Guangzhou, China, 2022. [Google Scholar] [CrossRef]
  26. Liu, Z. Clinical Study of Serum pgRNA, HBcrAg and HBsAg in Predicting the Efficacy of Pegylated Interferon in the Treatment of Chronic Hepatitis B. Master’s Thesis, Army Medical University, Shapingba, China, 2022. [Google Scholar] [CrossRef]
  27. Mikrenisha Aihaiti, K.K. Value of postoperative hepatitis B core-related antigen level to the prediction of hepatitis B virus relapse after liver transplantation. J. Chin. Pract. Diagn. Ther. 2020, 34, 1266–1269. [Google Scholar] [CrossRef]
  28. Gao, C. The Expression and Clinical Significance of Serum miRNA-122 After Cessation of Nucleos(t)ide Analogue Therapy for Chronic Hepatitis B. Master’s Thesis, Southern Medical University, Guangzhou, China, 2019. [Google Scholar] [CrossRef]
  29. Wong, D.K.; Seto, W.K.; Cheung, K.S.; Chong, C.K.; Huang, F.Y.; Fung, J.; Lai, C.L.; Yuen, M.F. Hepatitis B virus core-related antigen as a surrogate marker for covalently closed circular DNA. Liver Int. 2017, 37, 995–1001. [Google Scholar] [CrossRef]
  30. Tseng, T.C.; Chiang, C.; Liu, C.J.; Hong, C.M.; Su, T.H.; Yang, H.C.; Yang, W.T.; Liu, C.H.; Chen, P.J.; Kao, J.H. Low Hepatitis B Core-Related Antigen Levels Correlate Higher Spontaneous Seroclearance of Hepatitis B Surface Antigen in Chronic Hepatitis B Patients With High Hepatitis B Surface Antigen Levels. Gastroenterology 2023, 164, 669–679.e6. [Google Scholar] [CrossRef]
  31. Drafting Committee for Hepatitis Management Guidelines, the Japan Society of Hepatology. Japan Society of Hepatology Guidelines for the Management of Hepatitis B Virus Infection: 2019 update. Hepatol. Res. 2020, 50, 892–923. [Google Scholar] [CrossRef]
  32. Brakenhoff, S.M.; de Knegt, R.J.; van Campenhout, M.J.H.; van der Eijk, A.A.; Brouwer, W.P.; van Bommel, F.; Boonstra, A.; Hansen, B.E.; Berg, T.; Janssen, H.L.A.; et al. End-of-treatment HBsAg, HBcrAg and HBV RNA predict the risk of off-treatment ALT flares in chronic hepatitis B patients. J. Microbiol. Immunol. Infect. 2023, 56, 31–39. [Google Scholar] [CrossRef]
  33. Xie, Y.; Li, M.; Ou, X.; Zheng, S.; Gao, Y.; Xu, X.; Yang, Y.; Ma, A.; Li, J.; Huang, Y.; et al. HBeAg-positive patients with HBsAg < 100 IU/mL and negative HBV RNA have lower risk of virological relapse after nucleos(t)ide analogues cessation. J. Gastroenterol. 2021, 56, 856–867. [Google Scholar] [CrossRef]
Figure 1. PRISMA flowchart of the study selection process.
Viruses 17 00929 g001
Figure 2. Deeks’ funnel plot asymmetry test.
Viruses 17 00929 g002
Figure 3. Subgroup analysis based on different cutoff value levels. (a) Subgroup analysis based on different cutoff value levels before exclusion. (b) Subgroup analysis after exclusion of outlier studies [16,17,18,19,20,21,22,23,24,25,26,27,28].
Viruses 17 00929 g003
Figure 4. Integrated sensitivity, specificity, PLR, NLR, and DOR after exclusion. (a) Forest plot depicting the pooled sensitivity estimate and individual study contributions. (b) Forest plot depicting the pooled specificity estimate and individual study contributions. (c) Forest plot depicting the pooled PLR estimate and individual study contributions. (d) Forest plot depicting the pooled NLR estimate and individual study contributions [17,18,19,20,21,22,25,26,27,28].
Viruses 17 00929 g004
Figure 5. DOR and SROC after exclusion of studies. (a) Forest plot depicting the pooled DOR estimate and individual study contributions after exclusion. (b) SROC curve post-exclusion with fitted curve, summary operating point (red lozenge), and 95% confidence region (ellipsoid shading) [17,18,19,20,21,22,25,26,27,28].
Viruses 17 00929 g005
Figure 6. Sensitivity analysis with effect size measured by DOR [17,18,19,20,21,22,25,26,27,28].
Viruses 17 00929 g006
Table 1. Characteristics of included studies.
Author and YearCountryStudy TypeSample YearNo. of Patients (F/M)Baseline HBeAg Status (+/Total Patients)Baseline HBsAg
(Log10 U/mL)
Baseline HBcrAg
(Log10 U/mL)
Average Age (Years)Detection Time/Prediction Time/OutcomeCut-off Value
(Log10 U/mL)
AUC (95% CI)
[Sen/Sep]
Method of Measurement
Kaewdech, Apichat et al. (2020) [16]ThailandA prospective, observational studyFebruary 2018–August 201933/5920/922.96 (2.40–3.43)3.20 (<3.00–3.90)55.0 (50.0–63.0)* EOT/EOT 48 w/Relapse30.773 (0.677–0.869) [90.3%/50.8%]CLEIA
Liu, Ruyu et al. (2023) [17]ChinaA prospective studyJanuary 2019–April 2022172/0172/172>3<326.49 ± 3.77Postpartum 12-week (12 w) EOT/Postpartum 12 w/Hepatitis B acute flare0.275 (OD value)0.84 (0.78–0.91) [86.5%/67.5%]ELISA
Wang, Fa-Da et al. (2022) [18]ChinaA retrospective studyJune 2020–January 202132/3236/64HBeAg(+): 3.41 (2.97–2.47)
HBeAg(−): 3.05 (2.77–3.42)
HBeAg(+): 3.34 ± 0.10
HBeAg(−): 3.08 ± 0.09
HBeAg(+): 47.28 ± 6.86
HBeAg(−): 47.39 ± 6.45
EOT/Within 1 year after treatment cessation/Relapse3.30.817 [78%/77%]CLEIA
Matsumoto, Akihiro et al. (2007) [19]JapanA retrospective study[N/A]14/2016/34positive6.3 (5.0–7.7)47 (35–59)EOT/Within 1 Year After Treatment Cessation/Acute Hepatitis B Flare4.1–4.60.764 [80%/80%]CLEIA
Fan, Rong et al. (2020) [20]ChinaA prospective study[N/A]35/92127/1273.3 (2.9–3.7)4.3 (4.0–4.7)30 (25–35)EOT/Within 4 Years After EOT/Relapse4 0.621 [N/A]CLEIA
13/4659/592.6 (1.4–3.0)3.9 (3.3–4.5)36 (30–43)EOT/Within 4 Years After EOT/Relapse40.798 [N/A]CLEIA
Liu, Yiqi et al. (2023) [21]ChinaA retrospective studyJune 2010–December 202123/3053Positive4.27 ± 1.9953.2 ± 12.0Pre-chemotherapy/48 Weeks Post-chemotherapy/HBV Reactivation4.6680.689 [N/A]CLEIA
29/3867Negative2.67 ± 0.5462.5 ± 11.5Pre-chemotherapy/48 Weeks Post-chemotherapy/HBV Reactivation2.540.605 [N/A]CLEIA
Huang, Da et al. (2024) [22]ChinaRCTN/A14/6633/802.797 ± 0.425N/A35.4 ± 9.8NAs EOT/During Interferon Conversion Therapy/HBV Reactivation50.755 [N/A]CLEIA
Baseline HBcrAg Prediction/During Interferon Transition Therapy/HBV ReactivationN/A0.713 [N/A]
Zhou, Fang et al. (2024) [23]ChinaA prospective studyJune 2020–June 2021Relapse group: 16/22
Non-relapse group: 36/34
Not mentioned/
108
2.82 ± 0.086.075 ± 1.5242.83 ± 9.63EOT/1 Year Later/Post-Treatment RelapseN/A0.783 (0.650–0.884) [68.42%/82.68%]CLEIA
Liu, Yaodan et al. (2024) [24]ChinaA prospective observational studyJanuary 2020–October 2022198/0198/198Postpartum Hepatitis Non-flare Group: 3.66 (3.20–4.01)
Postpartum Hepatitis Flare Group: 4.05 (3.70–4.24)
Postpartum Hepatitis Non-flare Group: 6.98 (6.77–7.18)
Postpartum Hepatitis Flare Group: 7.35 (7.31–7.52)
Postpartum Hepatitis Non-flare Group: 30.89 ± 6.13
Postpartum Hepatitis Flare Group: 29.88 ± 4.55
Antiviral Treatment Initiation/48 Weeks Postpartum/
alt flare
N/A0.713 [N/A]ELISA
Liao, Guichan. (2022) [25]ChinaA prospective studyNovember 2011–December 201827/95122/1222.55 ± 1.113.80 ± 0.8334 (29–40)EOT/5 Years Post-EOT/Relapse4.0 0.71 (0.62–0.81) [87.1%/61.5%]CLEIA
Liu, Zhongwei. (2022) [26]ChinaA prospective study[N/A][N/A]Not mentioned/
41
2.07 (1.315–2.808)3.58 ± 0.7542.09 ± 8.13EOT/During Follow-up/HBsAg Recurrence3.80.793 [66.67%/78.12%]CLEIA
Aihaiti et al. (2020) [27]ChinaA prospective studyAugust 2014–June 201730/166Not mentioned/
196
N/A4.9 (2–7.5)55 (40–74)Post-LT Day 3/3 Years Post-Transplant/HBV Recurrence4.50.818 (0.72–0.917) [76.19%/77.14%]CLEIA
Gao, Chang. (2019) [28]ChinaA prospective studyJanuary 2003–July 20113/3325/362.78 (2.02–3.32)3.85 (3.0–4.4)35.5 (29.25–41)EOT 12-week/EOT 48-week/Relapse4.10.719 (0.536–0.902) [73.7%/76.9%]CLEIA
* EOT: end-of-treatment; w: week(s); N/A: not available; ELISA: enzyme-linked immunosorbent assay; CLEIA: chemiluminescent immunoassay.
Table 2. Risk of bias assessment of included studies.
Author (Year)Study ParticipationStudy AttritionPrognostic Factor MeasurementOutcome MeasurementStudy ConfoundingStatistical Analysis and ReportingOverall Risk of Bias
Kaewdech, Apichat et al. (2020) [16]LowLowLowLowLowLowLow
Liu, Ruyu et al. (2023) [17]LowLowLowLowLowLowLow
Wang, Fa-Da et al. (2022) [18]LowLowLowLowLowLowLow
Matsumoto, Akihiro et al. (2007) [19]ModerateLowLowLowLowLowModerate
Fan, Rong et al. (2020) [20]LowModerateLowLowLowLowModerate
Liu, Yiqi et al. (2023) [21]ModerateLowLowLowLowLowModerate
Huang, Da et al. (2024) [22]LowLowLowLowLowLowLow
Zhou, Fang et al. (2024) [23]LowLowModerateLowLowLowModerate
Liu, Yaodan et al. (2024) [24]LowModerateHighLowLowLowHigh
Liao, Guichan. (2022) [25]LowLowLowLowLowLowLow
Liu, Zhongwei. (2022) [26]ModerateLowLowLowLowLowModerate
Aihaiti et al. (2020) [27]LowLowLowLowLowLowLow
Gao, Chang. (2019) [28]ModerateLowLowLowLowLowModerate
Disclaimer/Publisher’s Note: The statements, opinions and data contained in all publications are solely those of the individual author(s) and contributor(s) and not of MDPI and/or the editor(s). MDPI and/or the editor(s) disclaim responsibility for any injury to people or property resulting from any ideas, methods, instructions or products referred to in the content.

