1. Introduction
Oncolytic viruses (OVs) are specialized therapeutic agents designed to selectively infect and destroy cancer cells, leaving healthy tissues unharmed [
1,
2]. These agents, through their multifaceted therapeutic mechanisms, not only directly induce the lysis of malignant cells but also potentiate antitumor immune responses and target the tumor vasculature [
3], thereby comprehensively impeding tumor progression. A notable example is Talimogene laherparepvec (T-VEC), a Herpes Simplex Virus (HSV-1)-based oncolytic virus, which garnered FDA approval in 2015 for treating melanoma [
4,
5]. Other HSV-1-based oncolytic viruses like G47Δ are showing promise in clinical trials. In glioblastoma patients, G47Δ demonstrated safety and a notable 1-year survival rate of 84.2% in a phase 2 trial [
6]. These results have led to its conditional and time-limited approval in Japan for glioma treatment, pending further studies.
Oncolytic virotherapy, while promising, encounters significant hurdles, particularly the resistance of cancer cells to viral infection, among other challenges. This resistance is frequently attributed to the host immune response and in part type I interferon (IFN) signaling [
7]. Typically, cancer cells show a lack of interferon (IFN) reactivity as part of their neoplastic evolution; however, IFN signaling signatures can be observed in some tumor types and may be linked to OV resistance [
8,
9]. The IFN pathway which is induced among others by viral infection can activate a series of antiviral genes that effectively suppress viral replication. This innate immune mechanism, designed to protect cells from viruses, poses a challenge in oncolytic virotherapy, as it can significantly reduce the ability of therapeutic viruses to infect and destroy cancer cells. Overcoming this resistance is one key focus in the development of more effective oncolytic viral therapies.
To tackle the challenge of cancer cell resistance in oncolytic virotherapy, our team and others have tested the strategic use of selected pharmacological agents in conjunction with OVs. These strategies mostly aim to temporarily dampen the cancer cells’ IFN-related antiviral defenses, enhancing the effectiveness of oncolytic virotherapy. Multiple small molecules have been identified through high-throughput screening and rational approaches [
10,
11,
12,
13,
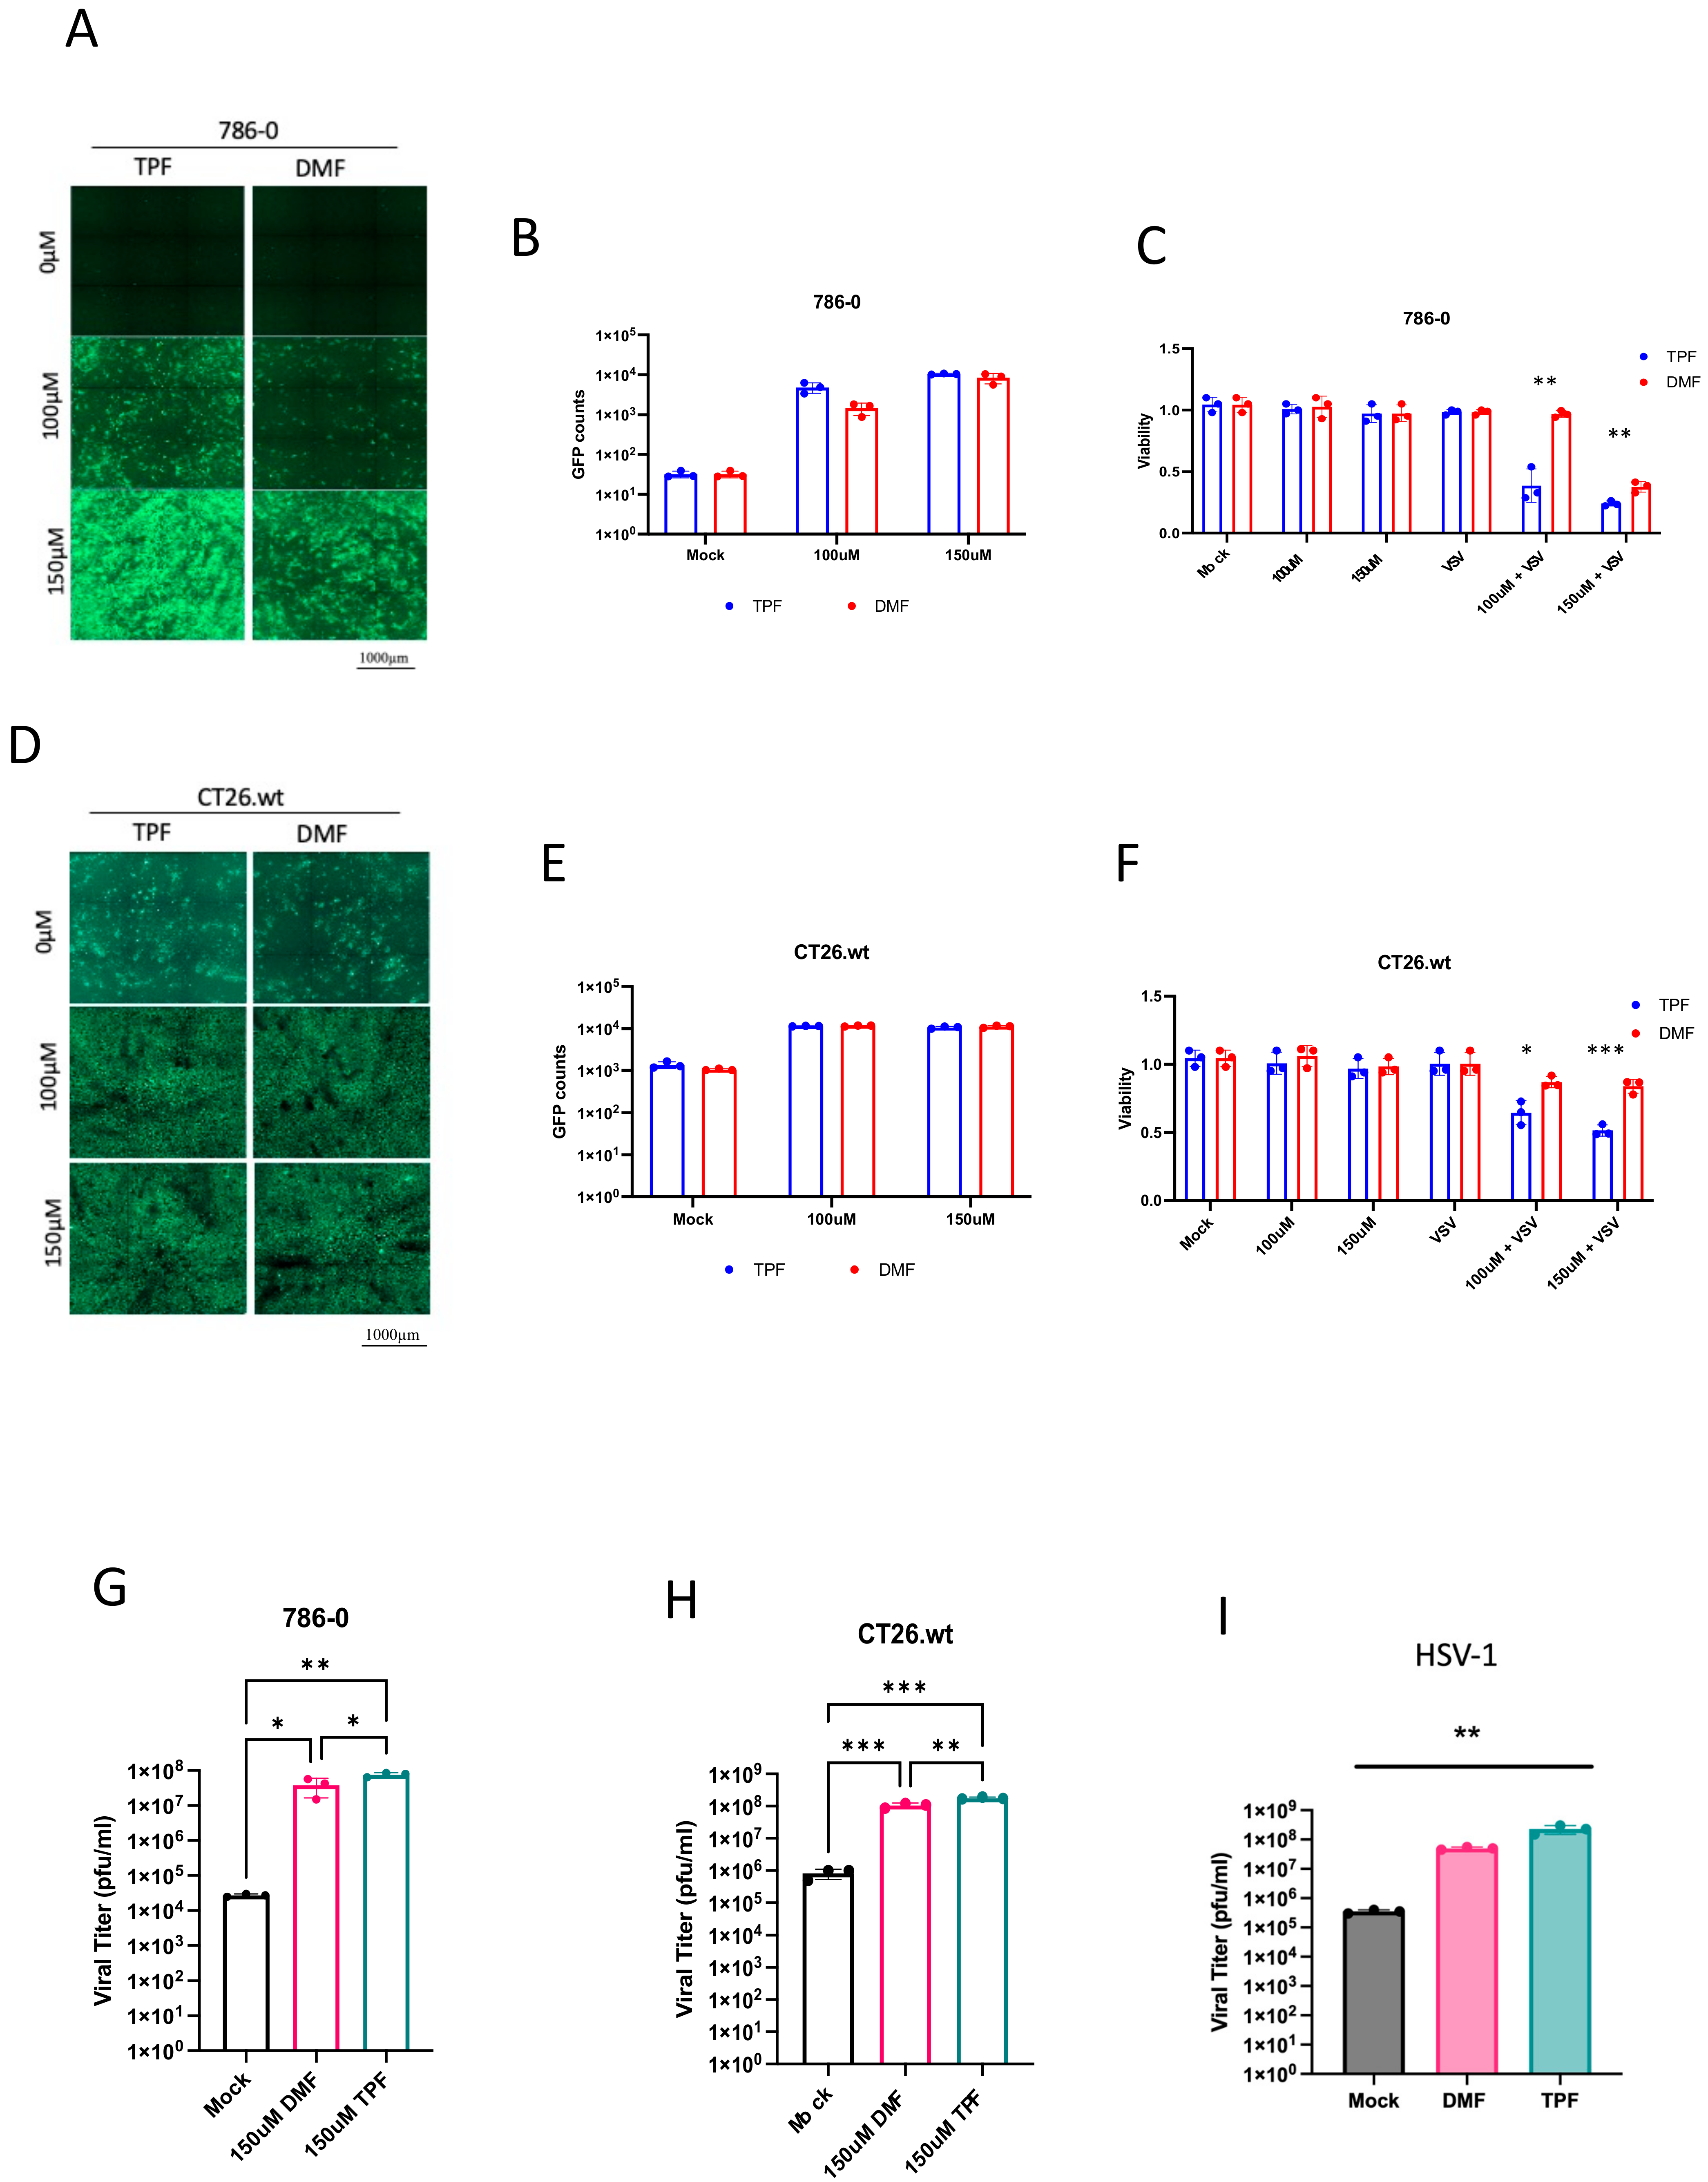
14]. Many of these molecules target the IFN pathway and its downstream regulated genes, leading to increased viral titers and enhanced effectiveness in killing tumor cells. One notable example is Dimethyl fumarate (DMF), an FDA-approved drug for multiple sclerosis, which has shown significant potential in enhancing the activity of vesicular stomatitis virus (VSVΔ51) and various oncolytic HSV-1 strains in different cancer cell lines and mouse models [
15]. Its effectiveness largely stems from its ability to inhibit the IFN type 1 pathway through preventing the nuclear translocation of NF-κB [
14,
16].
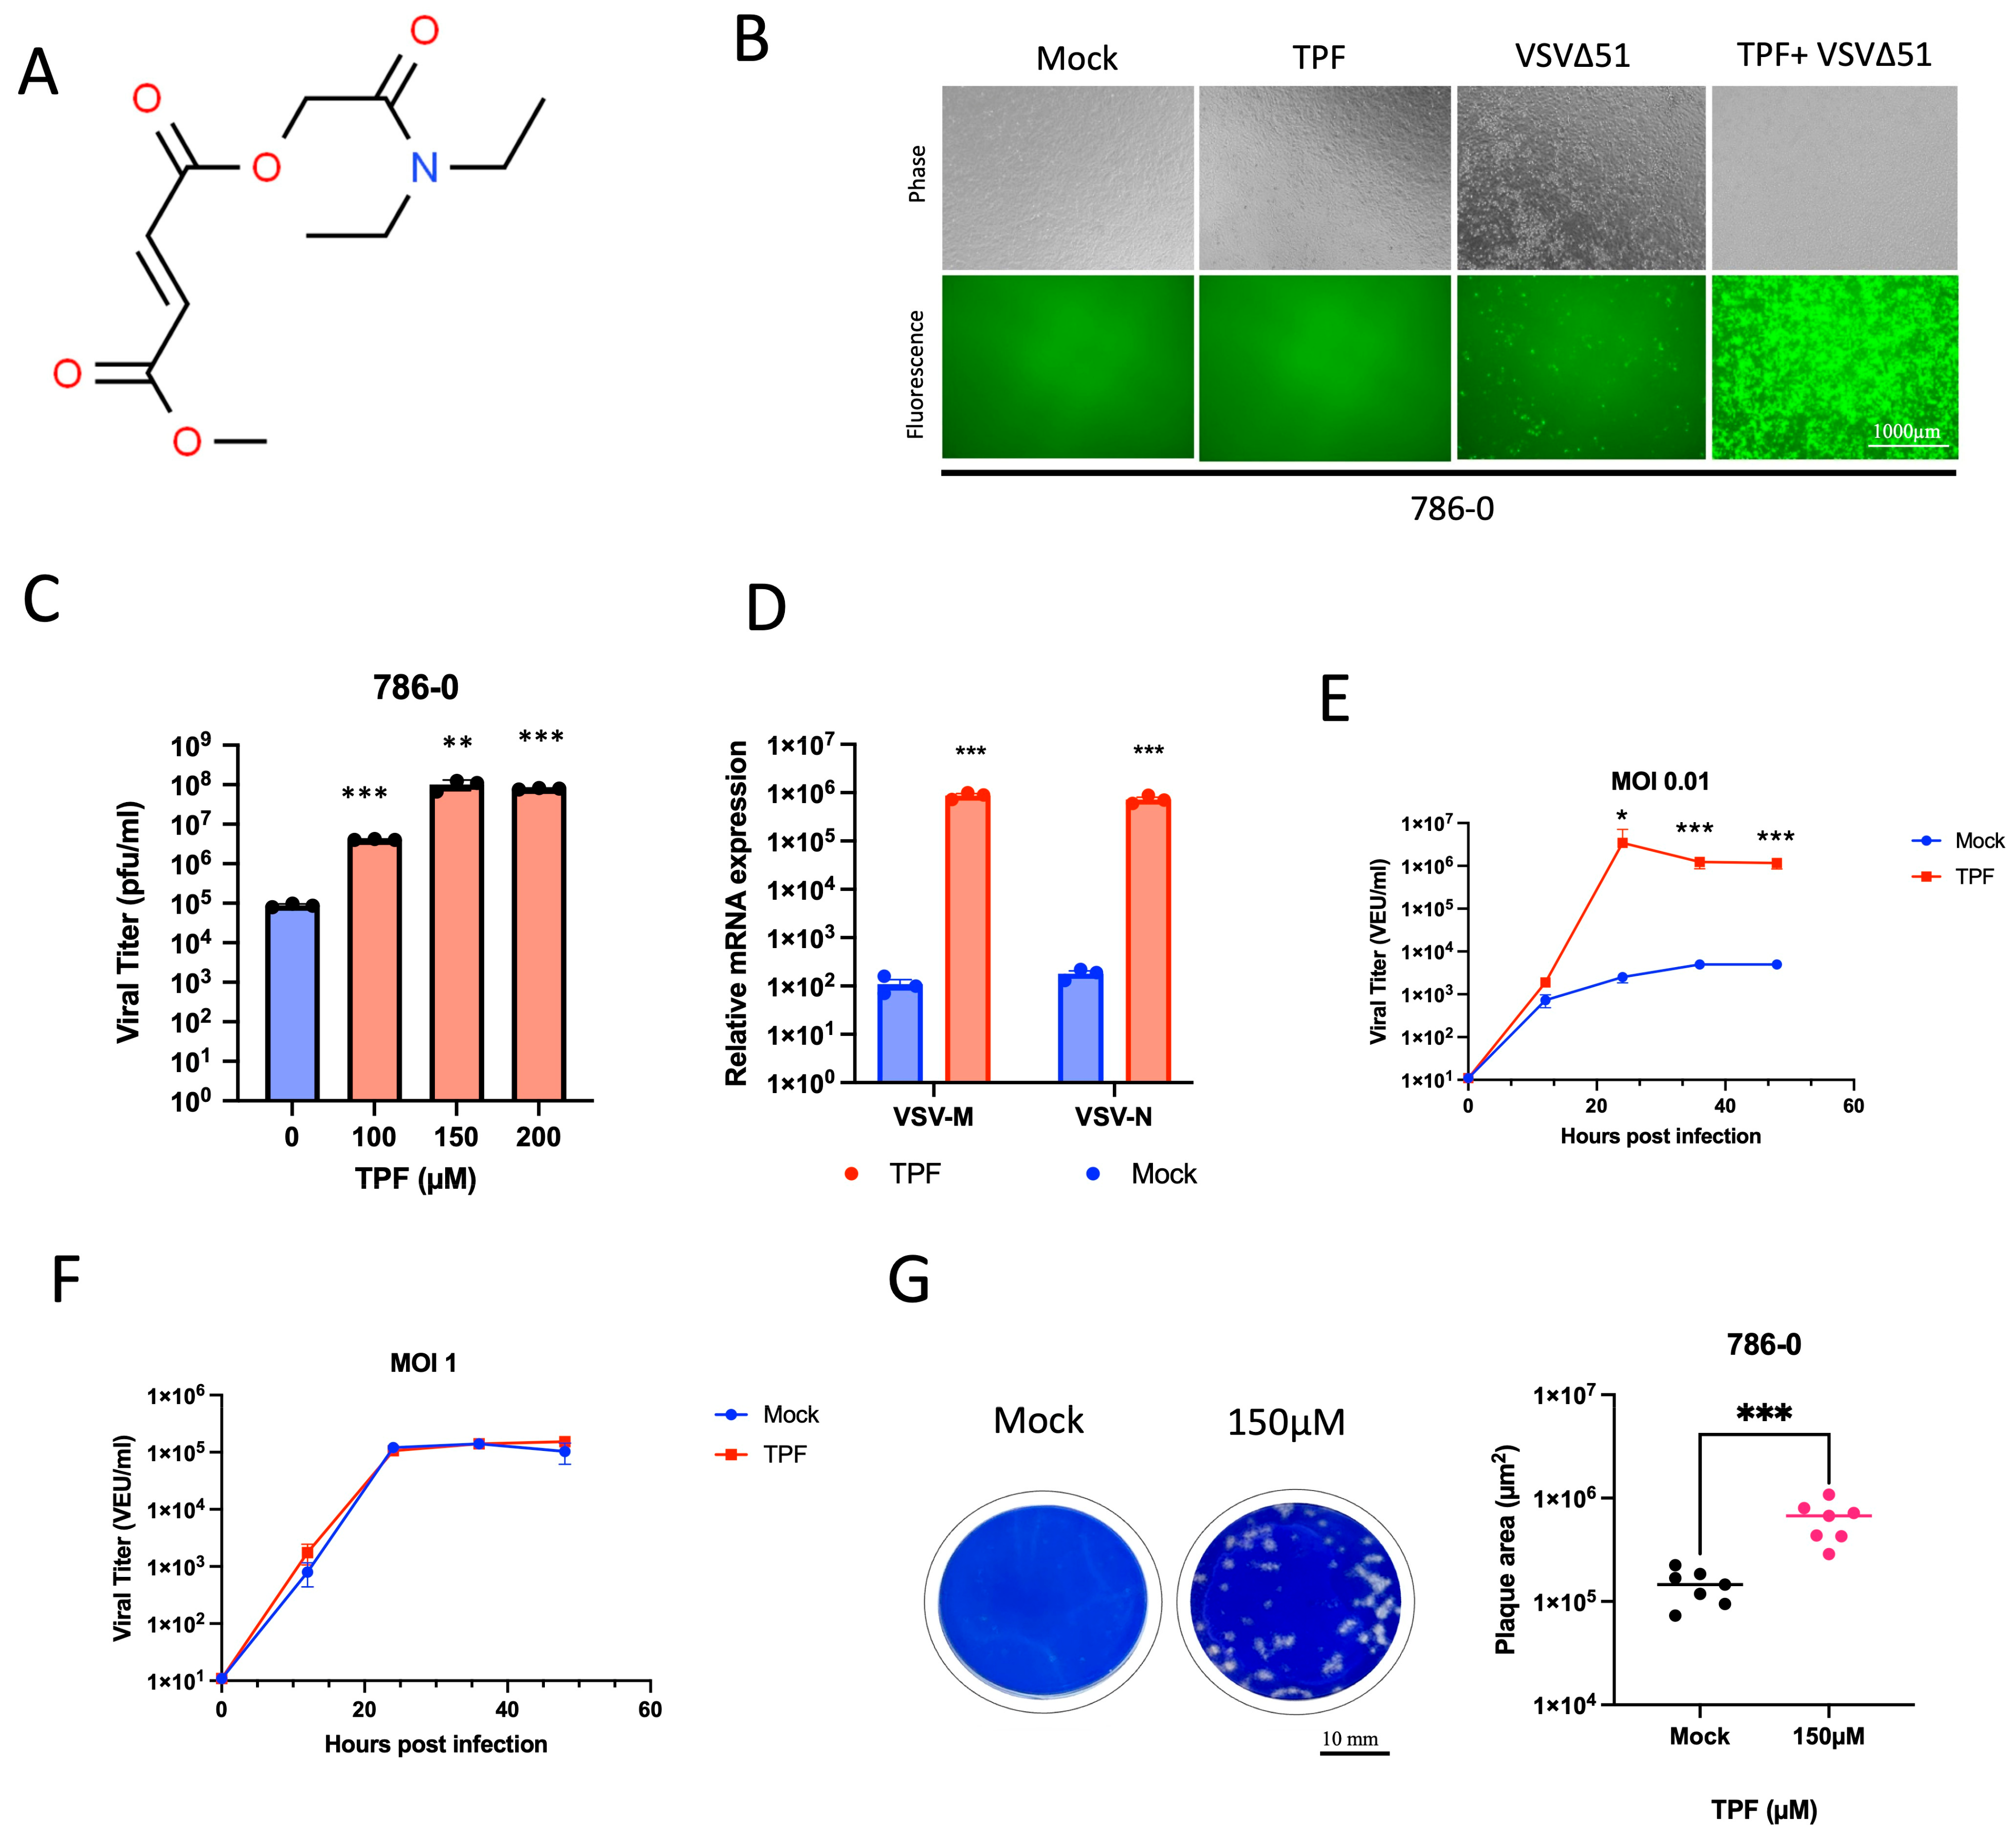
While DMF is an approved drug, it suffers from some known pharmacological limitations and side effects, which have led to the discovery and development of analogs with potentially more favorable pharmacokinetic and toxicological profiles. In this study, we focus on Tepilamide fumarate (TPF), one such analog that is currently under investigation in late-stage clinical trials for patients with psoriasis [
17]. The unexplored potential of TPF in cancer treatment and in combination with OVs presents a significant opportunity to develop improved therapeutic regimens. Our study aimed to assess the anti-cancer potential of TPF, exploring its ability to enhance the effectiveness of oncolytic viruses and other viral vectors.
2. Materials and Methods
2.1. Drugs
Dimethyl fumarate (DMF) and Monomethyl fumarate (MMF) were obtained from Sigma-Aldrich (St. Louis, MO, USA) (DMF: Cat#242926; MMF: Cat#651419). Tepilamide fumarate (TPF) was obtained from Dr. Reddy’s Laboratories Ltd. (Hyderabad, India). All the drugs were resuspended in 100% DMSO to 100 mM and further diluted at indicated dilutions before use in all in vitro experiments.
2.2. Viruses
VSVΔ51 expressing GFP or firefly luciferase (FLuc) was used throughout this study [
18]. The propagation of all viruses was carried out on Vero cells and subsequently purified using 5–50% OptiPrep (Sigma-Aldrich, St. Louis, MO, USA) gradients. Viral titers were determined using a standard plaque assay on the Vero cells, following a published protocol [
19].
HSV.n212 was obtained as a generous gift from Dr. Karen Mossman of McMaster University (Hamilton, ON, Canada). HSV.n212 titers were determined by a standard plaque assay on the Vero cells according to a previously published protocol [
20].
AAV2 expressing GFP was obtained from Virica Biotech (Ottawa, ON, Canada).
Lentivirus plasmids were purchased from Thermo Fisher Scientific (Nepean, ON, Canada) (pLenti6.3 GFP expression vector, Cat# V37006, LV MAX Packaging Mix Cat# A43237) and used to transfect HEK293 Viral Production cells (Gibco, Nepean, ON, Canada, Cat#A35347) using the LV MAX kit (Cat# A35348) and quantified by flow cytometry.
Ad5 expressing GFP was purchased from Vector Biolabs (Malvern, PA, USA), amplified on HEK293 cells, purified by CsCl gradient, and quantified using the Adeno-X Rapid Titer Kit from Takara (Palo Alto, CA, USA).
2.3. Cell Lines
All the cell lines used in this study along with information about their suppliers and the growth media are detailed in (
Table S1). The cells were cultured in Dulbecco’s Modified Eagle’s Medium (DMEM), sourced from either HyClone (Waltham, MA, USA) or Corning (Manassas, VA, USA). This medium was supplemented with 1% penicillin–streptomycin (Gibco) and 10% fetal bovine serum (FBS), obtained from VWR (Mississauga, ON, Canada), to support optimal cell growth and maintenance.
All the cells were incubated at 37 °C in a 5% CO2 humidified incubator and routinely tested for mycoplasma contamination by Hoechst staining and PCR (Diamed, Mississauga, ON, Canada, Cat # ABMG238).
2.4. Plaque Assay
The Vero cells were initially cultured in 12-well plates at a specific density of 3 × 10⁵ cells per well. The infectious samples underwent a series of dilutions using serum-free DMEM and were subsequently applied (at a volume of 500 µL per well) to the Vero cell monolayers. These cultures were then incubated at 37 °C, 5% CO2 for a duration of 60 min. Following this incubation period, the culture medium was removed and replaced with an overlay. This overlay was prepared by mixing 1% agarose and 2× DMEM supplemented with 20% FBS in a 1:1 ratio. After an additional 24 h incubation, visible plaques were fixed with a mixture of methanol and glacial acetic acid in a 3:1 ratio for a minimum of 1 h, and then stained for 30 min with a Coomassie Blue solution (comprising 4 g of Coomassie Brilliant Blue R (Sigma, Oakville, ON, Canada) (cat. B0149), 800 mL of methanol, 400 mL of acetic acid, and 2800 mL of distilled water) to enable the visualization and counting of plaques.
2.5. High-Throughput Luciferase Tittering
The Vero cells were cultured in opaque white 96-well plates using 100 μL of complete DMEM supplemented with 30 mM HEPES until they reached a confluence of 95–100%. To determine the viral titer of VSVΔ51-Fluc-infected samples, 25 μL of each sample was transferred into the wells containing the Vero cells. Additionally, a standard curve was prepared by diluting a purified virus stock with a known titer ranging from 10
6 to 10
9 PFU/mL. This standard curve was duplicated for each 96-well plate. D’Luciferin (PerkinElmer, Waltham, MA, USA, Cat. # 122799) solution was added to the wells (2 mg/mL) in sterile PBS. Luminescence was read using a Cytation microplate reader at an appropriate sensitivity. Standard curve values allow for the generation of a Hill equation, which was applied to the tittered samples to obtain viral expression units (VEU). Further details can be found in our published protocol [
21].
2.6. Viral Growth Curves
The cells were placed in 24-well plates and allowed to grow overnight, reaching full confluency by the following day. The cells were then inoculated with VSVΔ51-Fluc at an MOI of 0.01 (multi-step growth curve) or 1.0 (single-step growth curve). The cells were incubated up to 48 hpi, with 200 µL of supernatant collected and frozen at −80 °C at the following timepoints: 0, 8, 12, 24, 36, and 48 hpi. Viral titers in the collected samples were quantified by plaque assay as previously described.
2.7. Cell Viability Assay
Cellular metabolic activity was evaluated using the Resazurin metabolic dye (Millipore Sigma, Oakville, ON, Canada, cat. SI03200) following the manufacturer’s instructions. Resazurin solution with a concentration of 10% (v/v, final) was added to the wells containing treated or untreated and/or infected cells. The cells were then incubated for a duration of 2–4 h, which varied depending on the specific cell line used. Using the BioTek Microplate Reader (BioTek, Winooski, VT, USA) and Gen5 2.07 software, fluorescence was measured at 590 nm upon excitation at 530 nm. The readings were expressed relative to the average of the uninfected, untreated condition.
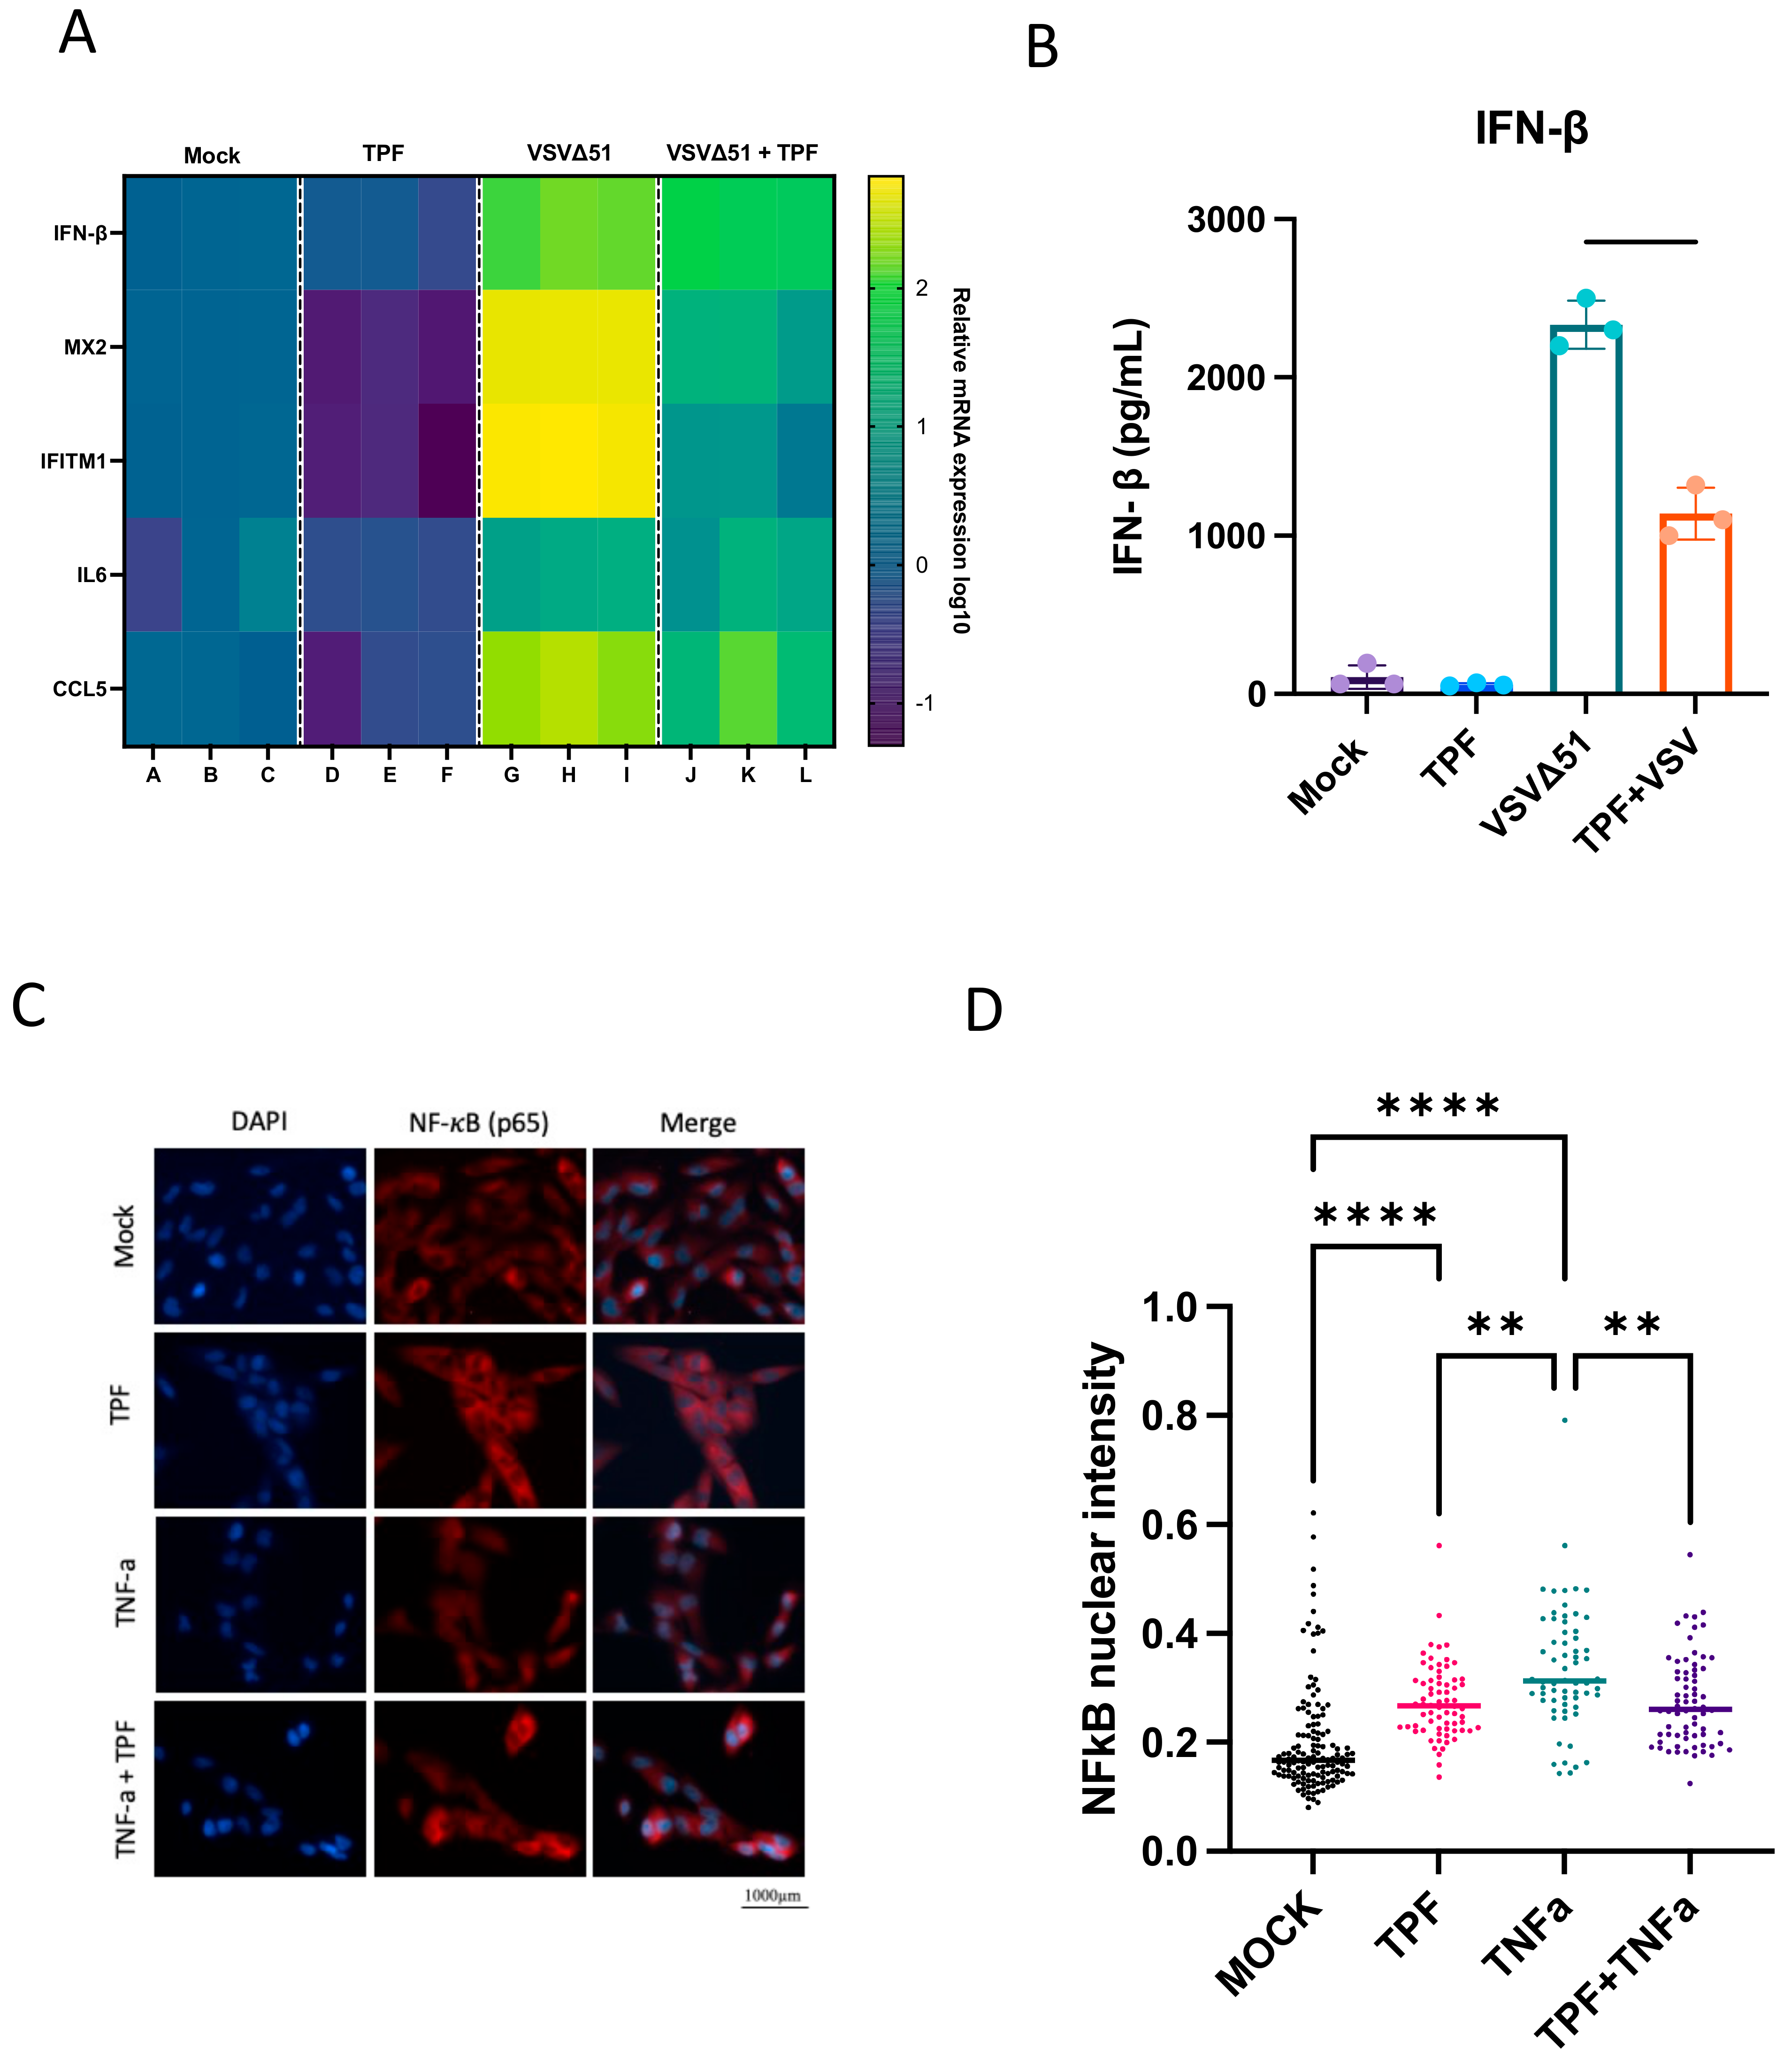
2.8. IFN-β ELISA
The 786-0 cells were plated to confluency in 12-well plates and incubated overnight at 37 °C in a 5% CO2 humidified incubator. Subsequently, the cells were treated with TPF at a concentration of 150 µM. Four hours later, the cells were either infected with VSVΔ51 at a multiplicity of infection (MOI) of 0.05 or underwent a mock infection. Supernatants were collected at 24 h post-infection (hpi). The quantity of human IFN-β in the supernatant was measured using the Human IFN Beta ELISA Kit (PBL Assay Science, Piscataway, NJ, USA, cat. 41410), following the procedure provided by the manufacturer. Absorbance readings were taken using the BioTek Microplate Reader (Agilent, Santa Clara, CA, USA).
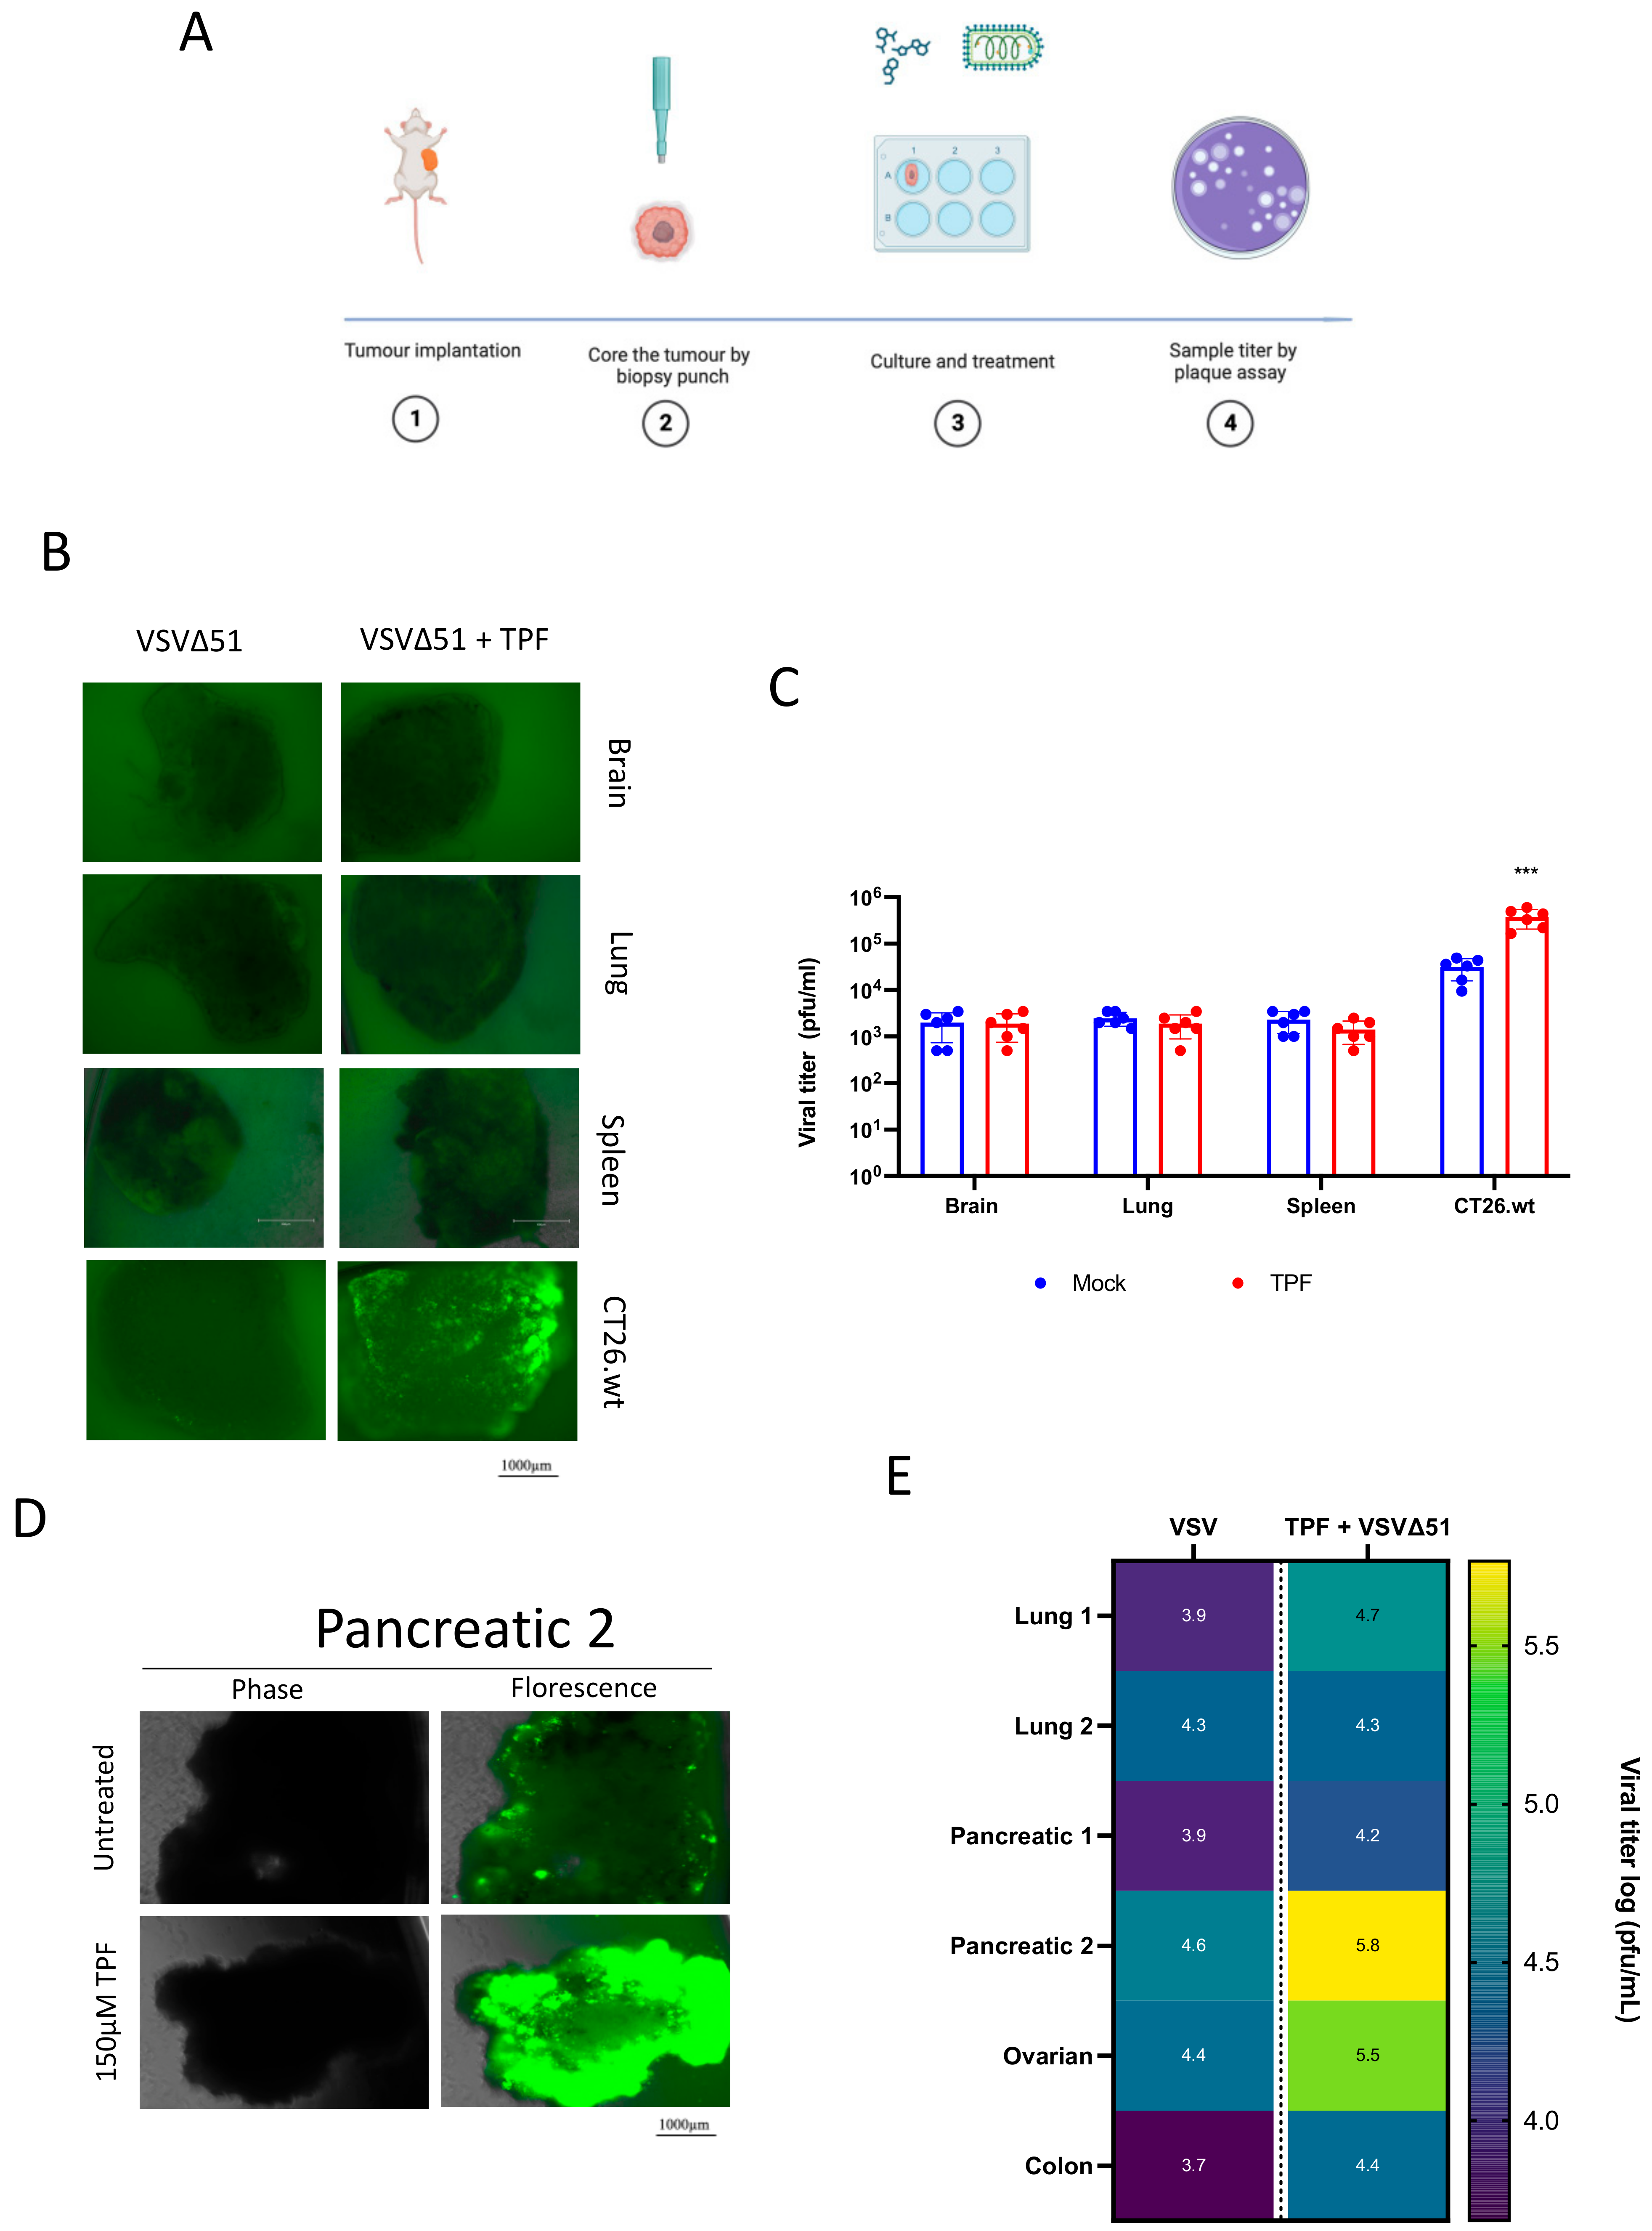
2.9. Human and Murine Ex Vivo Models
BALB/c mice were implanted with CT26.wt 3 × 10⁵ colon cancer cells. Once tumor volumes reached 1500 mm3, the mice were euthanized, and relevant tissues were extracted. For human tissue samples, tumor samples were collected from patients who had given informed consent and followed the Declaration of Helsinki guidelines during surgical resection. The collection of human tissue/fluid for this study was made possible by the Global Tissue Consent and Collection Program at the Ottawa Hospital Research Institute. All the tissues were sliced into 2 mm sections and circular cores of 2 mm diameter were extracted using a punch biopsy tool. These cores were then kept in a humidified incubator at 37 °C and 5% CO2 in DMEM supplemented with 10% serum, 30 mM HEPES, 1% (v/v) penicillin–streptomycin and 0.25 mg/L amphotericin B. The cores were treated with TPF for four hours and then infected with VSVΔ51 at 3 × 10⁴ pfu/core. After 24 h post-infection, fluorescence images were captured using the EVOS Live Cell Imaging System (Thermo Fisher, San Francisco, CA, USA) the supernatant was assessed for viral titer by standard plaque assay.
2.10. Quantitative Real-Time PCR
The extraction of total RNA from both infected and mock-infected 786-0 cells was conducted using the RNeasy Mini Kit, following the instructions provided by the manufacturer. (Qiagen, Toronto, ON, Canada, Cat. 74104). The conversion of one microgram of RNA to complementary DNA (cDNA) was achieved through the use of the RevertAid First Strand cDNA Synthesis Kit. (Thermo Fisher Scientific, Nepean, ON, Canada, Cat. K1621). The real-time polymerase chain reaction (PCR) protocols involved the use of 40 nanograms of complementary DNA (cDNA) and the PowerUp™ SYBR™ Green Master Mix (ThermoFisher Scientific, Cat. A25776) on the 7500 Fast Real-Time PCR system (Applied Biosystems, Thermo Fisher Scientific, Nepean, ON, Canada). Gene expression was normalized to GAPDH, and fold change was calculated relative to the mock-treated samples for each gene using the Pfaffl method [
22].
2.11. Immunofluorescence Staining
The 786-0 cells were seeded on 12 mm glass coverslips (Thomas Scientific, cat. 64-0712), then treated with TNF (Sigma-Aldrich, Oakville, ON, Canada) or TPF. Next, the adherent cells were washed twice using PBS* containing 1 mM CaCl2 and 500 mM MgCl. The cells were subjected to fixation using a 4% paraformaldehyde solution for a duration of 30 min. Subsequently, permeabilization was achieved by treating the cells with a 0.2% Triton-X 100 solution in 200 mM glycine/PBS for a period of 8 min. The cells were quenched in a 200 mM glycine/PBS solution. Following this, the samples underwent blocking with a 5% BSA/PBS* solution for 1 h at room temperature and were subsequently exposed to the NF-κB/p65 primary antibody (rabbit, cell signaling #8242) overnight in a humidified chamber at 4 °C. Anti-rabbit IgG secondary antibody (cell signaling #4413S) was applied for 60 min, then the samples were mounted onto glass slides and counterstained using Prolong gold antifade with DAPI (Molecular Probes). The slides were imaged using the Zeiss Axiocam HRM Inverted fluorescent microscope (Zeiss, Toronto, Canada) and Axiovision 4.0 software. The images were processed using ImageJ. Nuclear: cytoplasmic signal quantification processes were performed using CellProfiler (Massachusetts Institute of Technology, Cambridge, MA, USA).
2.12. Viral Vector Transduction
Dose–response testing of TPF or DMF followed by transduction with either Lentivirus, AAV-2, or Ad5 was performed in triplicate in the indicated cell lines seeded in 96-well plates to 50% confluency. The cells were treated with a 2 in 3 dilution series of each drug for 4 h followed by transduction with either lentivirus-GFP at MOI 10, AAV2-GFP at MOI 5000, or Ad5-GFP at MOI 5–100. A total of 70 h post transduction, the plates were imaged for GFP using the Cellomics Arrayscan (Thermo Scientific, Waltham, MA, USA), and mean fluorescence per well was determined using the Agilent Biotek Cytation 5 reader (Santa Clara, CA, USA).
2.13. Statistics
All the graphs and statistical analyses in our study utilized GraphPad Prism v.10. The specific statistical tests employed for each figure are described in the corresponding figure legends. When comparing the means of two groups, a two-tailed unpaired Student’s t-test was applied. For comparisons involving more than two groups, one-way ANOVA with either Dunnett’s or Tukey’s multiple correction tests was used. The number of biological replicates is denoted by ‘n’, with the error represented as the standard error of the mean (SD). A p-value less than 0.05 was considered to indicate statistical significance.
4. Discussion
Our study shows for the first time that TPF has the potential as a novel pharmacological tool to enhance the activity of oncolytic viruses and other viral vectors. While the value of DMF has been previously explored to this end [
15], the current study suggests that TPF has the potential for greater potency for this purpose as shown for a range of viruses in multiple cell lines (
Figure 2 and
Figure 4).
Mechanistically, our previous work with multiple maleic and fumaric acid esters, including MMF, the common active metabolite of TPF and DMF, has established the ability of these molecules to downregulate several IFN pathway-related genes via the blocking of NF-κB nuclear translocation [
15]. Based on these findings, we hypothesized that TPF might target similar pathways. Our results provide clear evidence that TPF downregulates key antiviral and pro-inflammatory genes, including IFN-β, MX2, and IL6 (
Figure 4A), thereby enhancing the susceptibility of cancer cells to VSVΔ51 infection. This downregulation, coupled with TPF’s inhibition of the NF-κB nuclear translocation induced by TNFα (
Figure 4C), suggests that much like DMF, TPF modulates innate immune responses, creating a more favorable environment for viral infection and oncolysis in the context of replicating oncolytic viruses. Intriguingly, we also saw that TPF on its own led to an elevation of baseline NF-κB nuclear translocation (
Figure 3D), which to date has not been observed with DMF [
15].
While significant differences in oncolytic (i.e., cytotoxic) potency were observed between TPF and DMF, the difference in enhancement in total viral output comparing TPF and DMF was in contrast relatively limited. The reason this is intriguing is because this difference is seemingly insufficient to explain the comparatively large differences in oncolysis observed, even when looking at each drug’s respective peak viral enhancing dose. Given the dual role of NF-κB in both coordinating the antiviral response as well as cell survival and death, it is tempting to speculate that a shift in baseline NF-κB induced by TPF could contribute to the enhanced impact of TPF on oncolytic activity (
Figure 4B,D).
While the antiviral response is a well-appreciated tumor resistance barrier in oncolytic virotherapy, our study suggests that this response also impedes the infection efficiency of other viral vectors, even those that do not effectively replicate. The extension of our study to evaluate TPF’s influence on different viral vectors provides support for its broader potential application in gene therapy. Engineered replication defective lentiviruses, adenoviruses, and adeno-associated viruses are prominent vectors being evaluated and used clinically in cell therapy (eg., Kymriyah™), gene therapy (e.g., Luxturna™), and even vector-vaccine applications (e.g., COVISHIELD™). Interestingly, each of these vectors uses distinct mechanisms for cellular attachment, entry, gene delivery, and in some cases integration (i.e., lentivirus). This is perhaps not surprising given that diverse viruses are commonly sensitive to antiviral responses mediated via type I IFN. However, given the viruses are non-replicating, further studies will be required in order to better understand what stage(s) of the infection process is / are most affected by baseline and/or emergent antiviral responses. Evidently, there are also cell-type and virus-type dependencies in relation to the effect of TPF which are not fully understood, since some cell lines were not sensitized to infection by select viruses using TPF (e.g., MRC5 for lentivirus and Jurkat for Ad5,
Figure 5A and
Figure 5B, respectively). Further, the effects of TPF on oncolytic virus replication and spread, analogously to DMF, were restricted to tumor cells.
Nevertheless, the potential of TPF as a potentiator of oncolytic virus and viral vector-based gene delivery more generally warrants further pre-clinical exploration. TPF-mediated enhancement could lead to more efficient gene transfer, potentially increasing the therapeutic efficacy of oncolytic virotherapies (as has been demonstrated with DMF previously) as well as gene therapies, supporting their clinical advancement. OVs as standalone treatments in particular have faced many challenges in delivering substantially improved clinical outcomes for cancer patients, with only a handful of approvals globally. Viral vector potentiators including but not limited to TPF could be considered in order to overcome some of these challenges. While our study included only a limited number of patient specimens, the observation of substantial activity of TPF with oncolytic VSVΔ51 in human pancreatic and ovarian cancer tumor explants (
Figure 3E) offers choice areas for further pre-clinical exploration.

 ,
, 