
Absolute Quantification of Hepatitis B Core Antigen (HBcAg) Virus-like Particles and Bound Nucleic Acids

Abstract
:1. Introduction

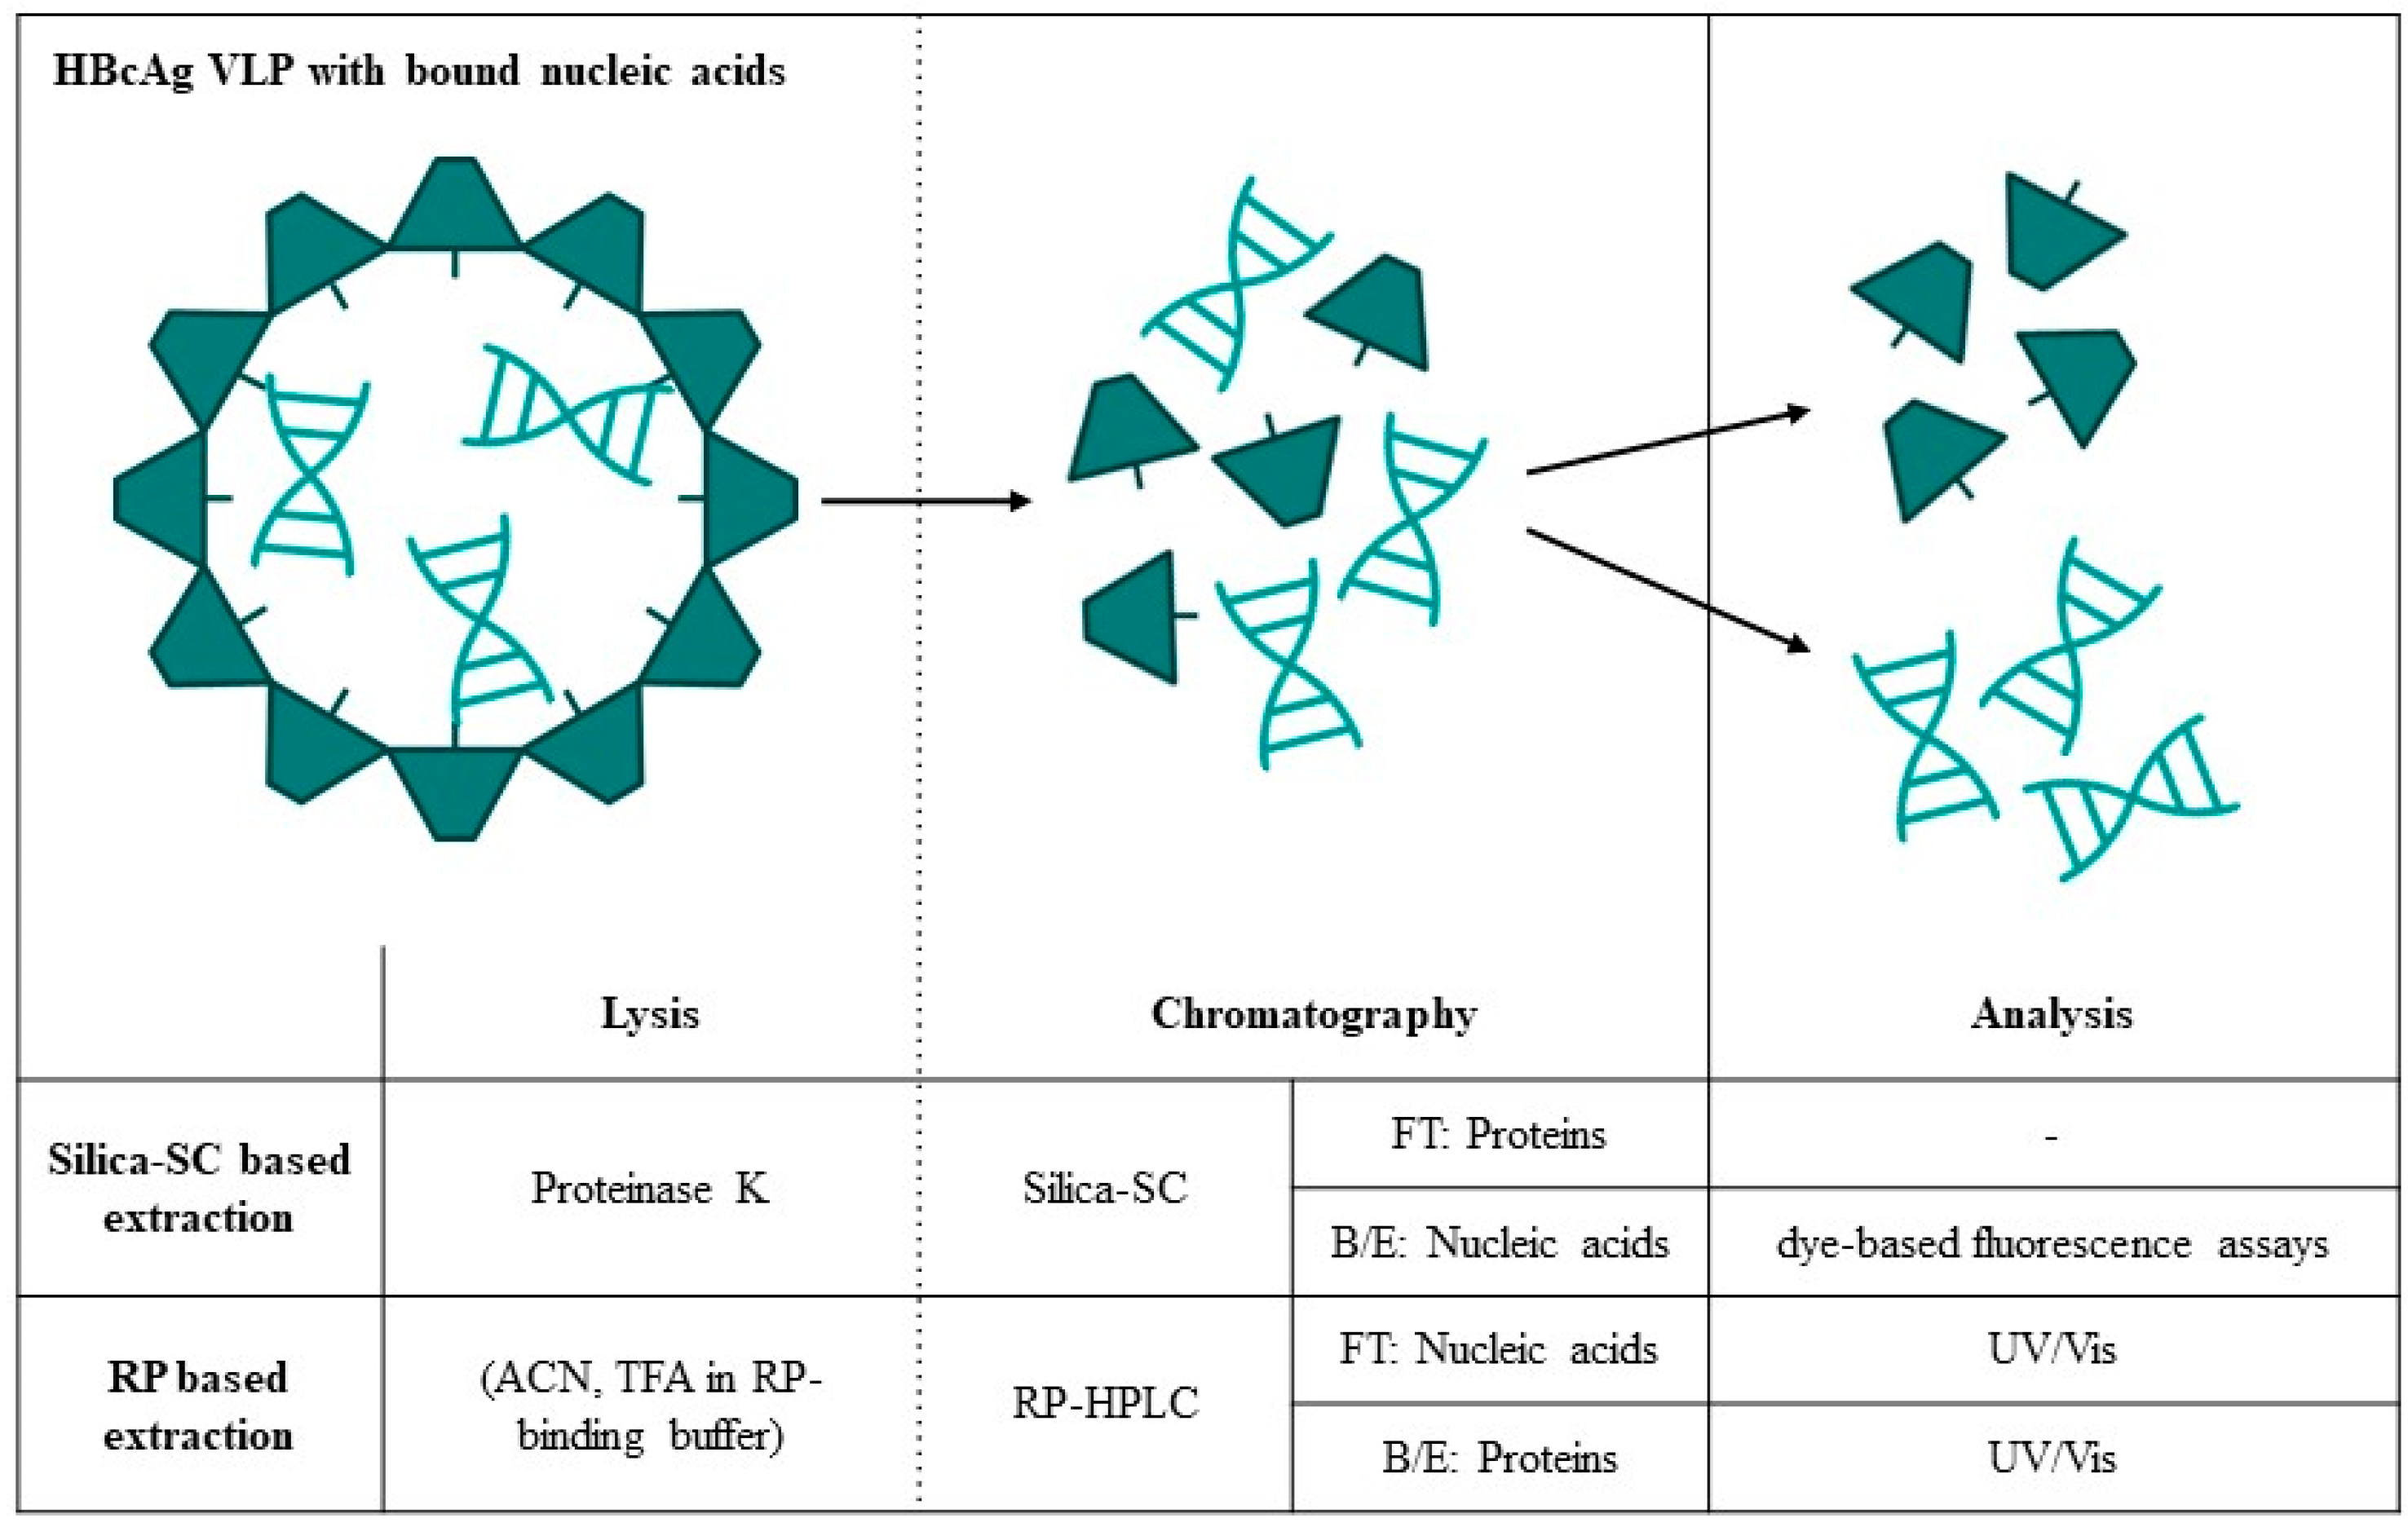
| Silica-SC-Based Extraction | Approach | Analytics | Data |
|---|---|---|---|
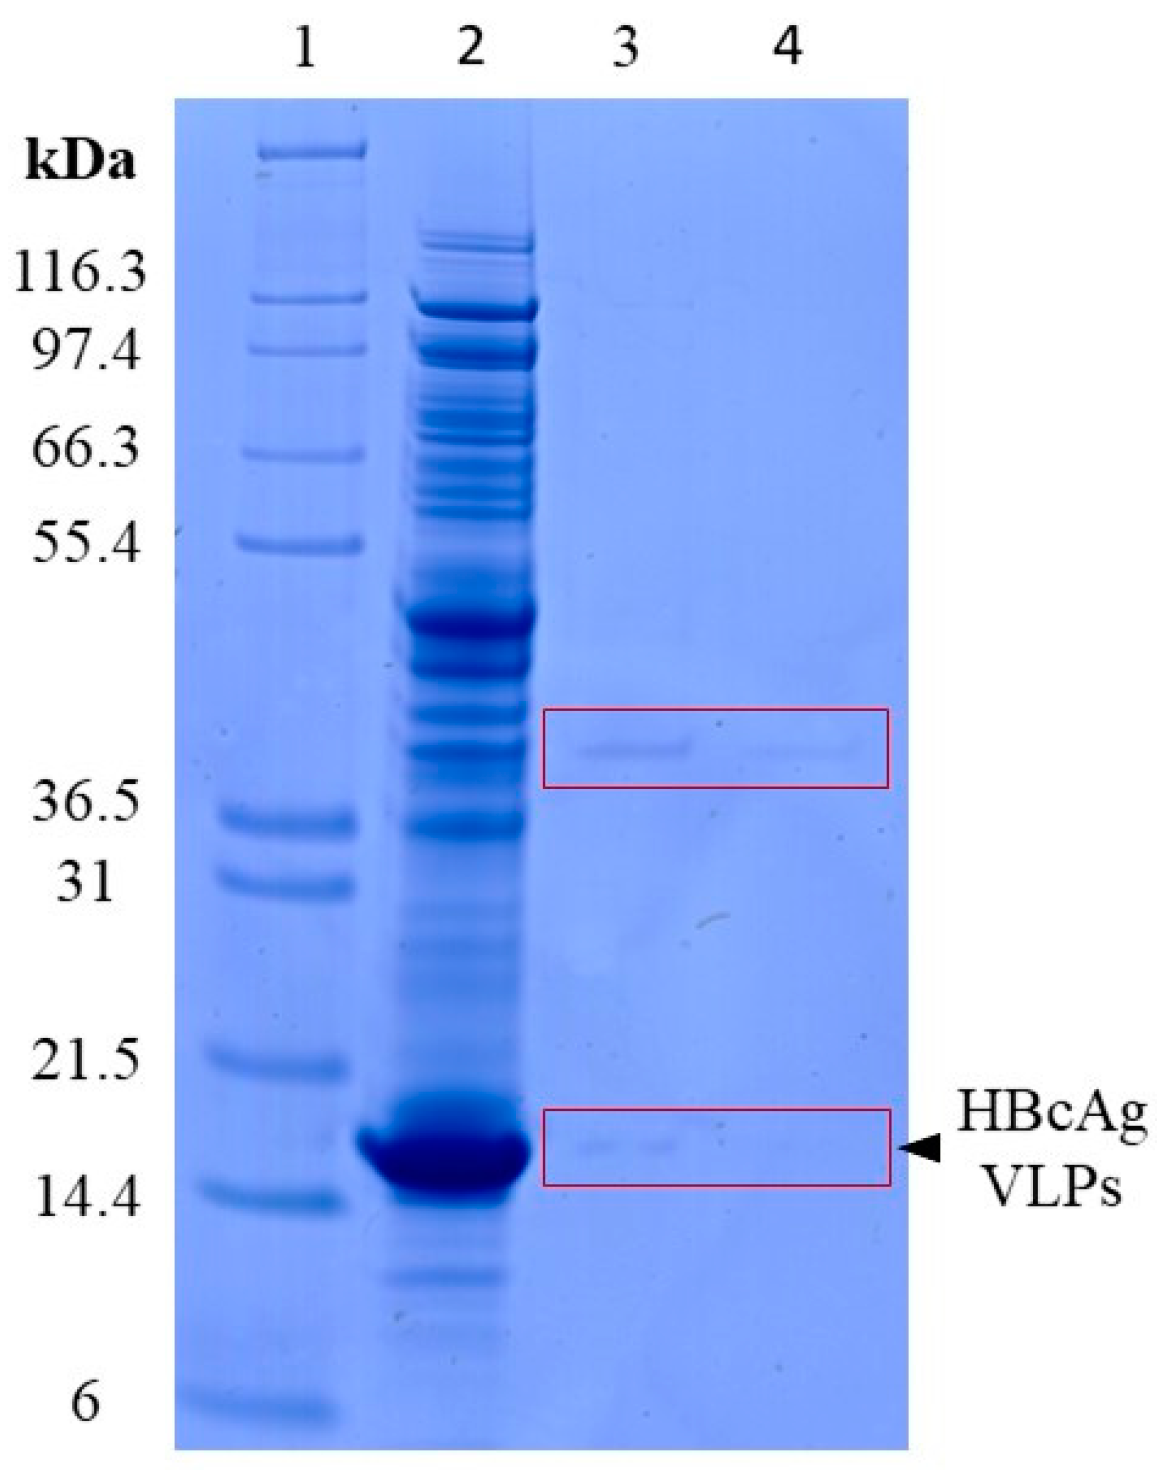
| Process | protein lysis | SDS-PAGE | Figure 2 |
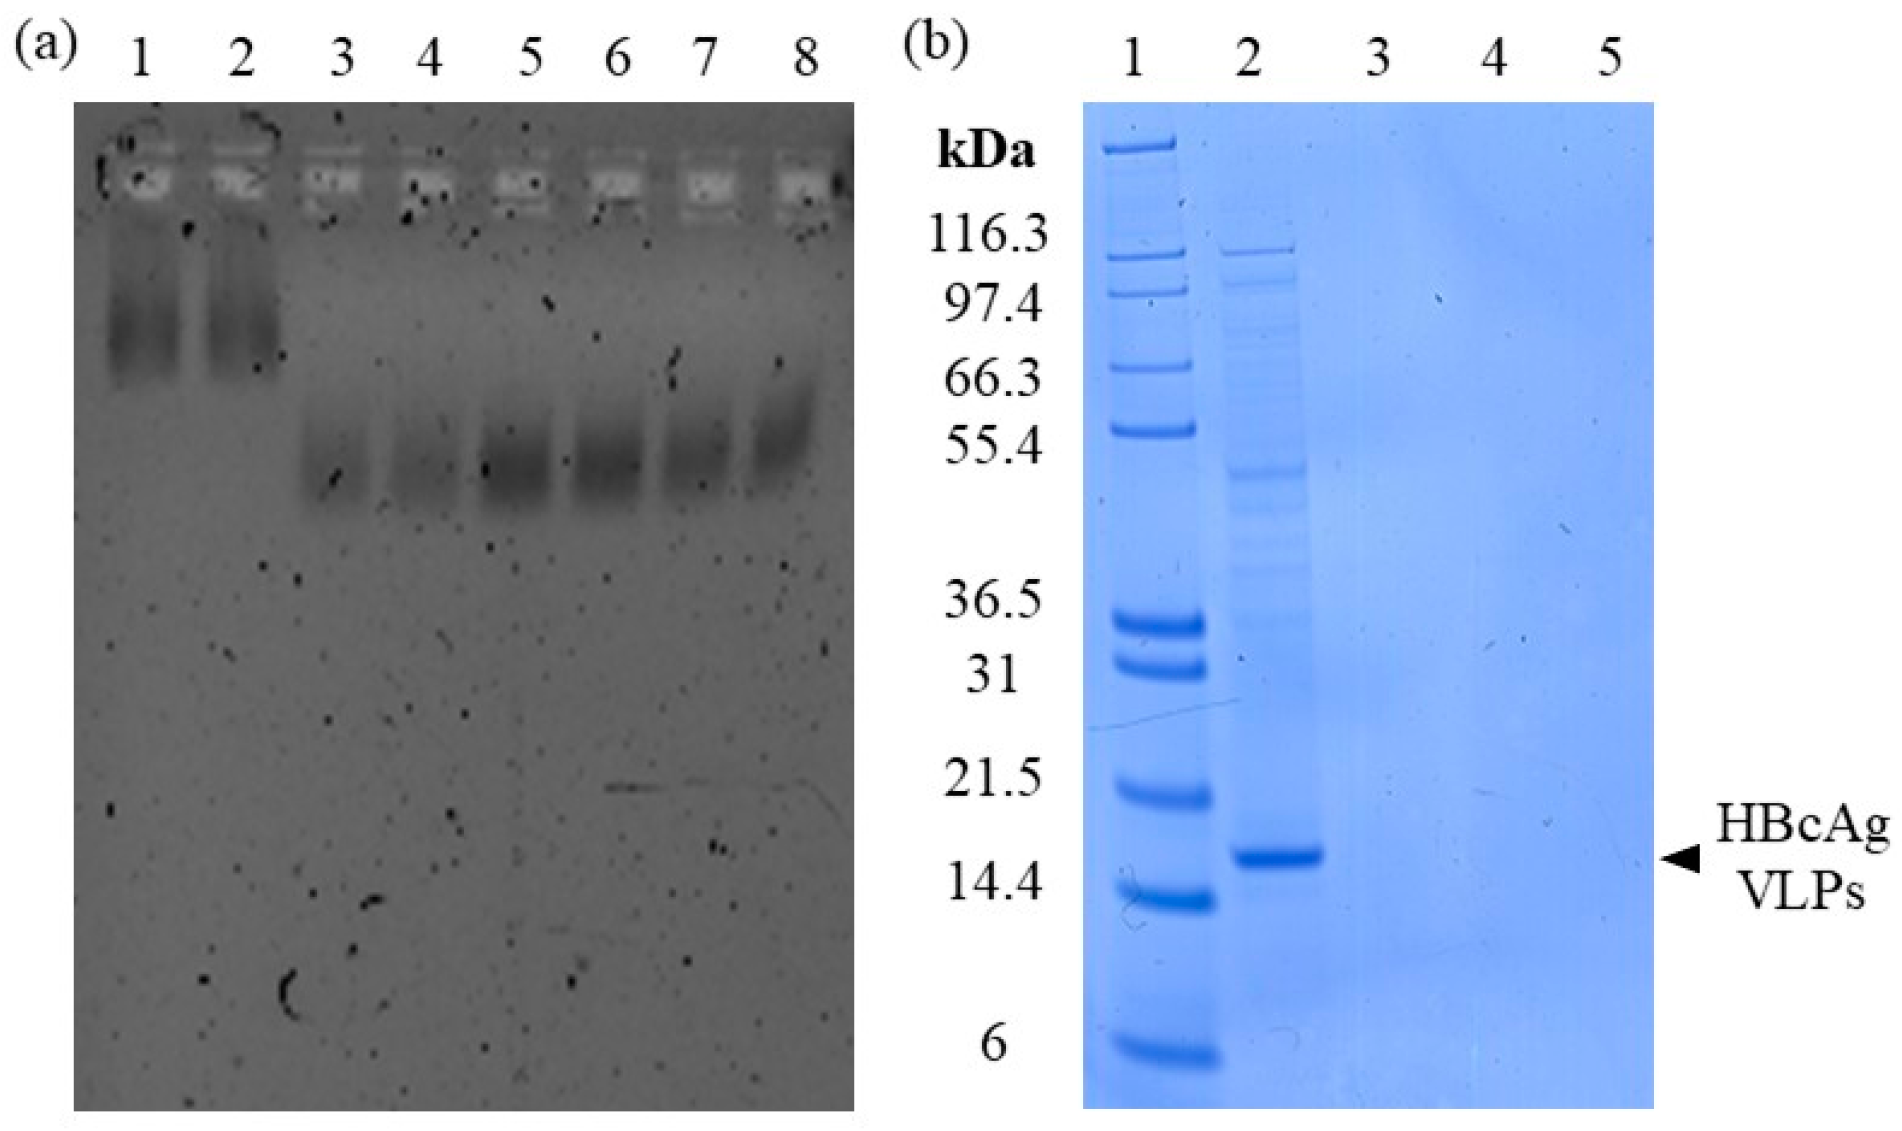
| B/E: nucleic acid adsorption | NAGE | Figure 3 | |
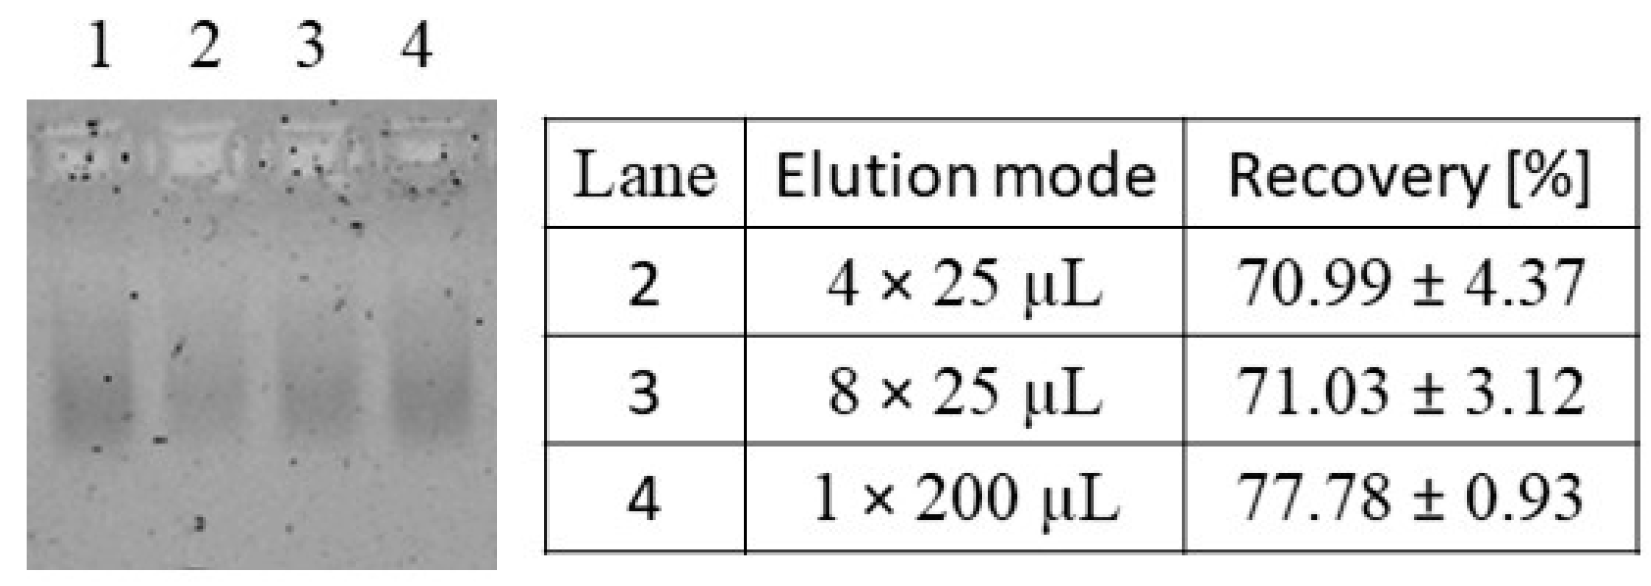
| B/E: nucleic acid elution | NAGE, RiboGreen | Figure 4 | |
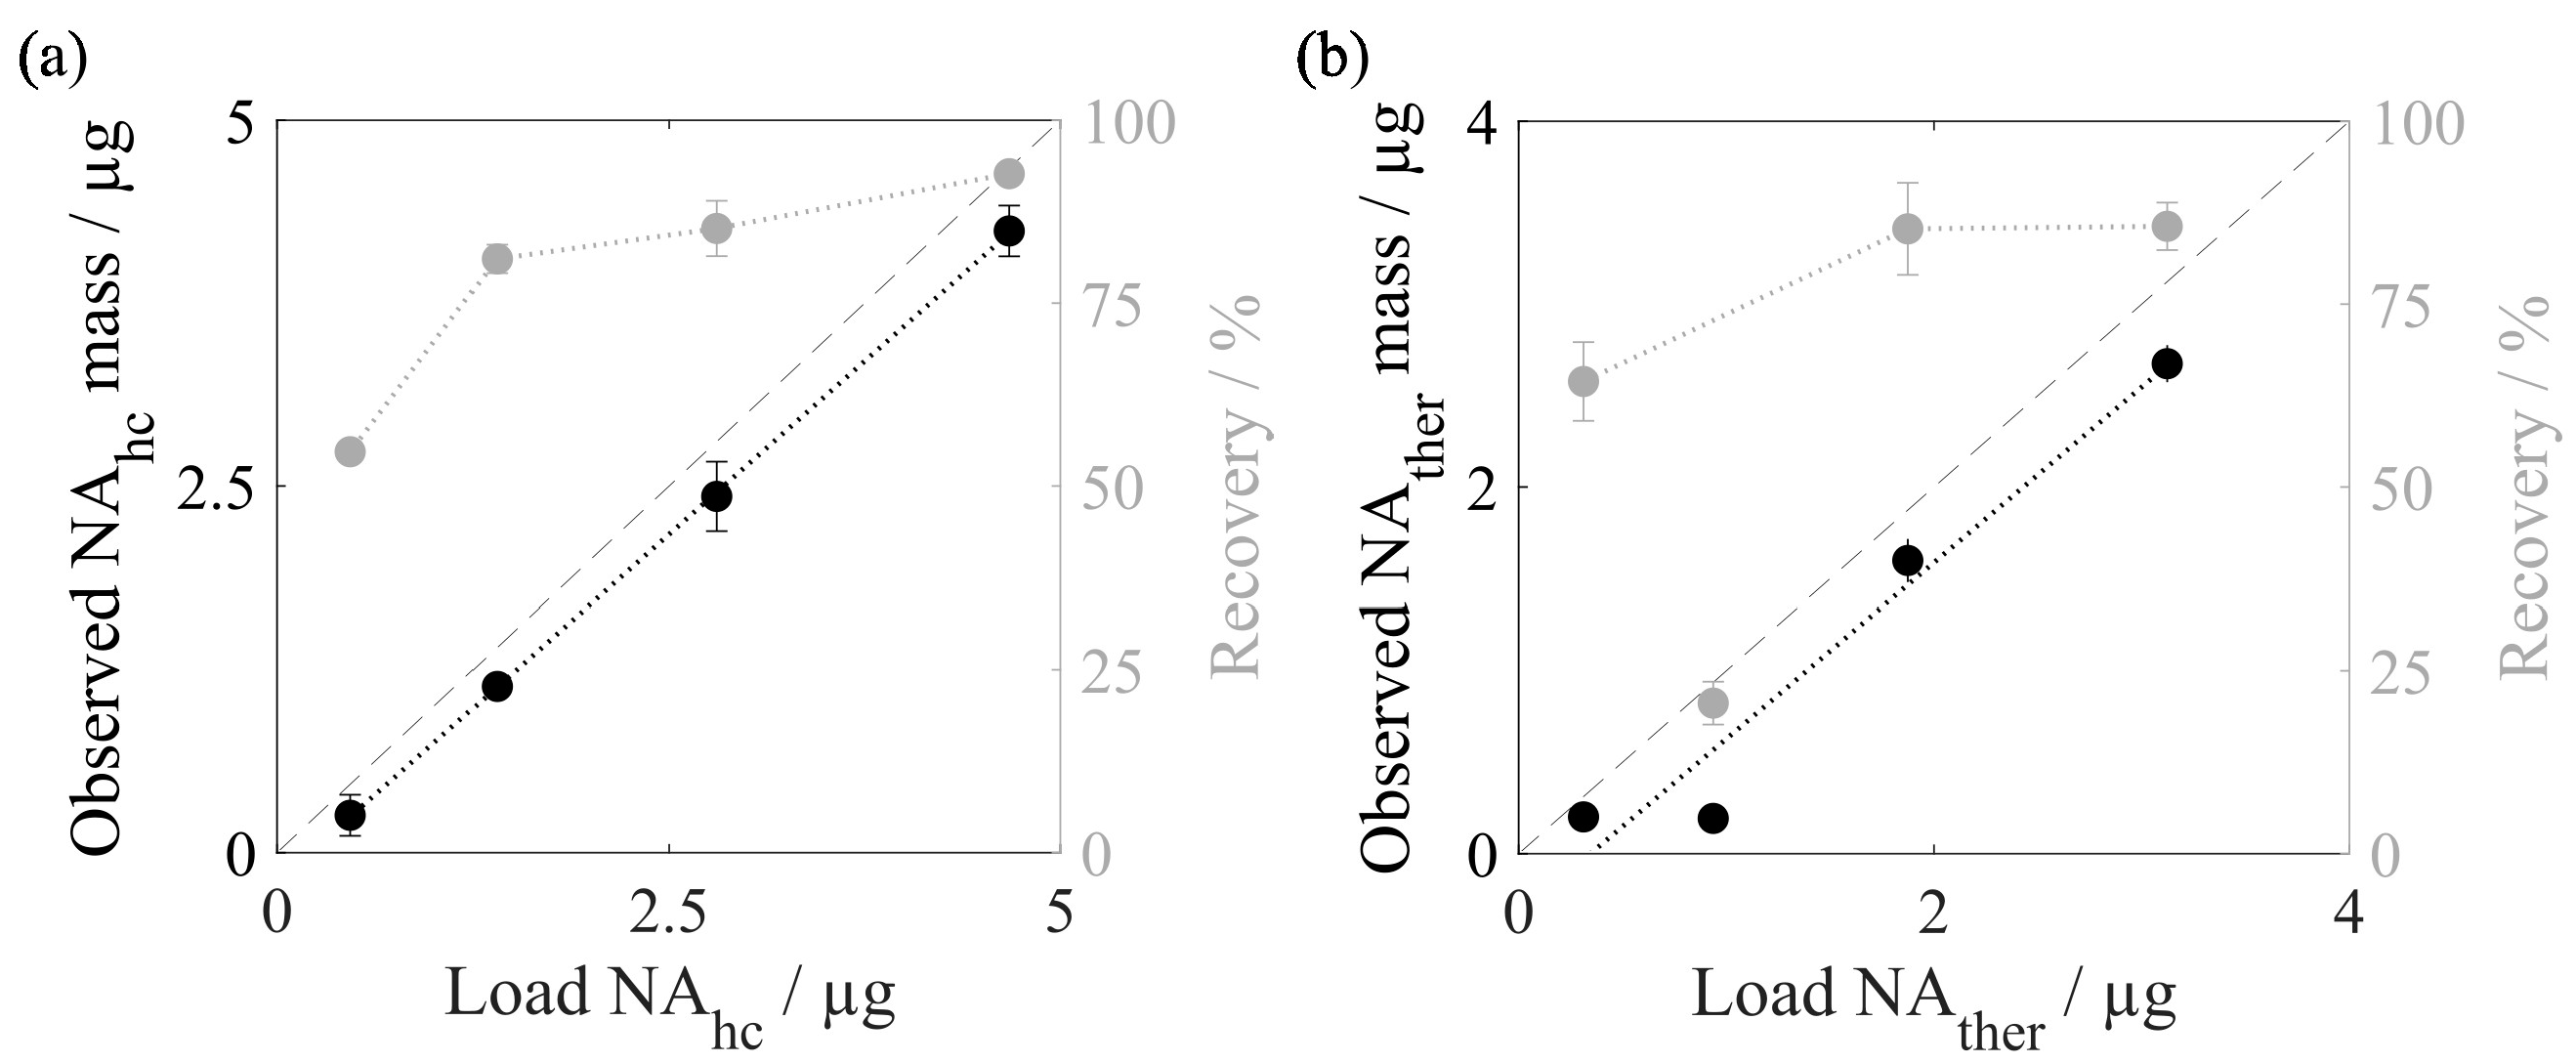
| Characterization | recovery | RiboGreen, qPCR | Figure 5 |
| with/without lysis and extraction | RiboGreen | Table 2 | |
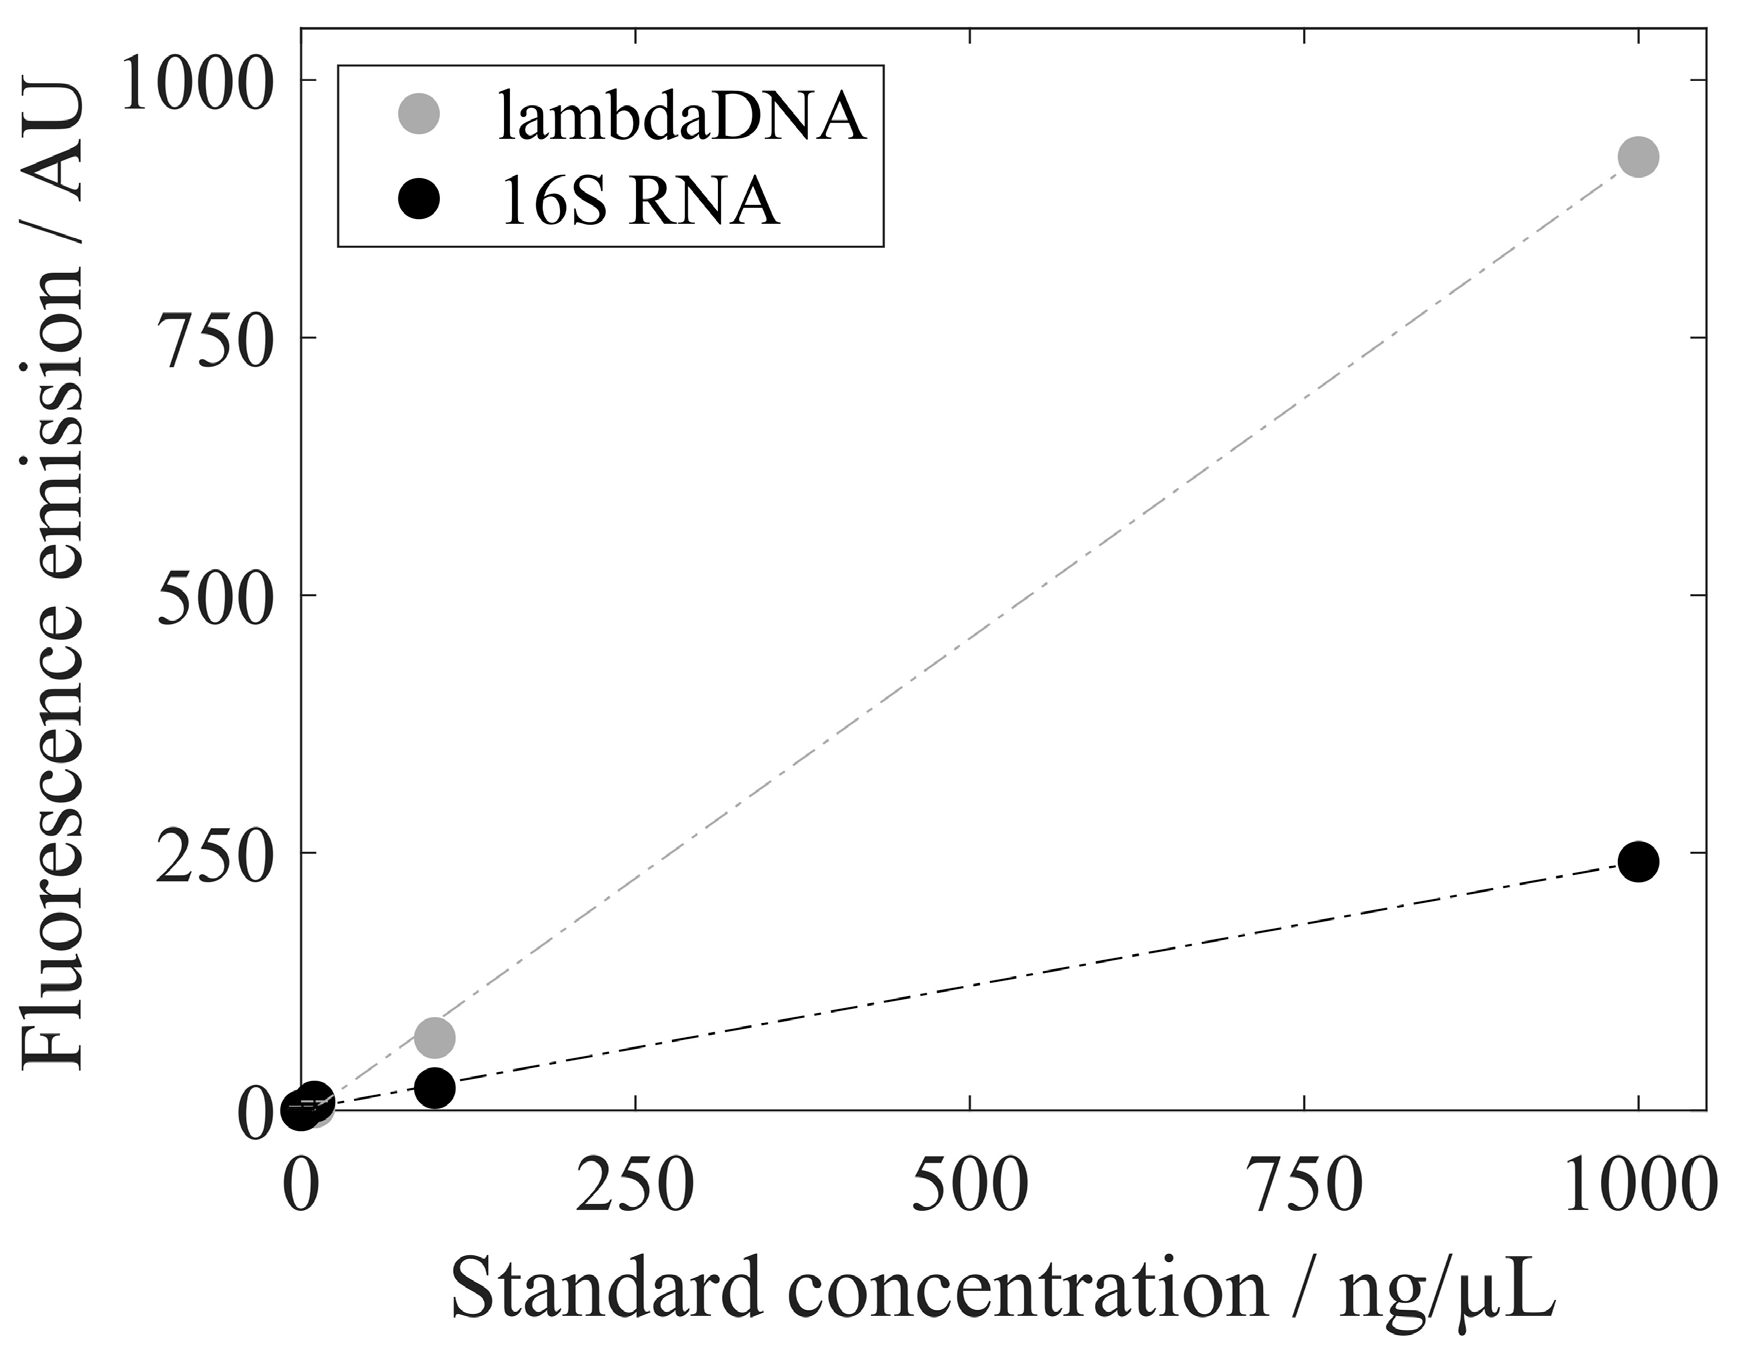
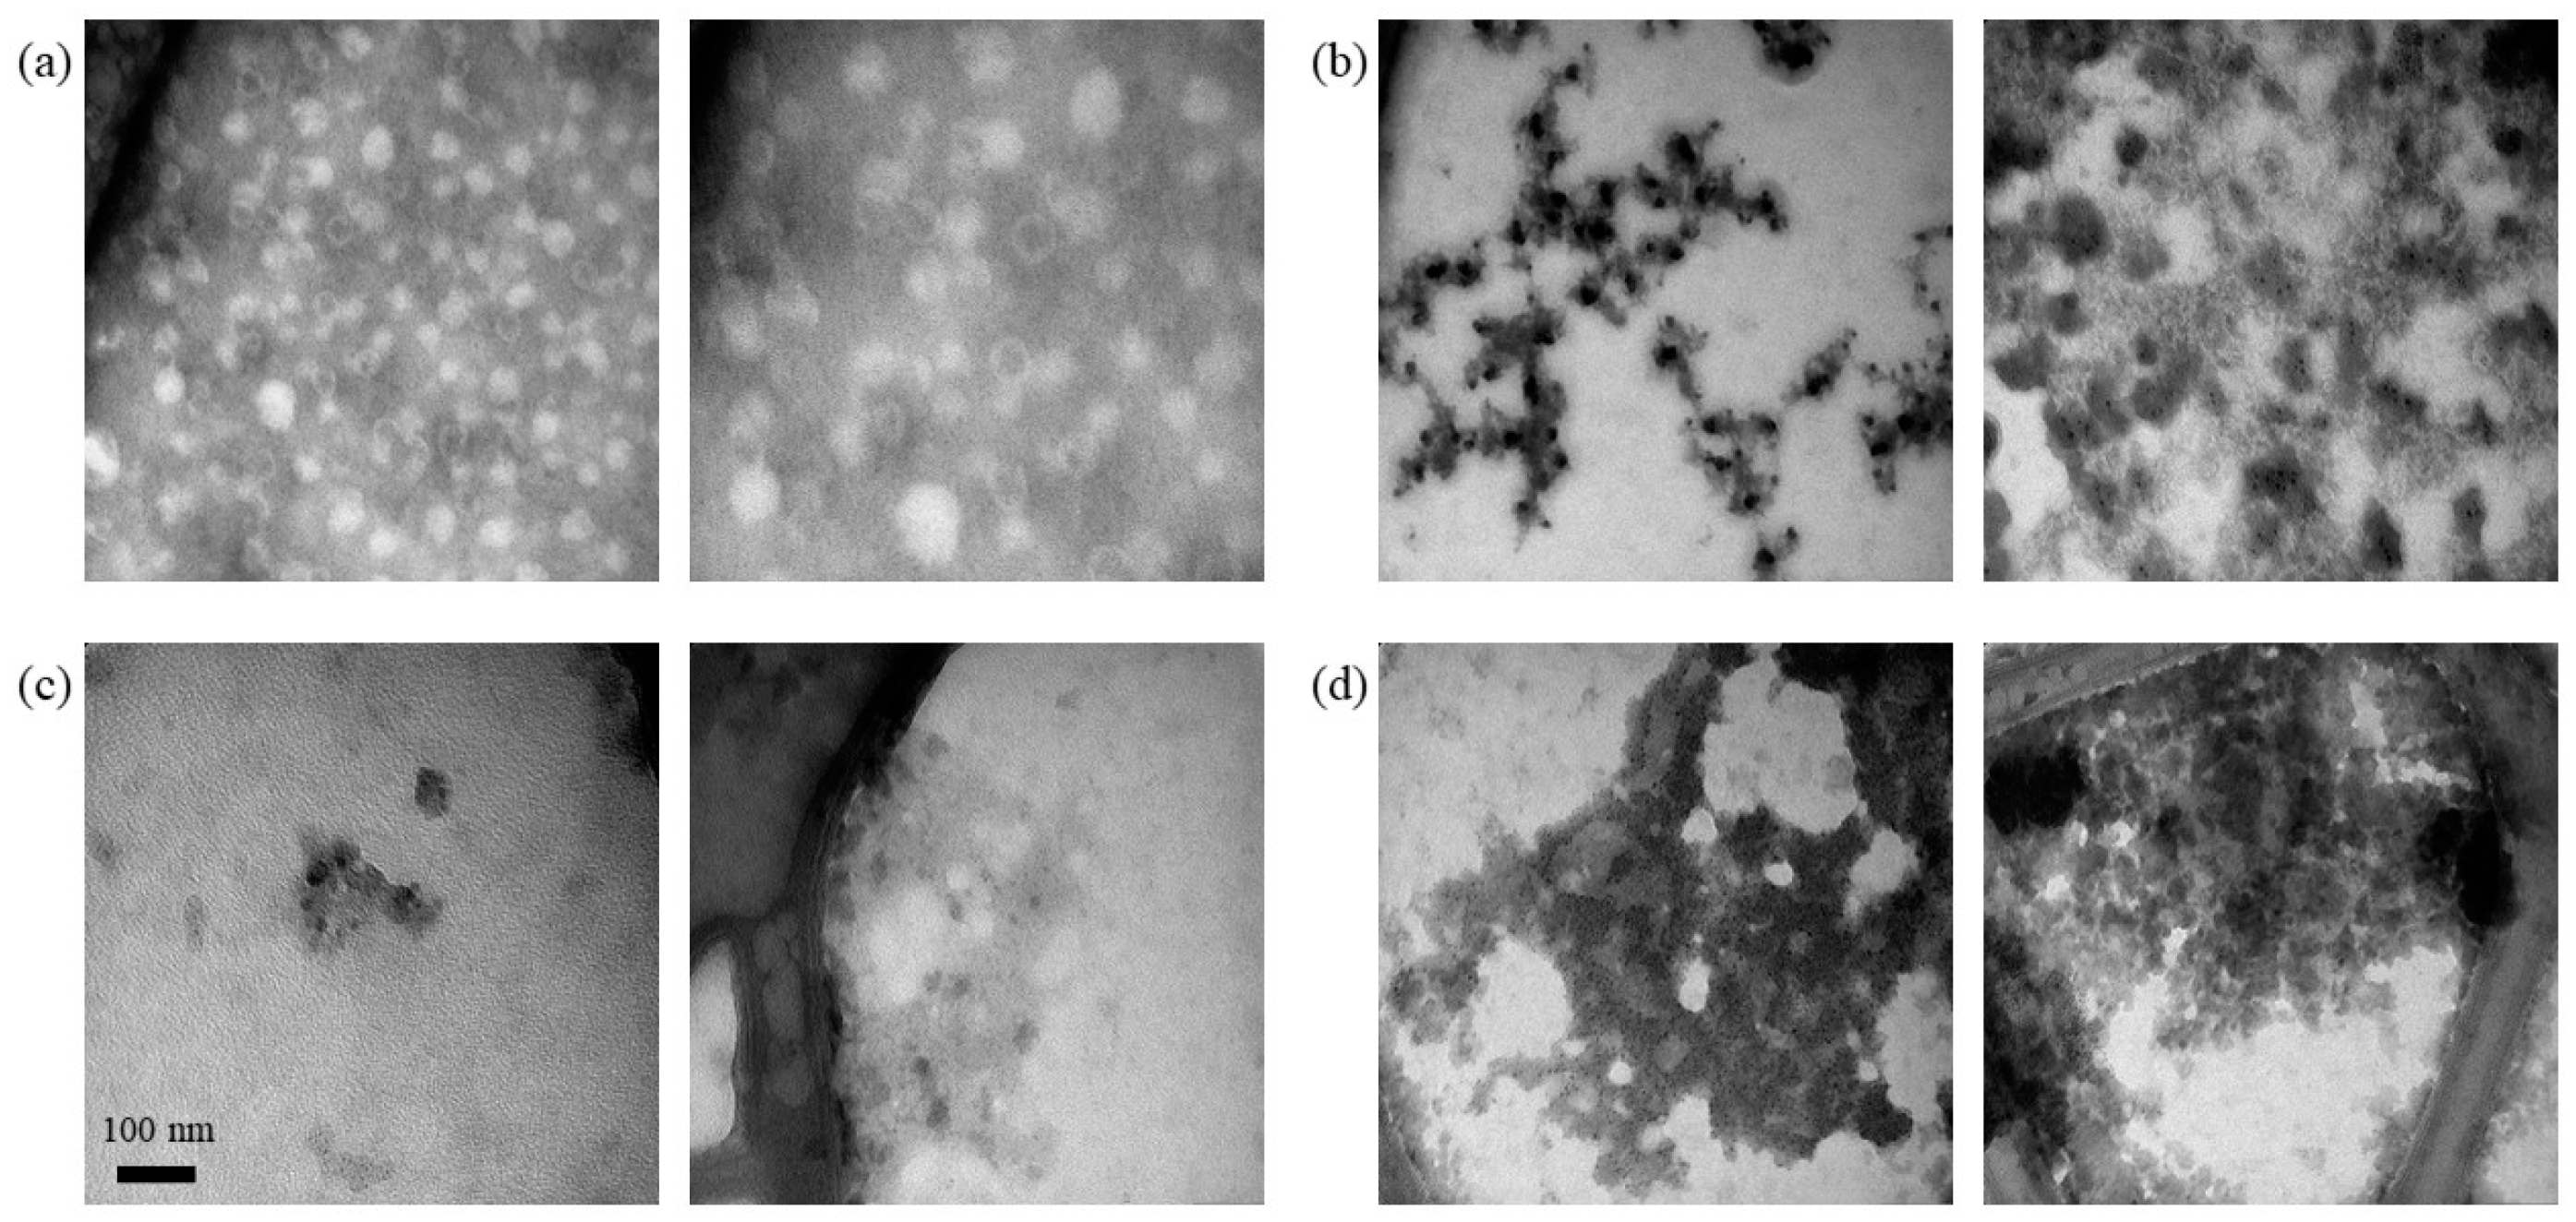
| Analysis | lambda DNA/16S RNA | RiboGreen | Figure 6 |
| enzymatic treatment | RiboGreen, PicoGreen | Table 3 |
2. Materials and Methods
2.1. Buffers, VLPs, and DNA
2.2. Silica Spin Column-Based Extraction
2.3. RP-Based Nucleic Acid and Protein Extraction
2.4. Analytics for Silica-SC-Based Extraction, RP-Based Extraction, and Quantification of Proteins and Nucleic Acids
3. Results
3.1. Silica-SC-Based Extraction
3.1.1. Lysis of VLPs by Proteinase K
3.1.2. Adsorption of Nucleic Acids
3.1.3. Elution of Nucleic Acids
3.2. Characterization of the Silica-SC-Based Extraction
3.2.1. Nucleic Acid Recovery
3.2.2. Quantification with and without Prior Silica Spin Column-Based Extraction
3.3. Analysis of Extracted Nucleic Acids
3.4. Quantification of Proteins and Nucleic Acids Using RP-HPLC
3.4.1. Lysis of VLPs
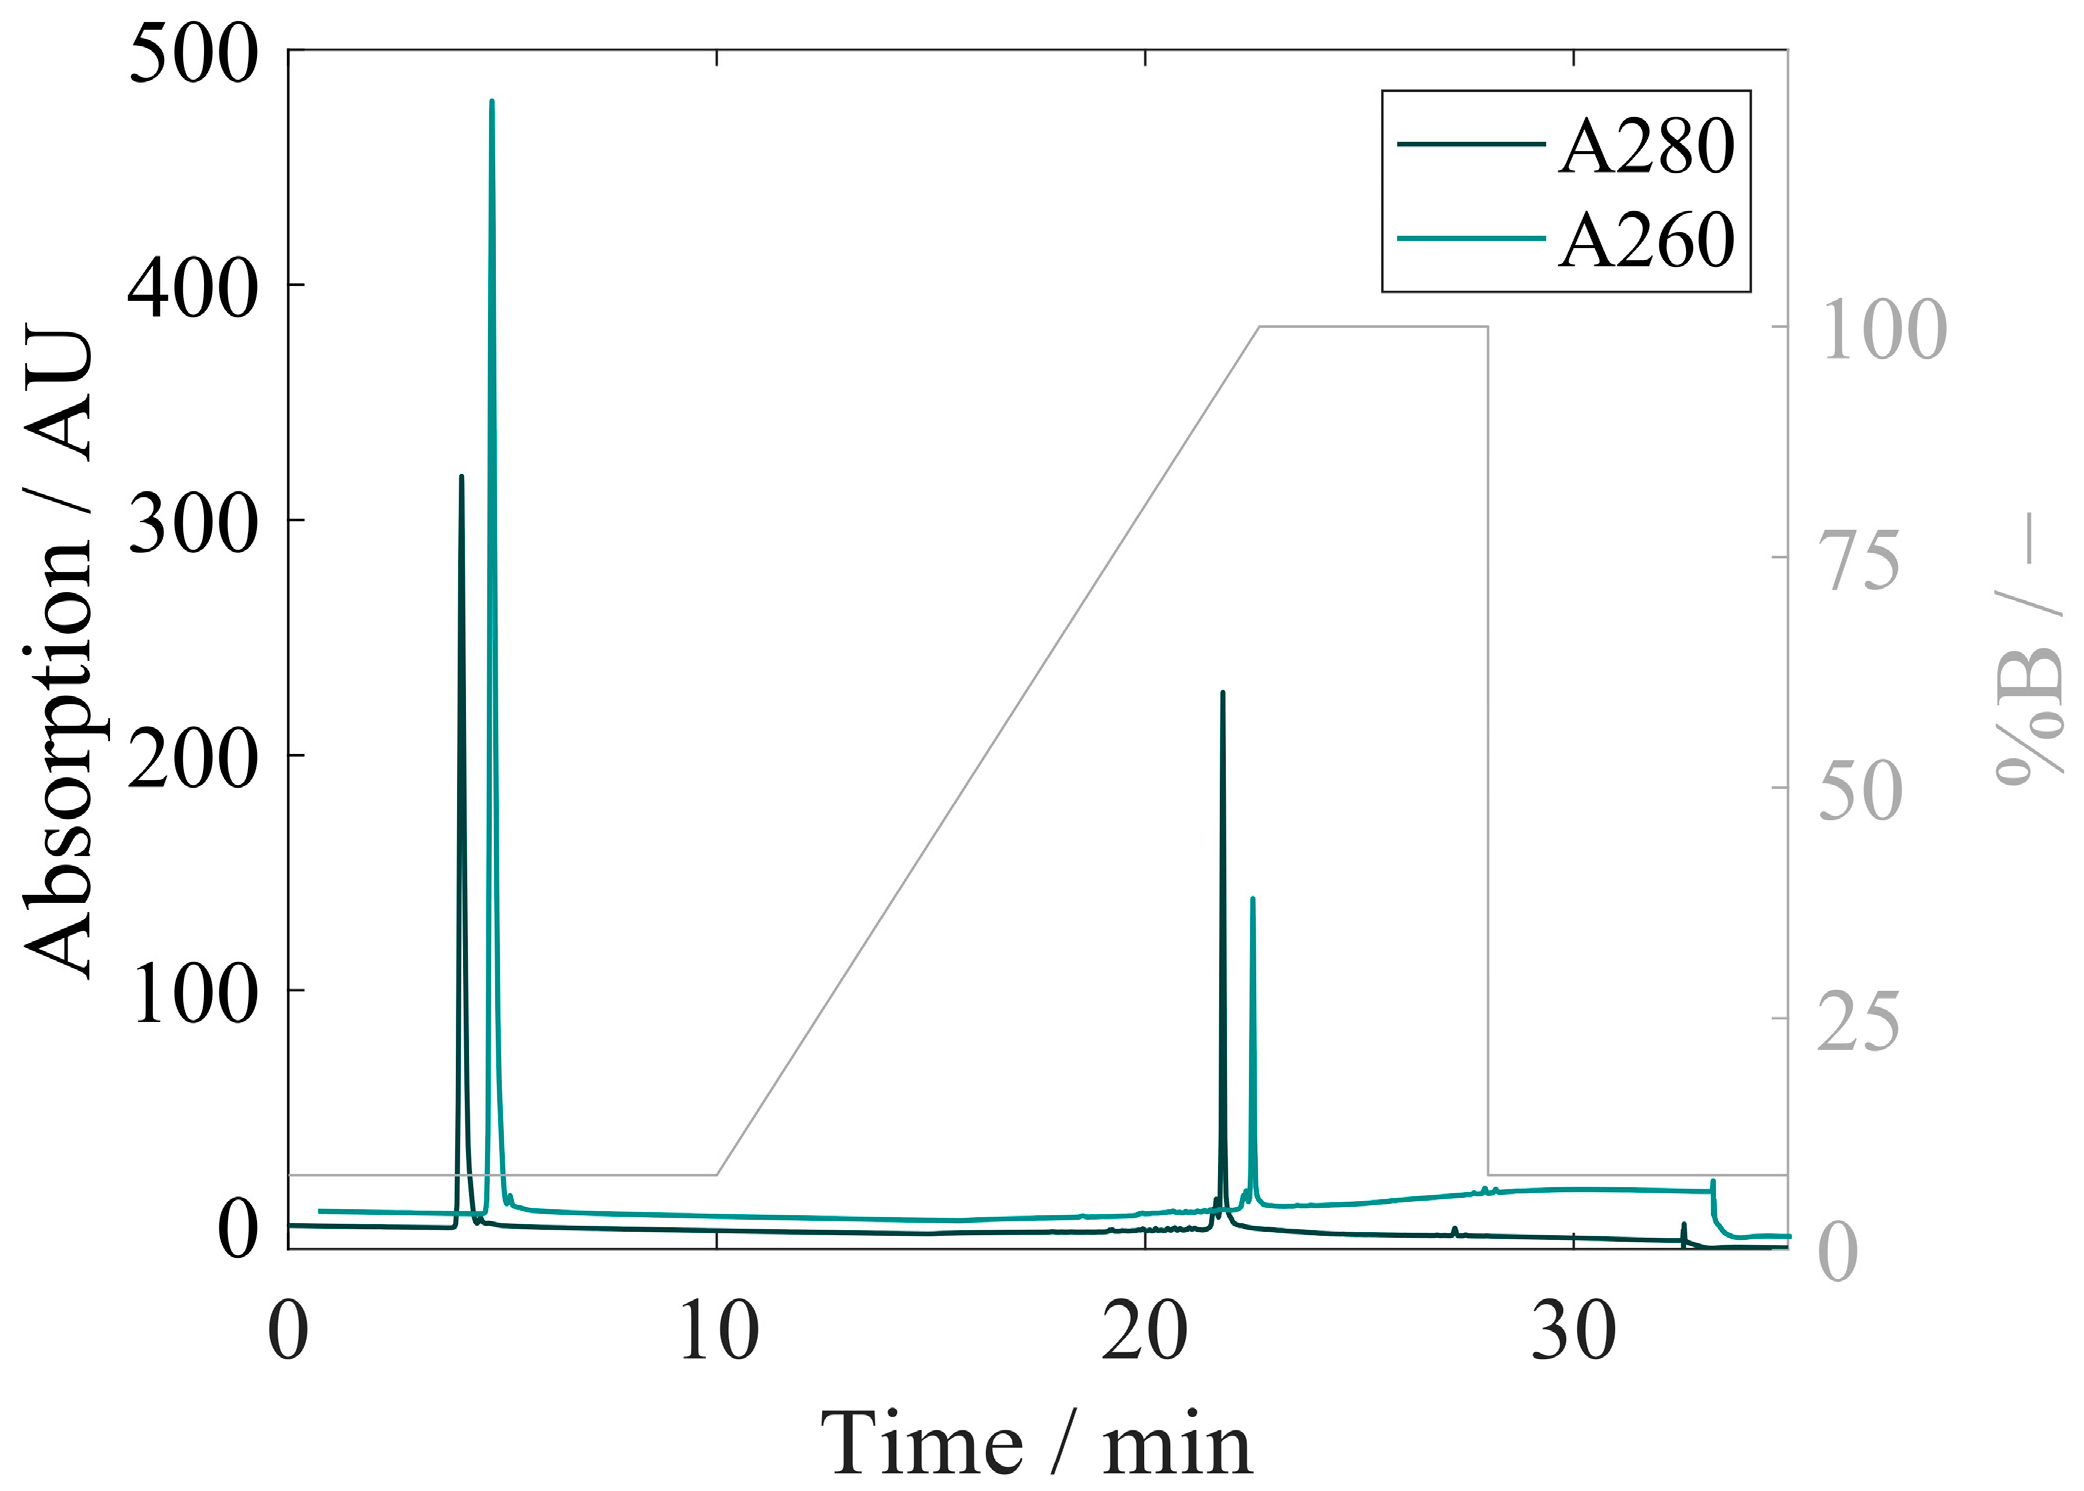
3.4.2. Development of RP-HPLC for Extraction and Quantification of VLP Proteins and Nucleic Acids
3.4.3. Method of Performance Assessment
4. Discussion
4.1. Absolute Quantification of HBcAg Protein and Bound Nucleic Acids
4.2. Analytical Toolbox for HBcAg VLPs
5. Conclusions
Supplementary Materials
Author Contributions
Funding
Data Availability Statement
Acknowledgments
Conflicts of Interest
References
- Rohovie, M.J.; Nagasawa, M.; Swartz, J.R. Virus-like particles: Next-generation nanoparticles for targeted therapeutic delivery. Bioeng. Transl. Med. 2017, 2, 43–57. [Google Scholar] [CrossRef] [PubMed]
- He, J.; Yu, L.; Lin, X.; Liu, X.; Zhang, Y.; Yang, F.; Deng, W. Virus-like Particles as Nanocarriers for Intracellular Delivery of Biomolecules and Compounds. Viruses 2022, 14, 1905. [Google Scholar] [CrossRef]
- Jinming, L.; Sun, Y.; Jia, T.; Zhang, R.; Zhang, K.; Wang, L. Messenger RNA vaccine based on recombinant MS2 virus-like particles against prostate cancer. Int. J. Cancer 2013, 134, 1683–1694. [Google Scholar] [CrossRef]
- Nooraei, S.; Bahrulolum, H.; Hoseini, Z.S.; Katalani, C.; Hajizade, A.; Easton, A.J.; Ahmadian, G. Virus-like particles: Preparation, immunogenicity and their roles as nanovaccines and drug nanocarriers. J. Nanobiotechnol. 2021, 19, 59. [Google Scholar] [CrossRef] [PubMed]
- Hill, B.D.; Zak, A.; Khera, E.; Wen, F. Engineering Virus-like Particles for Antigen and Drug Delivery. Curr. Protein Pept. Sci. 2017, 19, 112–127. [Google Scholar] [CrossRef]
- Le, D.T.; Müller, K.M. In Vitro Assembly of Virus-Like Particles and Their Applications. Life 2021, 11, 334. [Google Scholar] [CrossRef]
- Mohsen, M.O.; Zha, L.; Cabral-Miranda, G.; Bachmann, M.F. Major findings and recent advances in virus–like particle (VLP)-based vaccines. Semin. Immunol. 2017, 34, 123–132. [Google Scholar] [CrossRef]
- Porterfield, J.Z.; Dhason, M.S.; Loeb, D.D.; Nassal, M.; Stray, S.J.; Zlotnick, A. Full-Length Hepatitis B Virus Core Protein Packages Viral and Heterologous RNA with Similarly High Levels of Cooperativity. J. Virol. 2010, 84, 7174–7184. [Google Scholar] [CrossRef]
- Moradi Vahdat, M.; Hemmati, F.; Ghorbani, A.; Rutkowska, D.; Afsharifar, A.; Eskandari, M.H.; Rezaei, N.; Niazi, A. Hepatitis B core-based virus-like particles: A platform for vaccine development in plants. Biotechnol. Rep. 2021, 29, e00605. [Google Scholar] [CrossRef]
- Petrovskis, I.; Lieknina, I.; Dislers, A.; Jansons, J.; Sominskaya, I.; Bogans, J.; Akopjana, I.; Zakova, J. Production of the hbc protein from different HBV genotypes in e. coli. use of reassociated HBC vlps for packaging of SS-and DSRNA. Microorganisms 2021, 9, 283. [Google Scholar] [CrossRef]
- Choi, K.M.; Kim, K.; Kwon, I.C.; Kim, I.S.; Ahn, H.J. Systemic delivery of siRNA by chimeric capsid protein: Tumor targeting and RNAi activity in vivo. Mol. Pharm. 2013, 10, 18–25. [Google Scholar] [CrossRef] [PubMed]
- Choi, K.M.; Choi, S.H.; Jeon, H.; Kim, I.S.; Ahn, H.J. Chimeric capsid protein as a nanocarrier for siRNA delivery: Stability and cellular uptake of encapsulated siRNA. ACS Nano 2011, 5, 8690–8699. [Google Scholar] [CrossRef] [PubMed]
- Cooper, A.; Shaul, Y. Recombinant viral capsids as an efficient vehicle of oligonucleotide delivery into cells. Biochem. Biophys. Res. Commun. 2005, 327, 1094–1099. [Google Scholar] [CrossRef]
- Effio, C.L.; Hubbuch, J. Next generation vaccines and vectors: Designing downstream processes for recombinant protein-based virus-like particles. Biotechnol. J. 2015, 10, 715–727. [Google Scholar] [CrossRef] [PubMed]
- Zhang, Y.; Liu, Y.; Zhang, B.; Yin, S.; Li, X.; Zhao, D. In vitro preparation of uniform and nucleic acid free hepatitis B core particles through an optimized disassembly- purification-reassembly process. Protein Expr. Purif. 2021, 15, 105747. [Google Scholar] [CrossRef] [PubMed]
- Strods, A.; Ose, V.; Bogans, J.; Cielens, I.; Kalnins, G.; Radovica, I.; Kazaks, A.; Pumpens, P.; Renhofa, R. Preparation by alkaline treatment and detailed characterisation of empty hepatitis B virus core particles for vaccine and gene therapy applications. Sci. Rep. 2015, 5, 11639. [Google Scholar] [CrossRef] [PubMed]
- Sominskaya, I.; Skrastina, D.; Petrovskis, I.; Dishlers, A.; Berza, I.; Mihailova, M.; Jansons, J.; Akopjana, I.; Stahovska, I.; Dreilina, D.; et al. A VLP Library of C-Terminally Truncated Hepatitis B Core Proteins: Correlation of RNA Encapsidation with a Th1/Th2 Switch in the Immune Responses of Mice. PLoS ONE 2013, 8, e75938. [Google Scholar] [CrossRef]
- Newman, M.; Chua, P.K.; Tang, F.-M.; Su, P.-Y.; Shih, C. Testing an Electrostatic Interaction Hypothesis of Hepatitis B Virus Capsid Stability by Using an In Vitro Capsid Disassembly/Reassembly System. J. Virol. 2009, 83, 10616–10626. [Google Scholar] [CrossRef]
- Hillebrandt, N.; Vormittag, P.; Dietrich, A.; Wegner, C.H.; Hubbuch, J. Process development for cross-flow diafiltration-based VLP disassembly: A novel high-throughput screening approach. Biotechnol. Bioeng. 2021, 118, 3926–3940. [Google Scholar] [CrossRef]
- Hillebrandt, N.; Vormittag, P.; Bluthardt, N.; Dietrich, A.; Hubbuch, J. Integrated Process for Capture and Purification of Virus-Like Particles: Enhancing Process Performance by Cross-Flow Filtration. Front. Bioeng. Biotechnol. 2020, 8, 489. [Google Scholar] [CrossRef]
- Rüdt, M.; Vormittag, P.; Hillebrandt, N.; Hubbuch, J. Process monitoring of virus-like particle reassembly by diafiltration with UV/Vis spectroscopy and light scattering. Biotechnol. Bioeng. 2019, 116, 1366–1379. [Google Scholar] [CrossRef] [PubMed]
- Hillebrandt, N.; Hubbuch, J. Size-selective downstream processing of virus particles and non-enveloped virus-like particles. Front. Bioeng. Biotechnol. 2023, 11, 1192050. [Google Scholar] [CrossRef] [PubMed]
- Ladd Effio, C.; Wenger, L.; Ötes, O.; Oelmeier, S.A.; Kneusel, R.; Hubbuch, J. Downstream processing of virus-like particles: Single-stage and multi-stage aqueous two-phase extraction. J. Chromatogr. A 2015, 1383, 35–46. [Google Scholar] [CrossRef] [PubMed]
- Yuan, Y.; Shane, E.; Oliver, C.N. Reversed-phase high-performance liquid chromatography of virus- like particles. J. Chromatogr. A 1998, 816, 21–28. [Google Scholar] [CrossRef] [PubMed]
- Shytuhina, A.; Pristatsky, P.; He, J.; Casimiro, D.R.; Schwartz, R.M.; Hoang, V.M.; Ha, S. Development and application of a reversed-phase high-performance liquid chromatographic method for quantitation and characterization of a Chikungunya virus-like particle vaccine. J. Chromatogr. A 2014, 1364, 192–197. [Google Scholar] [CrossRef] [PubMed]
- Valentic, A.; Müller, J.; Hubbuch, J. Effects of Different Lengths of a Nucleic Acid Binding Region and Bound Nucleic Acids on the Phase Behavior and Purification Process of HBcAg Virus-Like Particles. Front. Bioeng. Biotechnol. 2022, 10, 929243. [Google Scholar] [CrossRef] [PubMed]
- Zhang, B.; Yin, S.; Wang, Y.; Su, Z.; Bi, J. Cost-effective purification process development for chimeric hepatitis B core (HBc) virus-like particles assisted by molecular dynamic simulation. Eng. Life Sci. 2021, 21, 438–452. [Google Scholar] [CrossRef]
- Porterfield, J.Z.; Zlotnick, A. A simple and general method for determining the protein and nucleic acid content of viruses by UV absorbance. Virology 2010, 407, 281–288. [Google Scholar] [CrossRef]
- Taylor, S.; Wakem, M.; Dijkman, G.; Alsarraj, M.; Nguyen, M. A practical approach to RT-qPCR-Publishing data that conform to the MIQE guidelines. Methods 2010, 50, S1. [Google Scholar] [CrossRef]
- Rulli, S.J.; Hibbert, C.S.; Mirro, J.; Pederson, T.; Biswal, S.; Rein, A. Selective and Nonselective Packaging of Cellular RNAs in Retrovirus Particles. J. Virol. 2007, 81, 6623–6631. [Google Scholar] [CrossRef]
- Mülhardt, C.; Beese, E.W. Molecular Biology and Genomics; Elsevier: Amsterdam, The Netherlands, 2007; ISBN 978-0-12-088546-6. [Google Scholar]
- Ali, N.; Rampazzo, R.D.C.P.; Costa, A.D.T.; Krieger, M.A. Current Nucleic Acid Extraction Methods and Their Implications to Point-of-Care Diagnostics. Biomed. Res. Int. 2017, 2017, 9306564. [Google Scholar] [CrossRef] [PubMed]
- Toni, L.S.; Garcia, A.M.; Jeffrey, D.A.; Jiang, X.; Stauffer, B.L.; Miyamoto, S.D.; Sucharov, C.C. Optimization of phenol-chloroform RNA extraction. MethodsX 2018, 5, 599–608. [Google Scholar] [CrossRef] [PubMed]
- Wright, J.J.; Lee, S.; Zaikova, E.; Walsh, D.A.; Hallam, S.J. DNA Extraction from 0.22 μM Sterivex Filters and Cesium Chloride Density Gradient Centrifugation. J. Vis. Exp. 2009, 18, e1352. [Google Scholar] [CrossRef]
- Schmitz, A.; Riesner, D. Purification of nucleic acids by selective precipitation with polyethylene glycol 6000. Anal. Biochem. 2006, 354, 311–313. [Google Scholar] [CrossRef] [PubMed]
- Wingfield, L.K.; Atcharawiriyakul, J. Evaluation of simple and rapid dna extraction methods for molecular identification of fungi using the internal transcribed spacer regions. Asia-Pac. J. Sci. Technol. 2021, 26, 1–7. [Google Scholar]
- Hönig, W.; Kula, M.R. Selectivity of protein precipitation with polyethylene glycol fractions of various molecular weights. Anal. Biochem. 1976, 72, 502–512. [Google Scholar] [CrossRef]
- Jones, L.J.; Yue, S.T.; Ching-Ying, C.; Singer, V.L. RNA Quantitation by Fluorescence-Based Solution Assay- RiboGreen Reagent Characterization. Anal. Biochem. 1998, 374, 368–374. [Google Scholar] [CrossRef]
- Vafina, G.; Zainutdinova, E.; Bulatov, E.; Filimonova, M.N. Endonuclease from gram-negative bacteria Serratia marcescens is as effective as pulmozyme in the hydrolysis of DNA in sputum. Front. Pharmacol. 2018, 9, 114. [Google Scholar] [CrossRef]
- Le Pogam, S.; Chua, P.K.; Newman, M.; Shih, C. Exposure of RNA Templates and Encapsidation of Spliced Viral RNA Are Influenced by the Arginine-Rich Domain of Human Hepatitis B Virus Core Antigen (HBcAg 165-173). J. Virol. 2005, 79, 1871–1887. [Google Scholar] [CrossRef]

| Concentration in ng/µL | Relative Standard Deviation [-] | |
|---|---|---|
| Cp157 without extraction | 13.83 ± 5.97 | 43.17 |
| Cp157 with extraction #1 | 27.02 ± 0.97 | 3.58 |
| Cp157 with extraction #2 | 25.96 ± 1.75 | 6.75 |
| Cp157 with extraction #3 | 26.94 ± 1.41 | 5.24 |
| Assay | Treatment | Determined Nucleic Acid Species | Concentration in ng/mL |
|---|---|---|---|
| RiboGreen | - | Total | 220.20 ± 4.55 |
| DNAse 1 Treated | RNA | 78.34 ± 1.67 | |
| PicoGreen | - | Total | 121.52 ± 2.21 |
| RNAse A/T1 | DNA | 52.63 ± 3.60 | |
| RNAse A/T1 + S1 Nuclease | dsDNA | 22.57 ± 1.57 |
| Injection | Peak Areas at A280 Cp149/Cp157 | ||
|---|---|---|---|
| Day 1 | Day 2 | Day 3 | |
| 1 | 14.55/9.36 | 13.74/9.11 | 14.98/9.50 |
| 2 | 14.44/9.21 | 13.46/9.10 | 14.53/9.22 |
| 3 | 13.92/9.06 | 13.24/9.14 | 14.98/9.44 |
| Average | 14.31 ± 0.28/9.21 ± 0.12 | 13.48 ± 0.21/9.12 ± 0.02 | 14.82 ± 0.21/9.39 ± 0.12 |
| Repeatability/RSD | 1.93%/1.32% | 1.53%/0.18% | 1.42%/1.27% |
| Intermediate precision | 3.9%/1.26% | ||
| Concentration Level | Measured Mass (µg) | Theoretical Mass (µg) | Accuracy |
|---|---|---|---|
| 1 | 8.76 | 8.67 | 101% |
| 2 | 4.48 | 4.54 | 99% |
| 3 | 2.70 | 2.54 | 106% |
| 4 | 1.68 | 1.59 | 106% |
Disclaimer/Publisher’s Note: The statements, opinions and data contained in all publications are solely those of the individual author(s) and contributor(s) and not of MDPI and/or the editor(s). MDPI and/or the editor(s) disclaim responsibility for any injury to people or property resulting from any ideas, methods, instructions or products referred to in the content. |
© 2023 by the authors. Licensee MDPI, Basel, Switzerland. This article is an open access article distributed under the terms and conditions of the Creative Commons Attribution (CC BY) license (https://creativecommons.org/licenses/by/4.0/).
Share and Cite
Valentic, A.; Böhner, N.; Hubbuch, J. Absolute Quantification of Hepatitis B Core Antigen (HBcAg) Virus-like Particles and Bound Nucleic Acids. Viruses 2024, 16, 13. https://doi.org/10.3390/v16010013
Valentic A, Böhner N, Hubbuch J. Absolute Quantification of Hepatitis B Core Antigen (HBcAg) Virus-like Particles and Bound Nucleic Acids. Viruses. 2024; 16(1):13. https://doi.org/10.3390/v16010013
Chicago/Turabian StyleValentic, Angela, Nicola Böhner, and Jürgen Hubbuch. 2024. "Absolute Quantification of Hepatitis B Core Antigen (HBcAg) Virus-like Particles and Bound Nucleic Acids" Viruses 16, no. 1: 13. https://doi.org/10.3390/v16010013
APA StyleValentic, A., Böhner, N., & Hubbuch, J. (2024). Absolute Quantification of Hepatitis B Core Antigen (HBcAg) Virus-like Particles and Bound Nucleic Acids. Viruses, 16(1), 13. https://doi.org/10.3390/v16010013