Article

Clinical Profile of SARS-CoV-2 Infection: Mechanisms of the Cellular Immune Response and Immunogenetic Markers in Patients from Brazil

by
Vanessa Pacheco
1,
Rosane Cuber Guimarães
2,
Danielly Corrêa-Moreira
3,
Carlos Eduardo Magalhães
4,
Douglas Figueiredo
4,
Patricia Guttmann
5,
Gisela Freitas Trindade
6,
Juliana Fernandes Amorim da Silva
6,
Ana Paula Dinis Ano Bom
7,
Maria de Lourdes Maia
8,
Juliana Gil Melgaço
7,
Tamiris Azamor da Costa Barros
7,
Andrea Marques Vieira da Silva
7,
Collaborative Group
8 and
Manoel Marques Evangelista Oliveira
3,*
1
Quality Assurance Department, Bio-Manguinhos–Fiocruz, Rio de Janeiro 21040-900, Brazil
2
Vice Director of Quality, Bio-Manguinhos–Fiocruz, Rio de Janeiro 21040-900, Brazil
3
Laboratory of Taxonomy, Biochemistry and Bioprospecting of Fungi, Oswaldo Cruz Institute–Fiocruz, Rio de Janeiro 21041-250, Brazil
4
UERJ-Universitary Hospital Pedro Ernesto, Outpatient Vascular Surgery, Rio de Janeiro 20950-003, Brazil
5
Municial Health Secretary of Rio de Janeiro, Rio de Janeiro 20211-110, Brazil
6
Laboratory of Virologic Tecnology, Bio-Manguinhos–Fiocruz, Rio de Janeiro 21040-900, Brazil
7
Laboratory of Imunologic Tecnology, Bio-Manguinhos–Fiocruz, Rio de Janeiro 21040-900, Brazil
8
Clinic Assessory, Bio-Manguinhos–Fiocruz, Rio de Janeiro 21040-900, Brazil
*
Author to whom correspondence should be addressed.
Viruses 2023, 15(7), 1609; https://doi.org/10.3390/v15071609
Submission received: 15 June 2023 / Revised: 13 July 2023 / Accepted: 20 July 2023 / Published: 23 July 2023
(This article belongs to the Section SARS-CoV-2 and COVID-19)

Abstract

:
Objectives: The aim of this study is to evaluate some mechanisms of the immune response of people infected with SARS-CoV-2 in both acute infection and early and late convalescence phases. Methods: This is a cohort study of 70 cases of COVID-19, confirmed by RT-PCR, followed up to 60 days. Plasma Samples and clinical data were. Viral load, blood count, indicators inflammation were the parameters evaluated. Cellular immune response was evaluated by flow cytometry and Luminex immunoassays. Results: In the severe group, hypertension was the only reported comorbidity. Non severe patients have activated memory naive CD4+ T cells. Critically ill patients have central memory CD4+ T cell activation. Severe COVID-19 patients have both central memory and activated effector CD8+ T cells. Non-severe COVID-19 cases showed an increase in IL1β, IL-6, IL-10 and TNF and severely ill patients had higher levels of the cytokines IL-6, IL-10 and CXCL8. Conclusions: The present work showed that different cellular responses are observed according to the COVID-19 severity in patients from Brazil an epicenter the pandemic in South America. Also, we notice that some cytokines can be used as predictive markers for the disease outcome, possibility implementation of strategies effective by health managers.

1. Introduction

In last years the world has been living a pandemic that started in December 2019, with several severe respiratory distress syndrome cases of unknown cause in Wuhan Province, China [1]. Through genetic sequencing of lung lavage, the pathological agent identified was a new coronavirus type, later named SARS-CoV-2, an enveloped single-stranded RNA betacoronavirus, whose main invasion mechanism is the binding of its structural protein S (spike) with angiotensin-converting enzyme 2 (ACE-2) on cell’s surface [1,2,3,4,5]. The virus rapid spread worldwide and led World Health Organization (WHO) to declare the occurrence of this pandemic on 11 March 2020 [6].
COVID-19 understanding is evolving over time. The range of symptoms varies, from fever, dry cough, sore throat, dyspnea, fatigue, myalgia and diarrhea to severe form, with pulmonary involvement, in 20% of the patients. Headache is one of the most prevalent symptoms with a strong association between rhinosinusitis and SARS-CoV-2 infection, although the pain mechanism likely resides in a systemic reaction to the virus. Nasal symptoms have already been mentioned, and some authors speculate whether the causes of this cluster of symptoms may be due to activation of the trigeminal autonomic reflex by central or meningeal negotiation, or even direct viral damage to the central or peripheral nervous system during an infection [7].
Different variants of SARS-CoV-2 have been associated with different risks and illness’ severity [8,9,10,11]. The increased risk of death can be associated with some risk factors such as cardiovascular disease, diabetes mellitus, arterial hypertension, chronic obstructive pulmonary disease, neoplasms, chronic renal failure, obesity, smoking, male gender and advanced age [3].
Regarding the mechanisms of the immune response against this virus, it is important to mention that higher concentrations of cytokines as granulocyte-colony stimulating factor (G-CSF), interferon gamma-induced protein 10 (IP10), monocyte chemoattractant protein 1 (MCP1), macrophage inflammatory protein 1alpha (MIP1A), tumor necrosis factor alpha (TNFα) interleukin-2 (IL-2) receptor, interleukin-6 (IL-6), interleukin-8 (IL-8), interleukin-10 (IL-10), were reported in patients with COVID-19 [12,13]. These reactions characterize the cytokine storm, a disordered systemic response that leads to a hyperinflammation condition in the host and culminates in an untoward clinicopathological consequences [11]. Some authors describe that observed in infected patients an increase of MIP-1α levels, a cytokine involved in lymphocyte and monocyte endothelial attraction and migration [14]. This may explain the extreme lymphopenia with reduced CD4 and CD8 T populations, that has been shown to be a consistent prognostic factor in patients with severe forms [15,16].
Furthermore, it is important to mention the role of immune mechanisms in patients with severe disorders, such as cancer or other immunosuppressive conditions. The T-cell repertoire in their patients was skewed towards differentiated phenotypes expressing IFNγ, but even more pronounced towards IL-17 production, since SARS-CoV-2 infection induced a Th17 signature, which very likely contributes to disease severity through exacerbated inflammation. Additionally, they show elevated percentages of circulating neutrophils, which is a signature of dysfunctionality and elevated baseline inflammation [17].
Based on this, the aim of this study was to demonstrate some mechanisms involved in the immune response of a cohort of severe and non-severe COVID-19 patients, through the analysis of lymphocyte subpopulations and the profile of cytokines produced by these patients.

2. Materials and Methods

2.1. Study Design and Participants

This is a cohort study of 70 cases of COVID-19, confirmed by RT-PCR, followed up to 60 days. A convenience sample of 70 COVID-19 cases was stratified into severe (30) and non-severe (40). The non-serious group was defined with a greater number of participants due to the possibility of group migration throughout the study, depending on the disease evolution. In addition, 20 healthy participants were included for laboratory method control.
The clinical study protocol was approved by Research Ethics Committee at Pedro Ernesto University Hospital/UERJ n°. 4.160.423, of 17 July 2020 and by Research Ethics Committee of SMS/RJ, approved (number 4.322.297, of 10 June 2020). According to the Declaration of Helsinki (2008) and Resolution number 466 of National Health Council (2012), confidentiality of patient information is guaranteed.

2.2. Data Collection of COVID-19 Patients

Plasma Samples and clinical data were collected at four time points from the date of symptom onset: 4–6, 8–10, 15–20, and 45–60 days. Cellular immunity, viral load, blood count, indicators of liver and kidney function and inflammation were the parameters evaluated. Non-serious cases were captured among symptomatic patients, considered suspects, who contacted the Research Center, or who sought care at the Pedro Ernesto University Hospital or the Piquet Carneiro Polyclinic. Severe cases were captured among patients hospitalized at the Hospital Universitário Pedro Ernesto/UERJ and in Municipal Health Department of Rio de Janeiro (SMS-RJ) health units. The group of participants hospitalized in units of SMS-RJ had the visits carried out by the study central team and the samples collected at the place of hospitalization. The other collections were scheduled according to the symptoms onset day. Not all critically ill patients had the initial samples collected, as they were included after the collection period.

2.3. Inclusion and Exclusion Criteria

Inclusion and Exclusion criteria are described in Table 1. Briefly, after selecting the 70 participants, 20 healthy participants were also included, with a proportional sex and age distribution, like the participants with COVID-19 included in the study, without a diagnosis of COVID-19 (with undetectable RT-PCR and IgM and IgG non-reactive), which constituted a laboratory method control group for the cellular and immunogenetic immunity evaluation. These participants were included in the same research center and only one swab and blood collection were performed on the inclusion date.

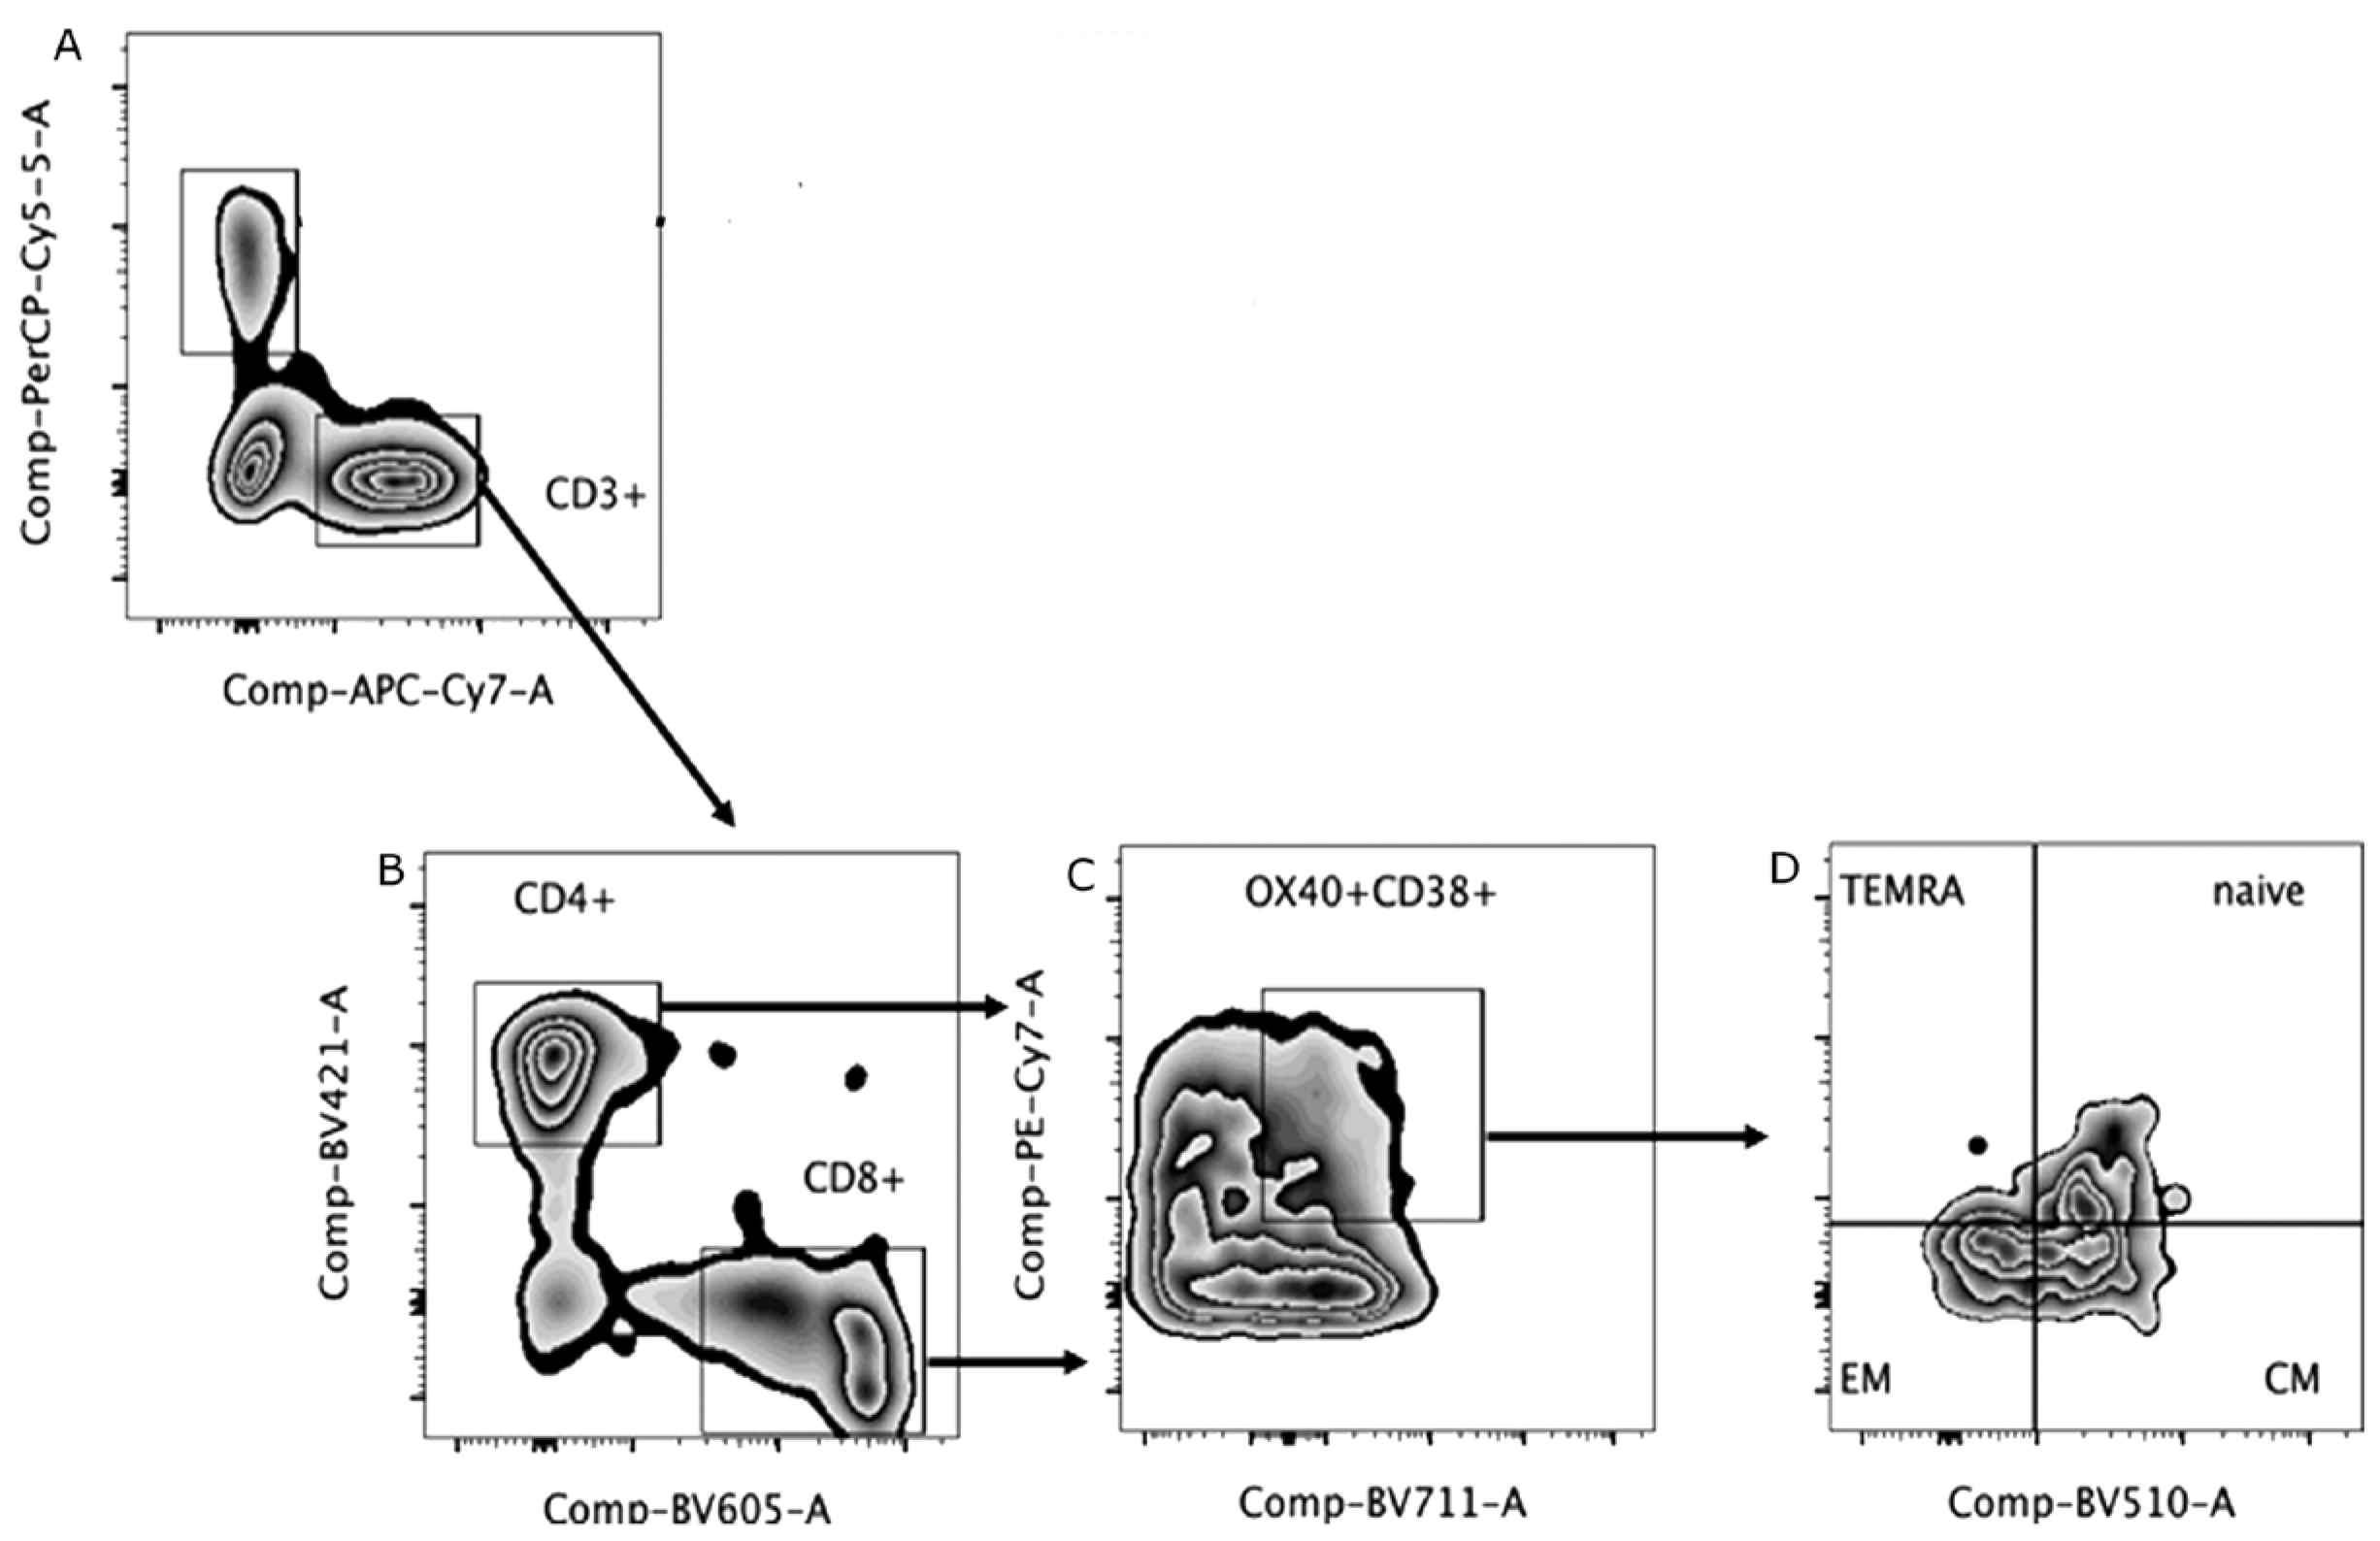
2.4. Immunophenotyping

Peripheral blood mononuclear cells (PBMC) were obtained from whole blood using Histopaque® and Ficoll (Sigma-Aldrich, Saint Louis, MO, USA) different density gradients. These cells were cryopreserved, and then thawed at the time of each assay. Then, was used a concentration of 2 × 10⁵ viable cells/mL, and submitted to immunophenotyping assay with surface antibodies for 20 min at 2–8 °C. After, the cells were washed with phosphate buffer plus fetal bovine serum (FBS) (PBS pH 7.4 at 2% FBS), and centrifuged at 400× g for 5 min. After centrifugation, cells were fixed with 1% paraformaldehyde solution and subsequently acquired in a flow cytometer (LSR FortessaTM, BD Biosciences, Franklin Lakes, NJ, USA). The analysis was performed using Flow Jo software v10.6 (BD Biosciences).
The anti-human antibodies used in the immunophenotyping assay were: panel I (activation)-CD3-FITC, CD4-APCH7, CD8-BV605, CD38-PECy7, OX40-BV711 and panel II (memory)–CD3-APC-Cy7, CD4-BV421, CD8-BV605, CD45RA-APC, CCR7-BV510 (BD Biosciences).

2.5. Cytokine Detection

2.5.1. Immunospot Assay

The frequency of interferon gamma (IFN-γ) and IL-10 secreting cells in patients’ PBMCs were analyzed using the FluoroSpotplus kit human assay (Mabtech, Stockholm, Sweden) as recommended by the manufacturer. Cell suspensions were plated (2 × 10⁵ cells/well) on pre-coated plates and cultured for 20 h in the presence or absence of SARS-CoV-2 Antigen Peptide NCAP-2mcg/mL (nucleocapsid peptides, JPT peptides, Berlin, Germany). As a positive control, cells were incubated with 2 µg/well of Concanavalin A (Sigma-Aldrich). After incubation and development, the “spots” of the cells secreting the said mediators were quantified using the ImmunoSpot® (CTL) image analyzer. The number of “spots” generated by cells stimulated with the antigen was subtracted from the non-specific spots generated in non-stimulated cells, generating the number of specific spots for SARS-CoV-2 per million cells.

2.5.2. Multiplex Micro Array

To quantify the cytokine levels in the plasma of the patients, were used the multiplex liquid microarray assay with magnetic beads-Human Magnetic Luminex Assay (R&D Systems, Minneapolis, MN, USA) which allowed to quantify inflammatory and regulatory cytokines, IL-1b, IL-6, IL-10, IL-8/CXCL8, TNF-α. The test was performed according to the manufacturer’s recommendations. The result was performed in a MAGPIX® system equipped with xPONENT v3.2 and the data were analyzed in SoftMax Pro software version 5.4, applying the five-parameter regression formula to calculate the sample concentrations from the standard curves.

2.6. Statistical Analysis

The results were expressed as mean and its standard deviation. Clinical characteristics of participants were compared using Mann Whitney, Kruskal Wallis, ANOVA and Spearman correlation tests. Trial results with qualitative results were presented in absolute and relative frequency, and evaluated with participants’ clinical characteristics using Mann Whitney, Kruskal Wallis, ANOVA, Chi-square and Fisher’s exact tests. Statistical analyzes with cytokine detection results were performed using the GraphPad Prism 5 software, applying one-way ANOVA, two-way Kruskal-Wallis test and Dunn’s Multiple Comparison Test to compare specific production levels of the analyzed cytokines stratified by clinical and compared to control samples. The results provided quantitative data regarding the cytokines production from specific cellular response to SARS-CoV-2.

3. Results

3.1. Investigation

The first patient was included on 8 December 2020, from UERJ, and on 10 December 2020 in RJ centers. The last research participant was included on 31 March 2021 and fieldwork also ended. Briefly, UERJ included 68 participants, and RJ centers, 28 participants. All participants had detectable PCR for SARS-CoV-2 at enrollment.
Most of the patients were male (52.1%), white (68.5%), married (47.9%) and with high level education (24.7%). The median age was 49 years, ranging from 19 to 93 years. The main symptoms among participants were fatigue, cough, headache, myalgia or arthralgia, and anosmia. Among participants with severe conditions, the most common symptoms were fatigue and dyspnea, and for non-severe ones, headache, and fatigue. Regarding the presence of comorbidities in the severe group, hypertension was reported in 51.6% of the patients and this condition was also reported by 21.4% of the patients of the no-severe group (Table 1).
Table 1. Distribution of participants according to medical conditions.
Medical ConditionsSevereNon-SevereTotal
(N = 31)(N = 42)(N = 73)
n%N%n%p-Value *
Diabetes Mellitus 0.016
Yes1135.549.51520.5
No2064.53890.55879.5
Hipertension 0.015
Yes1651.6921.42534.2
No1548.43378.64865.8
Obesity 0.8524
Yes 516.1511.91013.7
No 2683.93788.16386.3
Smoking (currently) -
Yes 00.000.00 0.0
No 3096.842100.07298.6
Unknown 13.200.011.4
Ex-smoking 0.3358
Yes 722.6511.91216.4
No 2374.23788.16082.2
Unknown 13.200.011.4
Substance abuse ou misuse -
Yes 13.200.011.4
No 3096.842100.07298.6
Special Needs/Deficiency -
Yes 0 0.0 0 0.0 0 0.0
No 31 100.0 42 100.0 73 100.0
Cardiovascular Disease 0.7726
Yes 2 6.5 1 2.4 3 4.1
No 29 93.5 41 97.6 70 95.9
Chronic Kidney Disease -
Yes 0 0.0 0 0.0 0 0.0
No 31 100.0 42 100.0 73 100.0
Chronic Liver Disease -
Yes 0 0.0 0 0.0 0 0.0
No 31 100.0 42 100.0 73 100.0
Chronic Lung Disease 1000
Yes 1 3.2 1 2.4 2 2.7
No 30 96.8 41 97.6 71 97.3
Pulmonary tuberculosis being treated -
Yes 0 0.0 0 0.0 0 0.0
No 31 100.0 42 100.0 73 100.0
Psicologic condiction 0.7726
Yes 2 6.5 1 2.4 3 4.1
No 29 93.5 41 97.6 70 95.9
Other chronic disease 0.7183
Yes 2 6.5 5 11.9 7 9.6
No 29 93.5 37 88.1 66 90.4
Other condiction -
Yes 0 0.0 0 0.0 0 0.0
No 31 100.0 42 100.0 73 100.0
* Fisher’s exact test.

3.2. Laboratory Assays

Table 2 summarizes the laboratory analysis of the patients. We highlight that hemoglobin values were lower in severe cases and in the second week of the disease (visit 2) with a median of 10.1g/dL in critically ill patients. Critically ill patients at visit 1 also had lower lymphocyte counts with a median of 1093 cells compared to 1434 of the non-severe cases.

3.3. Immunophenotyping

Figure 1 shows the gate strategy to set T lymphocytes and in the Figure 2 are demonstrated percentages of activated T cells (CD38+ OX40+). The evaluation of TCD4+ cells demonstrated that severe patients had lower percentages of central and effector memory cells than naïve cells, also observed in non-severe patients. In addition, it was also possible to identify terminally differentiated cells in this group of patients. Regarding the immunophenotyping of TCD8+ cells, similarly to what was observed in TCD4+, severe patients had higher percentages of central memory cells compared to control group. Effector memory cells were identified in both groups of patients, severe and non-severe, and contrary to what was observed in TCD4+ lymphocytes, only in the non-severe group it was possible to identify naïve T cells. Finally, terminally differentiated lymphocytes were observed in the severe and non-severe groups, the former being like the control group (Figure 2).

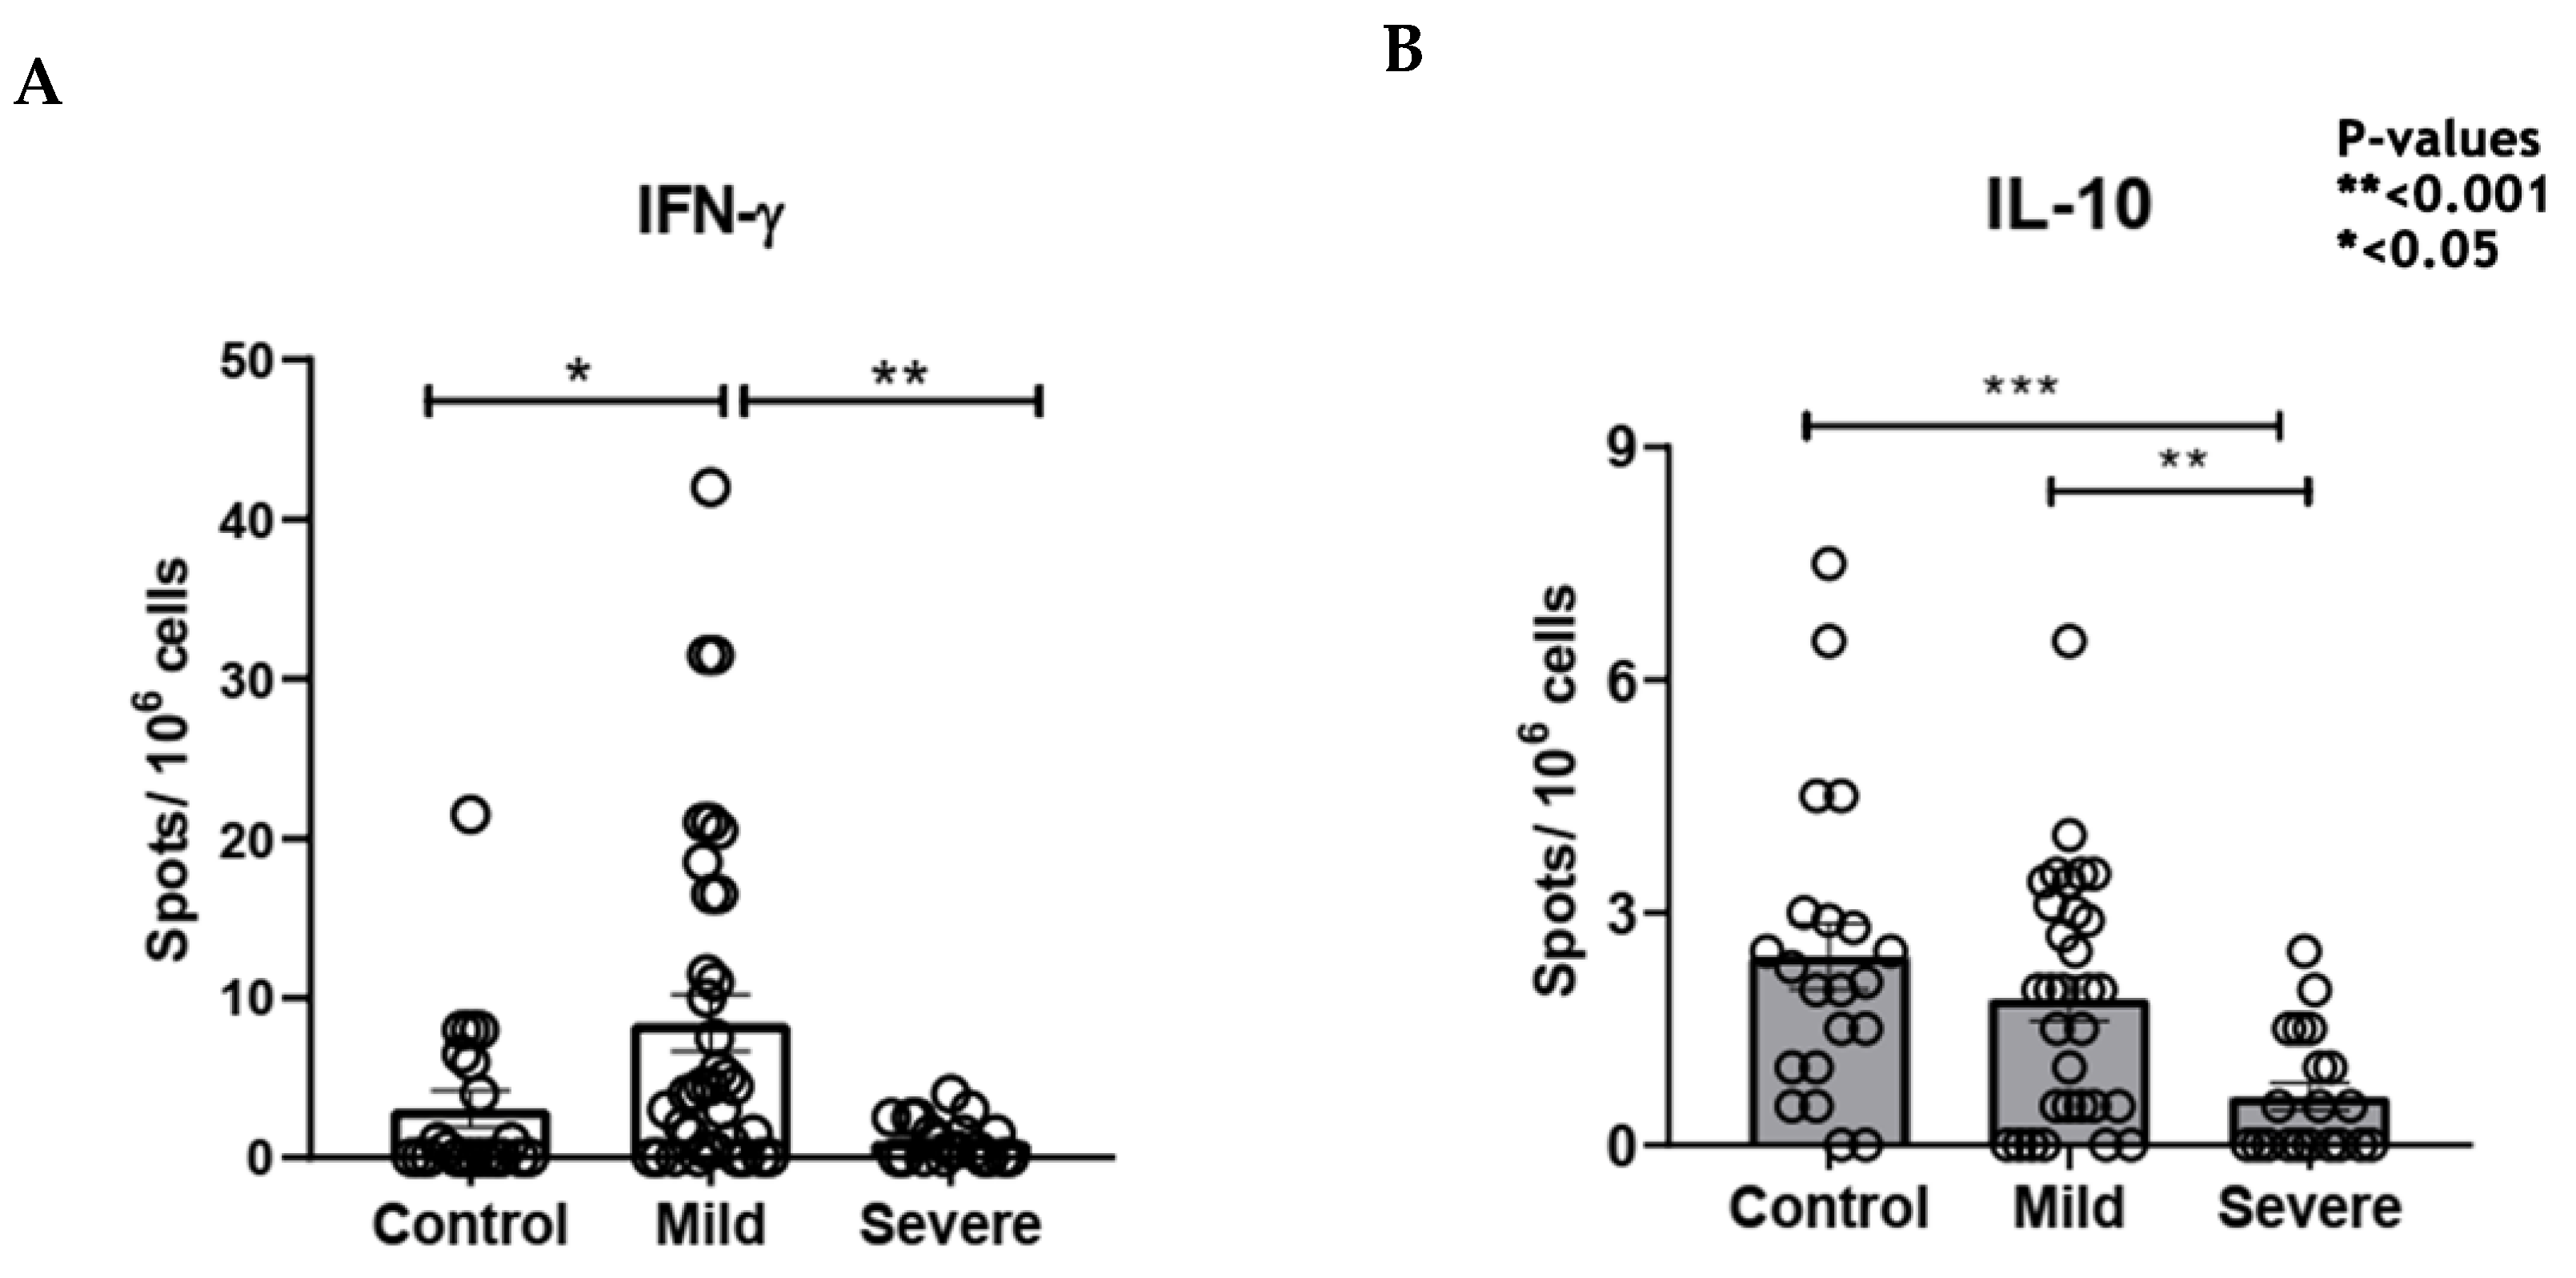
3.4. Cytokine Detection

Cytokine detection: Comparing cytokine levels quantification in laboratory controls and patients in the 4/6-day collection after study admission, it was seen that non-severe COVID-19 cases showed an increase in IL1β, IL-6, IL-10 and TNF (Figure 3A–D). Severely ill patients had higher levels of the cytokines IL-6, IL-10 and CXCL8 in the first days of SARS-CoV-2 infection (Figure 2B,C,E) and, in contrast, lower levels of IL-1β and TNF (Figure 3A,D) than controls and non-severe patients. At the later time of collection, 45/60 days after admission, non-critical patients still had increased levels of IL-1β and TNF (Figure 3A,D).
According to severity, it was seen that COVID-19 severe cases have lower production of IL1β at all times analyzed (Figure 3A) and of TNF at times 4/6 and 45/60 days (Figure 3D). Concomitantly, in severe COVID-19, an increase in the initial production of IL6 and IL10 (4/6 days) was seen (Figure 3B,C) and maintenance of high levels of CXCL8 at times 4/6 and 15/20 days (Figure 3E).
After stimulation with nucleocapsid peptides (NCAP–2mcg/mL, JPT peptides), it was possible to detect IFNγ and IL10-secreting cells by the FluoroSpot technique both in the severe group and in the non-severe group (Figure 4).
FluoroSpot data showed that 22.8% of the samples had more than 10 detectable spots after stimulation with SARS-CoV-2 peptides. Therefore, the following were selected for immunophenotyping evaluation: (a) samples from 15 participants in the non-severe group who presented more than 5 spots; (b) samples of 5 serious participants who presented 2 to 3 spots; (c) samples from 5 healthy participants/controls. A difference in interferon-gamma secretion can be observed between severe and non-severe, which can be explained by the high cellular activation observed in the periphery found in the cytometry data, which can lead to cellular exhaustion and compromise the quality of interferon production.

4. Discussion

In this study, we set out to draw a clinical and a panel of the some mechanisms of the immune response of people infected with SARS-CoV-2 in the phases of acute infection and early and late convalescence. In this sense, we noted that the most common symptoms for severe and non-severe cases (fatigue, dyspnea, muscle pain, among others), besides comorbidities, including cardiovascular disease, diabetes, chronic respiratory disease, hypertension, frequently present in severe cases with COVID-19, were also observed by some authors that described the same profile in their patients [12,13,17]. The authors associate the COVID-19 pathogenesis with the host immune responses against the SARS-CoV-2.
In a systematic review conducted by Melo et al. [18], several cytokine storm biomarkers were described. The authors point out, among other aspects, high levels of interleukin-6, and hyperferritinemia, as well as the C-Reactive Protein, and D-dimer as important biomarkers of cytokine storm syndrome.
D-dimer is a biological marker present in blood when there is degradation of fibrin, a protein involved in clot formation. Thus, a greater amount of circulating D-dimer is associated with changes in clotting process and mainly related to an increased risk of deep vein thrombosis (DVT) and/or pulmonary thromboembolism [19]. Some authors described the increase of D-dimer was considered a infection indicator and suggest greater severity of COVID-19, since a large amount of immune response of these patients [20,21], it is important to say that were observed a decrease in the percentage of natural killer cells as well as lymphocytes cytokines is released (Cytokine storm). The mechanisms that lead to lymphopenia in COVID-19 are still not fully understood, however, the cytokine storm and, consequently, lymphocytes recruitment to inflammatory sites, apoptosis, pyroptosis and exhaustion are some hypothesis [2,19].
We also highlight hyperferritinemia observed in critically ill patients in our study, compared to non-severely ill patients. In the acute phase of the disease, which corresponds to the first collections, ferritin levels in critically ill patients were about 10 times higher than in non-severe patients. Considering ferritin as a mediator of immune dysregulation, through direct immunosuppressive and pro-inflammatory effects, this is an important predictor of cytokine storm. These data corroborate what was described by Vargas-Vargas et al. [22], in a review of clinical cases, in which elevated ferritin levels associated with diabetes and more severe outcomes of COVID-19 were observed.
Elevated serum concentrations of IL-6 and other inflammatory cytokines are hallmarks of cytokine storm and correlate with poor clinical outcomes [18]. We can cite, as an example, the high levels of C-reactive protein, a protein whose expression is driven by IL-6, as also a biomarker of severe clinical manifestations of COVID-19. Corroborating that was observed in our work, in which CRP (C-reactive protein) levels was higher in critically ill patients, and in the first visits (1 and 2). This observation is as expected, since this protein is synthesized by the liver in times of stress, especially in acute phase, such as when there is a relevant infection in progress and its function is to help the immune system, through anti-inflammatory activity [23].
Regarding some mechanisms involved in the cellular immune response in critically ill individuals in acute phase of the disease, the appearance of memory lymphocytes and antiviral cytokines after 15–20 days of viral clearance at the time of discharge of hospitalized patients [10,24]. In this study, the emergence of memory T lymphocytes was also observed in the recovery period, as well as IFNg and IL10 production. The group evaluated in the present study had a small sample size, not allowing extrapolations of results to a population scale, requiring evaluations in groups that are more representative of general population.
Cytokines play a fundamental role in COVID-19 since the severity of the disease has been associated with an exuberant production of proinflammatory cytokines, such as IL-1, IL-2, IL-6, IL-10, IL-12, IFN-γ, TNF-α, and, consequently, an excessive activation of the immune system, which may cause tissue injury, mainly on the lungs [25]. So, in the present study, were observed high levels of cytokynes, as interleukin (IL)-6, IP-10 (CXCL10), and TNFα, and proteins as C-reactive protein, ferritin, in the severe cases when compared with non-severe ones, in accordance with the description by Cao and Li [26].
According to some studies, high IL-6 levels are a signature of intense inflammatory profile in COVID-19 infections, and also a biomaker strongly related to severe siymptoms progression [10,18,27]. In this study, the circulating cytokines quantification showed that patients with COVID-19 have increased levels of IL-6 and IL-10 in the collections 4–6 days regardless of severity [9,10]. Comparing the initial cytokine levels (4–6 days) of patients according to the severity, it was seen that the non-severe were characterized by higher levels of IL1β and TNF, as showed by Pompetchara et al. [28], while the bass had an increased profile of IL6 and IL10. These data, therefore, highlighted the role of these cytokines as predictive biomarkers in disease outcome, that corroborates with Henry et al. [29].
Severe cases also showed increased nitric oxide response and acute inflammatory response, data compatible with the quantification of circulating cytokines in these individuals, in addition to potential responses to opportunistic pathogens such as bacteria and fungi [18]. Macrophages constitute a source of nitric oxide in the body and a high serum nitric oxide is directly related to high macrophages. However, these analyses of opportunistic pathogens not included in this present study and we considerate a limitation this study.
In conclusion, the present work showed that different cellular responses are observed according to the COVID-19 severity in patients from Brazil an epicenter the pandemic in South America. Also, we notice that some cytokines can be used as predictive markers for the disease outcome, possibility implementation of strategies effective by health managers. But it is also important to evaluate the humoral response, since COVID-19 has different outcomes.

Author Contributions

Conceptualization, V.P. and M.M.E.O.; methodology, V.P., R.C.G., P.G., G.F.T., J.F.A.d.S., M.d.L.M., J.G.M. and M.M.E.O.; writing—original draft preparation, V.P., R.C.G., D.C.-M., D.F., P.G., G.F.T., A.P.D.A.B., M.d.L.M., J.G.M., T.A.d.C.B., A.M.V.d.S., Collaborative Group and M.M.E.O.; writing—review and editing, D.C.-M., C.E.M., D.F., A.P.D.A.B., J.G.M., T.A.d.C.B., A.M.V.d.S. and M.M.E.O.; visualization, C.E.M., funding acquisition, T.A.d.C.B. All authors have read and agreed to the published version of the manuscript.

Funding

This work was supported by Fundação Carlos Chagas Filho de Amparo à Pesquisa do Estado do Rio de Janeiro (FAPERJ–Grant: JCNE E-26/201.433/2021–M.M.E.O.), INOVA IOC (IOC-026-FIO-21-D.C.-M fellowship), Conselho Nacional de Desenvolvimento Científico e Tecnológico (CNPq-Grant Proc. 307007/2022–M.M.E.O.), Emenda Gustavo Freut and MP COVID 1083.

Institutional Review Board Statement

The clinical study protocol was approved by Research Ethics Committee at Pedro Ernesto University Hospital/UERJ n°. 4.160.423, of 17 July 2020, Research Ethics Committee of SMS/RJ, approved (number 4.322.297, of 10 June 2020) and Research Ethics Committee (CEP) Fiocruz, CAAE:28063114.2.0000.5262. According to the Declaration of Helsinki (2008) and Resolution number 466 of National Health Council (2012), confidentiality of patient information is guaranteed.

Informed Consent Statement

Written informed consent has been obtained from the patients to publish this paper.

Data Availability Statement

The data that support the findings of this study are available from the corresponding author upon reasonable request.

Acknowledgments

Collaborative Group in alfabetic order-Clara Lucy de Vasconcellos Ferroco, Daniele Fernandes de Aguiar, Janaína Reis Xavier, Letícia Kegele Lignani, Luiz Antônio Bastos Camacho, Maria Leticia Borges dos Santos, Patricia Mouta Nunes de Oliveira, Paulo Roberto Gomes Takey, Renata Saraiva Pedro, Robson Leite de Souza Cruz, Sheila Maria Barbosa de Lima, Thalita da Matta de Castro, Vitor Cardoso da Gama.

Conflicts of Interest

The authors declare that they have no known competing financial interests or personal relationships that could have appeared to influence the work reported in this paper.

References

  1. Sanders, J.M.; Monogue, M.L.; Jodlowski, T.Z.; Cutrell, J.B. Pharmacologic Treatments for Coronavirus Disease 2019 (COVID-19): A Review. JAMA 2020, 323, 1824–1836. [Google Scholar] [CrossRef]
  2. Jamilloux, Y.; Henry, T.; Belot, A.; Viel, S.; Fauter, M.; El Jammal, T.; Walzer, T.; François, B.; Sève, P. Should we stimulate or suppress immune responses in COVID-19? Cytokine and anti-cytokine interventions. Autoimmun. Rev. 2020, 19, 102567. [Google Scholar] [CrossRef]
  3. Huang, C.; Wang, Y.; Li, X.; Ren, L.; Zhao, J.; Hu, Y.; Zhang, L.; Fan, G.; Xu, J.; Gu, X.; et al. Clinical features of patients infected with 2019 novel coronavirus in Wuhan, China. Lancet 2019, 395, 497–506. [Google Scholar] [CrossRef] [Green Version]
  4. Zhu, N.; Zhang, D.; Wang, W.; Li, X.; Yang, B.; Song, J.; Zhao, X.; Huang, B.; Shi, W.; Lu, R.; et al. A Novel Coronavirus from Patients with Pneumonia in China, 2019. N. Engl. J. Med. 2020, 382, 727–733. [Google Scholar] [CrossRef] [PubMed]
  5. Asselta, R.; Paraboschi, E.M.; Mantovani, A.; Duga, S. ACE2 and TMPRSS2 variants and expression as candidates to sex and country differences in COVID-19 severity in Italy. Aging 2020, 12, 10087–10098. [Google Scholar] [CrossRef] [PubMed]
  6. World Health Organization. WHO Announces COVID-19 Outbreak a Pandemic. Available online: https://www.euro.who.int/en/health-topics/health-emergencies/coronavirus-covid-19/news/news/2020/3/who-announces-covid-19-outbreak-a-pandemic (accessed on 18 June 2020).
  7. Straburzyński, M.; Nowaczewska, M.; Budrewicz, S.; Waliszewska-Prosół, M. COVID-19-related headache and sinonasal inflammation: A longitudinal study analysing the role of acute rhinosinusitis and ICHD-3 classification difficulties in SARS-CoV-2 infection. Cephalalgia 2022, 42, 218–228. [Google Scholar] [CrossRef]
  8. Fernandes, Q.; Inchakalodya, V.P.; Merhia, M.; Mestiria, S.; Taiba, N.; Moustafa Abo El-Ella, D.; Bedhiafi, T.; Raza, A.; Al-Zaidan, L.; Mohsen, M.O.; et al. Emerging COVID-19 variants and their impact on SARS-CoV-2 diagnosis, therapeutics and vacines. Ann. Med. 2022, 54, 524–540. [Google Scholar] [CrossRef]
  9. Ackermann, M.; Verleden, S.E.; Kuehnel, M.; Haverich, A.; Welte, T.; Laenger, F.; Vanstapel, A.; Werlein, C.; Stark, H.; Tzankov, A.; et al. Pulmonary Vascular Endothelialitis, Thrombosis, and Angiogenesis in Covid-19. N. Engl. J. Med. 2020, 383, 120–128. [Google Scholar] [CrossRef] [PubMed]
  10. Vardhana, S.A.; Wolchok, J.D. The many faces of the anti-COVID immune response. J. Exp. Med. 2020, 217, e20200678. [Google Scholar] [CrossRef]
  11. Saghazadeh, A.; Rezaei, N. Immune-epidemiological parameters of the novel coronavirus—A perspective. Exp. Rev. Clin. Immunol. 2020, 16, 465–470. [Google Scholar] [CrossRef] [Green Version]
  12. Mahmudpour, M.; Roozbeh, J.; Keshavarz, M.; Farrokhi, S.; Nabipour, I. COVID-19 cytokine storm: The anger of inflammation. Cytokine 2020, 133, 155151. [Google Scholar] [CrossRef] [PubMed]
  13. Melgaço, J.G.; Brito, E.; Cunha, D.; Azamor, T.; da Silva, A.M.V.; Tubarão, L.N.; Gonçalves, R.B.; Monteiro, R.Q.; Missailidis, S.; da Costa Neves, P.C.; et al. Cellular and Molecular Immunology Approaches for the Development of Immunotherapies against the New Coronavirus (SARS-cov-2): Challenges to Near-Future Breakthroughs. J. Immunol. Res. 2020, 2020, 8827670. [Google Scholar] [CrossRef] [PubMed]
  14. Vazquez-Alejo, E.; Tarancon-Diez, L.; de la Sierra Espinar-Buitrago, M.; Genebat, M.; Calderón, A.; Pérez-Cabeza, G.; Magro-Lopez, E.; Leal, M.; Muñoz-Fernández, M.Á. Persistent Exhausted T-Cell Immunity after Severe COVID-19: 6-Month Evaluation in a Prospective Observational Study. J. Clin. Med 2023, 12, 3539. [Google Scholar] [CrossRef] [PubMed]
  15. Chen, J.; Qi, T.; Liu, L.; Ling, Y.; Qian, Z.; Li, T.; Li, F.; Xu, Q.; Zhang, Y.; Xu, S.; et al. Clinical progression of patients with COVID-19 in Shanghai, China. J. Infect. 2020, 80, e1–e6. [Google Scholar] [CrossRef]
  16. Vabret, N.; Britton, G.J.; Gruber, C.; Hegde, S.; Kim, J.; Kuksin, M.; Levantovsky, R.; Malle, L.; Moreira, A.; Park, M.D.; et al. Immunology of COVID-19: Current State of the Science. Immunity 2020, 52, 910–941. [Google Scholar] [CrossRef]
  17. Echaide, M.; Labiano, I.; Delgado, M.; Fernández de Lascoiti, A.; Ochoa, P.; Garnica, M.; Ramos, P.; Chocarro, L.; Fernández, L.; Arasanz, H.; et al. Immune Profiling Uncovers Memory T-Cell Responses with a Th17 Signature in Cancer Patients with Previous SARS-CoV-2 Infection Followed by mRNA Vaccination. Cancers 2022, 14, 4464. [Google Scholar] [CrossRef]
  18. Melo, A.K.G.; Milby, K.M.; Caparroz, A.L.M.A.; Pinto, A.C.P.N.; Santos, R.R.P.; Rocha, A.P.; Ferreira, G.A.; Souza, V.A.; Valadares, L.D.A.; Vieira, R.M.R.A.; et al. Biomarkers of cytokine storm as red flags for severe and fatal COVID-19 cases: A living systematic review and meta-analysis. PLoS ONE 2021, 16, e0253894. [Google Scholar] [CrossRef]
  19. Zhang, L.; Yan, X.; Fan, Q.; Liu, H.; Liu, X.; Liu, Z.; Zhang, Z. D-dimer levels on admission to predict in-hospital mortality in patients with Covid-19. J. Thromb. Haemost. 2020, 18, 1324–1329. [Google Scholar] [CrossRef]
  20. Tang, N.; Li, D.; Wang, X.; Sun, Z. Abnormal coagulation parameters are associated with poor prognosis in patients with novel coronavirus pneumonia. J. Thromb. Haemost. 2020, 18, 844–847. [Google Scholar] [CrossRef] [Green Version]
  21. Wang, D.; Hu, B.; Hu, C.; Zhu, F.; Liu, X.; Zhang, J.; Wang, B.; Xiang, H.; Cheng, Z.; Xiong, Y.; et al. Clinical Characteristics of 138 Hospitalized Patients With 2019 Novel Coronavirus–Infected Pneumonia in Wuhan, China. JAMA 2020, 323, 1061. [Google Scholar] [CrossRef]
  22. Vargas-Vargas, M.; Cortés-Rojo, C. Ferritin levels and COVID-19. Rev. Panam. De Salud Pública 2020, 44, e72. [Google Scholar] [CrossRef]
  23. Stringer, D.; Braude, P.; Myint, P.K.; Evans, L.; Collins, J.T.; Verduri, A.; Quinn, T.J.; Vilches-Moraga, A.; Stechman, M.J.; Pearce, L.; et al. The role of C-reactive protein as a prognostic marker in COVID-19. Int. J. Epidemiol. 2021, 50, 420–429. [Google Scholar] [CrossRef]
  24. Grifoni, A.; Weiskopf, D.; Ramirez, S.I.; Mateus, J.; Dan, J.M.; Moderbacher, C.R.; Rawlings, S.A.; Sutherland, A.; Premkumar, L.; Jadi, R.S.; et al. Targets of T Cell Responses to SARS-cov-2 Coronavirus in Humans with COVID-19 Disease and Unexposed Individuals. Cell 2020, 181, 1489–1501. [Google Scholar] [CrossRef]
  25. del Valle-Mendoza, J.; Tarazona-Castro, Y.; Merino-Luna, A.; Carrillo-Ng, H.; Kym, S.; Aguilar-Luis, M.A.; del Valle, L.J.; Aquino-Ortega, R.; Martins-Luna, J.; Peña-Tuesta, I.; et al. Comparison of cytokines levels among COVID-19 patients living at sea level and high altitude. BMC Infect. Dis. 2022, 22, 96. [Google Scholar] [CrossRef]
  26. Cao, W.; Li, T. COVID-19: Towards understanding of pathogenesis. Cell Res. 2020, 30, 367–369. [Google Scholar] [CrossRef] [PubMed]
  27. Sebbar, E.H.; Choukri, M. Interleukin 6: A biomarker for COVID-19 progression. Proceedings 2023, 72, 3351–3355. [Google Scholar] [CrossRef] [PubMed]
  28. Prompetchara, E.; Ketloy, C.; Palaga, T. Immune responses in COVID-19 and potential vaccines: Lessons learned from SARS and MERS epidemic. Asian Pac. J. Allergy Immunol. 2020, 38, 1–9. [Google Scholar] [CrossRef] [PubMed]
  29. Henry, B.M.; de Oliveira, M.H.S.; Benoit, S.; Plebani, M.; Lippi, G. Hematologic, biochemical and immune biomarker abnormalities associated with severe illness and mortality in coronavirus disease 2019 (COVID-19): A meta-analysis. Clin. Chem. Lab. Med. 2020, 58, 1021–1028. [Google Scholar] [CrossRef] [PubMed] [Green Version]
Figure 1. Gate strategy to set T lymphocytes by flow cytometry. (A) Gate strategy to set T (CD3+) from peripheral blood mononuclear cells. (B) Subsets of TCD4+/TCD8+ according CD3+ and CD4+ or CD8+ expression (C) Gating of activated TCD4+/TCD8+ (Ox40+ CD38+); (D) Percentage of TEMRA (CD45RA+CCR7-), naïve (CD45RA+CCR7+), EM (CD45RA-CCR7-) and CM (CD45RA-CCR7+) TCD4+/TCD8+.
Viruses 15 01609 g001
Figure 2. Percentage of activated (CD38+OX40+). T cells subsets: Central memory T cells TCM CCR7+CD45RA- (blue); Effector memory T cells CCR7-CD45RA- (red); naive T cells CCR7+CD45RA+ (green) and terminally differentiated cells TEMRA CD45RA+CCR7- (white). ANOVA, two-way Kruskal-Wallis test and Dunn’s Multiple Comparison Test was used to perform the comparisons among groups. * p-value < 0.05.
Viruses 15 01609 g002
Figure 3. Cytokine levels in participants infected with SARS-CoV-2 and control group non-infected: Comparing control group (Blue) with the Severe (red) and non-Severe (green) groups. (A) IL1β; (B) IL-6; (C) IL-10; (D) TNF-α and (E) CXCL8 chemokine). ANOVA, two-way Kruskal-Wallis test and Dunn’s Multiple Comparison Test was used to perform the comparisons among groups. p-values **** <0.00001, *** <0.0001, ** <0.001 and * <0.05.
Viruses 15 01609 g003
Figure 4. Percentage of cytokine secreting cells from severe and non-severe patients and no infected control group by FluoroSpot data: (A) IFN-γ; (B) IL10. p-values, *** <0.0001, ** <0.001 and * <0.05.
Viruses 15 01609 g004
Table 2. Laboratory analysis.
Laboratory AnalysisVisit 1Visit 2Visit 3Visit 4
SevereNon SevereSevereNon SevereSevereNon SevereSevereNon Severe
Hemoglobin (g/dL)
Minimum8.411.37.7127.911.37.411.1
Maximum16.716.612.416.215.315.915.716.1
median13.51410.113.912.513.413.113.7
Average13.214.310.11412.513.512.813.6
Standard deviation1.91.33.31.11.91.21.71.3
Hematocrit (%)
Minimum26.634.725.63726.234.622.634.9
Maximum49.749.937.448.545.846.845.847.2
median40.242.631.541.737.340.139.441.1
Average40.142.831.541.937.840.538.741.1
Standard deviation5.33.78.33.15.23.35.13.2
Global leukocytes (/μL)
Minimum39202560673032405040340051003030
Maximum185009920119201074019040129101686010720
median907042709325524010250544071155695
Average9596.14576.193255739.3103265805.67567.75758.3
Standard deviation3198.41468.13669.91915.63752.11868.12553.61539.2
Lymphocytes (/μL)
Minimum396726740.3907.46171145.51180.21080
Maximum30452171.522643494.435903526.437873541
median1093.31434.51502.217851663.5179619831846.5
Average12041486.21502.21788.31718.61864.321191996.3
Standard deviation591.4375.11077.4536.1665.9493659.5548.2
Platelets (thousand//μL)
Minimum14211016213513816544143
Maximum603379464494640480413353
median270220313254335268268250.5
Average304.4219.2313266.8339.8282.5257.5242.1
Standard deviation105.265.2213.576.7122.16691.451.9
LDH (IU/L)
Minimum374.9138.2571.8135.6243157.2238.9226.6
Maximum2460.4632.7830.5825775.9557.9684.9449.2
median673.2344.8701.2348.3445.3321.2365.7310.7
Average777.1366.7701.2358.4462335.4373.7326.6
Standard deviation424.795.8182.9118.5139.771.9102.357.1
Alkaline Phosphatase (IU/L)
Minimum11351.7134911138812786
Maximum41890245357505361351287
median195170.5189.5182166175170168
Average206.3179189.5183.6195.4189.2195.6175
Standard deviation75.951.778.554.585.36557.350.6
TGO/AST (UI/L)
Minimum171252111011911
Maximum2191165511065623363
median5224.553.521212017.518
Average63.128.953.524.827.721.818.520.5
Standard deviation52.616.52.115.816.29.36.19.2
TGP/ALT (UI/L)
Minimum11124791310910
Maximum6912711133552542729760
median7234.5803153251920.5
Average91.839.78041.264.437.624.223.8
Standard deviation121.940.246.752.756.244.617.913.1
Ultrasensitive C-reactive protein (mg/L)
Minimum2.70.417.50.41.50.10.60.1
Maximum228.4127.8142.2200.9169.918.4253.215.1
median613.879.81.67.61.43.81.3
Average77.21279.814.320.83.1162.5
Standard deviation67.223.488.236.935.2453.22.8
D-dimer (ng/mL)
Minimum301.713252525252525
Maximum12968124463601981106363671304025000
median465313842.5564203040130
Average1451.7178.33842.5205.21441.8270.3719.1744.8
Standard deviation2734236.33560.33282401575903.33936
Ferritin (ng/mL)
Minimum88.224.31062.14.280.216.725.612.3
Maximum4225113717881620.51290910.32864.2365.4
median1030.5169.11425.1151.8598.1160.2213103.6
Average1300.62701425.1292.1593.1262.9326.2130.2
Standard deviation1115.7272.2513.3336.8346247.6579.2102.1
Creatinine (mg/dL)
Minimum0.50.51.10.50.40.50.50.6
Maximum2.61.61.21.661.62.21.7
median1.10.81.20.80.90.90.80.8
Average1.10.81.20.81.20.90.90.9
Standard deviation0.40.20.10.210.20.30.2
Disclaimer/Publisher’s Note: The statements, opinions and data contained in all publications are solely those of the individual author(s) and contributor(s) and not of MDPI and/or the editor(s). MDPI and/or the editor(s) disclaim responsibility for any injury to people or property resulting from any ideas, methods, instructions or products referred to in the content.

