Article

Glycemic Dysregulation, Inflammation and Disease Outcomes in Patients Hospitalized with COVID-19: Beyond Diabetes and Obesity

1
1st Division of Internal Medicine & Infectious Diseases Unit, University General Hospital of Ioannina, Faculty of Medicine, University of Ioannina, 45500 Ioannina, Greece
2
Faculty of Medicine, University of Ioannina, 45110 Ioannina, Greece
*
Author to whom correspondence should be addressed.
Viruses 2023, 15(7), 1468; https://doi.org/10.3390/v15071468
Submission received: 15 May 2023 / Revised: 21 June 2023 / Accepted: 26 June 2023 / Published: 28 June 2023
(This article belongs to the Special Issue COVID-19 Pharmacotherapy)

Abstract

:
Introduction: During the COVID-19 pandemic, diabetes mellitus (DM) and obesity were associated with high rates of morbidity and mortality. The aim of this study was to investigate the relationship between markers of inflammation, disease severity, insulin resistance, hyperglycemia, and outcomes in COVID-19 patients with and without diabetes and obesity. Materials and Methods: Epidemiological, clinical, and laboratory data were collected from the University Hospital of Ioannina COVID-19 Registry and included hospitalized patients from March 2020 to December 2022. The study cohort was divided into three subgroups based on the presence of DM, obesity, or the absence of both. Results: In diabetic patients, elevated CRP, IL-6, TRG/HDL-C ratio, and TyG index, severe pneumonia, and hyperglycemia were associated with extended hospitalization. Increased IL-6, NLR, and decreased PFR were associated with a higher risk of death. In the obese subgroup, lower levels of PFR were associated with longer hospitalization and a higher risk of death, while severe lung disease and hyperglycemia were associated with extended hospitalization. In patients without DM or obesity severe pneumonia, NLR, CRP, IL-6, insulin resistance indices, and hyperglycemia during hospitalization were associated with longer hospitalization. Conclusion: Inflammatory markers and disease severity indices were strongly associated with disease outcomes and hyperglycemia across all subgroups.

1. Introduction

Severe acute respiratory syndrome coronavirus 2 (SARS-CoV-2), emerged in late 2019 causing novel coronavirus 2019 (COVID-19) disease, primarily affecting the respiratory system. As of the 20 April 2023, there have been 762 million confirmed cases and almost 7 million deaths reported globally due to COVID-19 [1]. Since the early stages of the pandemic, underlying comorbidities have been associated with a poorer prognosis of COVID-19 [2,3].
Among chronic cardiometabolic diseases, diabetes mellitus (DM), obesity, and cardiovascular disease were associated with higher morbidity and mortality rates in COVID-19 patients [4,5,6]. DM is a chronic condition, with multisystemic manifestations and a major health concern, affecting more than 8.8% of the adult population worldwide [7]. DM is one of the most common comorbidities in COVID-19 patients [8,9], linked to an increased risk of hospitalization and ICU admission (odds ratio [OR]: 2.79) [10]. It is estimated that the prevalence of DM increases with COVID-19 severity, ranging from 14.3% to 27% [2,11]. Furthermore, it was observed that COVID-19 diabetic patients exerted a higher mortality rate compared to non-diabetics (adjusted Hazard Ratio [aHR], 95% CI: 1.23 (1.14–1.32)) [12].
It is postulated that a cumulative effect of structural and functional molecular modifications may contribute to an increased susceptibility to COVID-19 [13]. Diabetic patients exhibit upregulation of angiotensin-converting enzyme-2 (ACE2), characterized by increased expression of this receptor in alveolar lung cells [13,14]. The ACE2 receptor acts as a cellular entry mediator for SARS-CoV-2, which may render diabetic patients more vulnerable to the virus [13,14]. Hyperglycemia can induce glycosylation of ACE2 receptors, thereby increasing viral entry, independent of receptor expression [15,16].
DM has also been associated with dysregulation of innate and adaptive immunity, caused by dysfunction of neutrophils, macrophages, and natural killer (NK) cells, as well as suppressed cytokine production [17]. Conversely, DM is linked to a chronic, pro-inflammatory state [15,18]. Therefore, individuals with DM are more susceptible to developing an exaggerated inflammatory response to SARS-CoV-2 infection [15,18]. It is worth noting that excessive production of circulating cytokines, coupled with pancreatic beta cell infection, may lead to insulin resistance and dysregulation of pre-existing DM, as well as the onset of new DM in individuals with prior normoglycemia [19].
Obesity can burden an individual’s overall health and has grown into an epidemic [20]. It is known to have a deleterious impact on respiratory function as it lowers ventilatory capacity and respiratory drive [21]. In addition, central obesity, as well as excess visceral fat, have a detrimental effect on the compliance of the chest wall and lungs [21]. Also, obesity-associated over-production of inflammatory cytokines impairs immune responses [21]. These reasons could explain the increased susceptibility of obese patients to respiratory infections (upper respiratory tract infections: adjusted OR 1.55 and lower respiratory tract infections: adjusted OR 2.02, respectively) [22]. Similarly, obesity has been linked with an increased risk of SARS-CoV-2 infection (OR: 2.42) and the disease’s progression to severe form (hospitalization, intubation, and death, OR:1.62, 1.75, and 1.23, respectively) [5,23]. The chronic inflammatory state [4] and immune dysfunction observed in individuals with obesity have been suggested as potential underlying mechanisms in the progression of COVID-19 [23]. Furthermore, adipocytes have been shown to exhibit higher ACE2 expression levels compared to the lung, potentially rendering them more vulnerable to viral entry [24,25]. However, the responsible underlying mechanisms are still unclear [5,6,26,27].
Glycemic dysregulation; namely hyperglycemia is common in COVID-19 patients (diabetics and non-diabetics) [11]. Hyperglycemia has been associated with disease severity and poorer outcomes in COVID-19 patients [5,6]. Growing evidence suggests that hyperglycemia serves as an independent risk factor for COVID-19 disease severity and outcomes regardless of prior history of DM or not [7]. Indeed, it has been shown that hyperglycemia in these patients increases the risk of mortality (7-fold) compared to normoglycemia [4,28]. This risk was even higher in non-diabetics compared to dia-betics with hyperglycemia [7]. It has also been shown that hyperglycemia is directly associated with a higher SARS-CoV2 replication rate in the host [13]. Thus, glucose monitoring and control may exert a key role as modifiable risk factor in COVID-19 [7]
The objective of this study was to examine the relationship between markers of inflammation, disease severity, insulin resistance, and outcomes in COVID-19 patients with and without DM and obesity. Additionally, we investigated the correlation between hyperglycemia and COVID-19-associated inflammation, severity, and outcomes in all patient groups.

2. Materials and Methods

2.1. Population

The population study included COVID-19 patients who were hospitalized at the University Hospital of Ioannina from March 2020 to December 2022. SARS-CoV-2 infection was diagnosed through RT-PCR. The patient cohort was divided into sub-groups, based on the presence of DM, obesity, or the absence of both.

2.2. Data Collection

This study was approved by the Institutional Ethics Committee of the University Hospital of Ioannina as a retrospective cohort study on hospitalized COVID-19 patients (Protocol Number: 5/11-03-2021 (issue: 3)/The University Hospital of Ioannina COVID-19 Registry, NCT05534074). Data on epidemiological, clinical, and laboratory parameters were obtained from the University Hospital of Ioannina COVID-19 Registry. As specified by the study protocol, personal identifier codes were used to import data anonymously into a digital database for each patient. Data collection adhered to European Guidelines for Good Clinical and Laboratory Practice and the Helsinki Declaration.

2.3. Study Variables and Endpoints

Study variables included baseline somatometric data and comorbidities; inflammatory markers (white blood cell (WBC) count, C-reactive protein (CRP), procalcitonin (PCT) and interleukin-6 (IL-6)); insulin resistance markers (triglycerides to HDL cholesterol (TRG/HDL-C) ratio and triglyceride–glucose (TyG) index); and disease severity markers; partial pressure of oxygen/fraction of inspired oxygen ratio/PO2/FiO2 ratio (PFR) and computed tomography (CT) burden of disease (CTBoD), defined as the percentage of the diseased lung parenchyma on CT of the lungs. The laboratory parameters examined in the study were documented on admission. An incidence of hyperglycemia was defined according to the ADA guidelines for hospitalized patients (≥140 mg/dL) and was documented on admission or during hospitalization (assessed at multiple time points; day: 3, 5, 7, 9, 11, and 15). Study outcomes included length of stay (LoS) > 7 days, intubation, and death during hospitalization. The association of hyperglycemia and disease inflammatory markers was also investigated.

2.4. Statistical Analysis

The preliminary analysis was performed with Mann–Whitney and chi-squared tests. Further, multivariate binary logistic regression adjusted for the patient’s age and sex was used for the analyses of outcomes. Of note, analyses concerning hyperglycemia were also adjusted for corticosteroid administration during hospitalization. All statistical analyses were performed using IBM SPSS Statistics 26.0 software.

3. Results

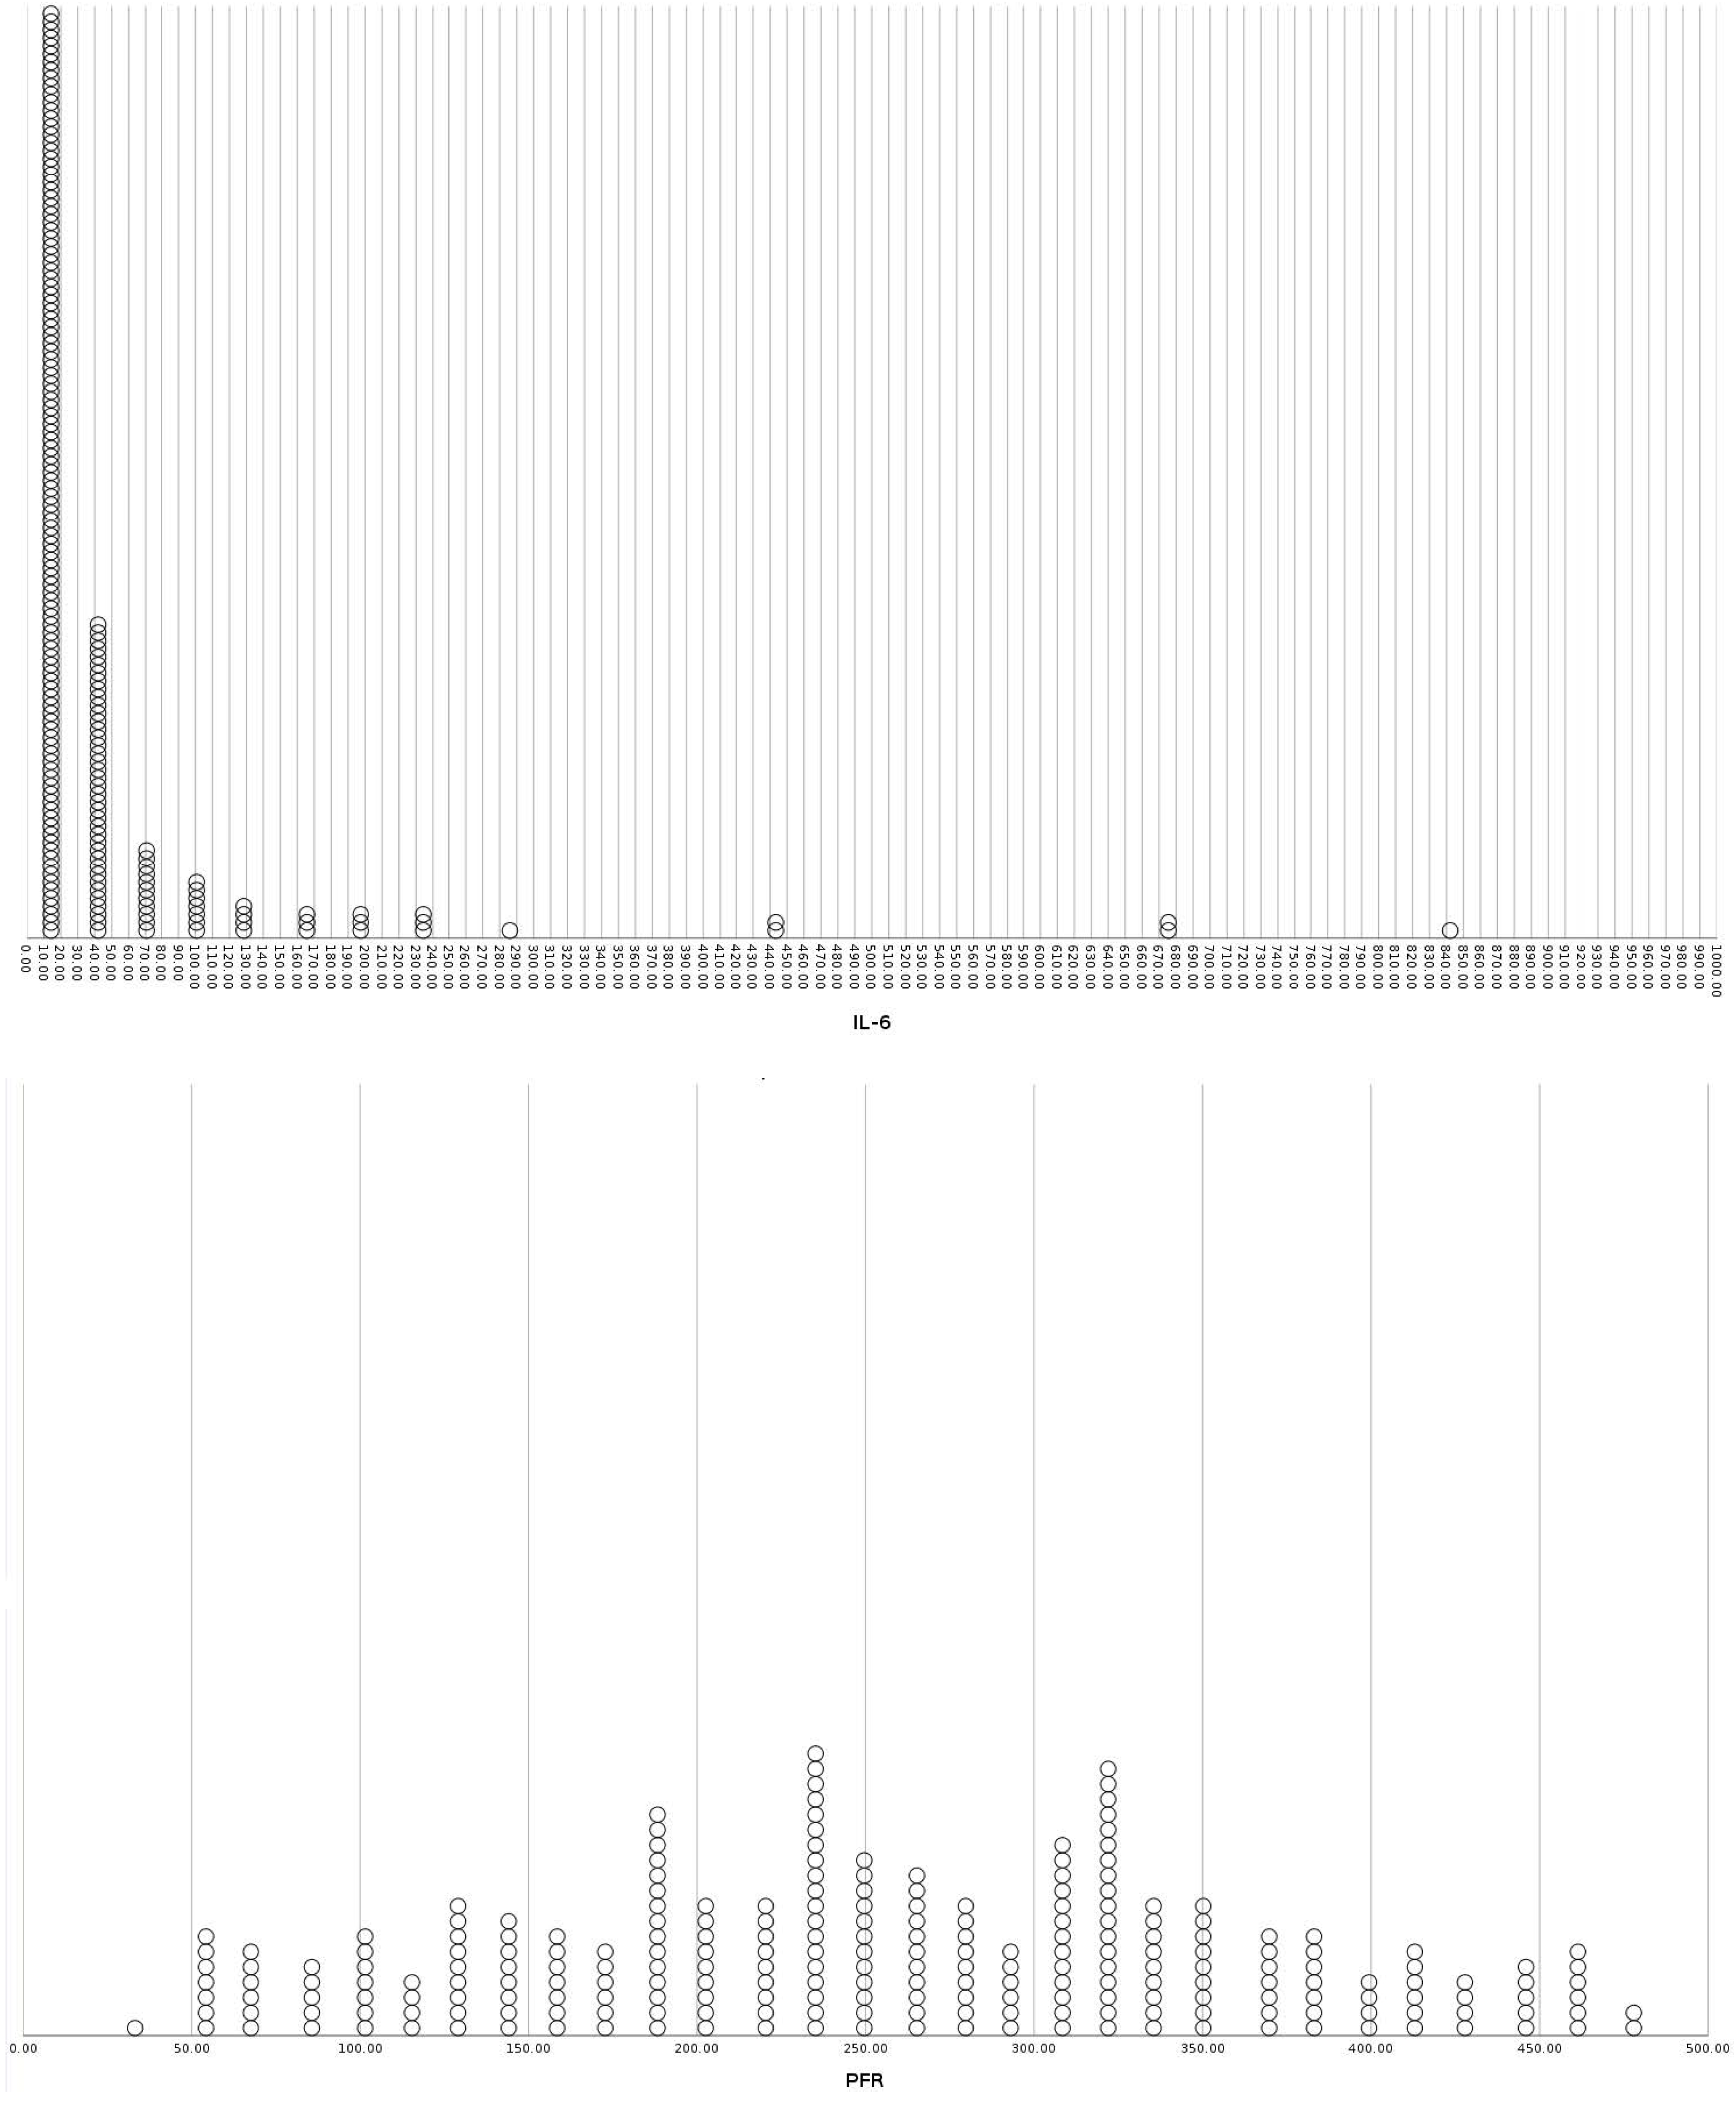
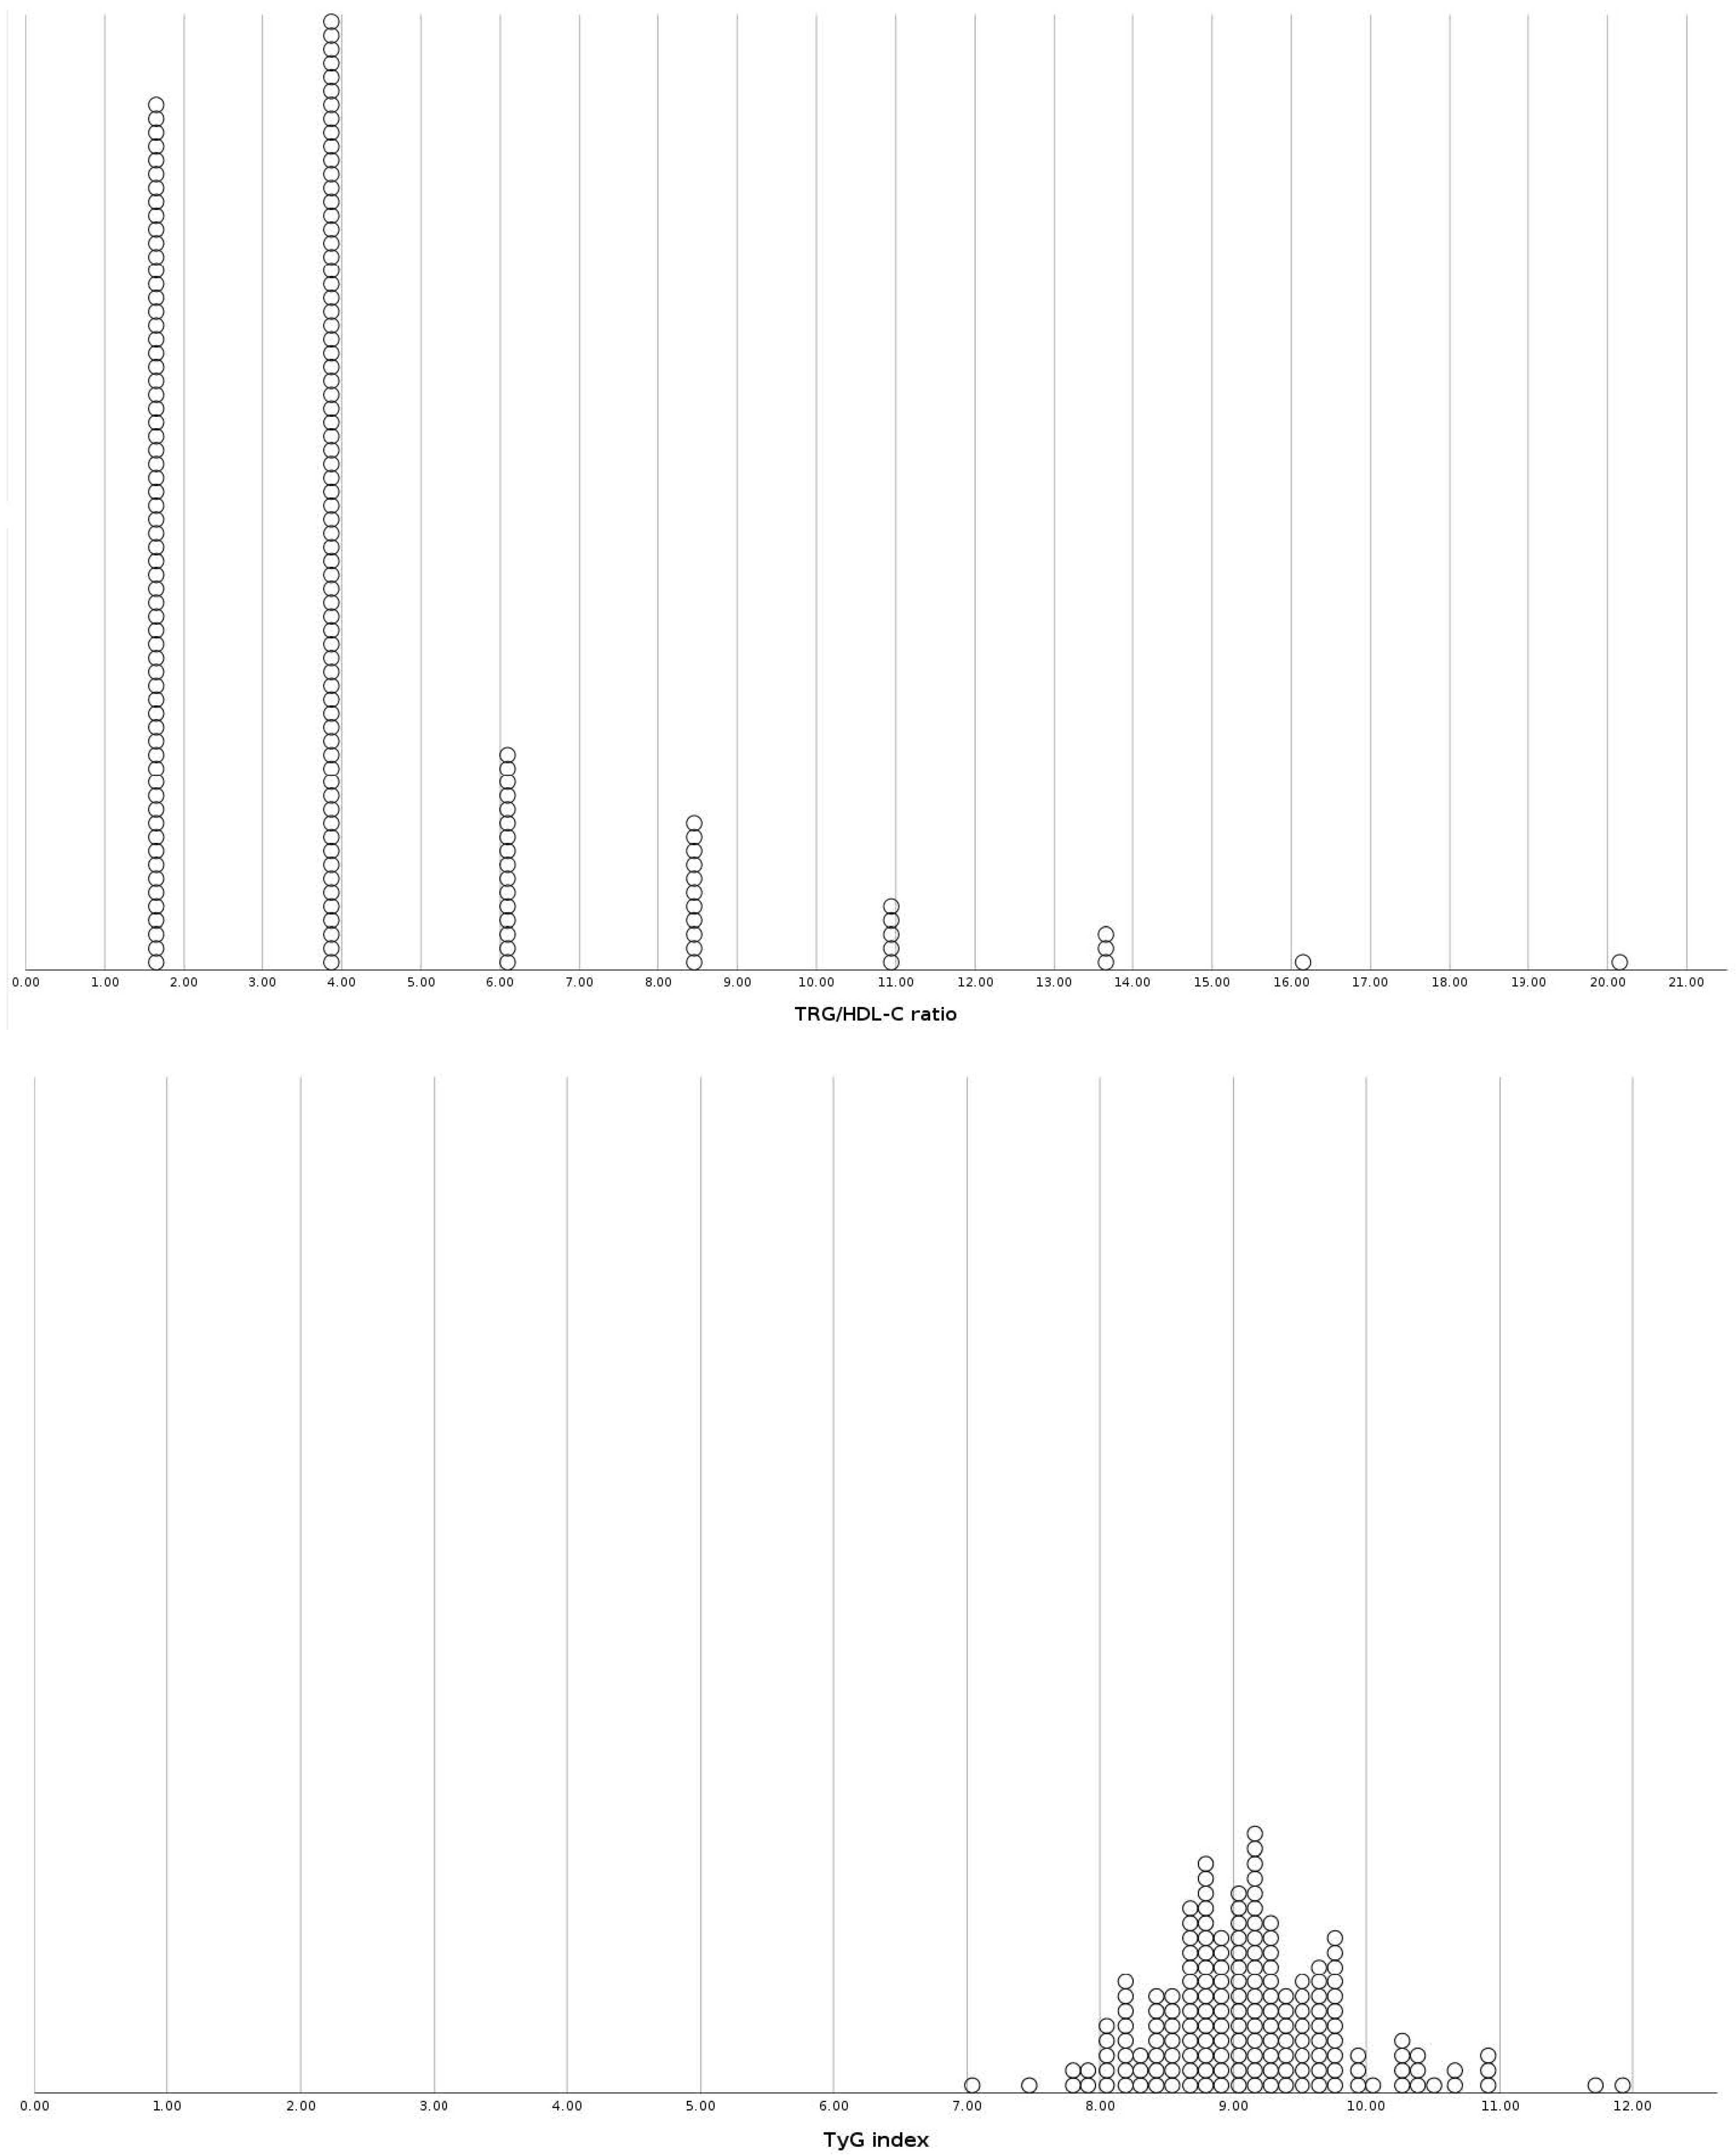
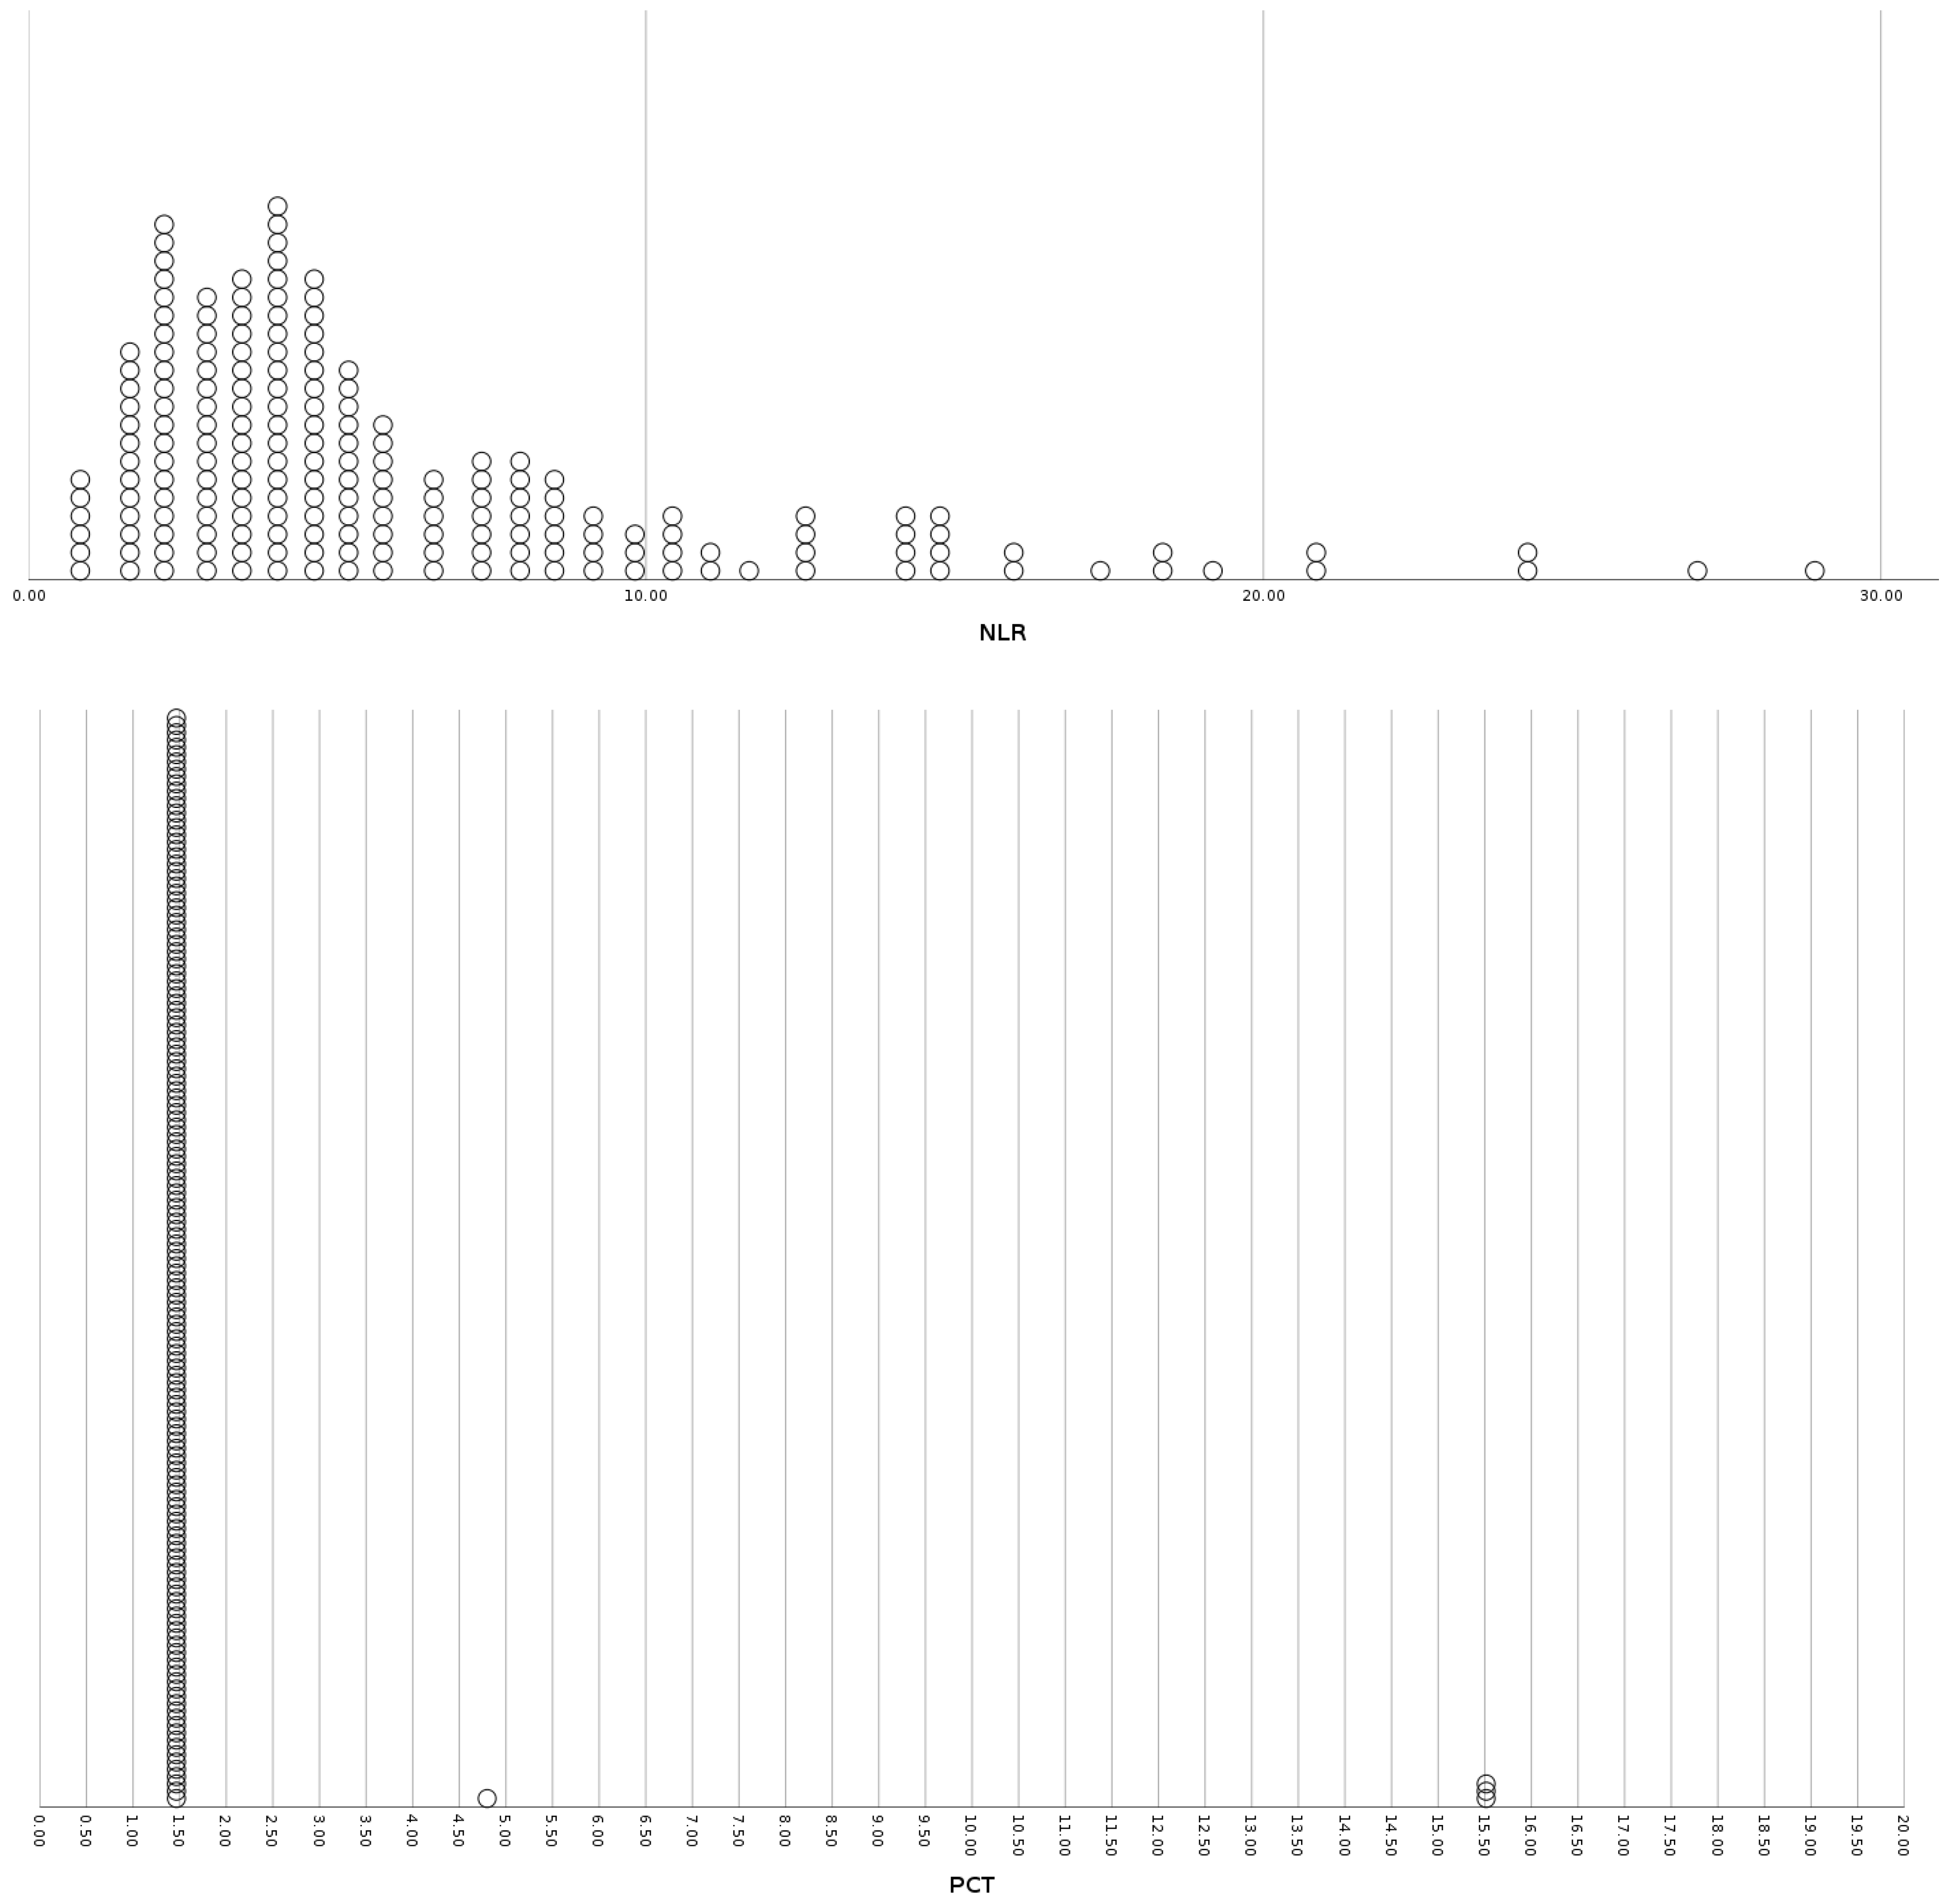
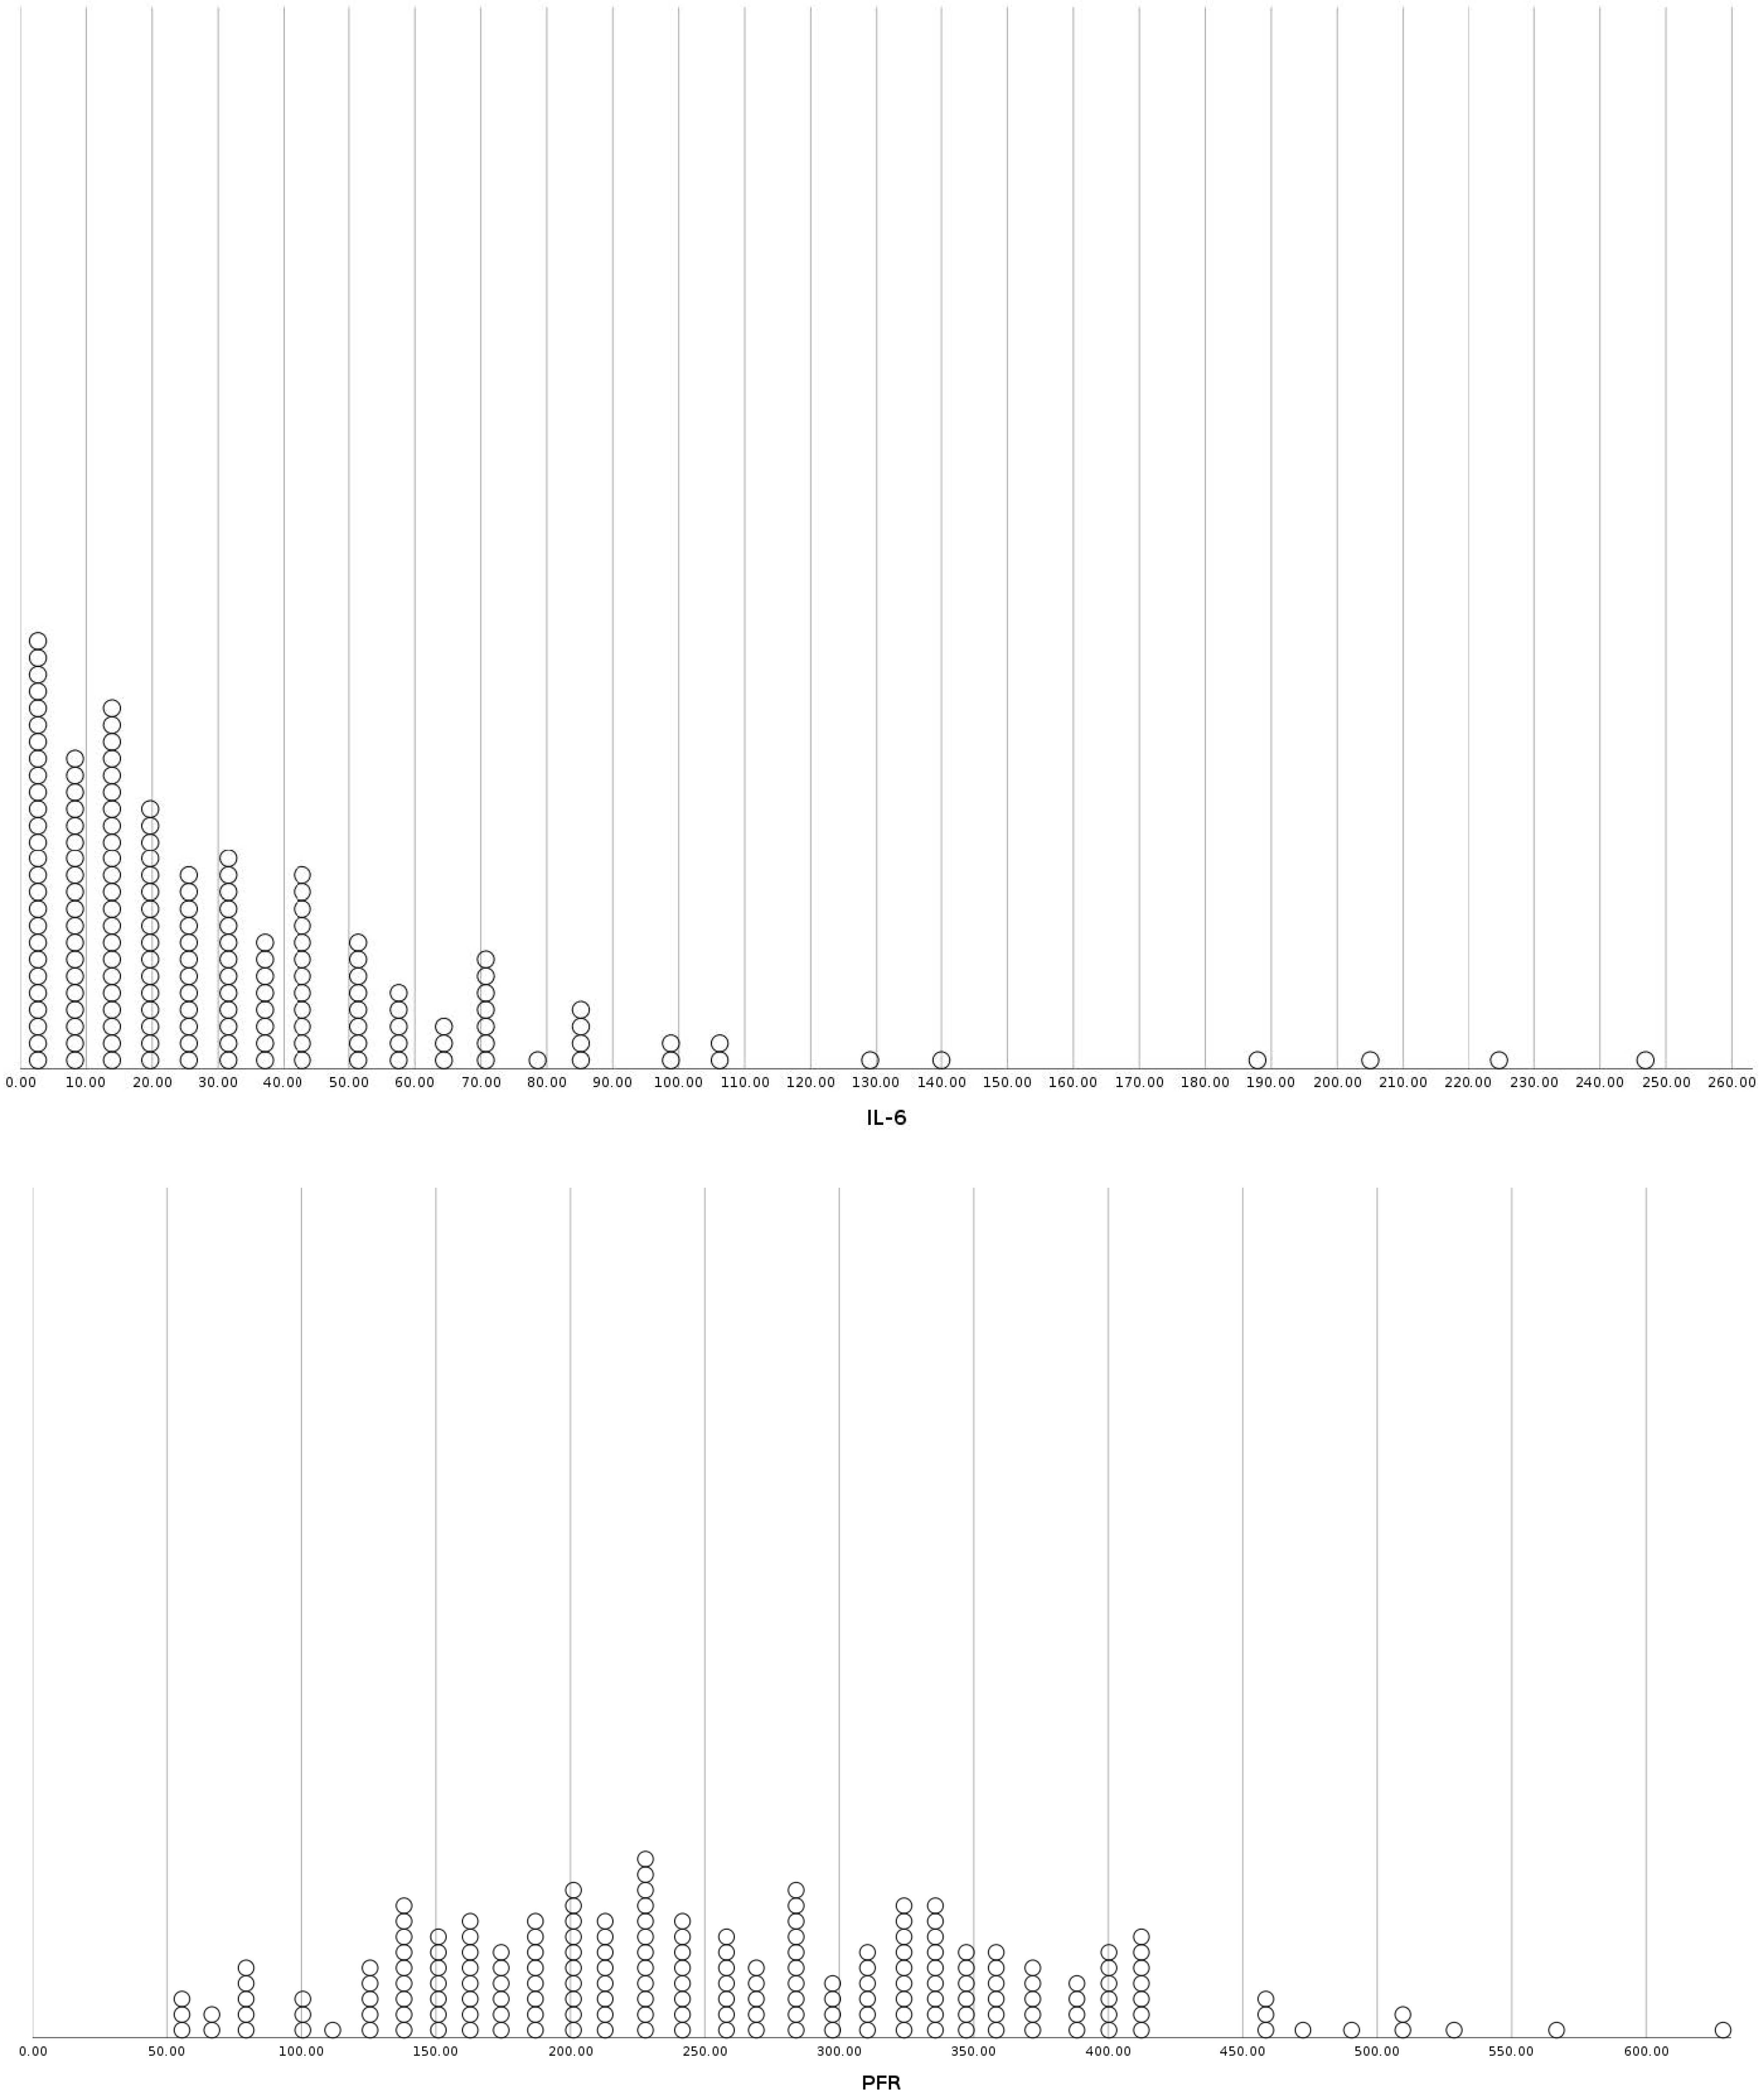
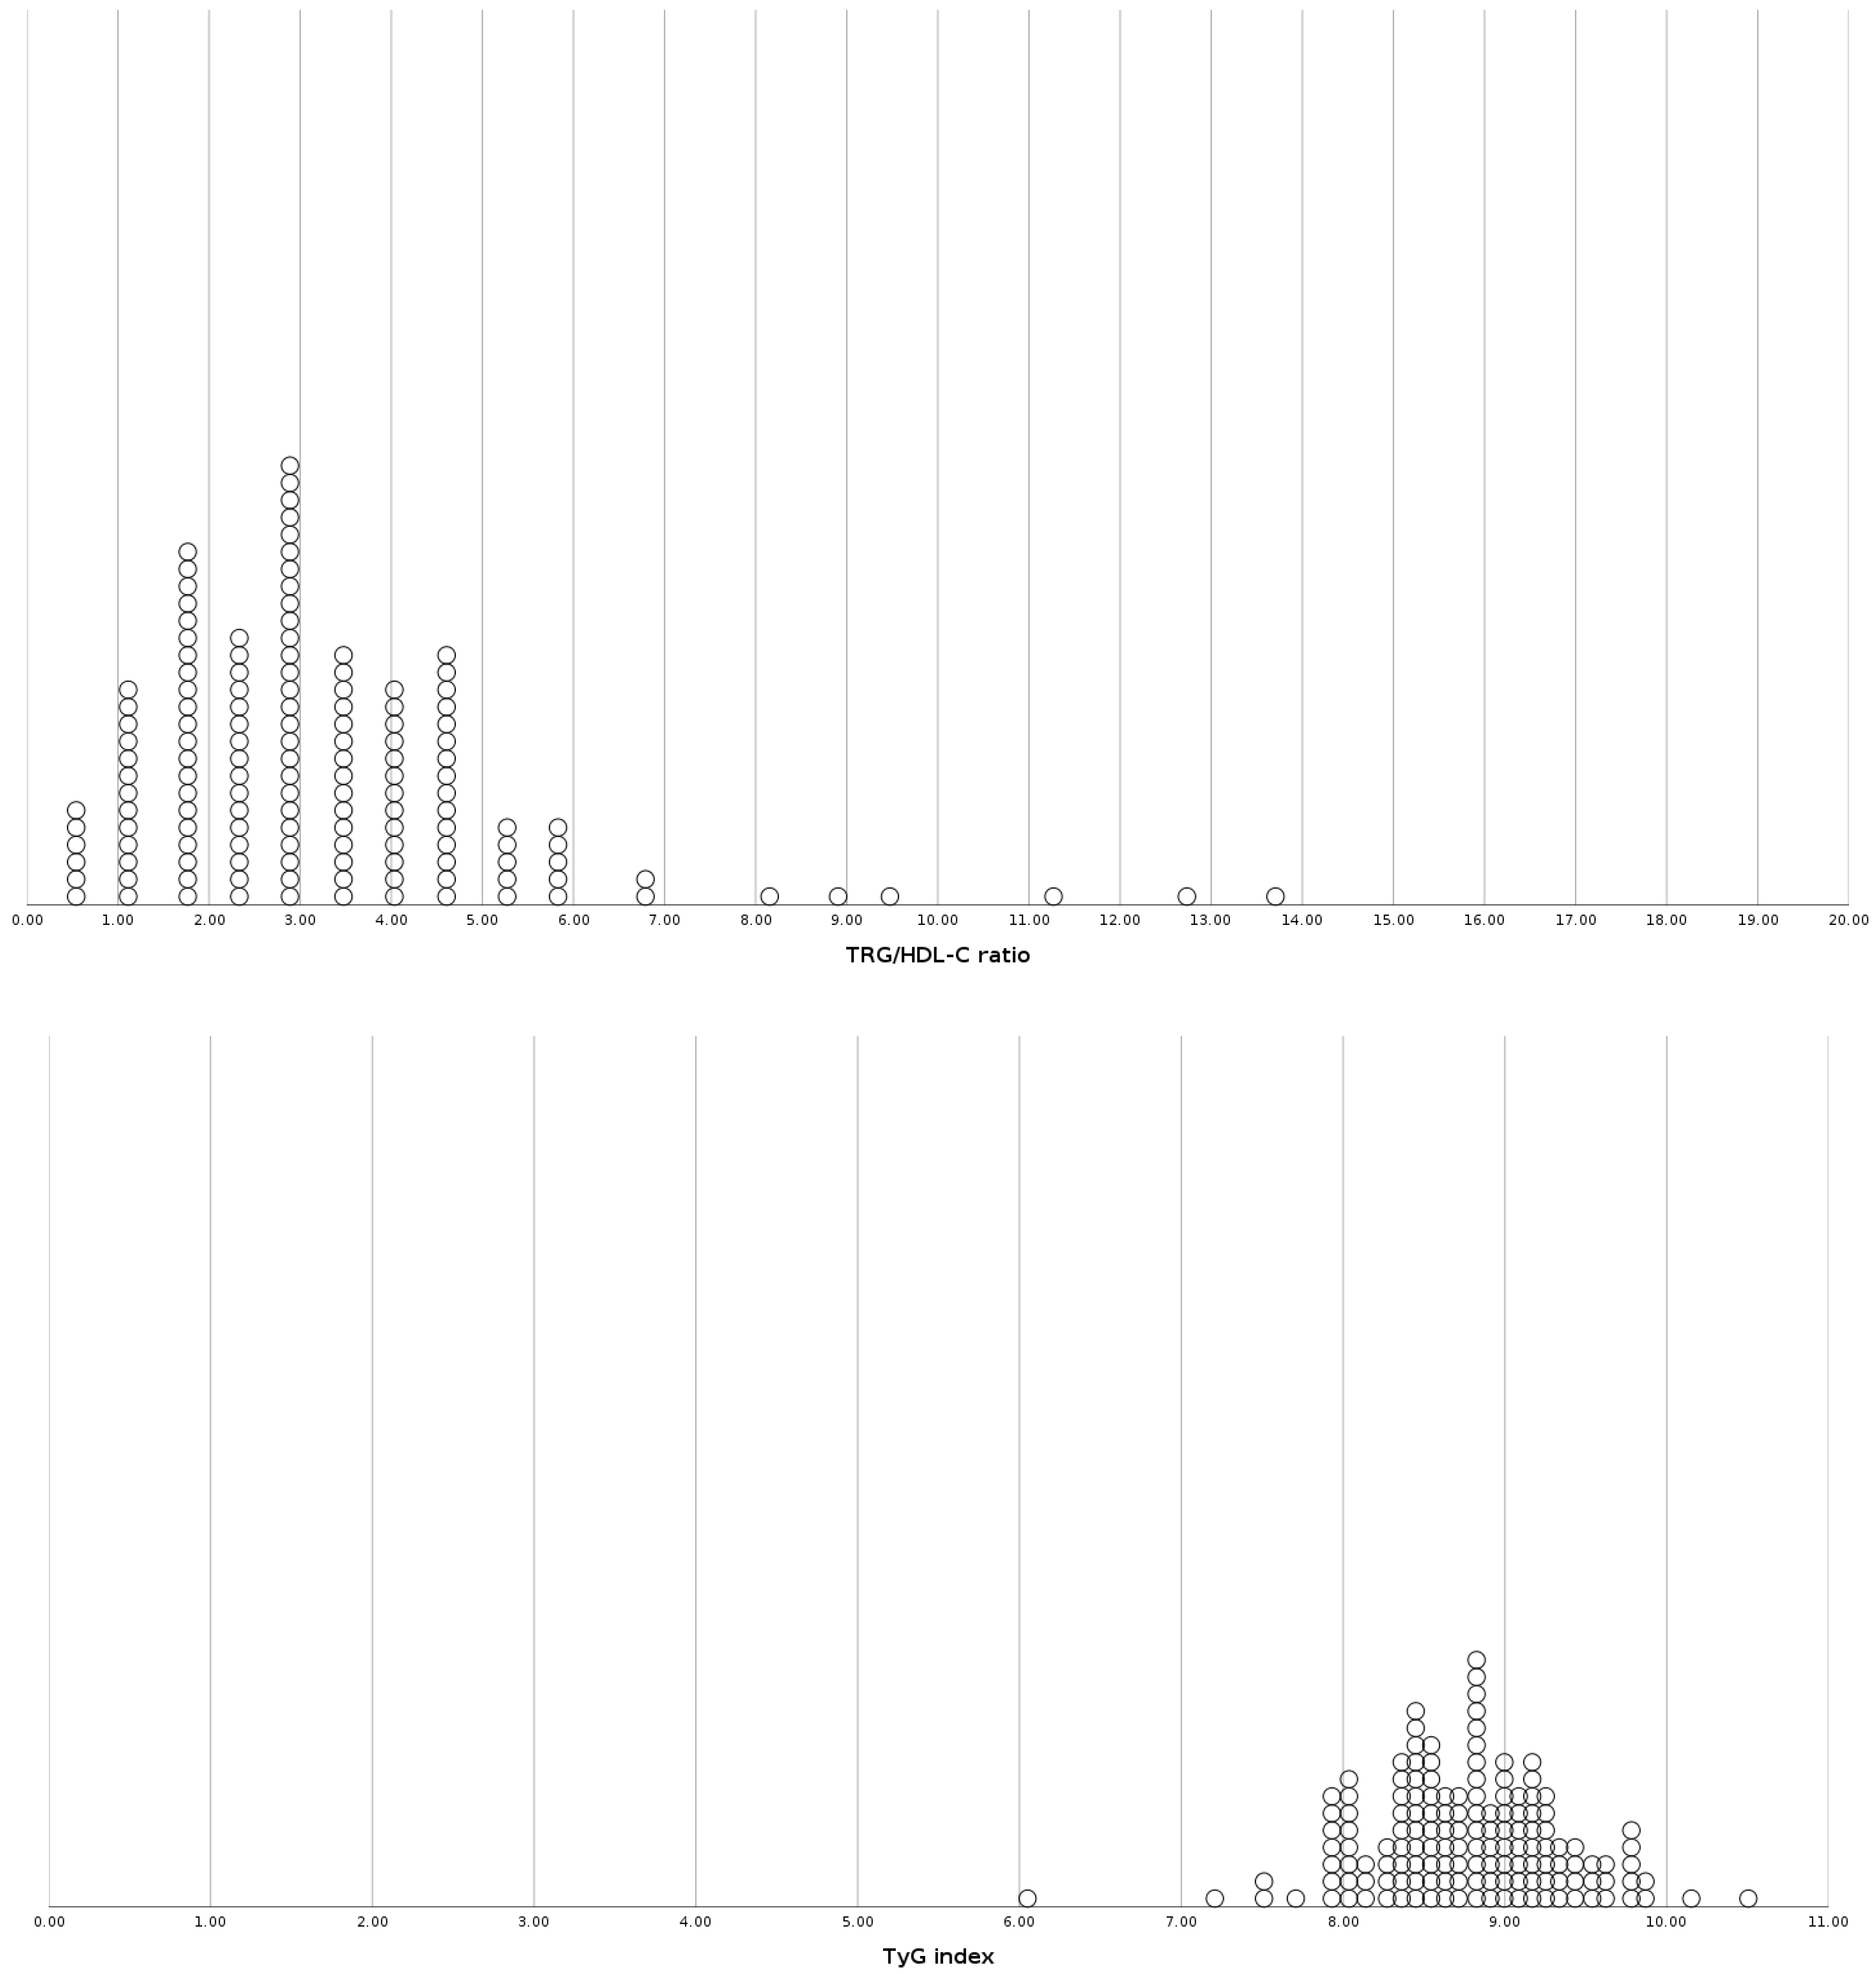
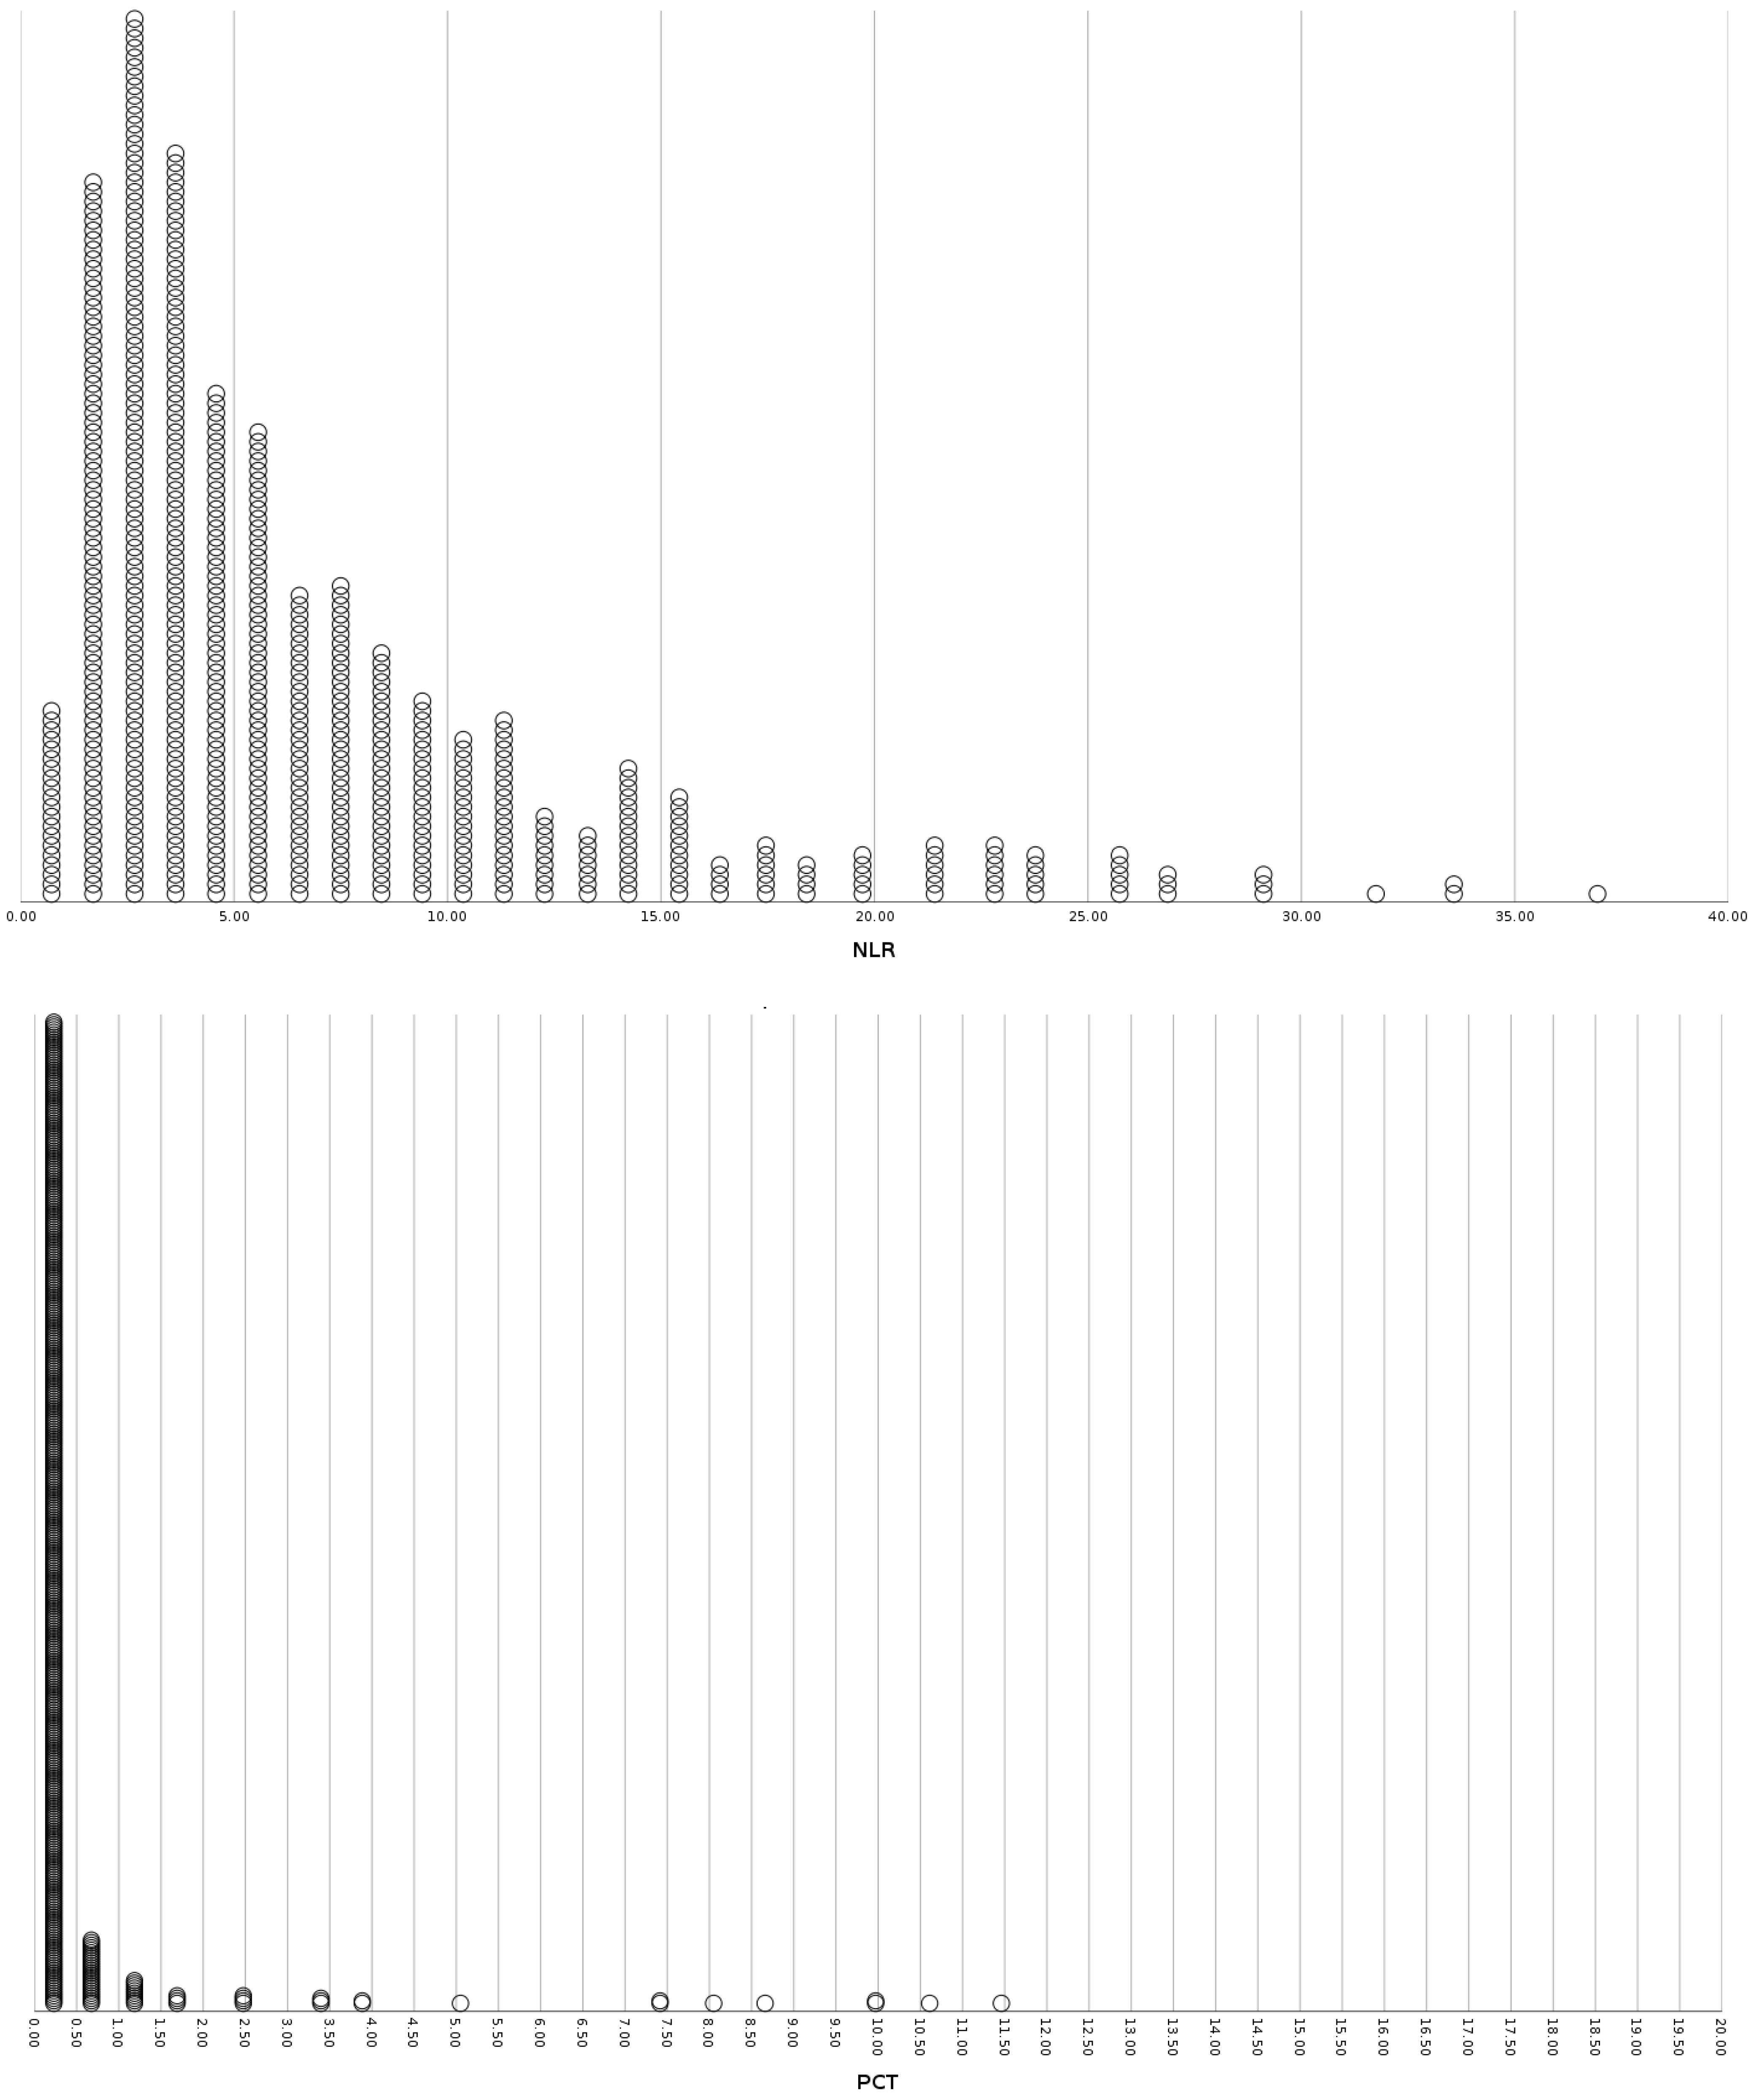
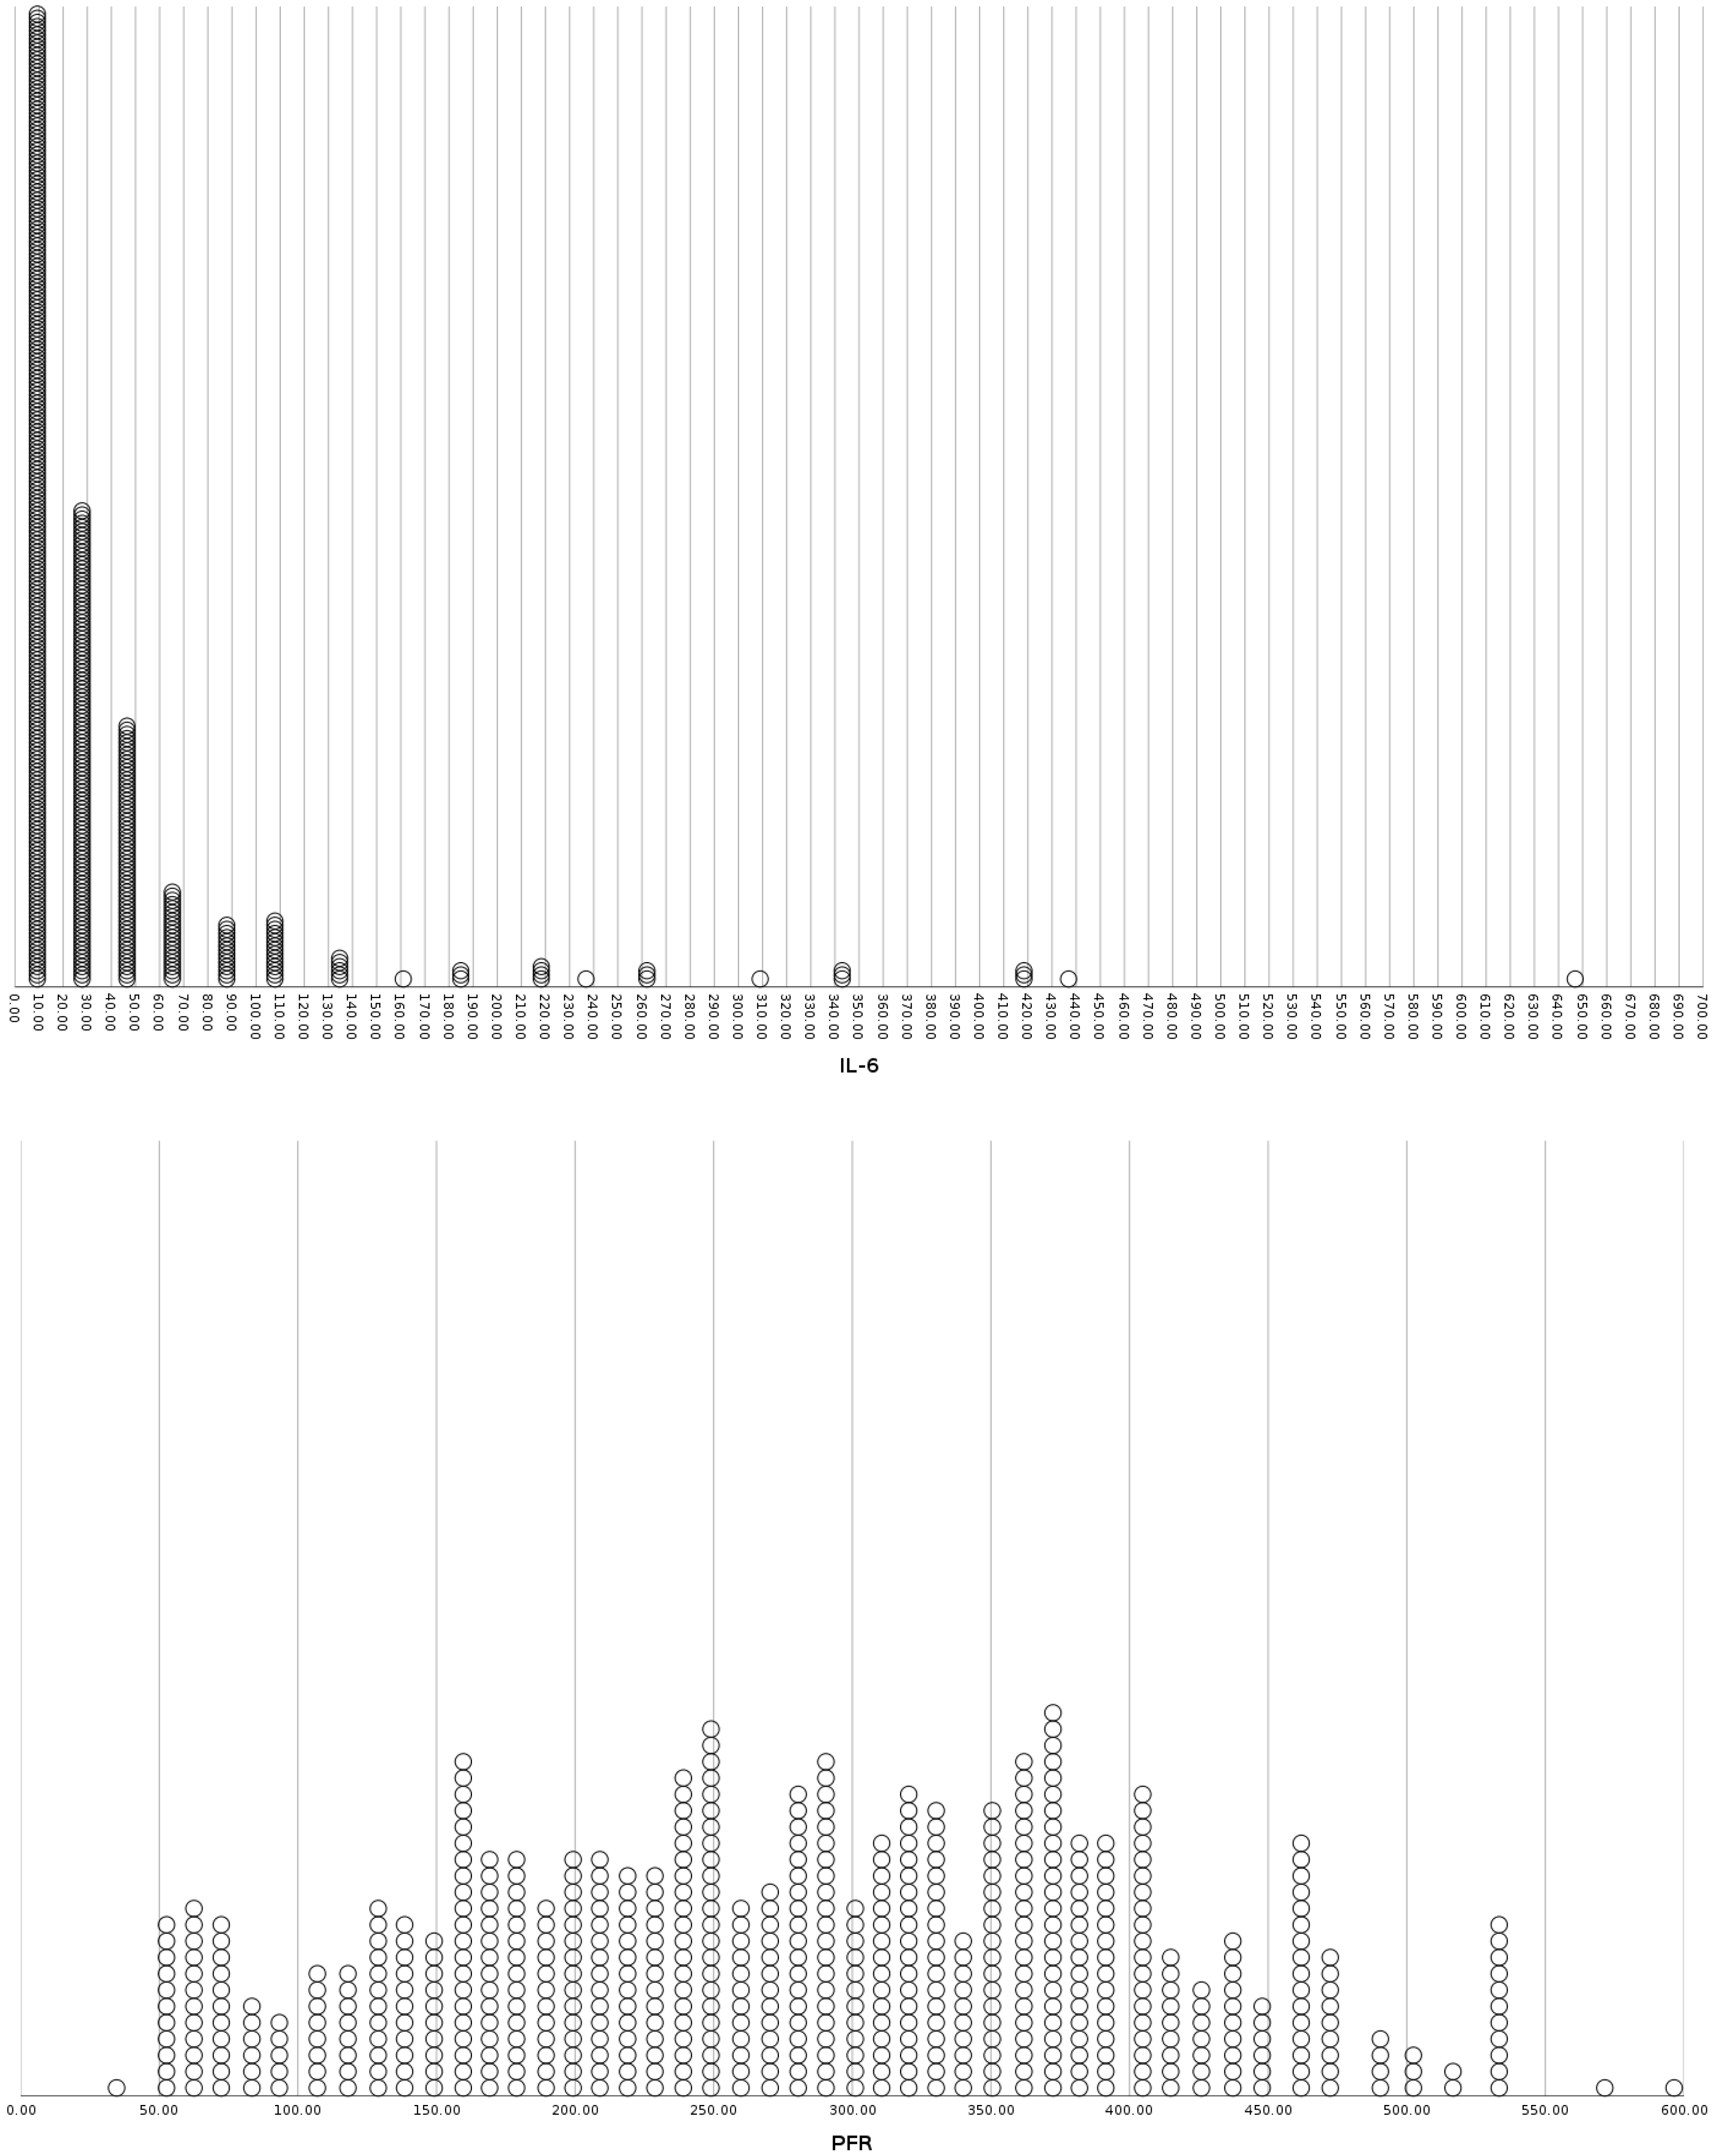
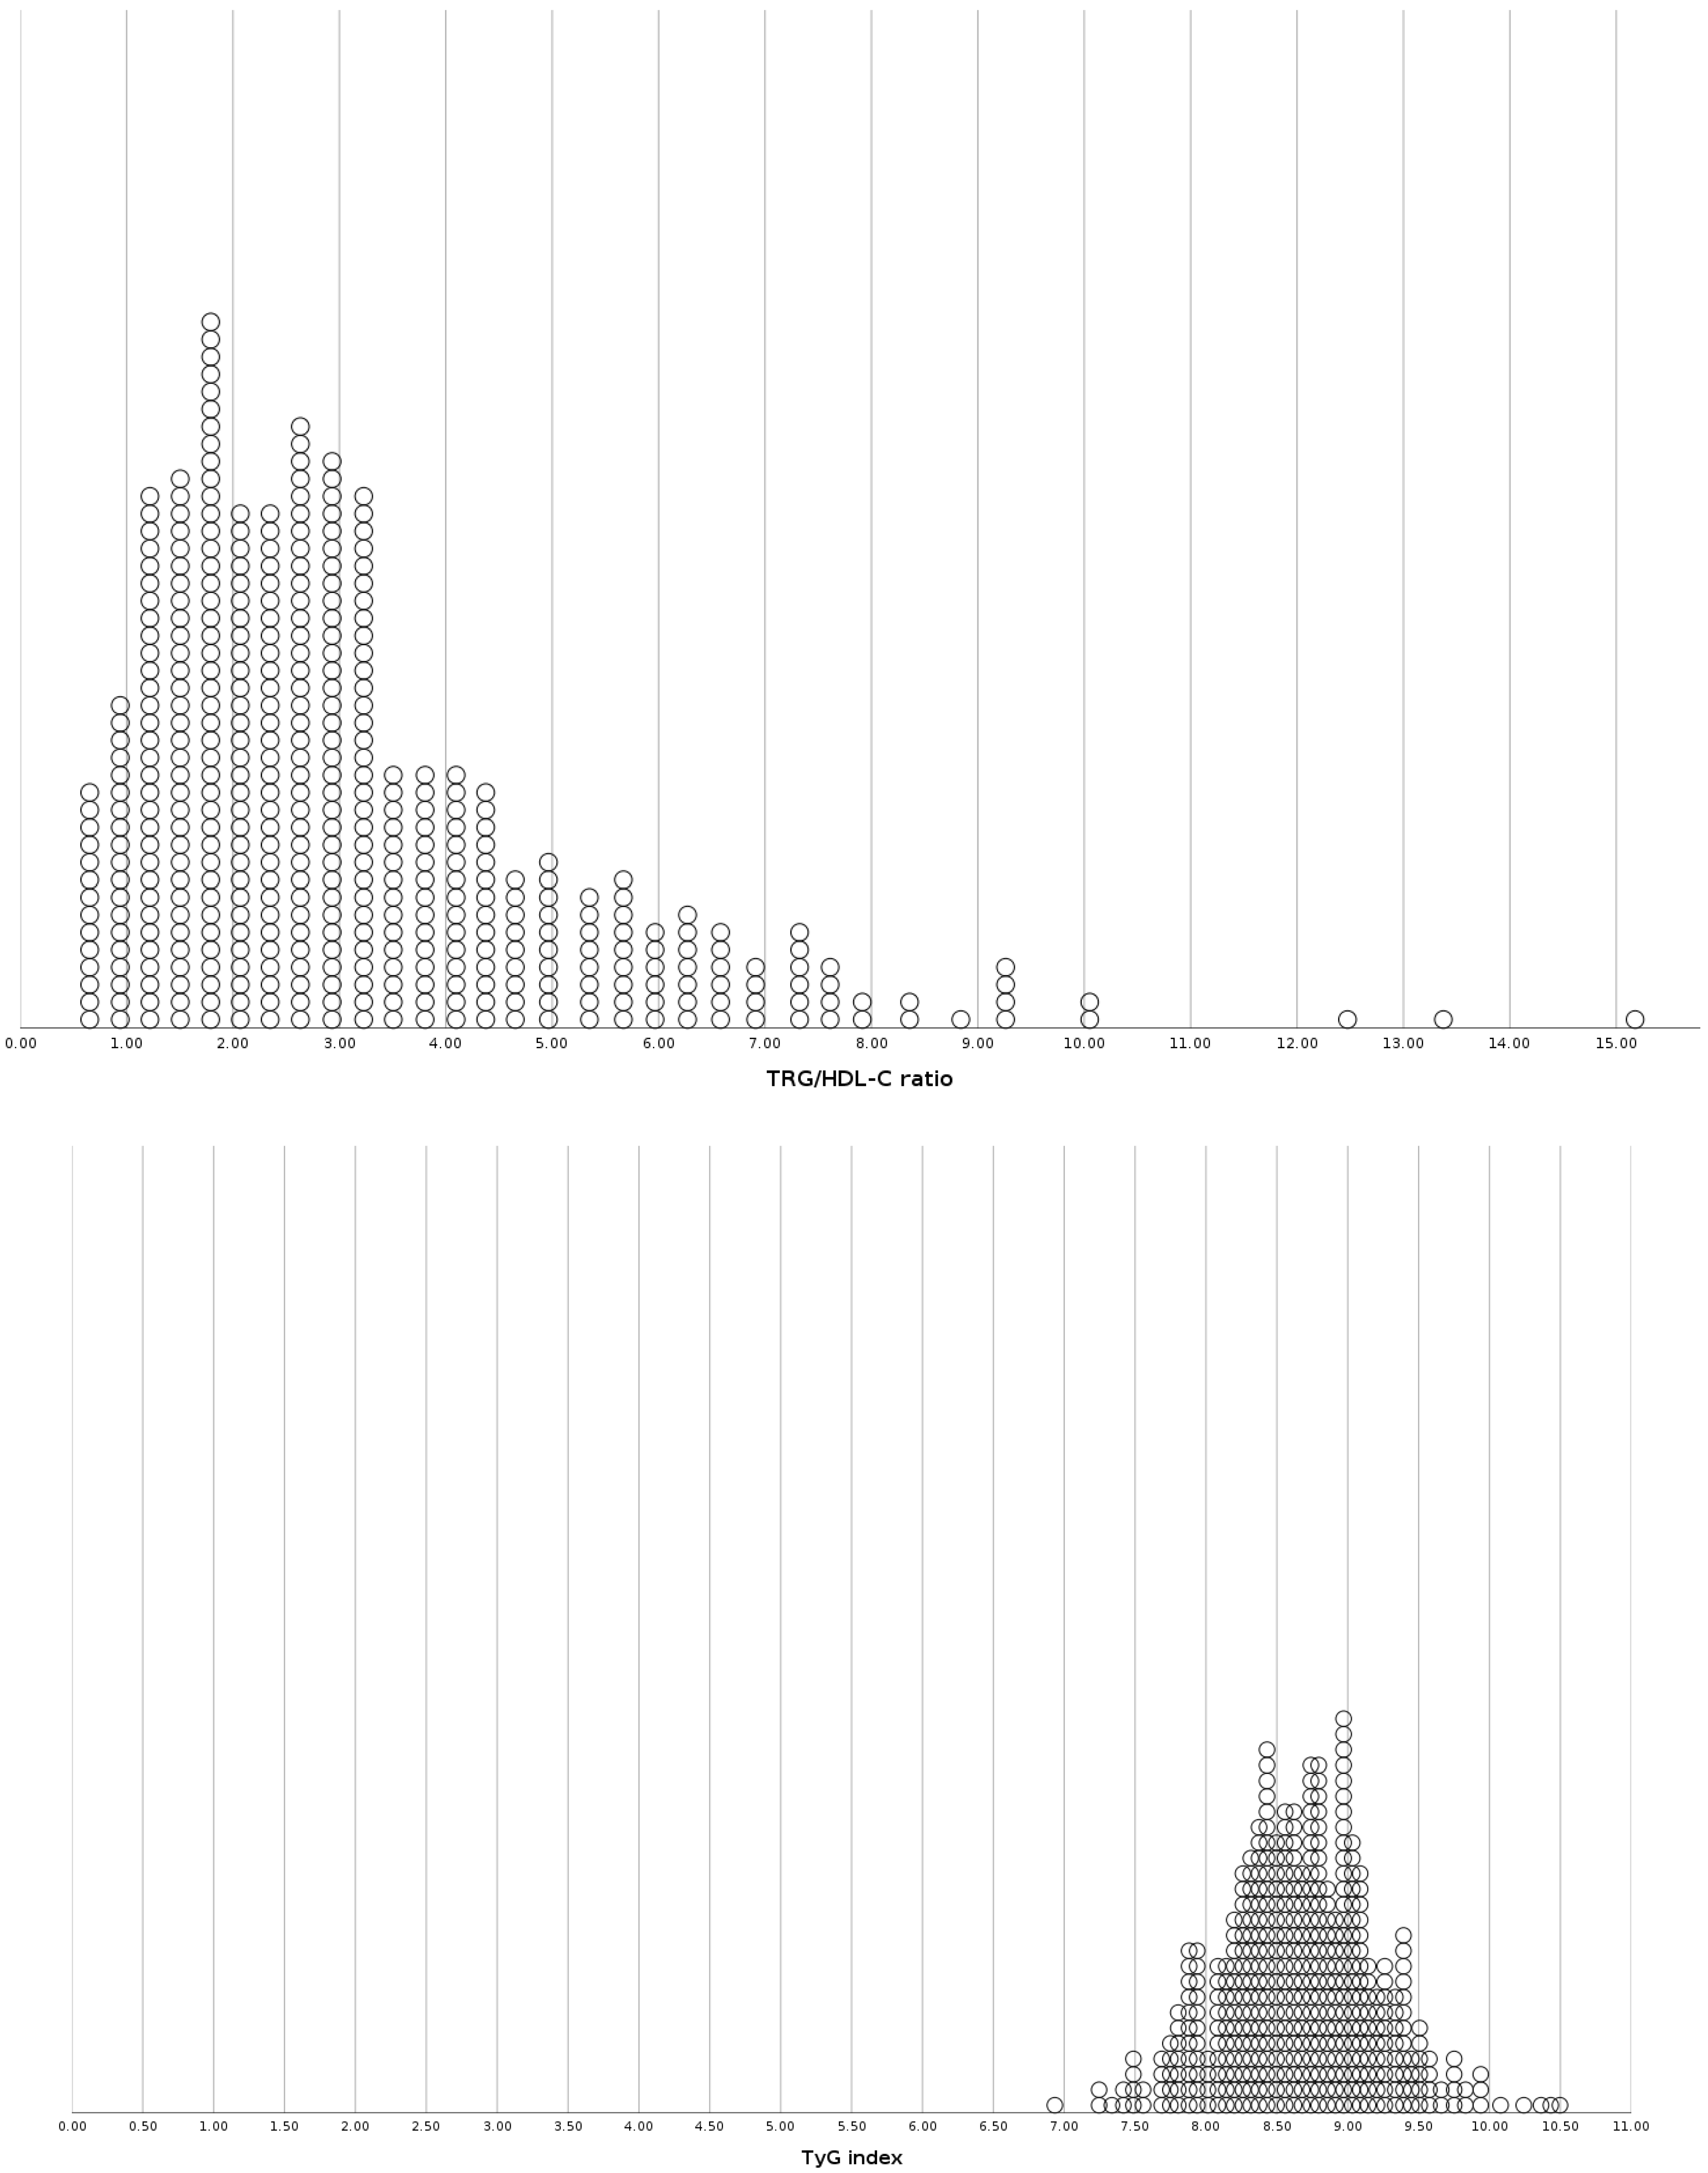
The studied population consisted of 1458 COVID-19 patients that were hospitalized at the University Hospital of Ioannina from March 2020 to December 2022. Table 1 summarizes the baseline demographic, somatometric characteristics, comorbidities, inflammatory markers, insulin resistance indices, disease severity markers, and outcomes. The multivariate binary logistic regression results for inflammatory markers, insulin resistance indices, disease severity markers, and outcomes for the diabetic, obese, and non-diabetic non-obese subgroups are presented in Table 2, Table 3 and Table 4, respectively. Table 5 displays the multivariate binary logistic regression results for inflammatory markers, insulin resistance indices, disease severity markers, and the incidence of hyperglycemia on admission and during hospitalization for each sub-group. Figure 1, Figure 2 and Figure 3 present distribution plots of inflammatory markers (NLR, PCT, IL-6), disease severity markers (PFR), and insulin resistance indices (TRG/HDL ratio, TyG index) for each sub-group of patients, respectively.

3.1. Patients with Diabetes

Demographic, somatometric baseline characteristics, comorbidities, inflammatory markers, insulin resistance indices, disease severity markers, and outcomes are summarized in Table 1. A total of 270 patients were diabetics and 165 of them were male. Patients’ mean age and BMI were 73.45 years and 25.54 kg/m2, respectively. The most frequent comorbidities in this subpopulation were arterial hypertension, dyslipidemia, and coronary artery disease. In the diabetic population, increased levels of CRP, IL-6, and CT BoD, as well as lower levels of PFR, were associated with a greater length of hospital stay (LoS). Also, hyperglycemia on admission and hospital-acquired hyperglycemia, as well as higher levels of TRG/HDL-C ratio and TyG index were associated with more extended hospitalization. Higher levels of CT BoD and lower levels of PFR were associated with a significantly higher incidence of intubation. Finally, elevated levels of IL-6, increased neutrophil to lymphocyte ratio (NLR), and decreased PFR were associated with a higher risk for death (Table 2 and Table 5).

3.2. Patients with Obesity

Table 1 summarizes baseline characteristics, comorbidities, inflammatory and insulin resistance markers, disease severity, and outcomes. The obese population consisted of 201 patients, 107 of which were male. Their mean age and BMI were 59.69 years and 34.24 kg/m2. The most frequent comorbidities in this subgroup were arterial hypertension, dyslipidemia, and thyroid disturbances. Lower levels of PFR were highly associated with longer hospitalization and higher rates of death, while increased CT BoD, NLR, and hyperglycemia during hospitalization were associated with a greater LoS. Increased levels of the TyG index were also associated with a higher risk for hyperglycemia on admission and during hospitalization (Table 3 and Table 5).

3.3. Patients without Diabetes or Obesity

Demographic, somatometric baseline characteristics, comorbidities, inflammatory markers, insulin resistance indices, disease severity markers, and outcomes are summarized in Table 1. There was a total of 631 COVID-19 patients without diabetes or obesity, 262 of which were female. The most frequent comorbidities were arterial hypertension, dyslipidemia, and coronary artery disease. Increased CT BoD, NLR, CRP, IL-6, PCT, insulin resistance indices, and hyperglycemia during hospitalization, as well as decreased PFR were associated with longer hospitalization. Also, hyperglycemia during hospitalization and increased levels of insulin resistance indices were associated with longer hospital stays. Similar results were noted for intubation and death. In addition to lower PFR, elevated levels of NLR, CRP, IL-6, and TyG index were highly associated with an increased incidence of hyperglycemia on admission. Similar associations were documented for increased levels of CRP and TyG index and hyperglycemia during hospitalization (Table 4 and Table 5).

4. Discussion

In this study, we assessed the association between inflammatory and disease severity markers, as well as insulin resistance indices and outcomes in patients with metabolic disorders, specifically, diabetes and obesity. We also investigated these associations in patients without diabetes or obesity. Additionally, we explored the association between inflammatory and disease severity markers, insulin resistance indices, and hyperglycemia on admission or during hospitalization for each patient sub-group.
Diabetes, which ranks seventh among the leading causes of mortality worldwide, is associated with vascular complications that have a significant impact on quality of life [29]. The clinical understanding of the link between diabetes and susceptibility to infection has been well-established for a long time [30]. Diabetes is a chronic inflammatory condition that affects both metabolic and vascular functions, and is therefore likely to contribute to an increased susceptibility to infection [31]. Elderly patients with type 2 diabetes are at an increased risk of severe complications from infections, including pneumonia and influenza [32]. Our study demonstrated that COVID-19 patients with diabetes had longer hospital stays when they exhibited elevated levels of CRP, IL-6, and CT BoD, as well as decreased PFR. Greater lung damage, as indicated by higher CT BoD and lower PFR, also increased the risk of intubation. Among diabetic patients, a higher risk of death was associated with elevated IL-6 and NLR levels, as well as decreased PFR.
There is mounting evidence indicating that SARS-CoV-2 worsens inflammation in patients with diabetes [31]. Diabetes is characterized by a chronic inflammatory state, leading to dysfunction of immune cells, such as inhibition of phagocytosis and neutrophil chemotaxis, which impairs the ability to counteract infectious organisms [33,34]. Diabetic patients frequently demonstrate compromised T cell-mediated immunity and delayed hypersensitivity [34]. Studies on COVID-19 patients suggest alterations in CD4 and CD8 cell counts, indicating apoptosis and lymphocytopenia [31]. Additionally, a recent analysis has shown that diabetics exhibit higher levels of ACE2 expression in lung cells, thus providing support for the hypothesis that SARS-CoV-2 has a higher affinity for infecting lung cells in these individuals [35]. This upregulation of ACE2 can increase viral binding and facilitate viral entry into host cells, resulting in severe lung damage [35]. Furthermore, an elevation in levels of proinflammatory cytokines such as IL-6, serum ferritin, and CRP was observed, with IL-6 serving as a reliable predictor of COVID-19 severity and progression [36,37,38]. The overproduction of cytokines, i.e., the cytokine storm, plays a crucial role in the progression of SARS-CoV-2 infection, leading to hyperinflammation and dysfunction of end-organs [39,40].
Notably, our study found that glycemic dysregulation either upon admission or during hospitalization, as well as elevated levels of TRG/HDL-C ratio and TyG index, were linked with prolonged hospital stay in the patient cohort. The latter ratios have been adopted by researchers as indices of insulin resistance resulting in imbalances of glucose metabolism [41,42,43]. Also, TyG index and TRG/HDL-C have been proposed as predictors of glycemic control in normoweight, overweight and obese patients with DM [44]. Similar to our findings, the positive association of these indices was also observed in a study (n = 65) of elderly diabetic population. In this cohort of patients elevated glucose levels were associated with a high TyG index andTRG/HDL-C ratio compared with glucose levels prior to SARS-CoV-2 infection [45]. TyG index and TRG/HDL-C ratio have been also proposed as prognostic factors of disease severity in COVID-19 patients. In a study of 1228 patients (diabetics and non-diabetics), it was shown that patients with severe disease exhibited significantly elevated levels of TyG index and TRG/HDL-C ratio (p < 0.05). On the other hand, survivors exhibited significantly lower TRG/HDL-C ratio and TyG index levels compared to non-survivors (p < 0.05). Investigators also found that the TyG index and TRG/HDL-C ratio were significant predictors of severity (OR = 1.42 and OR = 1.06, respectively). Similarly, these indices were associated with COVID-19 mortality (TRG/HDL-C ratio: OR = 1.12, TyG index: OR = 1.52, respectively) [43].
Hyperglycemia is a significant predictor of increased severity and mortality in individuals infected with H1N1, SARS-CoV, and MERS-CoV. However, studies showed conflicting results regarding the impact of hyperglycemia in individuals infected with SARS-CoV-2 [46,47,48,49]. SARS-CoV-2 infection may complicate diabetes by increasing glucose levels, resulting in oxidative stress and inflammation. Viral binding to ACE2 on acinar cells results in tissue damage and inhibition of lymphocyte proliferation due to hyperglycemia [31]. SARS-CoV-2 infection in diabetics induces elevated stress and glucose levels through the release of glucocorticoids and catecholamines [50]. The latter have been found to hinder immune function, thus heighten susceptibility to infections [31]. As observed in other viral infections, hyperglycemia facilitates viral replication and augment viral load resulting in tissue damage [51,52,53]. Moreover, hyperglycemia has been found to suppress antiviral immune response, as demonstrated in previous studies of influenza infection. This suppression can lead to pulmonary dysfunction and fatal outcomes in DM [33]. In addition, delayed clearance of SARS-CoV-2 observed in these patients may exacerbate the severity and progression of COVID-19. Overall, studies indicate that patients with diabetes experience a more severe form of COVID-19 owing to heightened inflammation. This is due to several factors, including increased levels of ACE2, reduced T cell function or lymphocytopenia, hyperinflammation or cytokine storm, impaired monocyte/macrophage function, increased coagulation, and delayed viral clearance [31].
Of note, it has been shown that hyperglycemia on admission is associated with worse outcomes in COVID-19. In a study of 11,312 patients, elevated glucose were associated with significantly higher mortality rates compared to normoglycemia (p < 0.001), regardless of pre-existing diabetes. Hyperglycemia was found to be an independent risk factor of mortality (glucose levels > 180 mg/dL: HR 1.50, 140–180 mg/dLQ HR 1.48). Hyperglycemia was also associated with increased risk of intubation and intensive care unit (ICU) admission and mortality (glucose levels > 180 mg/dL: OR 2.02, p < 0.001, 140–180 mg/dL: OR 1.70, p < 0.001 compared to glucose levels < 140 mg/dL) [54]. The positive association of admission hyperglycemia and worse outcomes in COVID-19 was confirmed by other studies. In the study by Wang et al., (n = 695) elevated glucose levels > 126 mg/dL on admission was an independent risk factor for 28-day mortality in patients without known DM [55]. Furthermore, in the study by Wu et al., (n = 2041), elevated glucose levels (≥110 mg/dL) on admission were an independent risk factor for critical disease (ICU admission, mechanical ventilation, hemodynamic instability) or death (OR 1.30, p = 0.026). Higher glucose levels in critical patients were also associated with higher in-hospital mortality (OR 2.39, p = 0.001) [56]. Similar to these, in our study admission hyperglycemia (glucose levels > 140 mg/dL) was associated with worse outcomes of COVID-19 disease. Across all three sub-groups of patients, hyperglycemia on admission was associated with longer hospital stay. Hyperglycemia has been also associated with higher levels of inflammatory markers. In the study by Geetha et al., (n = 520) inflammatory markers (i.e., CRP, ferritin, d-dimers) were higher in patients with hyperglycemia compared to those with normal glucose levels [57]. Similarly, mortality rate and length of stay was higher in the hyperglycemic group [57]. Our study shares similar results. Elevated inflammatory markers were associated with a higher risk of hyperglycemia and concomitant worse prognosis.
Notably, SARS-CoV-2 infection can cause temporary hyperglycemia in healthy individuals, similar to what was observed in SARS-CoV-1 infection [37,58]. Specifically, hyperglycemia and new-onset DM have been previously reported in hospitalized patients with COVID-19 [11]. Similarly, during the COVID-19 pandemic, it has been suggested that the patients without a pre-existing history of DM have an increased risk of developing the disease [59].
Stress hyperglycemia has been linked to relative insulin deficiency and elevated levels of circulating free fatty acids, which are commonly observed in acute illnesses sush as severe infections or myocardial infarction [11,60]. Stress-induced hyperglycemia appears to have a more negative impact on the prognosis of non-diabetic COVID-19 hospitalized patients compared to diabetics. Also, stress-induced hyperglycemia is a more reliable prognostic marker for COVID-19 patients than their glycemic status prior to hospitalization [61,62]. SARS-CoV-2 induced cytokine storm is a highly inflammatory and prothrombotic condition that can affect pancreatic β-cells both directly and indirectly [11]. Infection of β-cells in COVID-19 patients results in reduced insulin levels and secretion, as well as cell apoptosis. Viral entry results to pancreatic endocrine dysfunction characterized by reduced insulin secretion in response to glucose and triggers the self-destruction mechanism of insulin-producing cells (through kinase pathways) [9,11]. Thus, the cytokine storm in COVID-19 may exacerbate stress hyperglycemia as acute inflammation may further worsen insulin resistance [11,63]. Among these pathways, it has also been proposed that SARS-CoV-2 infection may initiate an autoimmune response targeting β-cells [9,64,65]. Last, microvascular dysfunction is a probable cause of hyperglycemia in COVID-19 patients as it may hinder glucose disposal. This relationship between microvascular function and glycemic control is reciprocal and well established [66].
Obesity is an identified risk factor for both susceptibility and severity of COVID-19 disease. Studies have demonstrated that severe obesity (BMI  >  40 kg/m2) is linked to higher rates of hospitalization, critical care admission, and fatalities during past viral pandemics [21]. Obesity serves as an independent risk factor for severe COVID-19, and recent research indicates that visceral obesity may also increase the likelihood of complications [67]. Recent analysis showed that correlation between COVID-19 mortality and obesity burden in a country’s adult population remains strong [6]. In the group of patients with obesity, respiratory failure as evidenced by lower PFR were strongly associated with longer hospitalization and higher rates of death, while increased CT BoD, NLR, and hyperglycemia during hospitalization were associated with longer hospitalization. Obesity is an established risk factor for DM that is linked to insulin resistance [68]. Obese individuals release elevated levels of non-esterified fatty acids, glycerol, hormones, and pro-inflammatory cytokines from adipose tissue, which may contribute to the onset of insulin resistance [68]. As it has already been demonstrated [41,42,43,44,45], increased TyG index was also associated with a higher risk for hyperglycemia on admission and during hospitalization. This is in accordance with a study by Chen et al., where COVID-19 patients without pre-existent DM, presented insulin resistance upon hospital admission t, as indicated by the increased TyG index levels [69], demonstrating that SARS-CoV-2 infection predisposes to insulin resistance even in non-diabetic patients [69].
One interesting correlation stemming from our study and requiring further exploration, is between NLR and hyperglycemia. NLR was associated with hyperglycemia on admission in all three sub-groups in our cohort. NLR is a novel inflammatory marker indicative of a significant inflammatory burden in specific diseases [70]. It has been shown that elevated NLR levels may suggest impaired glucose metabolism and can serve as an additional marker of glycemic control level, in individuals with type 2 DM [70]. In a study of 271 patients, participants were allocated to three groups based on admission glycemic status. In the first group patients had glucose levels < 140 mg/dL (normoglycemic, NG) and the second group included patients with known DM [71]. Patients in the third group (hyperglycemic, HG) had no prior history of DM and glucose levels ≥ 140 mg/dL. Data analysis showed that neutrophil count was higher, whereas lymphocyte count and PaO2/FiO2 were lower in HG than in DM and NG patients. DM and HG patients had higher D-dimer and worse inflammatory profile. Mortality was greater in HG (39.4% vs. 16.8%; unadjusted hazard ratio [HR] 2.20, 95% CI 1.27–3.81, p = 0.005) than in NG (16.8%) and marginally so in DM (28.6%; 1.73, 0.92–3.25, p = 0.086) patients. Upon multiple adjustments, only HG remained an independent predictor (HR 1.80, 95% CI 1.03–3.15, p = 0.04) [71].
As it has already been demonstrated during the pandemic, in large population studies, severe lung damage and respiratory failure, as well as excessive inflammation, is linked to longer hospital stay and worse outcomes [38,72,73,74,75,76,77], which is in concordance with our results. Our study revealed that glycemic dysregulation on admission or during hospitalization, as well as higher levels of TRG/HDL-C ratio and TyG index, were associated with prolonged hospital stay. Notably, insulin resistance indices and hyperglycemia during hospitalization were linked to extended hospitalization in non-diabetic non-obese patients as well. Hyperglycemia on admission was correlated with a lower PFR, elevated levels of NLR, CRP, IL-6, and TyG index, while hyperglycemia during hospitalization was associated with increased levels of CRP and TyG index. It is worth noting that corticosteroid use did not affect this association, as all hospitalized patients requiring supplementary oxygen were receiving corticosteroids, and this variable was included in the regression analysis.
However, the precise impact of the virus on insulin secretion and glycemic control, as well as the correlation between glucose variability and SARS-CoV-2 virulence, are still uncertain.

5. Conclusions

In our study, elevated levels of inflammatory markers, respiratory failure, and COVID-19-associated lung injury were associated with a higher incidence of hyperglycemia in patients with diabetes and obesity, but also those without either disease. Similarly, across all groups, hyperglycemia was associated with longer hospital stays, and glycemic dysregulation increased the risk of worse outcomes. Finally, it was observed that insulin resistance assessed by novel markers serves as a strong predictor of both worse regulation of glucose levels and disease outcomes in COVID-19 patients.

Author Contributions

Conceptualization, A.L., D.B., H.M. and E.C.; methodology, A.L., D.B. and E.C.; investigation and data collection, A.L., D.B., C.P., N.-G.K., M.N., E.P., I.T., L.A., V.S., R.K., I.V. and A.P.; statistical analysis, D.B. and A.L.; writing—original draft preparation, A.L., D.B. and A.K.; writing—review and editing, A.L., D.B., R.M., A.K., H.M. and E.C.; supervision, H.M. and E.C.; project administration, H.M. and E.C.; All authors have read and agreed to the published version of the manuscript.

Funding

This research received no external funding.

Institutional Review Board Statement

The study was conducted in accordance with the Declaration of Helsinki and approved by the Institutional Ethics Committee of the University Hospital of Ioannina as a retrospective cohort study on hospitalized COVID-19 patients (Protocol Number: 5/11-03-2021 (issue:3)/The University Hospital of Ioannina COVID-19 Registry, NCT05534074).

Informed Consent Statement

Informed consent was obtained from all subjects involved in the study.

Data Availability Statement

Data sharing is not applicable to this article.

Conflicts of Interest

The authors declare no conflict of interest.

References

  1. WHO. Coronavirus (COVID-19) Dashboard. Available online: https://covid19.who.int/ (accessed on 24 April 2023).
  2. Manique, I.; Abegão Matias, A.; Bouça, B. Does the Hyperglycemia Impact on COVID-19 Outcomes Depend upon the Presence of Diabetes?—An Observational Study. Metabolites 2022, 12, 1116. [Google Scholar] [CrossRef] [PubMed]
  3. Singh, A.K.; Gillies, C.L. Prevalence of co-morbidities and their association with mortality in patients with COVID-19: A systematic review and meta-analysis. Diabetes Obes. Metab. 2020, 22, 1915–1924. [Google Scholar] [CrossRef] [PubMed]
  4. Reiterer, M.; Rajan, M.; Gomez-Banoy, N.; Lau, J.D.; Gomez-Escobar, L.G.; Ma, L.; Gilani, A.; Alvarez-Mulett, S.; Sholle, E.T.; Chandar, V.; et al. Hyperglycemia in acute COVID-19 is characterized by insulin resistance and adipose tissue infectivity by SARS-CoV-2. Cell Metab. 2021, 33, 2174–2188.e5. [Google Scholar] [CrossRef]
  5. Dissanayake, H. COVID-19 and metabolic syndrome. Best Pract. Research. Clin. Endocrinol. Metab. 2023, 101753, in press. [Google Scholar] [CrossRef]
  6. Arulanandam, B.; Beladi, H.; Chakrabarti, A. Obesity and COVID-19 mortality are correlated. Sci. Rep. 2023, 13, 5895. [Google Scholar] [CrossRef]
  7. Morse, J.; Gay, W.; Korwek, K.M. Hyperglycaemia increases mortality risk in non-diabetic patients with COVID-19 even more than in diabetic patients. Endocrinol Diabetes Metab. 2021, 4, e00291. [Google Scholar] [CrossRef]
  8. Huang, I.; Lim, M.A.; Pranata, R. Diabetes mellitus is associated with increased mortality and severity of disease in COVID-19 pneumonia—A systematic review, meta-analysis, and meta-regression. Diabetes Metab. Syndr. 2020, 14, 395–403. [Google Scholar] [CrossRef]
  9. Gerganova, A.; Assyov, Y.; Kamenov, Z. Stress Hyperglycemia, Diabetes Mellitus and COVID-19 Infection: Risk Factors, Clinical Outcomes and Post-Discharge Implications. Front. Clin. Diabetes Healthc. 2022, 3, 826006. [Google Scholar] [CrossRef]
  10. Roncon, L.; Zuin, M.; Rigatelli, G.; Zuliani, G. Diabetic patients with COVID-19 infection are at higher risk of ICU admission and poor short-term outcome. J. Clin. Virol. 2020, 127, 104354. [Google Scholar] [CrossRef]
  11. Khunti, K.; Del Prato, S.; Mathieu, C.; Kahn, S.E.; Gabbay, R.A.; Buse, J.B. COVID-19, Hyperglycemia, and New-Onset Diabetes. Diabetes Care 2021, 44, 2645–2655. [Google Scholar] [CrossRef]
  12. Dennis, J.M.; Mateen, B.A.; Sonabend, R.; Thomas, N.J.; Patel, K.A.; Hattersley, A.T.; Denaxas, S.; McGovern, A.P.; Vollmer, S.J. Type 2 Diabetes and COVID-19–Related Mortality in the Critical Care Setting: A National Cohort Study in England, March–July 2020. Diabetes Care 2020, 44, 50–57. [Google Scholar] [CrossRef] [PubMed]
  13. Lim, S.; Bae, J.H.; Kwon, H.S.; Nauck, M.A. COVID-19 and diabetes mellitus: From pathophysiology to clinical management. Nat. Rev. Endocrinol. 2021, 17, 11–30. [Google Scholar] [CrossRef] [PubMed]
  14. D’Onofrio, N.; Scisciola, L.; Sardu, C.; Trotta, M.C.; De Feo, M.; Maiello, C.; Mascolo, P.; De Micco, F.; Turriziani, F.; Municino, E.; et al. Glycated ACE2 receptor in diabetes: Open door for SARS-CoV-2 entry in cardiomyocyte. Cardiovasc. Diabetol. 2021, 20, 99. [Google Scholar] [CrossRef]
  15. Tzeravini, E.; Stratigakos, E.; Siafarikas, C.; Tentolouris, A.; Tentolouris, N. The Role of Diabetes and Hyperglycemia on COVID-19 Infection Course-A Narrative Review. Front. Clin. Diabetes Healthc. 2022, 3, 812134. [Google Scholar] [CrossRef]
  16. Codo, A.C.; Davanzo, G.G.; Monteiro, L.B.; de Souza, G.F.; Muraro, S.P.; Virgilio-da-Silva, J.V.; Prodonoff, J.S.; Carregari, V.C.; de Biagi Junior, C.A.O.; Crunfli, F.; et al. Elevated Glucose Levels Favor SARS-CoV-2 Infection and Monocyte Response through a HIF-1α/Glycolysis-Dependent Axis. Cell Metab. 2020, 32, 437–446.e5. [Google Scholar] [CrossRef]
  17. Berbudi, A.; Rahmadika, N.; Tjahjadi, A.I.; Ruslami, R. Type 2 Diabetes and its Impact on the Immune System. Curr. Diabetes Rev. 2020, 16, 442–449. [Google Scholar] [CrossRef] [PubMed]
  18. Lontchi-Yimagou, E.; Sobngwi, E.; Matsha, T.E.; Kengne, A.P. Diabetes mellitus and inflammation. Curr. Diabetes Rep. 2013, 13, 435–444. [Google Scholar] [CrossRef]
  19. Hayden, M.R. An Immediate and Long-Term Complication of COVID-19 May Be Type 2 Diabetes Mellitus: The Central Role of β-Cell Dysfunction, Apoptosis and Exploration of Possible Mechanisms. Cells 2020, 9, 2475. [Google Scholar] [CrossRef]
  20. Yates, T.; Razieh, C.; Zaccardi, F.; Rowlands, A.V. Obesity, walking pace and risk of severe COVID-19 and mortality: Analysis of UK Biobank. Int. J. Obes. 2021, 45, 1155–1159. [Google Scholar] [CrossRef]
  21. Kwok, S.; Adam, S.; Ho, J.H.; Iqbal, Z.; Turkington, P.; Razvi, S.; Le Roux, C.W.; Soran, H.; Syed, A.A. Obesity: A critical risk factor in the COVID-19 pandemic. Clin. Obes. 2020, 10, e12403. [Google Scholar] [CrossRef]
  22. Maccioni, L.; Weber, S.; Elgizouli, M.; Stoehlker, A.S.; Geist, I.; Peter, H.H.; Vach, W.; Nieters, A. Obesity and risk of respiratory tract infections: Results of an infection-diary based cohort study. BMC Public Health 2018, 18, 271. [Google Scholar] [CrossRef] [PubMed]
  23. Raeisi, T.; Mozaffari, H.; Sepehri, N.; Darand, M.; Razi, B.; Garousi, N.; Alizadeh, M.; Alizadeh, S. The negative impact of obesity on the occurrence and prognosis of the 2019 novel coronavirus (COVID-19) disease: A systematic review and meta-analysis. Eat. Weight Disord. Stud. Anorex. Bulim. Obes. 2022, 27, 893–911. [Google Scholar] [CrossRef] [PubMed]
  24. Patel, A.B.; Verma, A. COVID-19 and Angiotensin-Converting Enzyme Inhibitors and Angiotensin Receptor Blockers: What Is the Evidence? JAMA 2020, 323, 1769–1770. [Google Scholar] [CrossRef] [PubMed]
  25. Kassir, R. Risk of COVID-19 for patients with obesity. Obesity reviews: An official journal of the International Association for the Study of Obesity. Obes. Rev. 2020, 21, e13034. [Google Scholar] [CrossRef] [PubMed] [Green Version]
  26. Rico-Martin, S.; Calderon-Garcia, J.F.; Basilio-Fernandez, B.; Clavijo-Chamorro, M.Z.; Sanchez Munoz-Torrero, J.F. Metabolic Syndrome and Its Components in Patients with COVID-19: Severe Acute Respiratory Syndrome (SARS) and Mortality. A Systematic Review and Meta-Analysis. J. Cardiovasc. Dev. Dis. 2021, 8, 162. [Google Scholar] [CrossRef]
  27. Gualtieri, P.; Marchetti, M.; Renzo, L.D.; De Santis, G.L.; Palma, R.; Colica, C.; Frank, G.; De Lorenzo, A.; Di Lorenzo, N. Impact of COVID-19 on the Destiny of Bariatric Patients. Nutrients 2022, 15, 163. [Google Scholar] [CrossRef]
  28. Zhu, L.; She, Z.G.; Cheng, X.; Qin, J.J.; Zhang, X.J.; Cai, J.; Lei, F.; Wang, H.; Xie, J.; Wang, W.; et al. Association of Blood Glucose Control and Outcomes in Patients with COVID-19 and Pre-existing Type 2 Diabetes. Cell Metab. 2020, 31, 1068–1077.e3. [Google Scholar] [CrossRef]
  29. Jing, X.; Chen, J.; Dong, Y.; Han, D.; Zhao, H.; Wang, X.; Gao, F.; Li, C.; Cui, Z.; Liu, Y.; et al. Related factors of quality of life of type 2 diabetes patients: A systematic review and meta-analysis. Health Qual. Life Outcomes 2018, 16, 189. [Google Scholar] [CrossRef]
  30. Pearson-Stuttard, J.; Blundell, S.; Harris, T.; Cook, D.G.; Critchley, J. Diabetes and infection: Assessing the association with glycaemic control in population-based studies. Lancet. Diabetes Endocrinol. 2016, 4, 148–158. [Google Scholar] [CrossRef]
  31. Aluganti Narasimhulu, C.; Singla, D.K. Mechanisms of COVID-19 pathogenesis in diabetes. Am. J. Physiol. Heart Circ. Physiol. 2022, 323, H403–H420. [Google Scholar] [CrossRef]
  32. Li, S.; Wang, J. Diabetes Mellitus and Cause-Specific Mortality: A Population-Based Study. Curr. Opin. Hematol. 2019, 43, 319–341. [Google Scholar] [CrossRef] [PubMed]
  33. Muniyappa, R.; Gubbi, S. COVID-19 pandemic, coronaviruses, and diabetes mellitus. Am. J. Physiol. Endocrinol. Metab. 2020, 318, E736–E741. [Google Scholar] [CrossRef] [Green Version]
  34. Hodgson, K.; Morris, J.; Bridson, T.; Govan, B.; Rush, C.; Ketheesan, N. Immunological mechanisms contributing to the double burden of diabetes and intracellular bacterial infections. Immunology 2015, 144, 171–185. [Google Scholar] [CrossRef] [PubMed]
  35. Rao, S.; Lau, A.; So, H.C. Exploring Diseases/Traits and Blood Proteins Causally Related to Expression of ACE2, the Putative Receptor of SARS-CoV-2: A Mendelian Randomization Analysis Highlights Tentative Relevance of Diabetes-Related Traits. Diabetes Care 2020, 43, 1416–1426. [Google Scholar] [CrossRef] [PubMed]
  36. Xu, Z.; Shi, L.; Wang, Y.; Zhang, J.; Huang, L.; Zhang, C.; Liu, S.; Zhao, P.; Liu, H.; Zhu, L.; et al. Pathological findings of COVID-19 associated with acute respiratory distress syndrome. Lancet Respir. Med. 2020, 8, 420–422. [Google Scholar] [CrossRef]
  37. Yang, X.; Yu, Y.; Xu, J.; Shu, H.; Xia, J.; Liu, H.; Wu, Y.; Zhang, L.; Yu, Z.; Fang, M.; et al. Clinical course and outcomes of critically ill patients with SARS-CoV-2 pneumonia in Wuhan, China: A single-centered, retrospective, observational study. Lancet Respir. Med. 2020, 8, 475–481. [Google Scholar] [CrossRef] [PubMed] [Green Version]
  38. Wu, C.; Chen, X.; Cai, Y.; Xia, J.; Zhou, X.; Xu, S.; Huang, H.; Zhang, L.; Zhou, X.; Du, C.; et al. Risk Factors Associated with Acute Respiratory Distress Syndrome and Death in Patients with Coronavirus Disease 2019 Pneumonia in Wuhan, China. JAMA Intern. Med. 2020, 180, 934–943. [Google Scholar] [CrossRef] [PubMed] [Green Version]
  39. Guo, Y.R.; Cao, Q.D.; Hong, Z.S.; Tan, Y.Y.; Chen, S.D.; Jin, H.J.; Tan, K.S.; Wang, D.Y.; Yan, Y. The origin, transmission and clinical therapies on coronavirus disease 2019 (COVID-19) outbreak—An update on the status. Mil. Med. Res. 2020, 7, 11. [Google Scholar] [CrossRef] [Green Version]
  40. Gao, T.; Zhu, L. Highly pathogenic coronavirus N protein aggravates inflammation by MASP-2-mediated lectin complement pathway overactivation. medRxiv 2022, 7, 318. [Google Scholar] [CrossRef]
  41. Abbasi, F.; Reaven, G.M. Comparison of two methods using plasma triglyceride concentration as a surrogate estimate of insulin action in nondiabetic subjects: Triglycerides × glucose versus triglyceride/high-density lipoprotein cholesterol. Metab. Clin. Exp. 2011, 60, 1673–1676. [Google Scholar] [CrossRef]
  42. Guerrero-Romero, F.; Simental-Mendía, L.E.; González-Ortiz, M.; Martínez-Abundis, E.; Ramos-Zavala, M.G.; Hernández-González, S.O.; Jacques-Camarena, O.; Rodríguez-Morán, M. The product of triglycerides and glucose, a simple measure of insulin sensitivity. Comparison with the euglycemic-hyperinsulinemic clamp. J. Clin. Endocrinol. Metab. 2010, 95, 3347–3351. [Google Scholar] [CrossRef] [Green Version]
  43. Rohani-Rasaf, M.; Mirjalili, K.; Vatannejad, A.; Teimouri, M. Are lipid ratios and triglyceride-glucose index associated with critical care outcomes in COVID-19 patients? PLoS ONE 2022, 17, e0272000. [Google Scholar] [CrossRef] [PubMed]
  44. Babic, N.; Valjevac, A.; Zaciragic, A.; Avdagic, N.; Zukic, S.; Hasic, S. The Triglyceride/HDL Ratio and Triglyceride Glucose Index as Predictors of Glycemic Control in Patients with Diabetes Mellitus Type 2. Med. Arch. 2019, 73, 163–168. [Google Scholar] [CrossRef] [PubMed]
  45. Alshammari, S.; AlMasoudi, A.S.; AlBuhayri, A.H.; AlAtwi, H.M.; AlHwiti, S.S.; Alaidi, H.M.; Alshehri, A.M.; Alanazi, N.A.; Aljabri, A.; Al-Gayyar, M.M. Effect of COVID-19 on Glycemic Control, Insulin Resistance, and pH in Elderly Patients with Type 2 Diabetes. Cureus 2023, 15, e35390. [Google Scholar] [CrossRef] [PubMed]
  46. Yang, J.K.; Feng, Y.; Yuan, M.Y.; Yuan, S.Y.; Fu, H.J.; Wu, B.Y.; Sun, G.Z.; Yang, G.R.; Zhang, X.L.; Wang, L.; et al. Plasma glucose levels and diabetes are independent predictors for mortality and morbidity in patients with SARS. Diabet. Med. J. Br. Diabet. Assoc. 2006, 23, 623–628. [Google Scholar] [CrossRef] [PubMed]
  47. Schoen, K.; Horvat, N.; Guerreiro, N.F.C.; de Castro, I.; de Giassi, K.S. Spectrum of clinical and radiographic findings in patients with diagnosis of H1N1 and correlation with clinical severity. BMC Infect. Dis. 2019, 19, 964. [Google Scholar] [CrossRef] [Green Version]
  48. Banik, G.R.; Alqahtani, A.S.; Booy, R.; Rashid, H. Risk factors for severity and mortality in patients with MERS-CoV: Analysis of publicly available data from Saudi Arabia. Virol. Sin. 2016, 31, 81–84. [Google Scholar] [CrossRef] [Green Version]
  49. Lippi, G.; Plebani, M. Laboratory abnormalities in patients with COVID-2019 infection. Clin. Chim. Acta Int. J. Clin. Chem. 2020, 58, 1131–1134. [Google Scholar] [CrossRef] [Green Version]
  50. Wang, A.; Zhao, W.; Xu, Z.; Gu, J. Timely blood glucose management for the outbreak of 2019 novel coronavirus disease (COVID-19) is urgently needed. Diabetes Res. Clin. Pract. 2020, 162, 108118. [Google Scholar] [CrossRef]
  51. Knapp, S. Diabetes and infection: Is there a link?—A mini-review. Gerontology 2013, 59, 99–104. [Google Scholar] [CrossRef]
  52. Kohio, H.P.; Adamson, A.L. Glycolytic control of vacuolar-type ATPase activity: A mechanism to regulate influenza viral infection. Virology 2013, 444, 301–309. [Google Scholar] [CrossRef] [PubMed] [Green Version]
  53. Petrie, J.R.; Guzik, T.J.; Touyz, R.M. Diabetes, Hypertension, and Cardiovascular Disease: Clinical Insights and Vascular Mechanisms. Can. J. Cardiol. 2018, 34, 575–584. [Google Scholar] [CrossRef] [PubMed] [Green Version]
  54. Carrasco-Sánchez, F.J.; López-Carmona, M.D.; Martínez-Marcos, F.J.; Pérez-Belmonte, L.M.; Hidalgo-Jiménez, A.; Buonaiuto, V.; Suárez Fernández, C.; Freire Castro, S.J.; Luordo, D.; Pesqueira Fontan, P.M.; et al. Admission hyperglycaemia as a predictor of mortality in patients hospitalized with COVID-19 regardless of diabetes status: Data from the Spanish SEMI-COVID-19 Registry. Ann. Med. 2021, 53, 103–116. [Google Scholar] [CrossRef] [PubMed]
  55. Wang, S.; Ma, P.; Zhang, S.; Song, S.; Wang, Z.; Ma, Y.; Xu, J.; Wu, F.; Duan, L.; Yin, Z.; et al. Fasting blood glucose at admission is an independent predictor for 28-day mortality in patients with COVID-19 without previous diagnosis of diabetes: A multi-centre retrospective study. Diabetologia 2020, 63, 2102–2111. [Google Scholar] [CrossRef] [PubMed]
  56. Wu, J.; Huang, J.; Zhu, G.; Wang, Q.; Lv, Q.; Huang, Y.; Yu, Y.; Si, X.; Yi, H.; Wang, C.; et al. Elevation of blood glucose level predicts worse outcomes in hospitalized patients with COVID-19: A retrospective cohort study. BMJ Open Diabetes Res. Care 2020, 8, e001476. [Google Scholar] [CrossRef]
  57. Geetha, H.S.; Singh, G.; Sekar, A.; Gogtay, M.; Singh, Y.; Abraham, G.M.; Trivedi, N. Hyperglycemia in COVID-19 infection without diabetes mellitus: Association with inflammatory markers. World J. Clin. Cases 2023, 11, 1287–1298. [Google Scholar] [CrossRef]
  58. Stefan, N.; Birkenfeld, A.L.; Schulze, M.B. Global pandemics interconnected—Obesity, impaired metabolic health and COVID-19. Nat. Rev. Endocrinol. 2021, 17, 135–149. [Google Scholar] [CrossRef]
  59. Wondmkun, Y.T. Obesity, Insulin Resistance, and Type 2 Diabetes: Associations and Therapeutic Implications. Diabetes Metab. Syndr. Obes. Targets Ther. 2020, 13, 3611–3616. [Google Scholar] [CrossRef]
  60. Chen, M.; Zhu, B.; Chen, D.; Hu, X.; Xu, X.; Shen, W.J.; Hu, C.; Li, J.; Qu, S. COVID-19 May Increase the Risk of Insulin Resistance in Adult Patients Without Diabetes: A 6-Month Prospective Study. Endocr. Pract. 2021, 27, 834–841. [Google Scholar] [CrossRef]
  61. Duman, T.T.; Aktas, G.; Atak, B.M.; Kocak, M.Z.; Erkus, E.; Savli, H. Neutrophil to lymphocyte ratio as an indicative of diabetic control level in type 2 diabetes mellitus. Afr. Health Sci. 2019, 19, 1602–1606. [Google Scholar] [CrossRef]
  62. Coppelli, A.; Giannarelli, R.; Aragona, M.; Penno, G.; Falcone, M.; Tiseo, G.; Ghiadoni, L.; Barbieri, G.; Monzani, F.; Virdis, A.; et al. Hyperglycemia at Hospital Admission Is Associated with Severity of the Prognosis in Patients Hospitalized for COVID-19: The Pisa COVID-19 Study. Diabetes Care 2020, 43, 2345–2348. [Google Scholar] [CrossRef] [PubMed]
  63. Wingert, A.; Pillay, J.; Gates, M. Risk factors for severity of COVID-19: A rapid review to inform vaccine prioritisation in Canada. BMJ Open 2021, 11, e044684. [Google Scholar] [CrossRef]
  64. Fajgenbaum, D.C.; June, C.H. Cytokine Storm. N. Engl. J. Med. 2020, 383, 2255–2273. [Google Scholar] [CrossRef] [PubMed]
  65. Melamed, R.; Paz, F.; Jepsen, S.; Smith, C.; Saavedra, R.; Mulder, M.; Masood, A.; Huelster, J.; Kirkland, L.; Guenther, A.; et al. Prognostic factors and outcomes in COVID-19 patients requiring prolonged mechanical ventilation: A retrospective cohort study. Ther. Adv. Respir. Dis. 2022, 16, 17534666221086415. [Google Scholar] [CrossRef]
  66. Izcovich, A.; Ragusa, M.A.; Tortosa, F.; Lavena Marzio, M.A.; Agnoletti, C.; Bengolea, A.; Ceirano, A.; Espinosa, F.; Saavedra, E. Prognostic factors for severity and mortality in patients infected with COVID-19: A systematic review. PLoS ONE 2020, 15, e0241955. [Google Scholar] [CrossRef]
  67. Cugnata, F.; Scarale, M.G.; De Lorenzo, R.; Simonini, M.; Citterio, L.; Querini, P.R.; Castagna, A.; Di Serio, C.; Lanzani, C. Profiling COVID-19 patients with respect to level of severity: An integrated statistical approach. Sci. Rep. 2023, 13, 5498. [Google Scholar] [CrossRef] [PubMed]
  68. Sharma, J.; Rajput, R.; Bhatia, M.; Arora, P.; Sood, V. Clinical Predictors of COVID-19 Severity and Mortality: A Perspective. Front. Cell. Infect. Microbiol. 2021, 11, 674277. [Google Scholar] [CrossRef]
  69. Liu, F.; Long, X.; Zhang, B.; Zhang, W.; Chen, X.; Zhang, Z. ACE2 Expression in Pancreas May Cause Pancreatic Damage After SARS-CoV-2 Infection. Clin. Gastroenterol. Hepatol. 2020, 18, 2128–2130.e2. [Google Scholar] [CrossRef]
  70. Al-Aly, Z.; Xie, Y. High-dimensional characterization of post-acute sequelae of COVID-19. Nature 2021, 594, 259–264. [Google Scholar] [CrossRef]
  71. Capes, S.E.; Hunt, D.; Malmberg, K.; Gerstein, H.C. Stress hyperglycaemia and increased risk of death after myocardial infarction in patients with and without diabetes: A systematic overview. Lancet 2000, 355, 773–778. [Google Scholar] [CrossRef]
  72. Mondal, S.; DasGupta, R.; Lodh, M.; Garai, R.; Choudhury, B.; Hazra, A.K.; Mondal, A.; Ganguly, A. Stress hyperglycemia ratio, rather than admission blood glucose, predicts in-hospital mortality and adverse outcomes in moderate-to severe COVID-19 patients, irrespective of pre-existing glycemic status. Diabetes Res. Clin. Pract. 2022, 190, 109974. [Google Scholar] [CrossRef] [PubMed]
  73. Singh, A.K.; Singh, R. Hyperglycemia without diabetes and new-onset diabetes are both associated with poorer outcomes in COVID-19. Diabetes Res. Clin. Pract. 2020, 167, 108382. [Google Scholar] [CrossRef]
  74. Zahedi, M.; Kordrostami, S.; Kalantarhormozi, M.; Bagheri, M. A Review of Hyperglycemia in COVID-19. Cureus 2023, 15, e37487. [Google Scholar] [CrossRef] [PubMed]
  75. Tang, X.; Uhl, S.; Zhang, T.; Xue, D.; Li, B.; Vandana, J.J.; Acklin, J.A.; Bonnycastle, L.L.; Narisu, N.; Erdos, M.R.; et al. SARS-CoV-2 infection induces beta cell transdifferentiation. Cell Metab. 2021, 33, 1577–1591.e7. [Google Scholar] [CrossRef]
  76. Wu, C.T.; Lidsky, P.V.; Xiao, Y.; Lee, I.T.; Cheng, R.; Nakayama, T.; Jiang, S.; Demeter, J.; Bevacqua, R.J.; Chang, C.A.; et al. SARS-CoV-2 infects human pancreatic β cells and elicits β cell impairment. Cell Metab. 2021, 33, 1565–1576.e5. [Google Scholar] [CrossRef]
  77. Stehouwer, C.D.A. Microvascular Dysfunction and Hyperglycemia: A Vicious Cycle with Widespread Consequences. Diabetes 2018, 67, 1729–1741. [Google Scholar] [CrossRef] [Green Version]
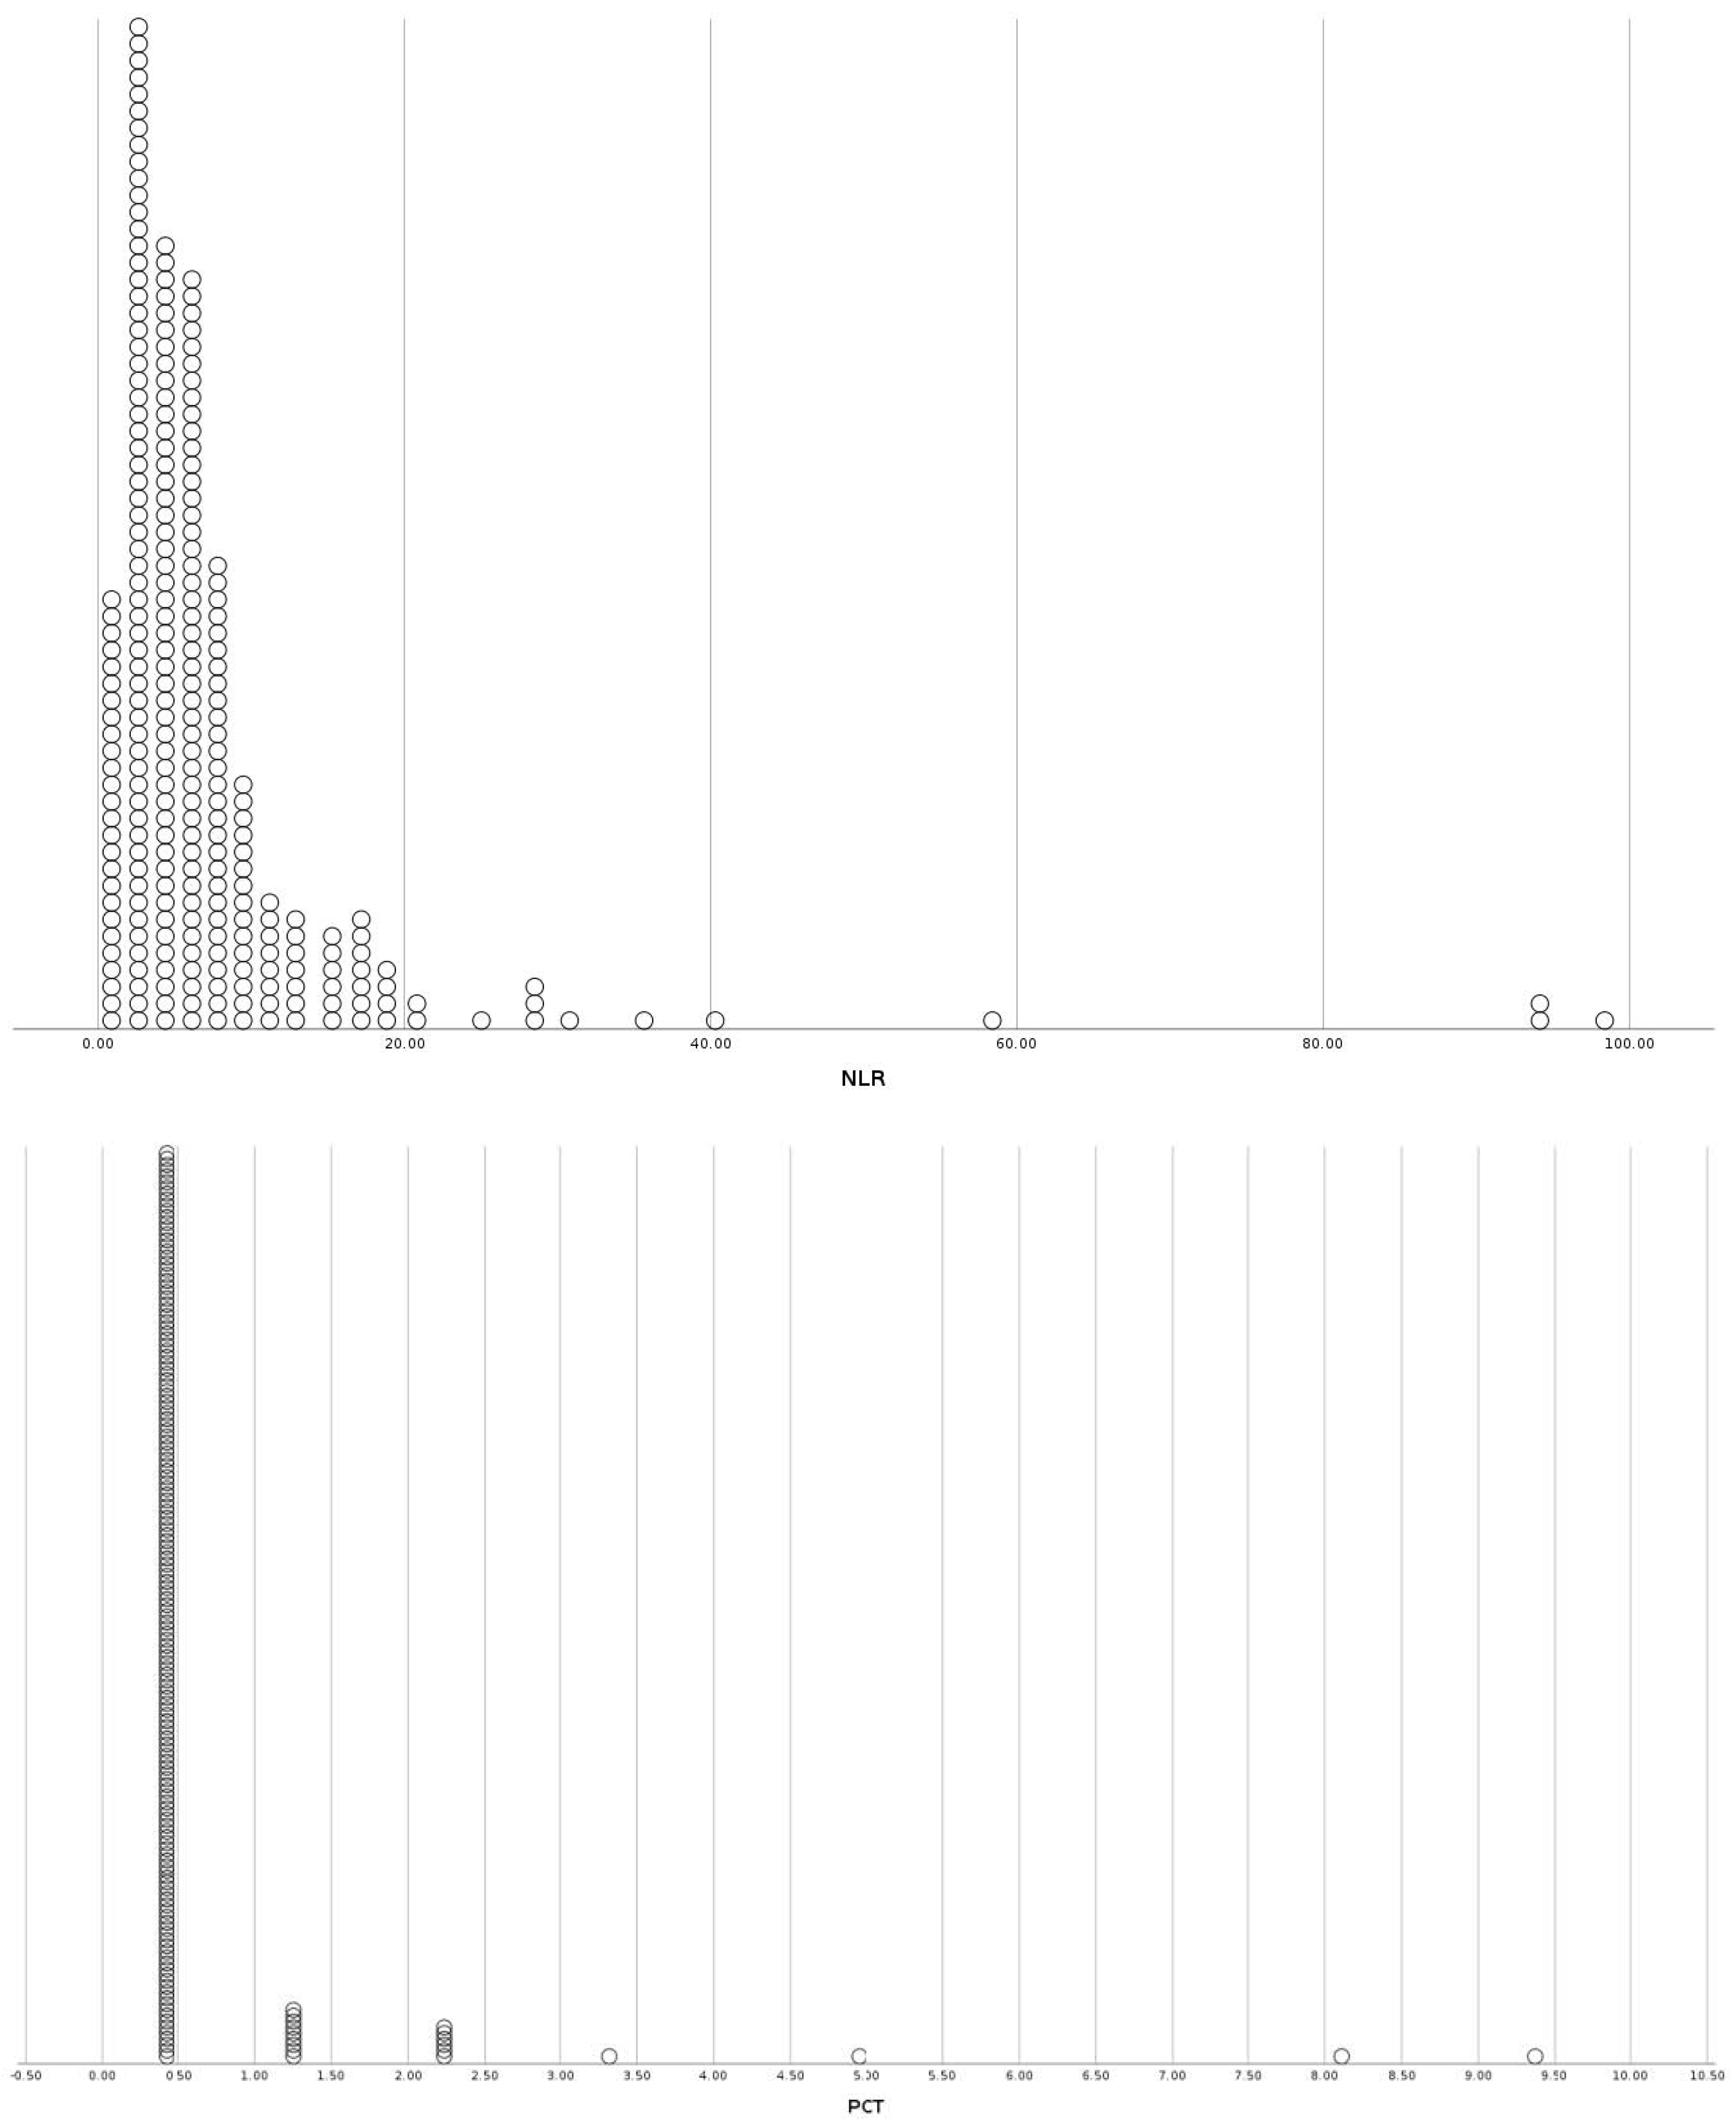
Figure 1. Distribution plots of inflammatory markers (NLR, PCT, IL-6), disease severity markers (PFR) and insulin resistance indices (TRG/HDL ratio, TyG index) for the sub-group of patients with diabetes. NLR: Neutrophil to Lymphocyte Ratio, PCT: Procalcitonin, IL-6: Interleukin-6, PFR: PO2/FiO2 Ratio, TRG/HDL-C: Triglycerides to HDL-Cholesterol ratio, TyG: Triglyceride-glucose index.
Viruses 15 01468 g001aViruses 15 01468 g001bViruses 15 01468 g001c
Figure 2. Distribution plots of inflammatory markers (NLR, PCT, IL-6), disease severity markers (PFR) and insulin resistance indices (TRG/HDL ratio, TyG index) for the sub-group of patients with obesity. NLR: Neutrophil to Lymphocyte Ratio, PCT: Procalcitonin, IL-6: Interleukin-6, PFR: PO2/FiO2 Ratio, TRG/HDL-C: Triglycerides to HDL-Cholesterol ratio, TyG: Triglyceride-glucose index.
Viruses 15 01468 g002aViruses 15 01468 g002bViruses 15 01468 g002c
Figure 3. Distribution plots of inflammatory markers (NLR, PCT, IL-6), disease severity markers (PFR) and insulin resistance indices (TRG/HDL ratio, TyG index) for the sub-group of patients without diabetes or obesity. NLR: Neutrophil to Lymphocyte Ratio, PCT: Procalcitonin, IL-6: Interleukin-6, PFR: PO2/FiO2 Ratio, TRG/HDL-C: Triglycerides to HDL-Cholesterol ratio, TyG: Triglyceride-glucose index.
Viruses 15 01468 g003aViruses 15 01468 g003bViruses 15 01468 g003c
Table 1. Demographic, somatometric baseline characteristics, comorbidities, inflammatory markers, insulin resistance indices, disease severity markers, and outcomes for each studied sub-group. Data presented as frequency or mean/standard deviation.
CohortPatients with DiabetesPatients with ObesityPatients without Diabetes or Obesity
CharacteristicsFrequency (n)Mean/SDFrequency (n)Mean/SDFrequency (n)Mean/SD
Sex (male/female)165/105 107/94 369/262
Age (years) 73.45/12.31 59.69/16.33 63.85/18.34
BMI (kg/m2) 25.54/2.93 34.24/4.35 25.64/2.79
Plasma glucose (mg/dL) 177.92/82.37 126.22/45.06 119.73/35.08
WBC count (#/μL) 8205.65/7312.56 7218.68/3762.28 7244.40/4032.51
NLR 7.91/11.50 6.19/5.08 7.41/7.93
CRP (mg/L) 118.05/121.33 124.11/117.38 112.02/115.81
PCT (ng/mL) 0.73/3.08 1.36/11.04 0.53/2.24
IL-6 (pg/mL) 61.32/156.61 34.52/39.38 56.90/174.61
PFR 264.73/123.21 260.56/109.97 281.78/123.93
TRG/HDL-C ratio 4.66/8.85 3.51/2.92 3.20/2.18
TyG index 9.11/0.72 8.75/0.59 8.66/0.55
Hyperglycemia on admission165 46 118
Hyperglycemia during hospitalization229 100 317
Comorbidities
CAD80 21 118
AH192 86 248
Dyslipidemia153 51 191
COPD29 15 45
Thyroid disease31 27 64
Autoimmune disease15 14 43
Cancer30 9 58
Smoking (active)36 25 88
COVID-19 vaccination124 67 186
Outcomes
LoS > 7 days145 111 320
Intubation14 5 31
Patient death39 12 68
BMI: body mass index; WBC count: white blood cell count; NLR: neutrophil to lymphocyte ratio; CRP: C-reactive protein; PCT: procalcitonin; IL-6: interleukin-6; PFR: PO2/FiO2 ratio; TRG/HDL-C: triglycerides to HDL-cholesterol ratio; TyG: triglyceride–glucose index; CAD: coronary artery disease; AH: arterial hypertension; COPD: chronic obstructive pulmonary disease; LoS: length of stay.
Table 2. Multivariate binary logistic regression results of inflammatory markers, insulin resistance indices, disease severity markers, and outcomes for the sub-group of patients with diabetes.
OutcomesLoS > 7 DaysIntubationDeath
VariablesORp-ValueORp-ValueORp-Value
WBC count (#/μL)1.000.4071.0000.9591.0000.004
NLR1.010.2351.0020.9511.0350.005
CRP (mg/L)1.010.1861.0030.0281.0040.001
PCT (ng/mL)0.9850.7630.9670.8460.9560.663
IL-6 (pg/mL)1.0040.0741.0020.0381.0020.078
PFR0.9960.0010.9900.0050.9940.002
CT BoD4.980<0.00117.6340.0092.7530.057
NLR > 3.11.0990.7372.360.2712.9320.035
CRP > 1001.7870.0223.3210.0511.9130.073
PCT > 0.51.5540.2782.6540.1981.8760.189
IL-6 > 242.8400.0012.9250.1295.582<0.001
PFR < 2004.413<0.0016.6360.0075.984<0.001
Hyperglycemia on admission1.7190.0341.9640.3891.8960.111
Hyperglycemia during hospitalization3.7040.0010.9950.9951.0970.861
TRG/HDL-C ratio1.2090.0050.9920.8900.9990.973
TyG index2.0650.0031.4920.3831.7840.039
WBC count: white blood cell count; NLR: neutrophil to lymphocyte ratio; CRP: C-reactive protein; PCT: procalcitonin; IL-6: interleukin-6; PFR: PO2/FiO2 ratio; TRG/HDL-C: triglycerides to HDL-cholesterol ratio; TyG: triglyceride–glucose index; CT BoD: CT burden of disease; LoS: length of stay; OR: odds ratio.
Table 3. Multivariate binary logistic regression results of inflammatory markers, disease severity markers, and the study outcomes for the sub-group of patients with obesity.
OutcomesLoS > 7 DaysIntubationDeath
VariablesORp-ValueORp-ValueORp-Value
WBC count (#/μL)1.0000.1891.0000.2211.0000.144
NLR1.0550.0870.9470.6301.0510.373
CRP (mg/L)1.0030.0211.000.9271.0000.956
PCT (ng/mL)0.9290.3540.1990.7001.0410.112
IL-6 (pg/mL)1.0120.0321.0000.9841.0060.451
PFR0.9950.0010.9800.0230.9910.025
CT BoD9.938<0.001**1.3110.835
NLR > 3.12.1790.0191.3120.8124.9330.148
CRP > 1001.6240.0961.5210.6531.3140.674
PCT > 0.50.7310.572**1.6580.605
IL-6 > 241.8310.0633.2260.3172.3830.248
PFR < 2003.0730.001**4.7500.025
Hyperglycemia on admission1.4420.333**0.5090.433
Hyperglycemia during hospitalization2.3160.009**0.5870.467
TRG/HDL-C ratio0.9480.3760.8120.5821.1340.125
TyG index1.2920.3740.5420.4320.8180.756
WBC count: white blood cell count; NLR: neutrophil to lymphocyte ratio; CRP: C-reactive protein; PCT: procalcitonin; IL-6: interleukin-6; PFR: PO2/FiO2 ratio; TRG/HDL-C: triglycerides to HDL-cholesterol ratio; TyG: triglyceride–glucose index; CT BoD: CT burden of disease; LoS: length of stay; OR: odds ratio,* unable to calculate the odds ratios due to small sample size.
Table 4. Multivariate binary logistic regression results of inflammatory markers, disease severity markers, and the study outcomes for the sub-group of patients without diabetes or obesity.
OutcomesLoS > 7 DaysIntubationDeath
VariablesORp-ValueORp-ValueORp-Value
WBC count (#/μL)1.0000.3461.0000.2591.0000.002
NLR1.0240.0341.0380.0241.062<0.001
CRP (mg/L)1.0030.0011.0040.0021.005<0.001
PCT (ng/mL)1.0610.2721.0470.4481.1560.008
IL-6 (pg/mL)1.0000.8581.0010.0871.003<0.001
PFR0.997<0.0010.989<0.0010.994<0.001
CT BoD4.757<0.00128.430<0.0015.535<0.001
NLR > 3.11.5110.0225.5520.0215.724<0.001
CRP > 1002.179<0.0012.5790.0153.022<0.001
PCT > 0.51.3930.2792.2630.1094.742<0.001
IL-6 > 242.323<0.0012.4960.0413.705<0.001
PFR < 2002.442<0.0015.100<0.0013.546<0.001
Hyperglycemia on admission1.0230.9162.3900.0291.6670.103
Hyperglycemia during hospitalization1.6850.0023.3520.0101.4250.226
TRG/HDL-C ratio1.249<0.0011.1860.0231.369<0.001
TyG index2.418<0.0012.9830.0023.203<0.001
WBC count: white blood cell count; NLR: neutrophil to lymphocyte ratio; CRP: C-reactive protein; PCT: procalcitonin; IL-6: interleukin-6; PFR: PO2/FiO2 ratio; TRG/HDL-C: triglycerides to HDL-cholesterol ratio; TyG: triglyceride–glucose index; CT BoD: CT burden of disease; LoS: length of stay; OR: odds ratio.
Table 5. Multivariate binary logistic regression results of inflammatory markers, disease severity markers, and the incidence of hyperglycemia on admission and during hospitalization for each sub-group.
Group of PatientsPatients with DiabetesPatients with ObesityPatients without Diabetes or Obesity
Glycemic StatusHyperglycemia on AdmissionHyperglycemia during HospitalizationHyperglycemia on AdmissionHyperglycemia during HospitalizationHyperglycemia on AdmissionHyperglycemia during Hospitalization
VariablesORp-ValueORp-ValueORp-ValueORp-ValueORp-ValueORp-Value
WBC count (#/μL)1.0000.1611.0000.9161.0000.0681.0000.9951.000< 0.0011.0000.018
NLR1.1050.0011.0790.0831.0680.0381.0410.1931.066< 0.0011.0210.075
CRP (mg/L)1.0020.1051.0000.7531.0000.9801.0020.2361.0020.0041.0020.042
PCT (ng/mL)1.2560.2363.4720.1860.7970.5410.5070.1751.0040.9341.0120.792
IL-6 (pg/mL)1.0010.5611.0030.3881.0020.6900.9990.7401.0000.3811.0000.718
PFR0.9980.1100.9970.0650.9980.2001.0000.7990.9970.0081.0000.595
CT BoD > 50%1.2200.6087.4820.0591.6430.2541.2210.6041.5860.1191.3160.255
NLR > 3.10.9970.9920.7550.4991.8850.1721.2600.5122.4020.0021.3690.105
CRP > 100 mg/L1.6380.0601.7930.1160.7160.3501.3210.3571.8820.0031.4410.035
PCT > 0.5 ng/mL2.1620.0802.7860.1860.7110.6300.2060.0151.5160.2150.9970.993
IL-6 > 24 pg/mL0.9190.7821.2390.6340.7450.4530.9000.7520.5830.0270.8070.283
PFR < 2001.6330.1053.2850.0221.1240.7601.0001.0002.1310.0011.3520.139
TRG/HDL-C ratio0.9920.6491.3130.2031.0480.4410.9680.5821.0070.8901.0640.200
TyG index13.838<0.0014.0050.00134.014<0.0014.190<0.0019.408<0.0013.612<0.001
WBC count: white blood cell count; NLR: neutrophil to lymphocyte ratio; CRP: C-reactive protein; PCT: procalcitonin; IL-6: interleukin-6; PFR: PO2/FiO2 ratio; TRG/HDL-C: triglycerides to HDL-cholesterol ratio; TyG: triglyceride–glucose index; CT BoD: CT burden of disease; OR: odds ratio.
Disclaimer/Publisher’s Note: The statements, opinions and data contained in all publications are solely those of the individual author(s) and contributor(s) and not of MDPI and/or the editor(s). MDPI and/or the editor(s) disclaim responsibility for any injury to people or property resulting from any ideas, methods, instructions or products referred to in the content.