
The Flexible, Extended Coil of the PDZ-Binding Motif of the Three Deadly Human Coronavirus E Proteins Plays a Role in Pathogenicity


Abstract
:1. Introduction
2. Materials and Methods
2.1. Molecular Modelling
Template Selection, Model Construction, and Quality Assessment
2.2. High Ambiguity Driven DOCKing (HADDOCK): Molecular Docking
2.3. Interaction Analysis: PyMol and Protein-Ligand Interaction Profiler (PLiP)
2.4. Molecular Dynamic (MD) Simulations of the hCoV E Proteins in POPC Lipid Bilayer
2.5. Trajectory Analysis, Principal Component Analysis (PCA), and Lipid Bilayer Analysis
3. Results
3.1. Homology Modelling and Quality Assessment
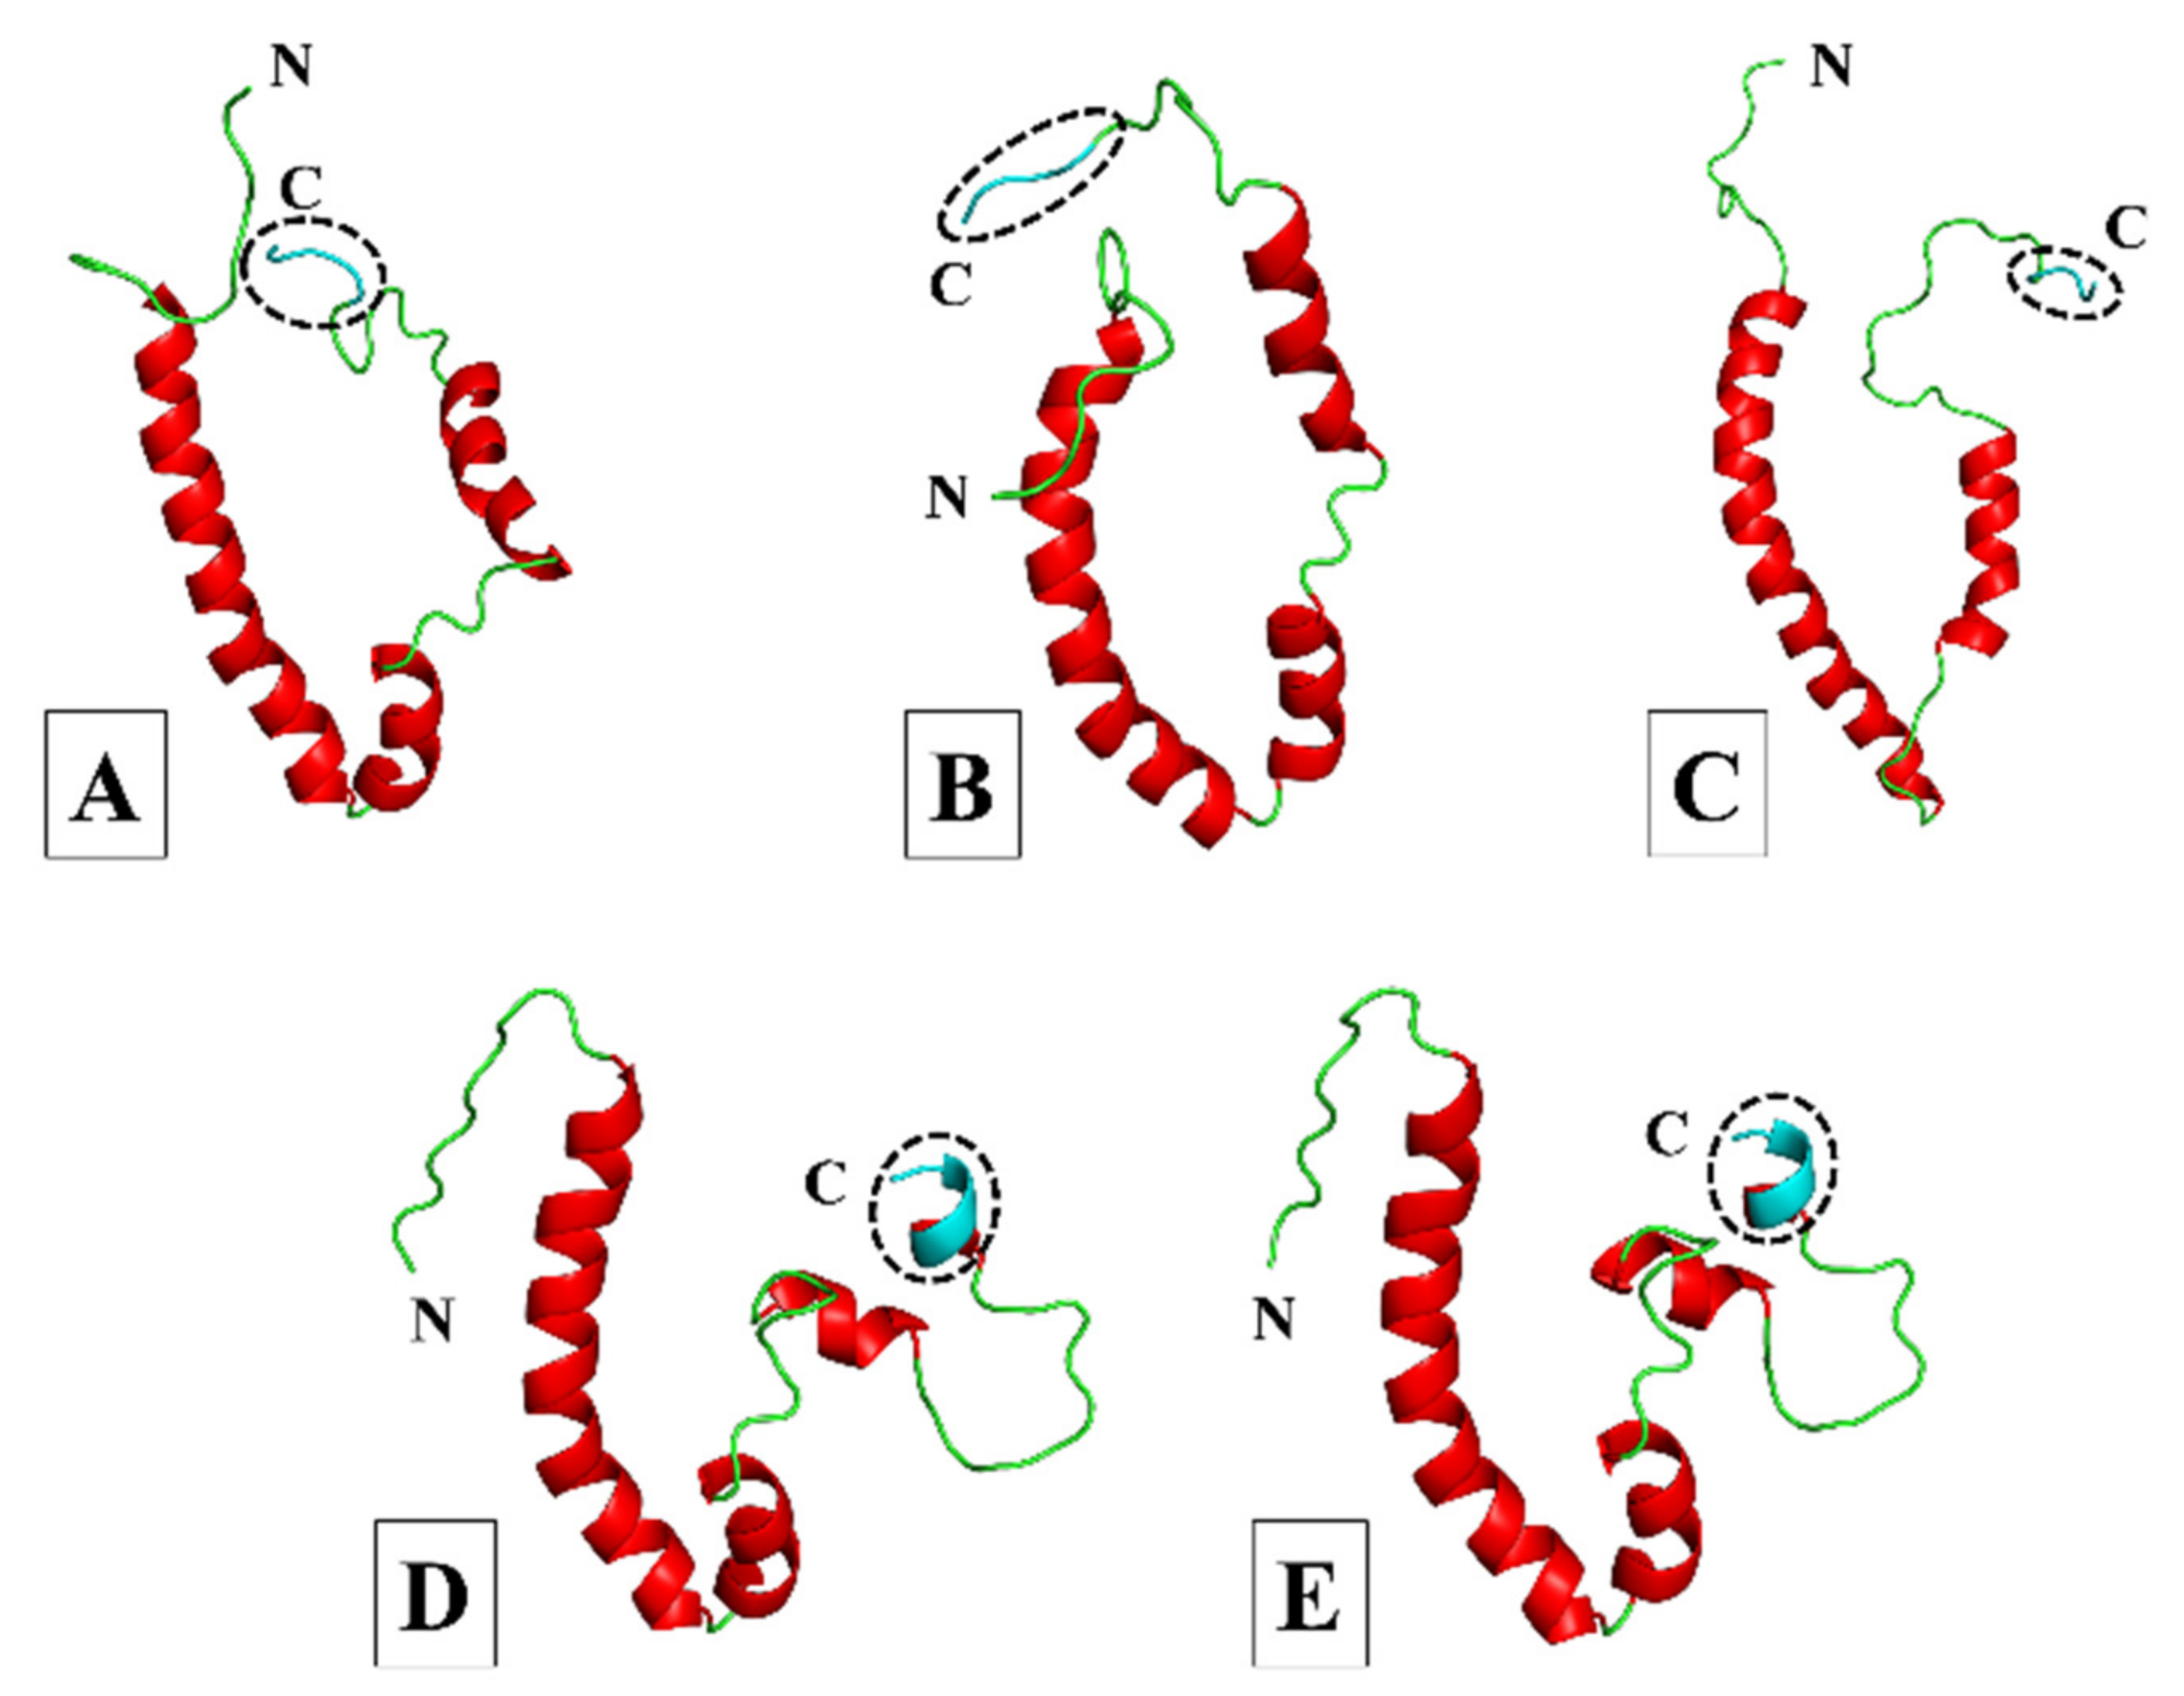
3.1.1. More Virulent hCoVs: SARS-CoV-1, -2, and MERS-CoV
3.1.2. Less Virulent hCoVs: HCoV-229E and HCoV-NL63
3.2. Molecular Docking and Interaction Analysis
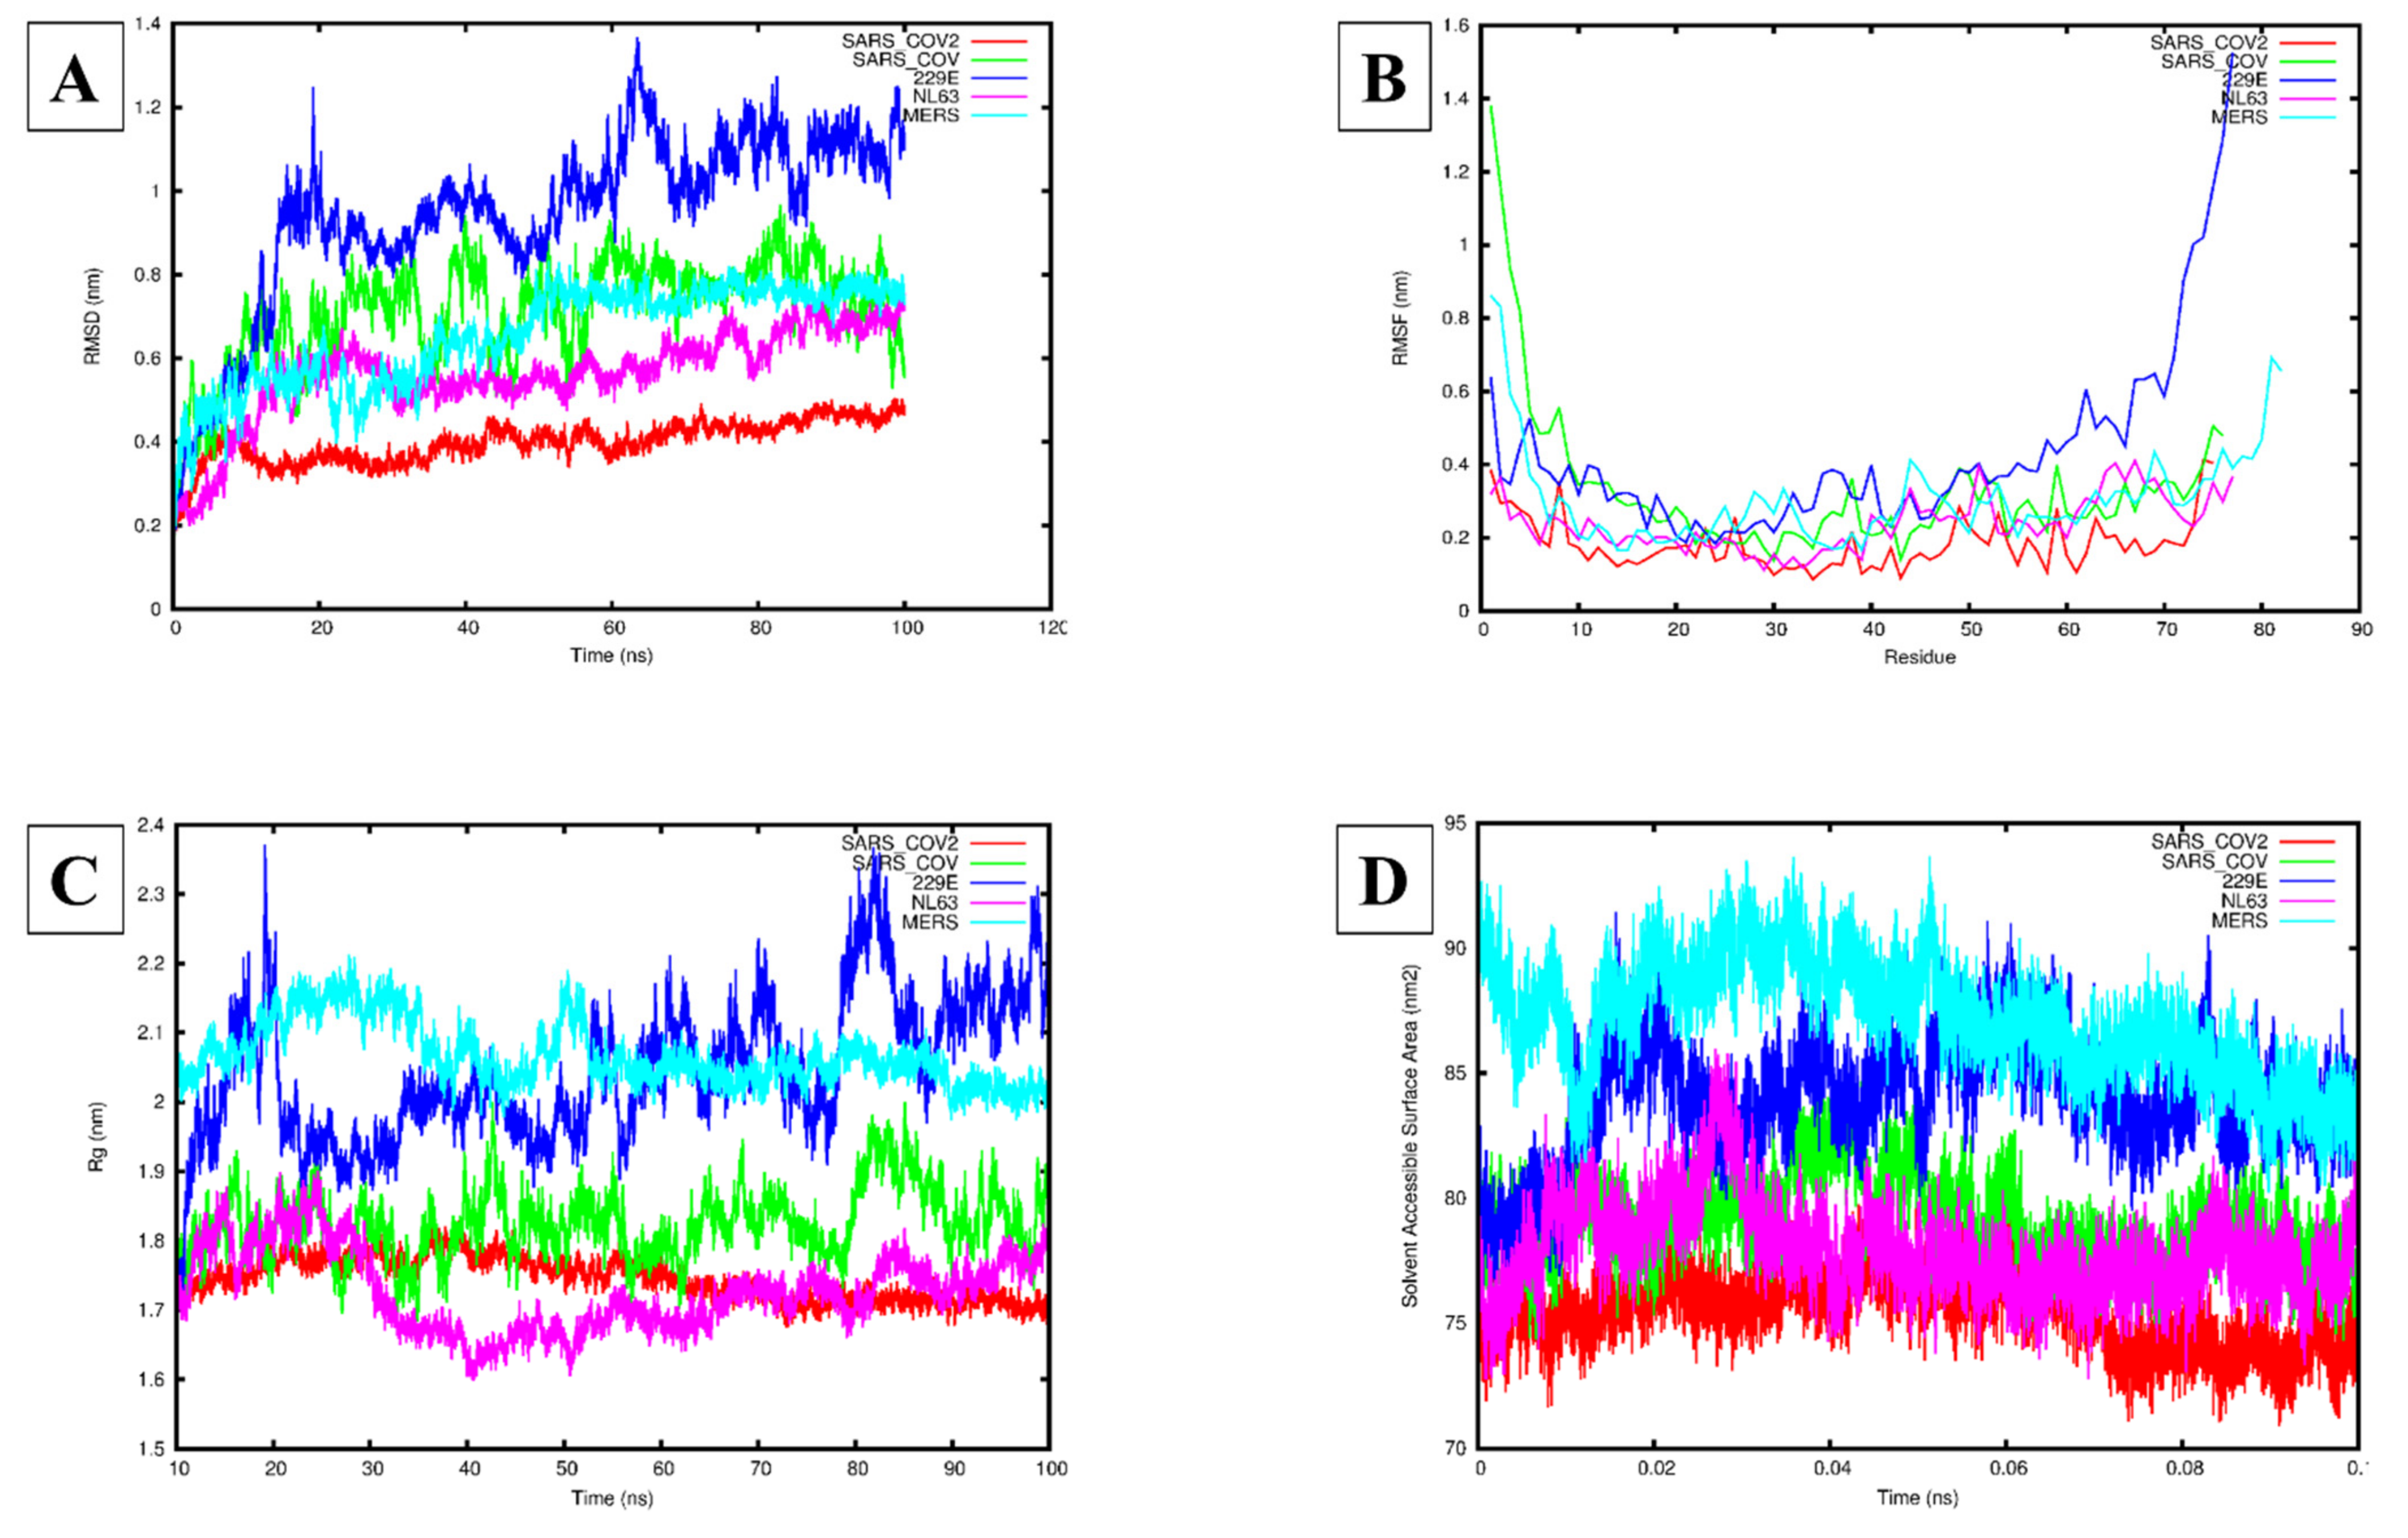
3.3. Molecular Dynamics Simulation Analysis
4. Discussion
5. Conclusions
Supplementary Materials
Author Contributions
Funding
Institutional Review Board Statement
Informed Consent Statement
Data Availability Statement
Acknowledgments
Conflicts of Interest
References
- Broadbent, L. Coronaviruses—A brief history. The Conversation, 15 April 2020. [Google Scholar]
- Hewings-Martin, Y. How do SARS and MERS compare with COVID-19? Medical News Today, 10 April 2020. [Google Scholar]
- Aldridge, R.W.; Lewer, D.; Beale, S.; Johnson, A.M.; Zambon, M.; Hayward, A.C.; Fragaszy, E.B. Seasonality and immunity to laboratory-confirmed seasonal coronaviruses (HCoV-NL63, HCoV-OC43, and HCoV-229E): Results from the Flu Watch cohort study. Wellcome Open Res. 2020, 5, 52. [Google Scholar] [CrossRef] [PubMed]
- Cui, L.J.; Zhang, C.; Zhang, T.; Lu, R.J.; Xie, Z.D.; Zhang, L.L.; Liu, C.Y.; Zhou, W.M.; Ruan, L.; Ma, X.J.; et al. Human Coronaviruses HCoV-NL63 and HCoV-HKU1 in Hospitalized Children with Acute Respiratory Infections in Beijing, China. Adv. Virol. 2011, 2011, 129134. [Google Scholar] [CrossRef] [PubMed]
- Gaunt, E.R.; Hardie, A.; Claas, E.C.; Simmonds, P.; Templeton, K.E. Epidemiology and clinical presentations of the four human coronaviruses 229E, HKU1, NL63, and OC43 detected over 3 years using a novel multiplex real-time PCR method. J. Clin. Microbiol. 2010, 48, 2940–2947. [Google Scholar] [CrossRef] [PubMed]
- Killerby, M.E.; Biggs, H.M.; Haynes, A.; Dahl, R.M.; Mustaquim, D.; Gerber, S.I.; Watson, J.T. Human coronavirus circulation in the United States 2014–2017. J. Clin. Virol. 2018, 101, 52–56. [Google Scholar] [CrossRef]
- Lau, S.K.; Woo, P.C.; Yip, C.C.; Tse, H.; Tsoi, H.-w.; Cheng, V.C.; Lee, P.; Tang, B.S.; Cheung, C.H.; Lee, R.A. Coronavirus HKU1 and other coronavirus infections in Hong Kong. J. Clin. Microbiol. 2006, 44, 2063–2071. [Google Scholar] [CrossRef] [PubMed]
- Su, S.; Wong, G.; Shi, W.; Liu, J.; Lai, A.C.; Zhou, J.; Liu, W.; Bi, Y.; Gao, G.F. Epidemiology, genetic recombination, and pathogenesis of coronaviruses. Trends Microbiol. 2016, 24, 490–502. [Google Scholar] [CrossRef] [PubMed]
- Zeng, Z.-Q.; Chen, D.-H.; Tan, W.-P.; Qiu, S.-Y.; Xu, D.; Liang, H.-X.; Chen, M.-X.; Li, X.; Lin, Z.-S.; Liu, W.-K.; et al. Epidemiology and clinical characteristics of human coronaviruses OC43, 229E, NL63, and HKU1: A study of hospitalized children with acute respiratory tract infection in Guangzhou, China. Eur. J. Clin. Microbiol. Infect. Dis. 2018, 37, 363–369. [Google Scholar] [CrossRef] [PubMed]
- Edridge, A.W.D.; Kaczorowska, J.; Hoste, A.C.R.; Bakker, M.; Klein, M.; Loens, K.; Jebbink, M.F.; Matser, A.; Kinsella, C.M.; Rueda, P.; et al. Seasonal coronavirus protective immunity is short-lasting. Nat. Med. 2020, 26, 1691. [Google Scholar] [CrossRef] [PubMed]
- Liu, D.X.; Liang, J.Q.; Fung, T.S. Human Coronavirus-229E, -OC43, -NL63, and -HKU1 (Coronaviridae). Encycl. Virol. 2021, 2, 428–440. [Google Scholar] [CrossRef]
- Trombetta, H.; Faggion, H.Z.; Leotte, J.; Nogueira, M.B.; Vidal, L.R.; Raboni, S.M. Human coronavirus and severe acute respiratory infection in Southern Brazil. Pathog. Glob. Health 2016, 110, 113–118. [Google Scholar] [CrossRef] [PubMed]
- Fett, C.; DeDiego, M.L.; Regla-Nava, J.A.; Enjuanes, L.; Perlman, S. Complete protection against severe acute respiratory syndrome coronavirus-mediated lethal respiratory disease in aged mice by immunization with a mouse-adapted virus lacking E protein. J. Virol. 2013, 87, 6551–6559. [Google Scholar] [CrossRef] [PubMed]
- Jimenez-Guardeño, J.M.; Nieto-Torres, J.L.; DeDiego, M.L.; Regla-Nava, J.A.; Fernandez-Delgado, R.; Castaño-Rodriguez, C.; Enjuanes, L. The PDZ-binding motif of severe acute respiratory syndrome coronavirus envelope protein is a determinant of viral pathogenesis. PLoS Pathog. 2014, 10, e1004320. [Google Scholar] [CrossRef] [PubMed]
- Nieto-Torres, J.L.; DeDiego, M.L.; Verdia-Baguena, C.; Jimenez-Guardeno, J.M.; Regla-Nava, J.A.; Fernandez-Delgado, R.; Castano-Rodriguez, C.; Alcaraz, A.; Torres, J.; Aguilella, V.M.; et al. Severe acute respiratory syndrome coronavirus envelope protein ion channel activity promotes virus fitness and pathogenesis. PLoS Pathog. 2014, 10, e1004077. [Google Scholar] [CrossRef] [PubMed]
- Regla-Nava, J.A.; Nieto-Torres, J.L.; Jimenez-Guardeño, J.M.; Fernandez-Delgado, R.; Fett, C.; Castaño-Rodríguez, C.; Perlman, S.; Enjuanes, L.; DeDiego, M.L. SARS coronaviruses with mutations in E protein are attenuated and promising vaccine candidates. J. Virol. 2015, 89, 3870–3887. [Google Scholar] [CrossRef] [PubMed]
- Schoeman, D.; Fielding, B.C. Is There a Link Between the Pathogenic Human Coronavirus Envelope Protein and Immunopathology? A Review of the Literature. Front. Microbiol. 2020, 11, 2086. [Google Scholar] [CrossRef] [PubMed]
- Xia, B.; Shen, X.; He, Y.; Pan, X.; Liu, F.L.; Wang, Y.; Yang, F.; Fang, S.; Wu, Y.; Duan, Z.; et al. SARS-CoV-2 envelope protein causes acute respiratory distress syndrome (ARDS)-like pathological damages and constitutes an antiviral target. Cell Res. 2021, 31, 847–860. [Google Scholar] [CrossRef] [PubMed]
- Farcas, G.A.; Poutanen, S.M.; Mazzulli, T.; Willey, B.M.; Butany, J.; Asa, S.L.; Faure, P.; Akhavan, P.; Low, D.E.; Kain, K.C. Fatal severe acute respiratory syndrome is associated with multiorgan involvement by coronavirus. J. Infect. Dis. 2005, 191, 193–197. [Google Scholar] [CrossRef]
- Kuiken, T.; Fouchier, R.A.M.; Schutten, M.; Rimmelzwaan, G.F.; van Amerongen, G.; van Riel, D.; Laman, J.D.; de Jong, T.; van Doornum, G.; Lim, W.; et al. Newly discovered coronavirus as the primary cause of severe acute respiratory syndrome. Lancet 2003, 362, 263–270. [Google Scholar] [CrossRef]
- Nicholls, J.M.; Poon, L.L.M.; Lee, K.C.; Ng, W.F.; Lai, S.T.; Leung, C.Y.; Chu, C.M.; Hui, P.K.; Mak, K.L.; Lim, W.; et al. Lung pathology of fatal severe acute respiratory syndrome. Lancet 2003, 361, 1773–1778. [Google Scholar] [CrossRef]
- Odilov, A.; Volkov, A.; Abdullaev, A.; Gasanova, T.; Lipina, T.; Babichenko, I. COVID-19: Multiorgan Dissemination of SARS-CoV-2 Is Driven by Pulmonary Factors. Viruses 2022, 14, 39. [Google Scholar] [CrossRef]
- Song, Z.Q.; Bao, L.L.; Yu, P.; Qi, F.F.; Gong, S.R.; Wang, J.; Zhao, B.B.; Liu, M.Y.; Han, Y.L.; Deng, W.; et al. SARS-CoV-2 Causes a Systemically Multiple Organs Damages and Dissemination in Hamsters. Front. Microbiol. 2021, 11, 3451. [Google Scholar] [CrossRef] [PubMed]
- Teoh, K.T.; Siu, Y.L.; Chan, W.L.; Schluter, M.A.; Liu, C.J.; Peiris, J.S.; Bruzzone, R.; Margolis, B.; Nal, B. The SARS coronavirus E protein interacts with PALS1 and alters tight junction formation and epithelial morphogenesis. Mol. Biol. Cell 2010, 21, 3838–3852. [Google Scholar] [CrossRef] [PubMed]
- Huang, C.; Wang, Y.; Li, X.; Ren, L.; Zhao, J.; Hu, Y.; Zhang, L.; Fan, G.; Xu, J.; Gu, X.; et al. Clinical features of patients infected with 2019 novel coronavirus in Wuhan, China. Lancet 2020, 395, 497–506. [Google Scholar] [CrossRef]
- Nieto-Torres, J.L.; Verdia-Baguena, C.; Jimenez-Guardeno, J.M.; Regla-Nava, J.A.; Castano-Rodriguez, C.; Fernandez-Delgado, R.; Torres, J.; Aguilella, V.M.; Enjuanes, L. Severe acute respiratory syndrome coronavirus E protein transports calcium ions and activates the NLRP3 inflammasome. Virology 2015, 485, 330–339. [Google Scholar] [CrossRef]
- Wang, D.; Hu, B.; Hu, C.; Zhu, F.; Liu, X.; Zhang, J.; Wang, B.; Xiang, H.; Cheng, Z.; Xiong, Y.; et al. Clinical Characteristics of 138 Hospitalized Patients With 2019 Novel Coronavirus-Infected Pneumonia in Wuhan, China. JAMA 2020, 323, 1061–1069. [Google Scholar] [CrossRef]
- Nieto-Torres, J.L.; Dediego, M.L.; Alvarez, E.; Jimenez-Guardeno, J.M.; Regla-Nava, J.A.; Llorente, M.; Kremer, L.; Shuo, S.; Enjuanes, L. Subcellular location and topology of severe acute respiratory syndrome coronavirus envelope protein. Virology 2011, 415, 69–82. [Google Scholar] [CrossRef]
- Yang, Y.; Xiong, Z.; Zhang, S.; Yan, Y.; Nguyen, J.; Ng, B.; Lu, H.; Brendese, J.; Yang, F.; Wang, H.; et al. Bcl-xL inhibits T-cell apoptosis induced by expression of SARS coronavirus E protein in the absence of growth factors. Biochem. J. 2005, 392, 135–143. [Google Scholar] [CrossRef]
- Caillet-Saguy, C.; Durbesson, F.; Rezelj, V.V.; Gogl, G.; Tran, Q.D.; Twizere, J.C.; Vignuzzi, M.; Vincentelli, R.; Wolff, N. Host PDZ-containing proteins targeted by SARS-CoV-2. FEBS J. 2021, 288, 5148–5162. [Google Scholar] [CrossRef]
- Roignot, J.; Peng, X.; Mostov, K. Polarity in Mammalian Epithelial Morphogenesis. Cold Spring Harb. Perspect. Biol. 2013, 5, a013789. [Google Scholar] [CrossRef]
- Linfield, D.T.; Raduka, A.; Aghapour, M.; Rezaee, F. Airway tight junctions as targets of viral infections. Tissue Barriers 2021, 9, 1883965. [Google Scholar] [CrossRef]
- Paradis, T.; Begue, H.; Basmaciyan, L.; Dalle, F.; Bon, F. Tight Junctions as a Key for Pathogens Invasion in Intestinal Epithelial Cells. Int. J. Mol. Sci. 2021, 22, 2506. [Google Scholar] [CrossRef] [PubMed]
- Bilder, D.; Schober, M.; Perrimon, N. Integrated activity of PDZ protein complexes regulates epithelial polarity. Nat. Cell Biol. 2003, 5, 53–58. [Google Scholar] [CrossRef] [PubMed]
- Ivanova, M.E.; Fletcher, G.C.; O’Reilly, N.; Purkiss, A.G.; Thompson, B.J.; McDonald, N.Q. Structures of the human Pals1 PDZ domain with and without ligand suggest gated access of Crb to the PDZ peptide-binding groove. Acta Crystallogr. Sect. D Biol. Crystallogr. 2015, 71, 555–564. [Google Scholar] [CrossRef] [PubMed]
- De Maio, F.; Lo Cascio, E.; Babini, G.; Sali, M.; Della Longa, S.; Tilocca, B.; Roncada, P.; Arcovito, A.; Sanguinetti, M.; Scambia, G.; et al. Improved binding of SARS-CoV-2 Envelope protein to tight junction-associated PALS1 could play a key role in COVID-19 pathogenesis. Microbes Infect. 2020, 22, 592–597. [Google Scholar] [CrossRef]
- Toto, A.; Ma, S.; Malagrino, F.; Visconti, L.; Pagano, L.; Stromgaard, K.; Gianni, S. Comparing the binding properties of peptides mimicking the Envelope protein of SARS-CoV and SARS-CoV-2 to the PDZ domain of the tight junction-associated PALS1 protein. Protein Sci. 2020, 29, 2038–2042. [Google Scholar] [CrossRef]
- Lo Cascio, E.; Toto, A.; Babini, G.; De Maio, F.; Sanguinetti, M.; Mordente, A.; Della Longa, S.; Arcovito, A. Structural determinants driving the binding process between PDZ domain of wild type human PALS1 protein and SLiM sequences of SARS-CoV E proteins. Comput. Struct. Biotechnol. J. 2021, 19, 1838–1847. [Google Scholar] [CrossRef]
- Chai, J.; Cai, Y.; Pang, C.; Wang, L.; McSweeney, S.; Shanklin, J.; Liu, Q. Structural basis for SARS-CoV-2 envelope protein recognition of human cell junction protein PALS1. Nat. Commun. 2021, 12, 3433. [Google Scholar] [CrossRef]
- Javorsky, A.; Humbert, P.O.; Kvansakul, M. Structural basis of coronavirus E protein interactions with human PALS1 PDZ domain. Commun. Biol. 2021, 4, 724. [Google Scholar] [CrossRef]
- Gauthier, J.; Vincent, A.T.; Charette, S.J.; Derome, N. A brief history of bioinformatics. Brief. Bioinform. 2019, 20, 1981–1996. [Google Scholar] [CrossRef]
- Samish, I.; Bourne, P.E.; Najmanovich, R.J. Achievements and challenges in structural bioinformatics and computational biophysics. Bioinformatics 2015, 31, 146–150. [Google Scholar] [CrossRef]
- Pearce, R.; Zhang, Y. Toward the solution of the protein structure prediction problem. J. Biol. Chem. 2021, 297. [Google Scholar] [CrossRef] [PubMed]
- de Lima, T.W.; Caliri, A.; da Silva, F.L.B.; Tinós, R.; Travieso, G.; da Silva, I.N.; Lopes, P.S.; de Souza, E.M.; Delbem, A.C.B.; Bonatto, V. Some modeling issues for protein structure prediction using evolutionary algorithms. In Evolutionary Computation; IntechOpen: London, UK, 2009; pp. 153–178. [Google Scholar] [CrossRef]
- Arbely, E.; Khattari, Z.; Brotons, G.; Akkawi, M.; Salditt, T.; Arkin, I.T. A highly unusual palindromic transmembrane helical hairpin formed by SARS coronavirus E protein. J. Mol. Biol. 2004, 341, 769–779. [Google Scholar] [CrossRef]
- Wu, Q.; Zhang, Y.; Lü, H.; Wang, J.; He, X.; Liu, Y.; Ye, C.; Lin, W.; Hu, J.; Ji, J. The E protein is a multifunctional membrane protein of SARS-CoV. Genom. Proteom. Bioinform. 2003, 1, 131–144. [Google Scholar] [CrossRef]
- Latek, D.; Trzaskowski, B.; Niewieczerzał, S.; Miszta, P.; Młynarczyk, K.; Dębiński, A.; Puławski, W.; Yuan, S.; Sztyler, A.; Orzeł, U. Modeling of Membrane Proteins. In Computational Methods to Study the Structure and Dynamics of Biomolecules and Biomolecular Processes; Springer: Berlin/Heidelberg, Germany, 2019; pp. 371–451. [Google Scholar]
- Duart, G.; Garcia-Murria, M.J.; Grau, B.; Acosta-Caceres, J.M.; Martinez-Gil, L.; Mingarro, I. SARS-CoV-2 envelope protein topology in eukaryotic membranes. Open Biol 2020, 10, 200209. [Google Scholar] [CrossRef] [PubMed]
- Eswar, N.; Eramian, D.; Webb, B.; Shen, M.Y.; Sali, A. Protein structure modeling with MODELLER. Methods Mol. Biol. 2008, 426, 145–159. [Google Scholar] [CrossRef] [PubMed]
- Sali, A.; Blundell, T.L. Comparative protein modelling by satisfaction of spatial restraints. J. Mol. Biol. 1993, 234, 779–815. [Google Scholar] [CrossRef]
- Li, Y.; Surya, W.; Claudine, S.; Torres, J. Structure of a conserved Golgi complex-targeting signal in coronavirus envelope proteins. J. Biol. Chem. 2014, 289, 12535–12549. [Google Scholar] [CrossRef]
- Surya, W.; Li, Y.; Torres, J. Structural model of the SARS coronavirus E channel in LMPG micelles. Biochim. Biophys. Acta Biomembr. 2018, 1860, 1309–1317. [Google Scholar] [CrossRef]
- Laskowski, R.A.; MacArthur, M.W.; Moss, D.S.; Thornton, J.M. PROCHECK: A program to check the stereochemical quality of protein structures. J. Appl. Crystallogr. 1993, 26, 283–291. [Google Scholar] [CrossRef]
- John, B.; Sali, A. Comparative protein structure modeling by iterative alignment, model building and model assessment. Nucleic Acids Res. 2003, 31, 3982–3992. [Google Scholar] [CrossRef]
- Melo, F.; Sanchez, R.; Sali, A. Statistical potentials for fold assessment. Protein Sci. 2002, 11, 430–448. [Google Scholar] [CrossRef] [PubMed]
- Wiederstein, M.; Sippl, M.J. ProSA-web: Interactive web service for the recognition of errors in three-dimensional structures of proteins. Nucleic Acids Res. 2007, 35, W407–W410. [Google Scholar] [CrossRef]
- Sippl, M.J. Recognition of errors in three-dimensional structures of proteins. Proteins 1993, 17, 355–362. [Google Scholar] [CrossRef] [PubMed]
- DeLano, W.L. Pymol: An open-source molecular graphics tool. CCP4 Newsl. Protein Crystallogr. 2002, 40, 82–92. [Google Scholar]
- Dominguez, C.; Boelens, R.; Bonvin, A.M. HADDOCK: A protein-protein docking approach based on biochemical or biophysical information. J. Am. Chem. Soc. 2003, 125, 1731–1737. [Google Scholar] [CrossRef]
- Salentin, S.; Schreiber, S.; Haupt, V.J.; Adasme, M.F.; Schroeder, M. PLIP: Fully automated protein-ligand interaction profiler. Nucleic Acids Res. 2015, 43, W443–W447. [Google Scholar] [CrossRef]
- Burra, P.V.; Zhang, Y.; Godzik, A.; Stec, B. Global distribution of conformational states derived from redundant models in the PDB points to non-uniqueness of the protein structure. Proc. Natl. Acad. Sci. USA 2009, 106, 12560. [Google Scholar] [CrossRef]
- Kufareva, I.; Abagyan, R. Methods of protein structure comparison. Methods Mol. Biol. 2012, 857, 231–257. [Google Scholar] [CrossRef]
- Arnold, K.; Bordoli, L.; Kopp, J.; Schwede, T. The SWISS-MODEL workspace: A web-based environment for protein structure homology modelling. Bioinformatics 2006, 22, 195–201. [Google Scholar] [CrossRef] [PubMed]
- Costanzi, S. On the Applicability of GPCR Homology Models to Computer-Aided Drug Discovery: A Comparison between In Silico and Crystal Structures of the β2-Adrenergic Receptor. J. Med. Chem. 2008, 51, 2907–2914. [Google Scholar] [CrossRef]
- Abraham, M.J.; Murtola, T.; Schulz, R.; Páll, S.; Smith, J.C.; Hess, B.; Lindahl, E. GROMACS: High performance molecular simulations through multi-level parallelism from laptops to supercomputers. SoftwareX 2015, 1–2, 19–25. [Google Scholar] [CrossRef]
- Huang, J.; Rauscher, S.; Nawrocki, G.; Ran, T.; Feig, M.; de Groot, B.L.; Grubmuller, H.; MacKerell, A.D., Jr. CHARMM36m: An improved force field for folded and intrinsically disordered proteins. Nat. Methods 2017, 14, 71–73. [Google Scholar] [CrossRef] [PubMed]
- van Meer, G.; Voelker, D.R.; Feigenson, G.W. Membrane lipids: Where they are and how they behave. Nat. Rev. Mol. Cell Biol. 2008, 9, 112–124. [Google Scholar] [CrossRef] [PubMed]
- Vance, J.E. Thematic review series: Glycerolipids. Phosphatidylserine and phosphatidylethanolamine in mammalian cells: Two metabolically related aminophospholipids. J. Lipid Res. 2008, 49, 1377–1387. [Google Scholar] [CrossRef] [PubMed]
- Das, G.; Das, T.; Chowdhury, N.; Chatterjee, D.; Bagchi, A.; Ghosh, Z. Repurposed drugs and nutraceuticals targeting envelope protein: A possible therapeutic strategy against COVID-19. Genomics 2021, 113, 1129–1140. [Google Scholar] [CrossRef]
- Hu, J.; Ma, A.; Dinner, A.R. Monte Carlo simulations of biomolecules: The MC module in CHARMM. J. Comput. Chem. 2006, 27, 203–216. [Google Scholar] [CrossRef]
- Bussi, G.; Donadio, D.; Parrinello, M. Canonical sampling through velocity rescaling. J. Chem. Phys. 2007, 126, 014101. [Google Scholar] [CrossRef]
- Wong-ekkabut, J.; Karttunen, M. Assessment of Common Simulation Protocols for Simulations of Nanopores, Membrane Proteins, and Channels. J. Chem. Theory Comput. 2012, 8, 2905–2911. [Google Scholar] [CrossRef]
- Parrinello, M.; Rahman, A. Polymorphic transitions in single crystals: A new molecular dynamics method. J. Appl. Phys. 1981, 52, 7182–7190. [Google Scholar] [CrossRef]
- Essmann, U.; Perera, L.; Berkowitz, M.L.; Darden, T.; Lee, H.; Pedersen, L.G. A smooth particle mesh Ewald method. J. Chem. Phys. 1995, 103, 8577–8593. [Google Scholar] [CrossRef]
- Ruch, T.R.; Machamer, C.E. A single polar residue and distinct membrane topologies impact the function of the infectious bronchitis coronavirus E protein. PLoS Pathog. 2012, 8, e1002674. [Google Scholar] [CrossRef] [PubMed]
- Seppälä, S.; Slusky, J.S.; Lloris-Garcerá, P.; Rapp, M.; von Heijne, G. Control of Membrane Protein Topology by a Single C-Terminal Residue. Science 2010, 328, 1698–1700. [Google Scholar] [CrossRef] [PubMed]
- White, C.; Nixon, A.; Bradbury, N.A. Determining Membrane Protein Topology Using Fluorescence Protease Protection (FPP). JoVE 2015, e52509. [Google Scholar] [CrossRef]
- Mandala, V.S.; McKay, M.J.; Shcherbakov, A.A.; Dregni, A.J.; Kolocouris, A.; Hong, M. Structure and drug binding of the SARS-CoV-2 envelope protein transmembrane domain in lipid bilayers. Nat. Struct. Mol. Biol. 2020, 27, 1202–1208. [Google Scholar] [CrossRef]
- Grifoni, A.; Sidney, J.; Zhang, Y.; Scheuermann, R.H.; Peters, B.; Sette, A. A Sequence Homology and Bioinformatic Approach Can Predict Candidate Targets for Immune Responses to SARS-CoV-2. Cell Host Microbe 2020, 27, 671–680.e672. [Google Scholar] [CrossRef] [PubMed]
- Rost, B. Twilight zone of protein sequence alignments. Protein Eng. 1999, 12, 85–94. [Google Scholar] [CrossRef]
- Guruprasad, K. Mutations in human SARS-CoV-2 spike proteins, potential drug binding and epitope sites for COVID-19 therapeutics development. Curr. Res. Struct. Biol. 2022, 4, 41–50. [Google Scholar] [CrossRef]
- Guruprasad, L. Human SARS CoV-2 spike protein mutations. Proteins-Struct. Funct. Bioinform. 2021, 89, 569–576. [Google Scholar] [CrossRef]
- Harvey, W.T.; Carabelli, A.M.; Jackson, B.; Gupta, R.K.; Thomson, E.C.; Harrison, E.M.; Ludden, C.; Reeve, R.; Rambaut, A.; Peacock, S.J.; et al. SARS-CoV-2 variants, spike mutations and immune escape. Nat. Rev. Microbiol. 2021, 19, 409–424. [Google Scholar] [CrossRef]
- Magazine, N.; Zhang, T.Y.; Wu, Y.Y.; McGee, M.C.; Veggiani, G.; Huang, W.S. Mutations and Evolution of the SARS-CoV-2 Spike Protein. Viruses 2022, 14, 640. [Google Scholar] [CrossRef]
- Mohammad, T.; Choudhury, A.; Habib, I.; Asrani, P.; Mathur, Y.; Umair, M.; Anjum, F.; Shafie, A.; Yadav, D.K.; Hassan, M.I. Genomic Variations in the Structural Proteins of SARS-CoV-2 and Their Deleterious Impact on Pathogenesis: A Comparative Genomics Approach. Front. Cell. Infect. Microbiol. 2021, 11, 951. [Google Scholar] [CrossRef] [PubMed]
- Hassan, S.S.; Choudhury, P.P.; Roy, B. SARS-CoV2 envelope protein: Non-synonymous mutations and its consequences. Genomics 2020, 112, 3890–3892. [Google Scholar] [CrossRef] [PubMed]
- Rahman, M.S.; Hoque, M.N.; Islam, M.R.; Islam, I.; Mishu, I.D.; Rahaman, M.M.; Sultana, M.; Hossain, M.A. Mutational insights into the envelope protein of SARS-CoV-2. Gene Rep. 2021, 22, 100997. [Google Scholar] [CrossRef] [PubMed]
- Mercatelli, D.; Giorgi, F.M. Geographic and Genomic Distribution of SARS-CoV-2 Mutations. Front. Microbiol. 2020, 11, 1800. [Google Scholar] [CrossRef] [PubMed]
- Troyano-Hernaez, P.; Reinosa, R.; Holguin, A. Evolution of SARS-CoV-2 Envelope, Membrane, Nucleocapsid, and Spike Structural Proteins from the Beginning of the Pandemic to September 2020: A Global and Regional Approach by Epidemiological Week. Viruses 2021, 13, 243. [Google Scholar] [CrossRef]
- Ahmed-Abakur, E.H.; Alnour, T.M.S. Genetic variations among SARS-CoV-2 strains isolated in China. Gene Rep. 2020, 21. [Google Scholar] [CrossRef]
- Alam, I.; Kamau, A.A.; Kulmanov, M.; Jaremko, L.; Arold, S.T.; Pain, A.; Gojobori, T.; Duarte, C.M. Functional Pangenome Analysis Shows Key Features of E Protein Are Preserved in SARS and SARS-CoV-2. Front. Cell. Infect. Microbiol. 2020, 10, 405. [Google Scholar] [CrossRef]
- Aldaais, E.A.; Yegnaswamy, S.; Albahrani, F.; Alsowaiket, F.; Alramadan, S. Sequence and structural analysis of COVID-19 E and M proteins with MERS virus E and M proteins—A comparative study. Biochem. Biophys. Rep. 2021, 26, 101023. [Google Scholar] [CrossRef]
- Kuzmin, A.; Orekhov, P.; Astashkin, R.; Gordeliy, V.; Gushchin, I. Structure and dynamics of the SARS-CoV-2 envelope protein monomer. Proteins 2022, 90, 1102–1114. [Google Scholar] [CrossRef] [PubMed]
- Hogue, B.G.; Machamer, C.E. Coronavirus Structural Proteins and Virus Assembly. In Nidoviruses; Perlman, S., Gallagher, T., Snijder, E.J., Eds.; ASM Press: Washington, DC, USA, 2007; pp. 179–200. [Google Scholar]
- Sun, S.J.; Karki, C.; Aguilera, J.; Hernandez, A.E.L.; Sun, J.J.; Li, L. Computational Study on the Function of Palmitoylation on the Envelope Protein in SARS-CoV-2. J. Chem. Theory Comput. 2021, 17, 6483–6490. [Google Scholar] [CrossRef]
- Siu, Y.L.; Teoh, K.T.; Lo, J.; Chan, C.M.; Kien, F.; Escriou, N.; Tsao, S.W.; Nicholls, J.M.; Altmeyer, R.; Peiris, J.S.M.; et al. The M, E, and N Structural Proteins of the Severe Acute Respiratory Syndrome Coronavirus Are Required for Efficient Assembly, Trafficking, and Release of Virus-Like Particles. J. Virol. 2008, 82, 11318–11330. [Google Scholar] [CrossRef]
- Torres, J.; Maheswari, U.; Parthasarathy, K.; Ng, L.F.; Liu, D.X.; Gong, X.D. Conductance and amantadine binding of a pore formed by a lysine-flanked transmembrane domain of SARS coronavirus envelope protein. Protein Sci. 2007, 16, 2065–2071. [Google Scholar] [CrossRef] [PubMed]
- Boson, B.; Legros, V.; Zhou, B.J.; Siret, E.; Mathieu, C.; Cosset, F.L.; Lavillette, D.; Denolly, S. The SARS-CoV-2 envelope and membrane proteins modulate maturation and retention of the spike protein, allowing assembly of virus-like particles. J. Biol. Chem. 2021, 296, 100111. [Google Scholar] [CrossRef] [PubMed]
- Verdia-Baguena, C.; Nieto-Torres, J.L.; Alcaraz, A.; DeDiego, M.L.; Torres, J.; Aguilella, V.M.; Enjuanes, L. Coronavirus E protein forms ion channels with functionally and structurally-involved membrane lipids. Virology 2012, 432, 485–494. [Google Scholar] [CrossRef] [PubMed]
- Farsad, K.; Ringstad, N.; Takei, K.; Floyd, S.R.; Rose, K.; De Camilli, P. Generation of high curvature membranes mediated by direct endophilin bilayer interactions. J. Cell Biol. 2001, 155, 193–200. [Google Scholar] [CrossRef] [PubMed]
- Martyna, A.; Bahsoun, B.; Badham, M.D.; Srinivasan, S.; Howard, M.J.; Rossman, J.S. Membrane remodeling by the M2 amphipathic helix drives influenza virus membrane scission. Sci. Rep. 2017, 7, 44695. [Google Scholar] [CrossRef] [PubMed]
- Varkey, J.; Zhang, J.T.; Kim, J.; George, G.; He, G.J.; Belov, G.; Langen, R.; Wang, X.F. An Amphipathic Alpha-Helix Domain from Poliovirus 2C Protein Tubulate Lipid Vesicles. Viruses 2020, 12, 1466. [Google Scholar] [CrossRef]
- Bhatia, V.K.; Madsen, K.L.; Bolinger, P.Y.; Kunding, A.; Hedegard, P.; Gether, U.; Stamou, D. Amphipathic motifs in BAR domains are essential for membrane curvature sensing. EMBO J. 2009, 28, 3303–3314. [Google Scholar] [CrossRef]
- Wang, Z.; Ma, W.; Zheng, X.; Wu, G.; Zhang, R. Household transmission of SARS-CoV-2. J. Infect. 2020, 81, 179–182. [Google Scholar] [CrossRef]
- Wilson-Clark, S.D.; Deeks, S.L.; Gournis, E.; Hay, K.; Bondy, S.; Kennedy, E.; Johnson, I.; Rea, E.; Kuschak, T.; Green, D.; et al. Household transmission of SARS, 2003. CMAJ 2006, 175, 1219–1223. [Google Scholar] [CrossRef]
- Drosten, C.; Meyer, B.; Muller, M.A.; Corman, V.M.; Al-Masri, M.; Hossain, R.; Madani, H.; Sieberg, A.; Bosch, B.J.; Lattwein, E.; et al. Transmission of MERS-coronavirus in household contacts. N. Engl. J. Med. 2014, 371, 828–835. [Google Scholar] [CrossRef] [PubMed]
- Grijalva, C.G.; Rolfes, M.A.; Zhu, Y.; McLean, H.Q.; Hanson, K.E.; Belongia, E.A.; Halasa, N.B.; Kim, A.; Reed, C.; Fry, A.M.; et al. Transmission of SARS-COV-2 Infections in Households—Tennessee and Wisconsin, April-September 2020. MMWR Morb. Mortal. Wkly. Rep. 2020, 69, 1631–1634. [Google Scholar] [CrossRef] [PubMed]
- Killerby, M.E.; Biggs, H.M.; Midgley, C.M.; Gerber, S.I.; Watson, J.T. Middle East Respiratory Syndrome Coronavirus Transmission. Emerg. Infect. Dis. 2020, 26, 191–198. [Google Scholar] [CrossRef] [PubMed]
- Alsaadi, E.A.J.; Jones, I.M. Membrane binding proteins of coronaviruses. Future Virol. 2019, 14, 275–286. [Google Scholar] [CrossRef] [PubMed]
- Bondar, A.N.; White, S.H. Hydrogen bond dynamics in membrane protein function. Biochim. Biophys. Acta (BBA) Biomembr. 2012, 1818, 942–950. [Google Scholar] [CrossRef] [PubMed]
- Aizawa, H. Structural stabilization of polypeptides in a phospholipid bilayer. Trends Res. 2018, 1, 1–2. [Google Scholar] [CrossRef]
- Jacobson, M.P.; Pincus, D.L.; Rapp, C.S.; Day, T.J.F.; Honig, B.; Shaw, D.E.; Friesner, R.A. A hierarchical approach to all-atom protein loop prediction. Proteins-Struct. Funct. Bioinform. 2004, 55, 351–367. [Google Scholar] [CrossRef]
- Leckband, D.; Israelachvili, J. Intermolecular forces in biology. Q. Rev. Biophys. 2001, 34, 105–267. [Google Scholar] [CrossRef]
- Zhu, Y.L.; Alvarez, F.; Wolff, N.; Mechaly, A.; Brule, S.; Neitthoffer, B.; Etienne-Manneville, S.; Haouz, A.; Boeda, B.; Caillet-Saguy, C. Interactions of Severe Acute Respiratory Syndrome Coronavirus 2 Protein E With Cell Junctions and Polarity PSD-95/Dlg/ZO-1-Containing Proteins. Front. Microbiol. 2022, 13, 829094. [Google Scholar] [CrossRef] [PubMed]
- Pace, C.N.; Scholtz, J.M.; Grimsley, G.R. Forces stabilizing proteins. FEBS Lett. 2014, 588, 2177–2184. [Google Scholar] [CrossRef]
- Kangueane, P.; Nilofer, C. Principles of Protein-Protein Interaction. In Protein-Protein and Domain-Domain Interactions; Springer: Singapore, 2018; pp. 93–111. [Google Scholar] [CrossRef]
- Stodola, J.K.; Dubois, G.; Le Coupanec, A.; Desforges, M.; Talbot, P.J. The OC43 human coronavirus envelope protein is critical for infectious virus production and propagation in neuronal cells and is a determinant of neurovirulence and CNS pathology. Virology 2018, 515, 134–149. [Google Scholar] [CrossRef] [PubMed]
- Shepley-McTaggart, A.; Sagum, C.A.; Oliva, I.; Rybakovsky, E.; DiGuilio, K.; Liang, J.; Bedford, M.T.; Cassel, J.; Sudol, M.; Mullin, J.M.; et al. SARS-CoV-2 Envelope (E) protein interacts with PDZ-domain-2 of host tight junction protein ZO1. PLoS ONE 2021, 16, e0251955. [Google Scholar] [CrossRef] [PubMed]
- Alharbi, R.A. Structure insights of SARS-CoV-2 open state envelope protein and inhibiting through active phytochemical of ayurvedic medicinal plants from Withania somnifera. Saudi J. Biol. Sci. 2021, 28, 3594–3601. [Google Scholar] [CrossRef] [PubMed]
- Amberg, A. In Silico Methods. In Drug Discovery and Evaluation: Safety and Pharmacokinetic Assays; Vogel, H.G., Maas, J., Hock, F.J., Mayer, D., Eds.; Springer: Berlin/Heidelberg, Germany, 2013; pp. 1273–1296. [Google Scholar] [CrossRef]
- Bhowmik, D.; Nandi, R.; Jagadeesan, R.; Kumar, N.; Prakash, A.; Kumar, D. Identification of potential inhibitors against SARS-CoV-2 by targeting proteins responsible for envelope formation and virion assembly using docking based virtual screening, and pharmacokinetics approaches. Infect. Genet. Evol. 2020, 84, 104451. [Google Scholar] [CrossRef] [PubMed]
- Breitinger, U.; Ali, N.K.M.; Sticht, H.; Breitinger, H.G. Inhibition of SARS CoV Envelope Protein by Flavonoids and Classical Viroporin Inhibitors. Front. Microbiol. 2021, 12, 692423. [Google Scholar] [CrossRef] [PubMed]
- Dey, D.; Borkotoky, S.; Banerjee, M. In silico identification of Tretinoin as a SARS-CoV-2 envelope (E) protein ion channel inhibitor. Comput. Biol. Med. 2020, 127, 104063. [Google Scholar] [CrossRef]
- Elkhaligy, H.; Balbin, C.A.; Gonzalez, J.L.; Liberatore, T.; Siltberg-Liberles, J. Dynamic, but Not Necessarily Disordered, Human-Virus Interactions Mediated through SLiMs in Viral Proteins. Viruses 2021, 13, 2369. [Google Scholar] [CrossRef]


| HCoVs | Hydrophobic | Hydrogen | Ionic | π-Cation | |||||||||||||
|---|---|---|---|---|---|---|---|---|---|---|---|---|---|---|---|---|---|
| P266 | T270 | V271 | R272 | V284 | V314 | F318 | L321 | L267 | G268 | A269 | T270 | V271 | S281 | R272 | R282 | R272 | |
| 7NTK (8-mer) | none | L74 | V75 | V70 | L74 | L73 P71 | L73 V75 | V75 | V75 | V75 | V75 (×2) | none | L73 (×2) D72 | D72 | D72 | none | none |
| SARS-CoV-1 | V76 (×2) | none | L75 | L74 | none | none | L75 (×2) P72 | L75 | V76 | V76 | V76 | none | L75 | none | D73 | none | none |
| SARS-CoV-2 | none | L74 | V75 | none | L74 | L73 (×2) | L73 | V75 | V75 | V75 | V75 (×2) | D72 | L73 (×2) | D72 | none | D72 | none |
| MERS-CoV | V82 | W81 | none | none | none | P77 E80 | E80 V82 | V82 | V82 | V82 | V82 | none | E80 (×2) | D79 (×2) | D79 | none | none |
| HCoV-229E | F77 | I75 | none | F70 | none | none | F77 | F77 | F77 | F77 | F77 | none | none | none | none | none | F70 |
| HCoV-NL63 | V77 | none | none | none | V77 | none | V74 L75 | none | V77 | V77 | V77 | none | N76 | none | none | none | none |
| HCoVs | Hydrophobic | Hydrogen | Ionic | π-Stacking | ||||||||||||||||||
|---|---|---|---|---|---|---|---|---|---|---|---|---|---|---|---|---|---|---|---|---|---|---|
| P266 | L267 | T270 | V271 | R272 | V284 | V314 | F318 | L321 | P266 | L267 | G268 | A269 | T270 | V271 | R272 | S281 | N315 | R272 | E274 | R282 | F318 | |
| 7NTK (8-mer) | none | none | L74 | V75 | V70 | L74 | L73 P71 | L73 V75 | V75 | none | V75 | V75 | V75 (×2) | none | L73 (×2) D72 | none | D72 | none | D72 | none | none | none |
| SARS-CoV-1 | E69 (×2) | none | L74 | none | none | none | L75 | V76 | none | S68 | E69 | E69 | E69 | none | L75 | none | none | none | none | none | D73 | none |
| SARS-CoV-2 | none | none | L74 | V75 | none | none | L73 | L73 V75 | V75 | none | V75 | V75 | V75 (×2) | D72 | L73 (×2) | none | D72 | none | D72 | R61 | none | none |
| MERS-CoV | V82 | none | none | none | none | none | none | V82 | none | none | V82 | V82 | V82 | none | E80 | P78 | none | none | none | none | none | W81 |
| HCoV-229E | F77 | F77 (×2) | V74 | none | none | none | Y61 (×2) | F77 (×2) | F77 | none | F77 | F77 | F77 | none | Y61 | none | none | I60 Y61 Q62 | none | none | none | Y61 |
| HCoV-NL63 | none | none | none | none | none | none | none | E73 V74 V77 | V77 | none | N76 | N76 | N76 | none | V77 | none | none | none | none | none | none | Y61 |
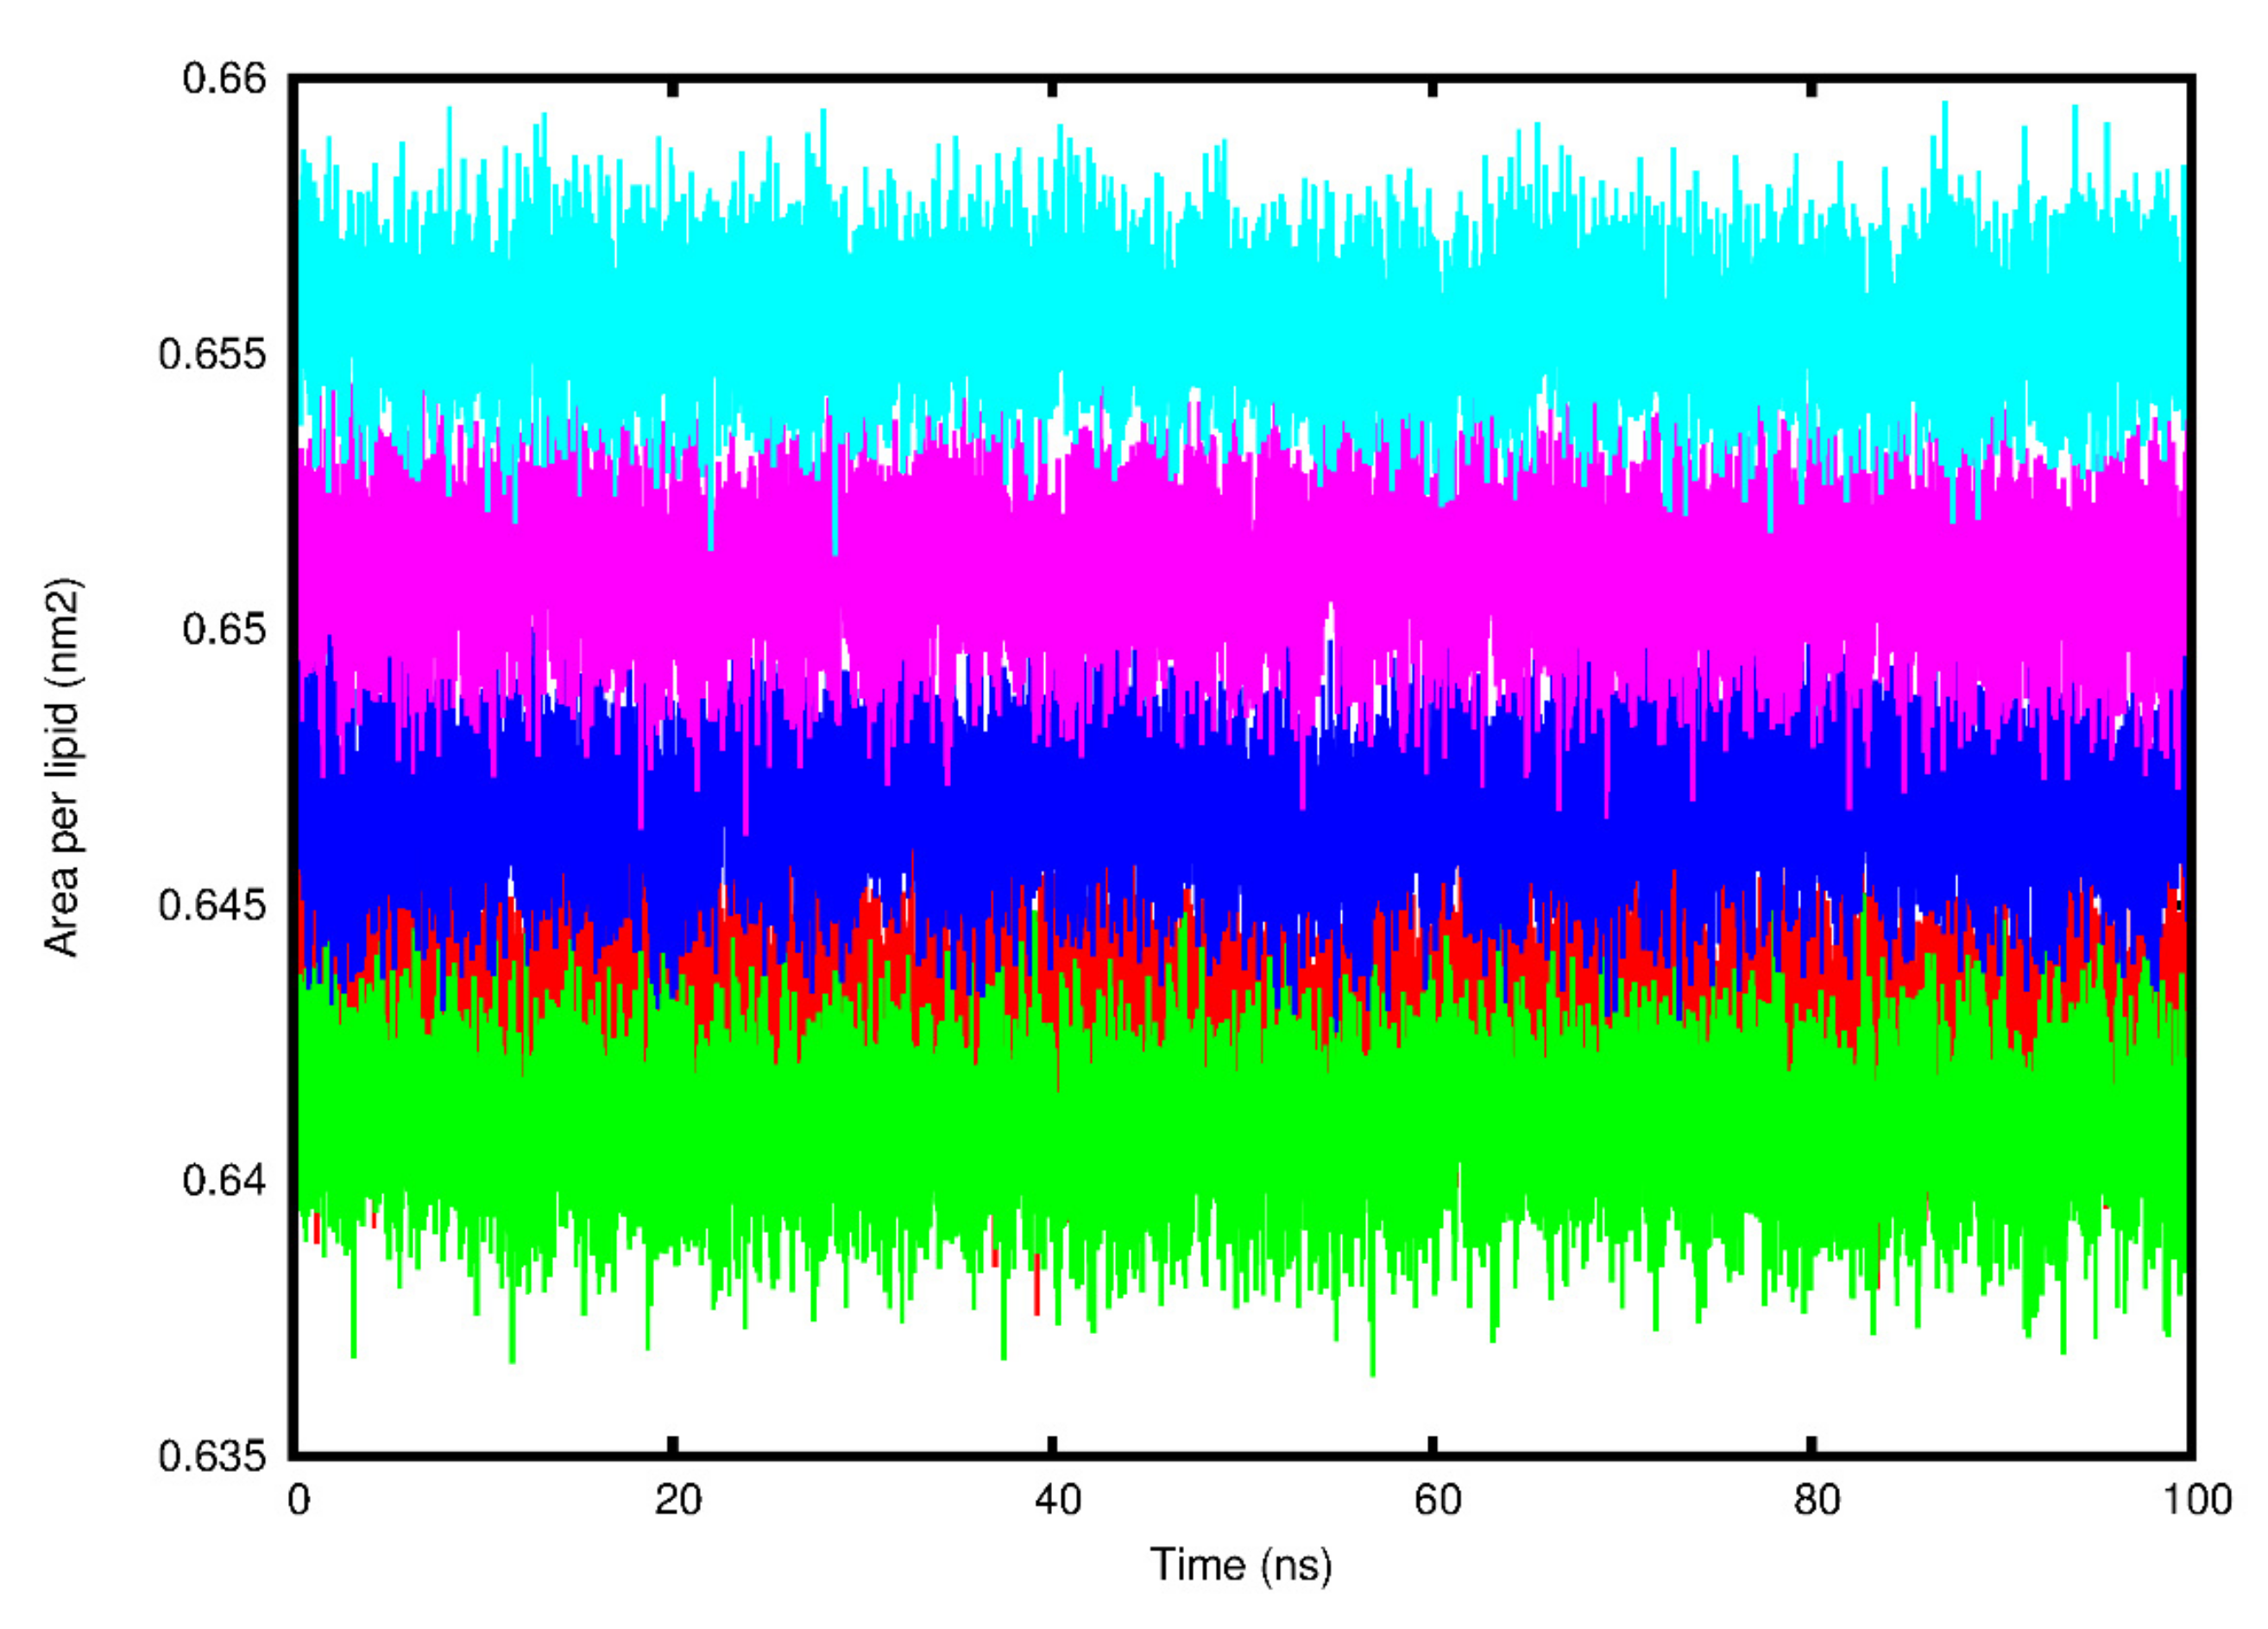
| HCoV E Protein System | Area per Lipid (nm2) | Bilayer Thickness (nm) | Lateral Diffusion Coefficient (cm2/s) | Hydrogen Bonds |
|---|---|---|---|---|
| SARS-CoV-1 | 0.64 ± 0.01 | 4.39 ± 2.87 | 0.37 ± 0.02 | 10.58 |
| SARS-CoV-2 | 0.64 ± 0.01 | 4.25 ± 2.48 | 0.43 ± 0.09 | 13.04 |
| MERS-CoV | 0.66 ± 0.01 | 5.78 ± 3.37 | 0.84 ± 0.01 | 9.22 |
| HCoV-229E | 0.65 ± 0.01 | 4.65 ± 2.71 | 0.46 ± 0.02 | 11.89 |
| HCoV-NL63 | 0.65 ± 0.01 | 4.46 ± 2.60 | 0.34 ± 0.05 | 12.64 |
Publisher’s Note: MDPI stays neutral with regard to jurisdictional claims in published maps and institutional affiliations. |
© 2022 by the authors. Licensee MDPI, Basel, Switzerland. This article is an open access article distributed under the terms and conditions of the Creative Commons Attribution (CC BY) license (https://creativecommons.org/licenses/by/4.0/).
Share and Cite
Schoeman, D.; Cloete, R.; Fielding, B.C. The Flexible, Extended Coil of the PDZ-Binding Motif of the Three Deadly Human Coronavirus E Proteins Plays a Role in Pathogenicity. Viruses 2022, 14, 1707. https://doi.org/10.3390/v14081707
Schoeman D, Cloete R, Fielding BC. The Flexible, Extended Coil of the PDZ-Binding Motif of the Three Deadly Human Coronavirus E Proteins Plays a Role in Pathogenicity. Viruses. 2022; 14(8):1707. https://doi.org/10.3390/v14081707
Chicago/Turabian StyleSchoeman, Dewald, Ruben Cloete, and Burtram C. Fielding. 2022. "The Flexible, Extended Coil of the PDZ-Binding Motif of the Three Deadly Human Coronavirus E Proteins Plays a Role in Pathogenicity" Viruses 14, no. 8: 1707. https://doi.org/10.3390/v14081707
APA StyleSchoeman, D., Cloete, R., & Fielding, B. C. (2022). The Flexible, Extended Coil of the PDZ-Binding Motif of the Three Deadly Human Coronavirus E Proteins Plays a Role in Pathogenicity. Viruses, 14(8), 1707. https://doi.org/10.3390/v14081707