
Role of Genetic Polymorphism Present in Macrophage Activation Syndrome Pathway in Post Mortem Biopsies of Patients with COVID-19

 , , and
Abstract
1. Introduction
2. Materials and Methods
2.1. Study Population
2.2. Genetic Analysis
2.3. Immunohistochemistry Analysis
2.4. Statistical Analysis
3. Results
4. Discussion
Author Contributions
Funding
Institutional Review Board Statement
Informed Consent Statement
Data Availability Statement
Acknowledgments
Conflicts of Interest
References
- de Wilde, A.H.; Snijder, E.J.; Kikkert, M.; van Hemert, M.J. Host Factors in Coronavirus Replication. Curr. Top. Microbiol. Immunol. 2018, 419, 1–42. [Google Scholar] [CrossRef] [PubMed]
- Crayne, C.B.; Albeituni, S.; Nichols, K.E.; Cron, R.Q. The Immunology of Macrophage Activation Syndrome. Front. Immunol. 2019, 10, 1–11. [Google Scholar] [CrossRef] [PubMed]
- Eloseily, E.M.; Cron, R.Q. Macrophage Activation Syndrome BT—The Microbiome in Rheumatic Diseases and Infection. In The Microbiome in Rheumatic Diseases and Infection; Ragab, G., Atkinson, T.P., Stoll, M.L., Eds.; Springer International Publishing: Cham, Switzerland, 2018; pp. 151–182. ISBN 978-3-319-79026-8. [Google Scholar]
- Ponticelli, C.; Alberighi, O.D.C. Haemophagocytic Syndrome—A Life-Threatening Complication of Renal Transplantation. Nephrol. Dial. Transplant. 2009, 24, 2623–2627. [Google Scholar] [CrossRef] [PubMed]
- Janka, G.E.; Lehmberg, K. Hemophagocytic Syndromes—An Update. Blood Rev. 2014, 28, 135–142. [Google Scholar] [CrossRef] [PubMed]
- Ramos-Casals, M.; Brito-Zerón, P.; López-Guillermo, A.; Khamashta, M.A.; Bosch, X. Adult Haemophagocytic Syndrome. Lancet Lond. Engl. 2014, 383, 1503–1516. [Google Scholar] [CrossRef]
- Akenroye, A.T.; Madan, N.; Mohammadi, F.; Leider, J. Hemophagocytic Lymphohistiocytosis Mimics Many Common Conditions: Case Series and Review of Literature. Eur. Ann. Allergy Clin. Immunol. 2017, 49, 31–41. [Google Scholar] [PubMed]
- Ribeiro Dos Santos Miggiolaro, A.F.; da Silva Motta Junior, J.; Busatta Vaz de Paula, C.; Nagashima, S.; Alessandra Scaranello Malaquias, M.; Baena Carstens, L.N.; Moreno-Amaral, A.N.; Baena, C.P.; de Noronha, L. COVID-19 cytokine storm in pulmonary tissue: Anatomopathological and immunohistochemical findings. Respir. Med. Case Rep. 2020, 31, 101292. [Google Scholar] [CrossRef]
- Nagashima, S.; Mendes, M.C.; Camargo Martins, A.P.; Borges, N.H.; Godoy, T.M.; Miggiolaro, A.F.R.D.S.; Dos Santos Dezidério, F.; Machado-Souza, C.; De Noronha, L. Endothelial Dysfunction and Thrombosis in Patients With COVID-19-Brief Report. Arterioscler. Thromb. Vasc. Biol. 2020, 40, 2404–2407. [Google Scholar] [CrossRef]
- Vaz de Paula, C.B.; de Azevedo, M.L.V.; Nagashima, S.; Martins, A.P.C.; Malaquias, M.A.S.; Miggiolaro, A.F.R.D.S.; Júnior, J.D.S.M.; Avelino, G.; Carmo, L.A.P.D.; Carstens, L.B.; et al. IL-4/IL-13 remodeling pathway of COVID-19 lung injury. Sci. Rep. 2020, 10, 18689. [Google Scholar] [CrossRef]
- Zhang, M.; Behrens, E.M.; Atkinson, T.P.; Shakoory, B.; Grom, A.A.; Cron, R.Q. Genetic defects in cytolysis in macrophage activation syndrome. Curr. Rheumatol. Rep. 2014, 16, 439. [Google Scholar] [CrossRef]
- Garzón-Tituaña, M.; Arias, M.A.; Sierra-Monzón, J.L.; Morte-Romea, E.; Santiago, L.; Ramirez-Labrada, A.G.; Martinez-Lostao, L.; Paño-Pardo, J.R.; Galvez, E.M.; Pardo, J. The Multifaceted Function of Granzymes in Sepsis: Some Facts and a Lot to Discover. Front Immunol. 2020, 11, 1054. [Google Scholar] [CrossRef] [PubMed]
- SNPinfo. SNPinfo Web Server. Available online: https://snpinfo.niehs.nih.gov/snpinfo/snptag.html (accessed on 17 October 2021).
- Gustine, J.N.; Jones, D. Immunopathology of Hyperinflammation in COVID-19. Am. J. Pathol. 2021, 191, 4–17. [Google Scholar] [CrossRef] [PubMed]
- Kuri-Cervantes, L.; Pampena, M.B.; Meng, W.; Rosenfeld, A.M.; Ittner, C.A.G.; Weisman, A.R.; Agyekum, R.S.; Mathew, D.; Baxter, A.E.; Vella, L.A.; et al. Comprehensive Mapping of Immune Perturbations Associated with Severe COVID-19. Sci. Immunol. 2020, 5, eabd7114. [Google Scholar] [CrossRef] [PubMed]
- Gómez-rial, J.; Rivero-calle, I.; Salas, A. Role of Monocytes/Macrophages in Covid-19 Pathogenesis: Implications for Therapy. Infect. Drug Resist. 2020, 13, 2485–2493. [Google Scholar] [CrossRef] [PubMed]
- Merad, M.; Martin, J.C. Pathological Inflammation in Patients with COVID-19: A Key Role for Monocytes and Macrophages. Nat. Rev. Immunol. 2020, 20, 355–362. [Google Scholar] [CrossRef]
- Orrù, V.; Steri, M.; Sole, G.; Sidore, C.; Virdis, F.; Dei, M.; Lai, S.; Zoledziewska, M.; Busonero, F.; Mulas, A.; et al. Genetic Variants Regulating Immune Cell Levels in Health and Disease. Cell 2013, 155, 242–256. [Google Scholar] [CrossRef] [PubMed]
- Patin, E.; Hasan, M.; Bergstedt, J.; Rouilly, V.; Libri, V.; Urrutia, A.; Alanio, C.; Scepanovic, P.; Hammer, C.; Jönsson, F.; et al. Publisher Correction: Natural Variation in the Parameters of Innate Immune Cells Is Preferentially Driven by Genetic Factors. Nat. Immunol. 2018, 19, 645. [Google Scholar] [CrossRef]
- Sidore, C.; Orrù, V.; Cocco, E.; Steri, M.; Inshaw, J.R.; Pitzalis, M.; Mulas, A.; McGurnaghan, S.; Frau, J.; Porcu, E.; et al. PRF1 Mutation Alters Immune System Activation, Inflammation, and Risk of Autoimmunity. Mult. Scler. J. 2021, 27, 1332–1340. [Google Scholar] [CrossRef]
- Voskoboinik, I.; Whisstock, J.C.; Trapani, J.A. Perforin and Granzymes: Function, Dysfunction and Human Pathology. Nat. Rev. Immunol. 2015, 15, 388–400. [Google Scholar] [CrossRef]
- Zajac, A.J.; Blattman, J.N.; Murali-Krishna, K.; Sourdive, D.J.; Suresh, M.; Altman, J.D.; Ahmed, R. Viral Immune Evasion Due to Persistence of Activated T Cells without Effector Function. J. Exp. Med. 1998, 188, 2205–2213. [Google Scholar] [CrossRef]
- Kalfaoglu, B.; Almeida-Santos, J.; Tye, C.A.; Satou, Y.; Ono, M. T-Cell Hyperactivation and Paralysis in Severe COVID-19 Infection Revealed by Single-Cell Analysis. Front. Immunol. 2020, 11, 589380. [Google Scholar] [CrossRef]
- Camiña-Tato, M.; Morcillo-Suárez, C.; Bustamante, M.F.; Ortega, I.; Navarro, A.; Muntasell, A.; López-Botet, M.; Sánchez, A.; Carmona, P.; Julià, E.; et al. Gender-Associated Differences of Perforin Polymorphisms in the Susceptibility to Multiple Sclerosis. J. Immunol. 2010, 185, 5392–5404. [Google Scholar] [CrossRef] [PubMed]
- Jaworowska, A.; Pastorczak, A.; Trelinska, J.; Wypyszczak, K.; Borowiec, M.; Fendler, W.; Sedek, L.; Szczepanski, T.; Ploski, R.; Młynarski, W. Perforin Gene Variation Influences Survival in Childhood Acute Lymphoblastic Leukemia. Leuk. Res. 2018, 65, 29–33. [Google Scholar] [CrossRef] [PubMed]
- Zupin, L.; Polesello, V.; Kamada, A.J.; Gratton, R.; Segat, L.; Kuhn, L.; Crovella, S. Perforin Gene PRF1 c.900C> T Polymorphism and HIV-1 Vertical Transmission. Genet. Mol. Biol. 2019, 42, 574–577. [Google Scholar] [CrossRef] [PubMed]
- ClinVar. NCBI Genomic Variation as It Relates to Human Health. Available online: https://www.ncbi.nlm.nih.gov/clinvar/variation/257409 (accessed on 13 October 2021).
- dbSNP. NCBI Reference SNP Report. Available online: https://www.ncbi.nlm.nih.gov/snp/rs885822?horizontal_tab=true (accessed on 15 October 2021).
- Voskoboinik, I.; Sutton, V.R.; Ciccone, A.; House, C.M.; Chia, J.; Darcy, P.K.; Yagita, H.; Trapani, J.A. Perforin Activity and Immune Homeostasis: The Common A91V Polymorphism in Perforin Results in Both Presynaptic and Postsynaptic Defects in Function. Blood 2007, 110, 1184–1190. [Google Scholar] [CrossRef] [PubMed]
- House, I.G.; Thia, K.; Brennan, A.J.; Tothill, R.; Dobrovic, A.; Yeh, W.Z.; Saffery, R.; Chatterton, Z.; Trapani, J.A.; Voskoboinik, I. Heterozygosity for the Common Perforin Mutation, p.A91V, Impairs the Cytotoxicity of Primary Natural Killer Cells from Healthy Individuals. Immunol. Cell Biol. 2015, 93, 575–580. [Google Scholar] [CrossRef] [PubMed]
- Cabrera-Marante, O.; Rodríguez de Frías, E.; Pleguezuelo, D.E.; Allende, L.M.; Serrano, A.; Laguna-Goya, R.; Mancebo, M.E.; Talayero, P.; Álvarez-Vallina, L.; Morales, P.; et al. Perforin Gene Variant A91V in Young Patients with Severe COVID-19. Haematologica 2020, 105, 2844–2846. [Google Scholar] [CrossRef] [PubMed]
- Zhu, G.-H.; Zhang, L.-P.; Li, Z.-G.; Wei, A.; Yang, Y.; Tian, Y.; Ma, H.-H.; Wang, D.; Zhao, X.-X.; Zhao, Y.-Z.; et al. Associations between PRF1 Ala91Val Polymorphism and Risk of Hemophagocytic Lymphohistiocytosis: A Meta-Analysis Based on 1366 Subjects. World J. Pediatr. 2020, 16, 598–606. [Google Scholar] [CrossRef]
- dbSNP. NCBI Reference SNP Report. Available online: https://www.ncbi.nlm.nih.gov/snp/rs2303115?horizontal_tab=true (accessed on 16 October 2021).
- Lopez, J.A.; Noori, T.; Minson, A.; Li Jovanoska, L.; Thia, K.; Hildebrand, M.S.; Akhlaghi, H.; Darcy, P.K.; Kershaw, M.H.; Brown, N.J.; et al. Bi-Allelic Mutations in STXBP2 Reveal a Complementary Role for STXBP1 in Cytotoxic Lymphocyte Killing. Front. Immunol. 2018, 9, 529. [Google Scholar] [CrossRef]
- Benavides, N.; Spessott, W.A.; Sanmillan, M.L.; Vargas, M.; Livingston, M.S.; Erickson, N.; Pozos, T.C.; McCormick, M.E.; Scharrig, E.; Messinger, Y.H.; et al. STXBP2-R190C Variant in a Patient With Neonatal Hemophagocytic Lymphohistiocytosis (HLH) and G6PD Deficiency Reveals a Critical Role of STXBP2 Domain 2 on Granule Exocytosis. Front. Immunol. 2020, 11, 545414. [Google Scholar] [CrossRef]
- Akyol, S.; Ozcan, A.; Sekine, T.; Chiang, S.C.C.; Yilmaz, E.; Karakurkcu, M.; Patiroglu, T.; Bryceson, Y.; Unal, E. Different Clinical Presentation of 3 Children With Familial Hemophagocytic Lymphohistiocytosis With 2 Novel Mutations. J. Pediatr. Hematol. Oncol. 2020, 42, e627–e629. [Google Scholar] [CrossRef] [PubMed]
- Yamada, Y.; Sakuma, J.; Takeuchi, I.; Yasukochi, Y.; Kato, K.; Oguri, M.; Fujimaki, T.; Horibe, H.; Muramatsu, M.; Sawabe, M.; et al. Identification of STXBP2 as a Novel Susceptibility Locus for Myocardial Infarction in Japanese Individuals by an Exome-Wide Association Study. Oncotarget 2017, 8, 33527–33535. [Google Scholar] [CrossRef] [PubMed]
- Van de Vijver, M.J.; Nusse, R. The Molecular Biology of Breast Cancer. Biochim. Biophys. Acta 1991, 1072, 33–50. [Google Scholar] [CrossRef][Green Version]
- Stepp, S.E.; Dufourcq-Lagelouse, R.; Le Deist, F.; Bhawan, S.; Certain, S.; Mathew, P.A.; Henter, J.I.; Bennett, M.; Fischer, A.; de Saint Basile, G.; et al. Perforin Gene Defects in Familial Hemophagocytic Lymphohistiocytosis. Science 1999, 286, 1957–1959. [Google Scholar] [CrossRef]
- Westmeier, J.; Paniskaki, K.; Karaköse, Z.; Werner, T.; Sutter, K.; Dolff, S.; Overbeck, M.; Limmer, A.; Liu, J.; Zheng, X.; et al. Impaired Cytotoxic CD8(+) T Cell Response in Elderly COVID-19 Patients. MBio 2020, 11, e02243-20. [Google Scholar] [CrossRef]
- Otsuka, R.; Seino, K. Macrophage Activation Syndrome and COVID-19. Inflamm. Regen. 2020, 40, 19. [Google Scholar] [CrossRef] [PubMed]
- Ombrello, M.J.; Schulert, G.S. COVID-19 and Cytokine Storm Syndrome: Are There Lessons from Macrophage Activation Syndrome? Transl. Res. 2021, 232, 1–12. [Google Scholar] [CrossRef]


| Variables | COVID-19 (n = 24) | H1N1 (n = 10) | p-Value 1 | Control (n = 10) | p-Value 2 |
|---|---|---|---|---|---|
| Age * | 70.7 ± 13.0 | 41.7 ± 16.0 | 0.000 a | 44.7 ± 12.4 | 0.000 a |
| Gender ** Male | 13 (45.2) | 8 (80.0) | 0.675 b | 7 (70.0) | 1.000 b |
| Female | 11 (45.8) | 2 (20.0) | 3 (30.0) | ||
| Time from hospitalization to death (days) * | 15.2 ± 10.4 | 4.7 ± 6.1 | 0.001 a | 3.8 ± 3.5 | 0.000 a |
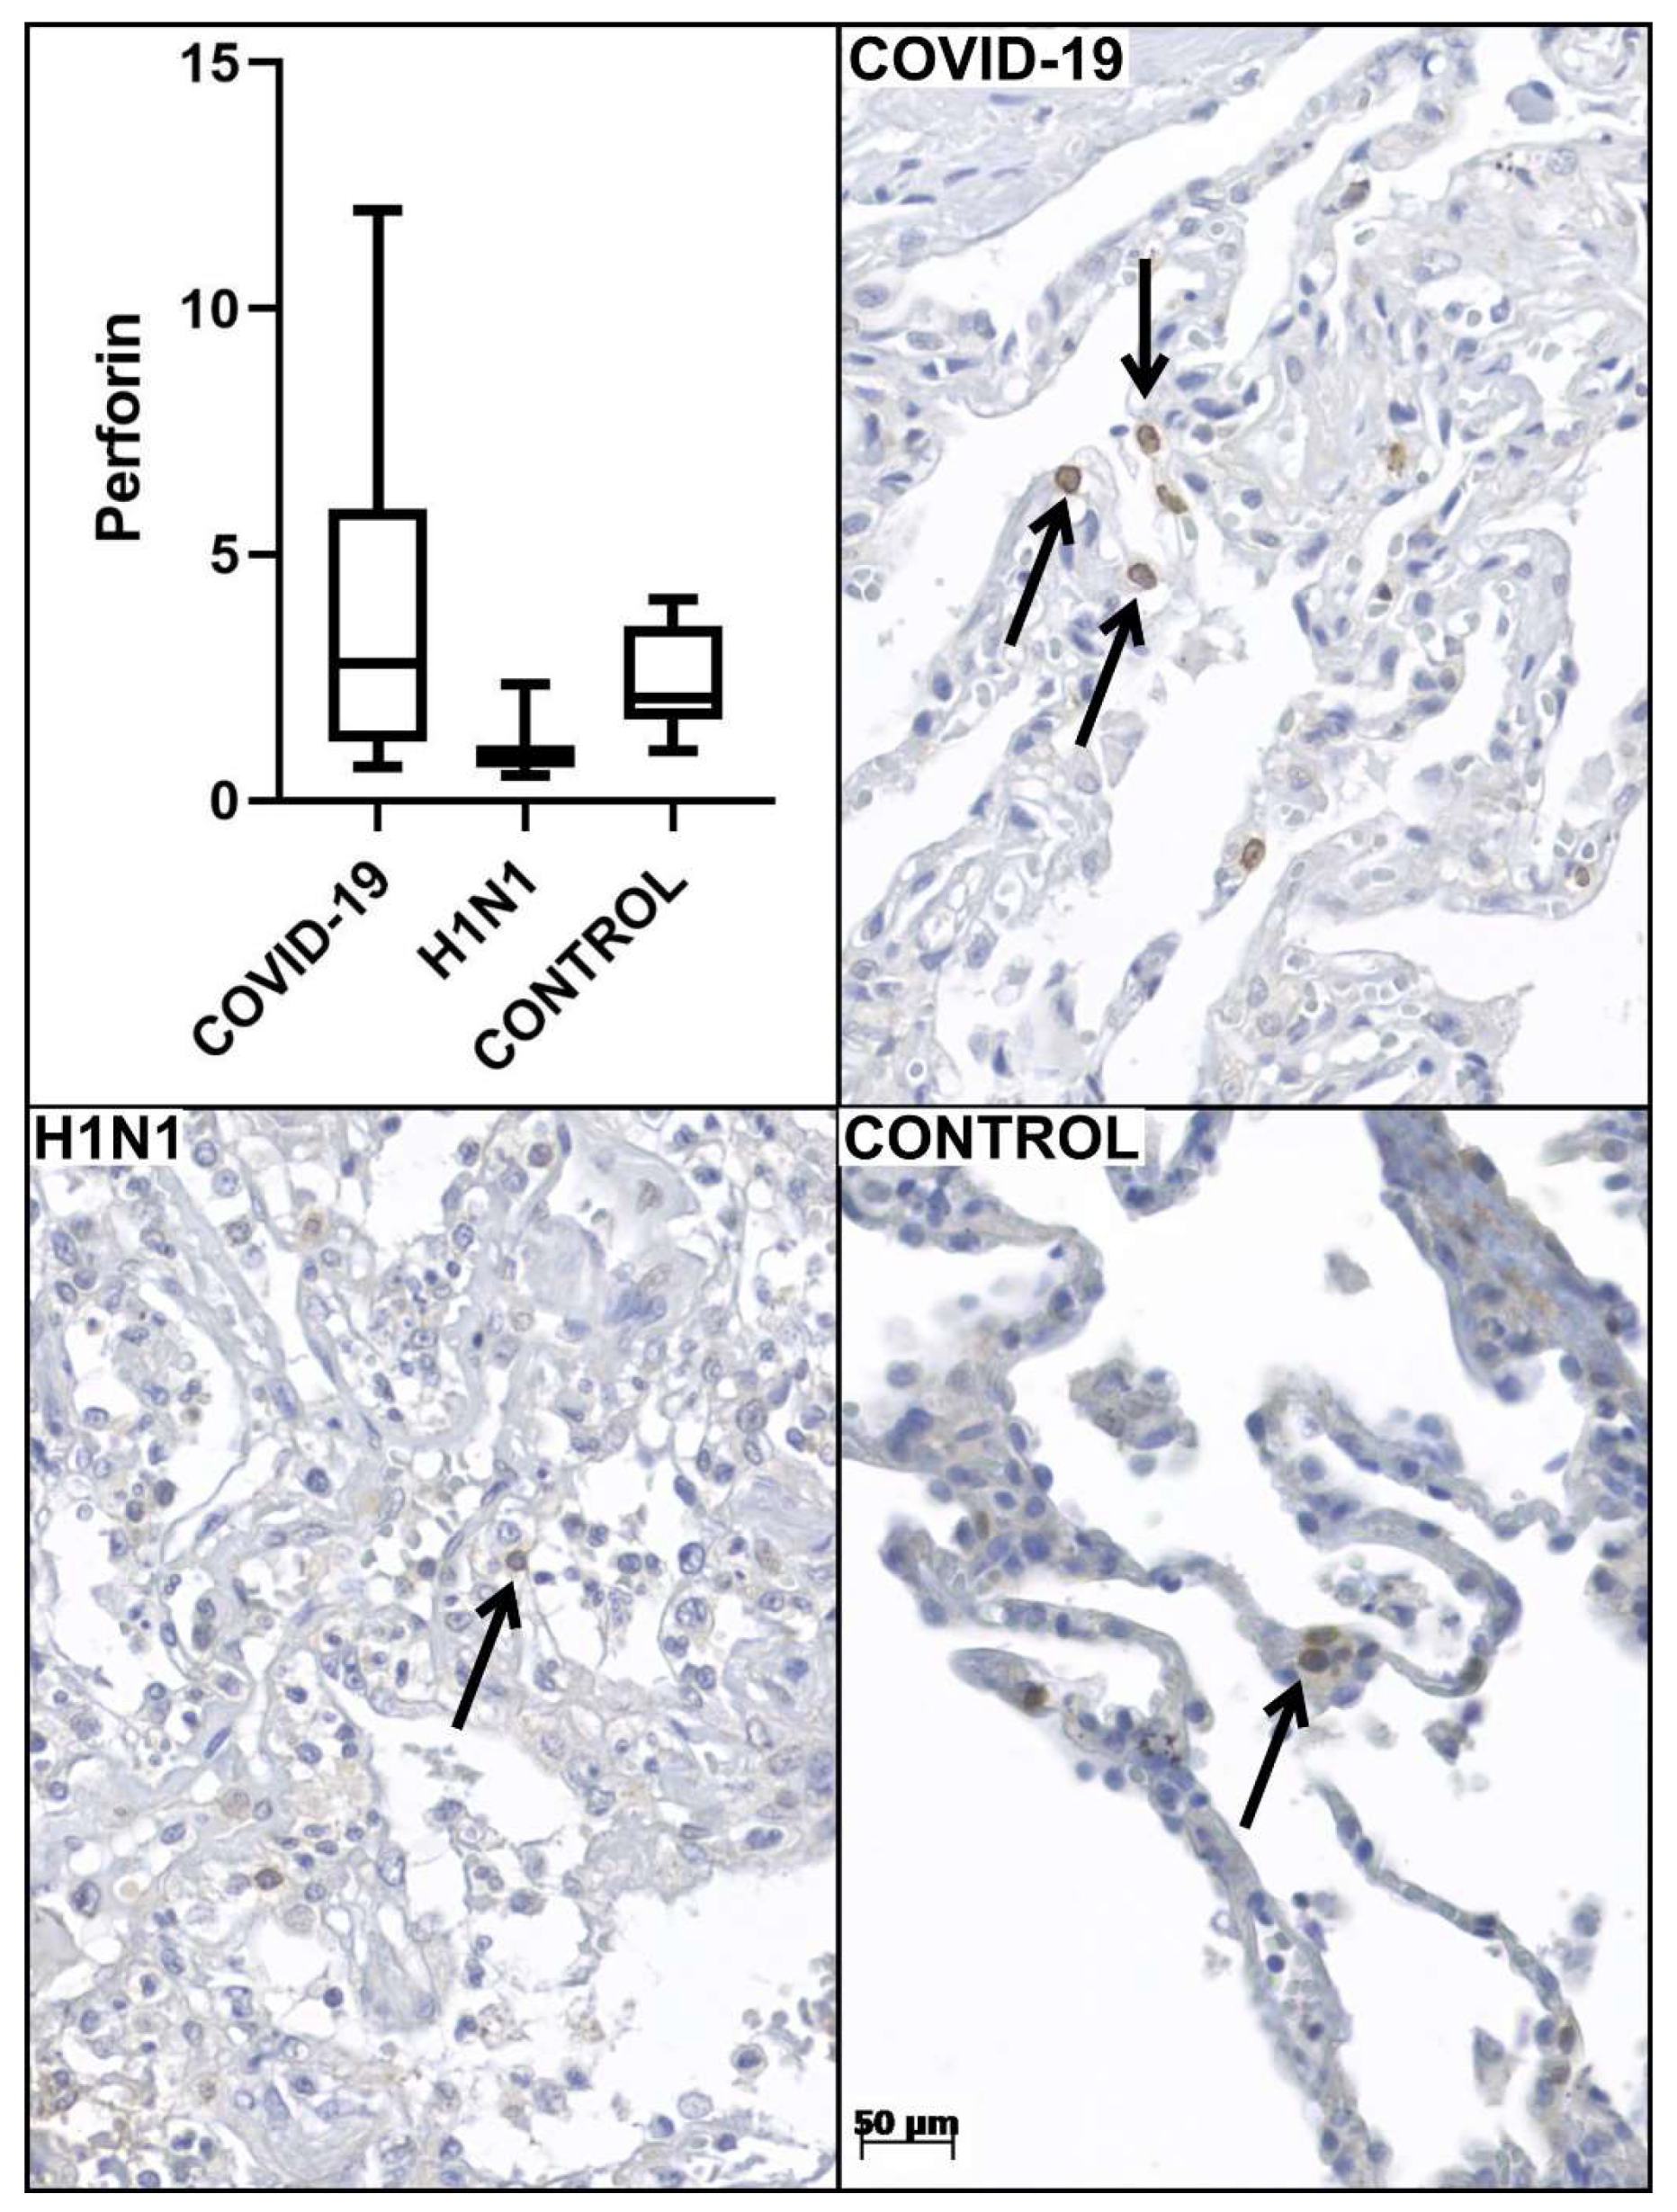
| Perforin tissue expression * | 3.9 ± 3.4 | 1.0 ± 0.5 | 0.000 a | 2.8 ± 1.0 | 0.001 a |
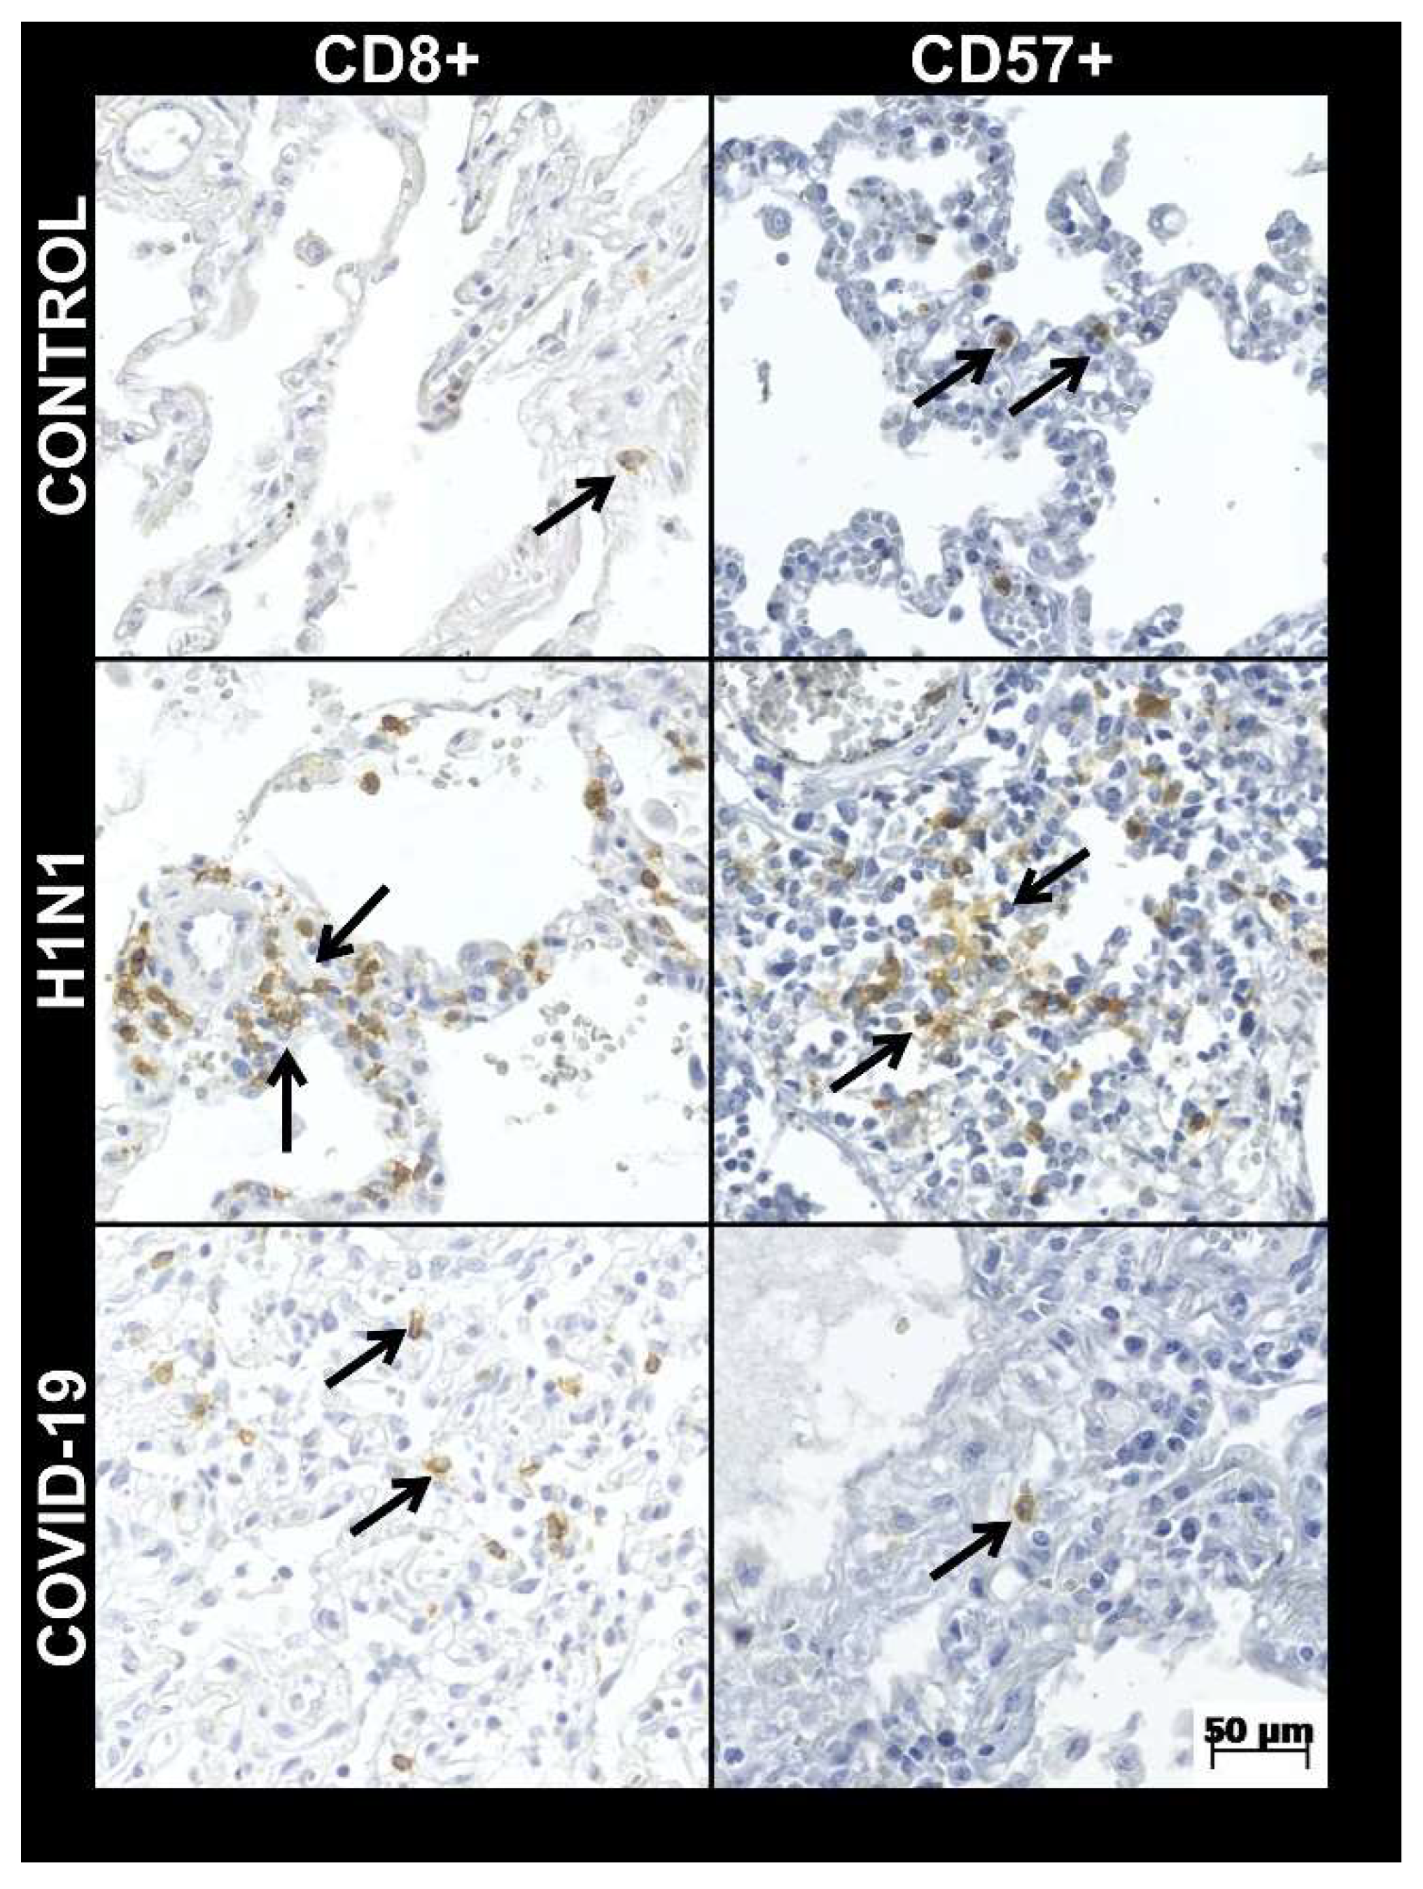
| CD8+ tissue expression * | 19.9 ± 13.8 | 38.3 ± 24.5 | 0.000 a | 10.7 ± 4.6 | 0.000 a |
| CD57+ tissue expression * | 1.3 ± 1.1 | 2.8 ± 1.3 | 0.000 a | 4.7 ± 2.9 | 0.012 a |
| Gene—Reference SNP † Allele Variation [1/2] | Homozygous 1/1 | Heterozygous 1/2 | Homozygous 2/2 | p-Value */** |
|---|---|---|---|---|
| PRF1—rs10999426 [G/A] | GG | GA | AA | |
| COVID-19 | 8 (33.3) | 15 (62.5) | 1 (4.2) | |
| H1N1 | 6 (60.0) | 4 (40.0) | 0 (0.0) | 0.321 * |
| CONTROL | 2 (50.0) | 1 (25.0) | 1 (25.0) | 0.203 ** |
| PRF1—rs885821 [G/A] | GG | GA | AA | |
| COVID-19 | 17 (70.8) | 5 (20.8) | 2 (8.3) | |
| H1N1 | 6 (60.0) | 4 (40.0) | 0 (0.0) | 0.380 * |
| CONTROL | 7 (87.5) | 1 (12.5) | 0 (0.0) | 0.574 ** |
| PRF1—rs885822 [G/A] | GG | GA | AA | |
| COVID-19 | 3 (12.5) | 15 (62.5) | 6 (25.0) | |
| H1N1 | 0 (0.0) | 4 (40.0) | 6 (60.0) | 0.114 * |
| CONTROL | 0 (0.0) | 1 (16.7) | 5 (83.3) | 0.029 ** |
| PRF1—rs35947132 [G/A] | GG | GA | AA | |
| COVID-19 | 20 (83.3) | 4 (16.7) | 0 (0.0) | |
| H1N1 | 10 (100.0) | 0 (0.0) | 0 (0.0) | 0.169 * |
| CONTROL | 9 (100.0) | 0 (0.0) | 0 (0.0) | 0.191 ** |
| STX11—rs7764017 [A/G] | AA | AG | GG | |
| COVID-19 | 11 (45.8) | 11 (45.8) | 2 (8.3) | |
| H1N1 | 5 (50.0) | 5 (50.0) | 0 (0.0) | 0.642 * |
| CONTROL | 1 (100.0) | 0 (0.0) | 0 (0.0) | 0.569 ** |
| STXBP2—rs6791 [A/G] | AA | AG | GG | |
| COVID-19 | 4 (16.7) | 12 (50.0) | 8 (33.3) | |
| H1N1 | 0 (0.0) | 3 (30.0) | 7 (70.0) | 0.108 * |
| CONTROL | 1 (16.7) | 1 (16.7) | 4 (66.7) | 0.277 ** |
| STXBP2—rs2303115 [G/A] | GG | GA | AA | |
| COVID-19 | 11 (45.8) | 10 (41.7) | 3 (12.5) | |
| H1N1 | 2 (22.2) | 1 (11.1) | 6 (66.7) | 0.007 * |
| CONTROL | 0 (0.0) | 0 (0.0) | 1 (100.0) | 0.569 ** |
| UNC13D—rs3744007 [G/A] | GG | GA | AA | |
| COVID-19 | 0 (0.0) | 1 (4.3) | 22 (95.7) | |
| H1N1 | 0 (0.0) | 0 (0.0) | 10 (100.0) | 1.000 * |
| CONTROL | 0 (0.0) | 0 (0.0) | 10 (100.0) | 1.000 ** |
| GZMB—rs6573910 [C/T] | CC | CT | TT | |
| COVID-19 | 5 (20.8) | 13 (54,2) | 6 (25.0) | |
| H1N1 | 1 (10.0) | 6 (60.0) | 3 (30.0) | 0.749 * |
| CONTROL | 2 (66.7) | 0 (0.0) | 1 (33.3) | 0.145 ** |
| Gene Reference SNP † Allele Variation | Models | COVID-19 (n = 24) | H1N1 (n = 10) | p-Value * | CONTROL (n = 10) | p-Value ** | |
|---|---|---|---|---|---|---|---|
| PRF1 | Dom G | GG + GA | 23 (95.8) | 10 (100.0) | 0.512 b | 3 (75.0) | 0.134 b |
| rs10999426 | AA | 1 (4.2) | 0 (0.0) | 1 (25.0) | |||
| G/A | Rec G | AA + GA | 16 (66.7) | 4 (40.0) | 0.150 b | 2 (50.0) | 0.520 b |
| GG | 8 (33.3) | 6 (60.0) | 2 (50.0) | ||||
| PRF1 | Dom G | GG + GA | 22 (91.7) | 10 (100.0) | 0.347 b | 8 (100.0) | 0.399 b |
| rs885821 | AA | 2 (8.3) | 0 (0.0) | 0 (0.0) | |||
| G/A | Rec G | AA + GA | 7 (29.2) | 4 (40.0) | 0.538 b | 1 (12.5) | 0.346 b |
| GG | 17 (70.8) | 6 (60.0) | 7 (87.5) | ||||
| PRF1 | Dom G | GG + GA | 18 (75.0) | 4 (40.0) | 0.112 b | 1 (16.7) | 0.016 b |
| rs885822 | AA | 6 (25.0) | 6 (60.0) | 5 (83.3) | |||
| G/A | Rec G | AA + GA | 21 (87.5) | 10 (100.0) | 0.242 b | 6 (100.0) | 0.361 b |
| GG | 3 (12.5) | 0 (0.0) | 0 (0.0) | ||||
| STX11 | Dom A | AA + AG | 22 (91.7) | 10 (100.0) | 0.347 b | 1 (100.0) | 0.763 b |
| rs7764017 | GG | 2 (8.3) | 0 (0.0) | 0 (0.0) | |||
| A/G | Rec A | GG + AG | 13 (54.2) | 5 (50.0) | 0.824 a | 0 (0.0) | 0.288 b |
| AA | 11 (45.8) | 5 (50.0) | 1 (100.0) | ||||
| STXBP2 | Dom A | AA + AG | 16 (66.7) | 3 (30.0) | 0.068 b | 2 (33.3) | 0.136 b |
| rs6791 | GG | 8 (33.3) | 7 (70.0) | 4 (66.7) | |||
| A/G | Rec A | GG + AG | 20 (83.3) | 10 (100.0) | 0.169 b | 5 (83.3) | 1.000 b |
| AA | 4 (16.7) | 0 (0.0) | 1 (16.7) | ||||
| STXBP2 | Dom G | GG + GA | 21 (87.5) | 3 (33.3) | 0.005 b | 1 (100.0) | 0.706 b |
| rs2303115 | AA | 3 (12.5) | 6 (66.7) | 0 (0.0) | |||
| G/A | Rec G | AA + GA | 13 (54.2) | 7 (77.8) | 0.216 b | 0 (0.0) | 0.288 b |
| GG | 11 (45.8) | 2 (22.2) | 1 (100.0) | ||||
| GZMB | Dom C | CC + CT | 18 (75.0) | 7 (70.0) | 0.763 b | 2 (66.7) | 0.756 b |
| rs6573910 | TT | 6 (25.5) | 3 (30.0) | 1 (33.3) | |||
| C/T | Rec C | TT + TC | 19 (79.2) | 9 (90.0) | 0.450 b | 1 (33.3) | 0.156 b |
| CC | 5 (20.8) | 1 (10.0) | 2 (66.7) |
| Reference SNP † and Allele Variation [1/2] | Homozygous 1/1 | Heterozygous 1/2 | Homozygous 2/2 |
|---|---|---|---|
| rs10999426 [G/A] | GG | GA | AA |
| COVID-19 * | 1.26 ± 0.70 | 4.72 ± 3.58 | NA |
| H1N1 * | 1.20 ± 0.62 | 0.75 ± 0.14 | NA |
| rs885821 [G/A] | GG | GA | AA |
| COVID-19 * | 4.06 ± 3.69 | 2.24 ± 1.24 | 0.75 ± 0.28 |
| H1N1* | 1.06 ± 0.65 | 0.96 ± 0.35 | NA |
| rs885822 [G/A] | GG | GA | AA |
| COVID-19 * | 4.40 ± 6.27 | 4.06 ± 3.09 | 1.28 ± 0.83 |
| H1N1 * | NA | 0.75 ± 0.14 | 1.20 ± 0.62 |
| rs35947132 [G/A] | GG | GA | AA |
| COVID-19 * | 2.53 ± 2.68 | 7.78 ± 2.84 | NA |
| H1N1 * | 1.02 ± 0.52 | NA | NA |
Publisher’s Note: MDPI stays neutral with regard to jurisdictional claims in published maps and institutional affiliations. |
© 2022 by the authors. Licensee MDPI, Basel, Switzerland. This article is an open access article distributed under the terms and conditions of the Creative Commons Attribution (CC BY) license (https://creativecommons.org/licenses/by/4.0/).
Share and Cite
Zanchettin, A.C.; Barbosa, L.V.; Dutra, A.A.; Prá, D.M.M.; Pereira, M.R.C.; Stocco, R.B.; Martins, A.P.C.; Vaz de Paula, C.B.; Nagashima, S.; de Noronha, L.; et al. Role of Genetic Polymorphism Present in Macrophage Activation Syndrome Pathway in Post Mortem Biopsies of Patients with COVID-19. Viruses 2022, 14, 1699. https://doi.org/10.3390/v14081699
Zanchettin AC, Barbosa LV, Dutra AA, Prá DMM, Pereira MRC, Stocco RB, Martins APC, Vaz de Paula CB, Nagashima S, de Noronha L, et al. Role of Genetic Polymorphism Present in Macrophage Activation Syndrome Pathway in Post Mortem Biopsies of Patients with COVID-19. Viruses. 2022; 14(8):1699. https://doi.org/10.3390/v14081699
Chicago/Turabian StyleZanchettin, Aline Cristina, Leonardo Vinicius Barbosa, Anderson Azevedo Dutra, Daniele Margarita Marani Prá, Marcos Roberto Curcio Pereira, Rebecca Benicio Stocco, Ana Paula Camargo Martins, Caroline Busatta Vaz de Paula, Seigo Nagashima, Lucia de Noronha, and et al. 2022. "Role of Genetic Polymorphism Present in Macrophage Activation Syndrome Pathway in Post Mortem Biopsies of Patients with COVID-19" Viruses 14, no. 8: 1699. https://doi.org/10.3390/v14081699
APA StyleZanchettin, A. C., Barbosa, L. V., Dutra, A. A., Prá, D. M. M., Pereira, M. R. C., Stocco, R. B., Martins, A. P. C., Vaz de Paula, C. B., Nagashima, S., de Noronha, L., & Machado-Souza, C. (2022). Role of Genetic Polymorphism Present in Macrophage Activation Syndrome Pathway in Post Mortem Biopsies of Patients with COVID-19. Viruses, 14(8), 1699. https://doi.org/10.3390/v14081699