
HIV-1 Nucleocapsid Protein Binds Double-Stranded DNA in Multiple Modes to Regulate Compaction and Capsid Uncoating

 , , and
Abstract
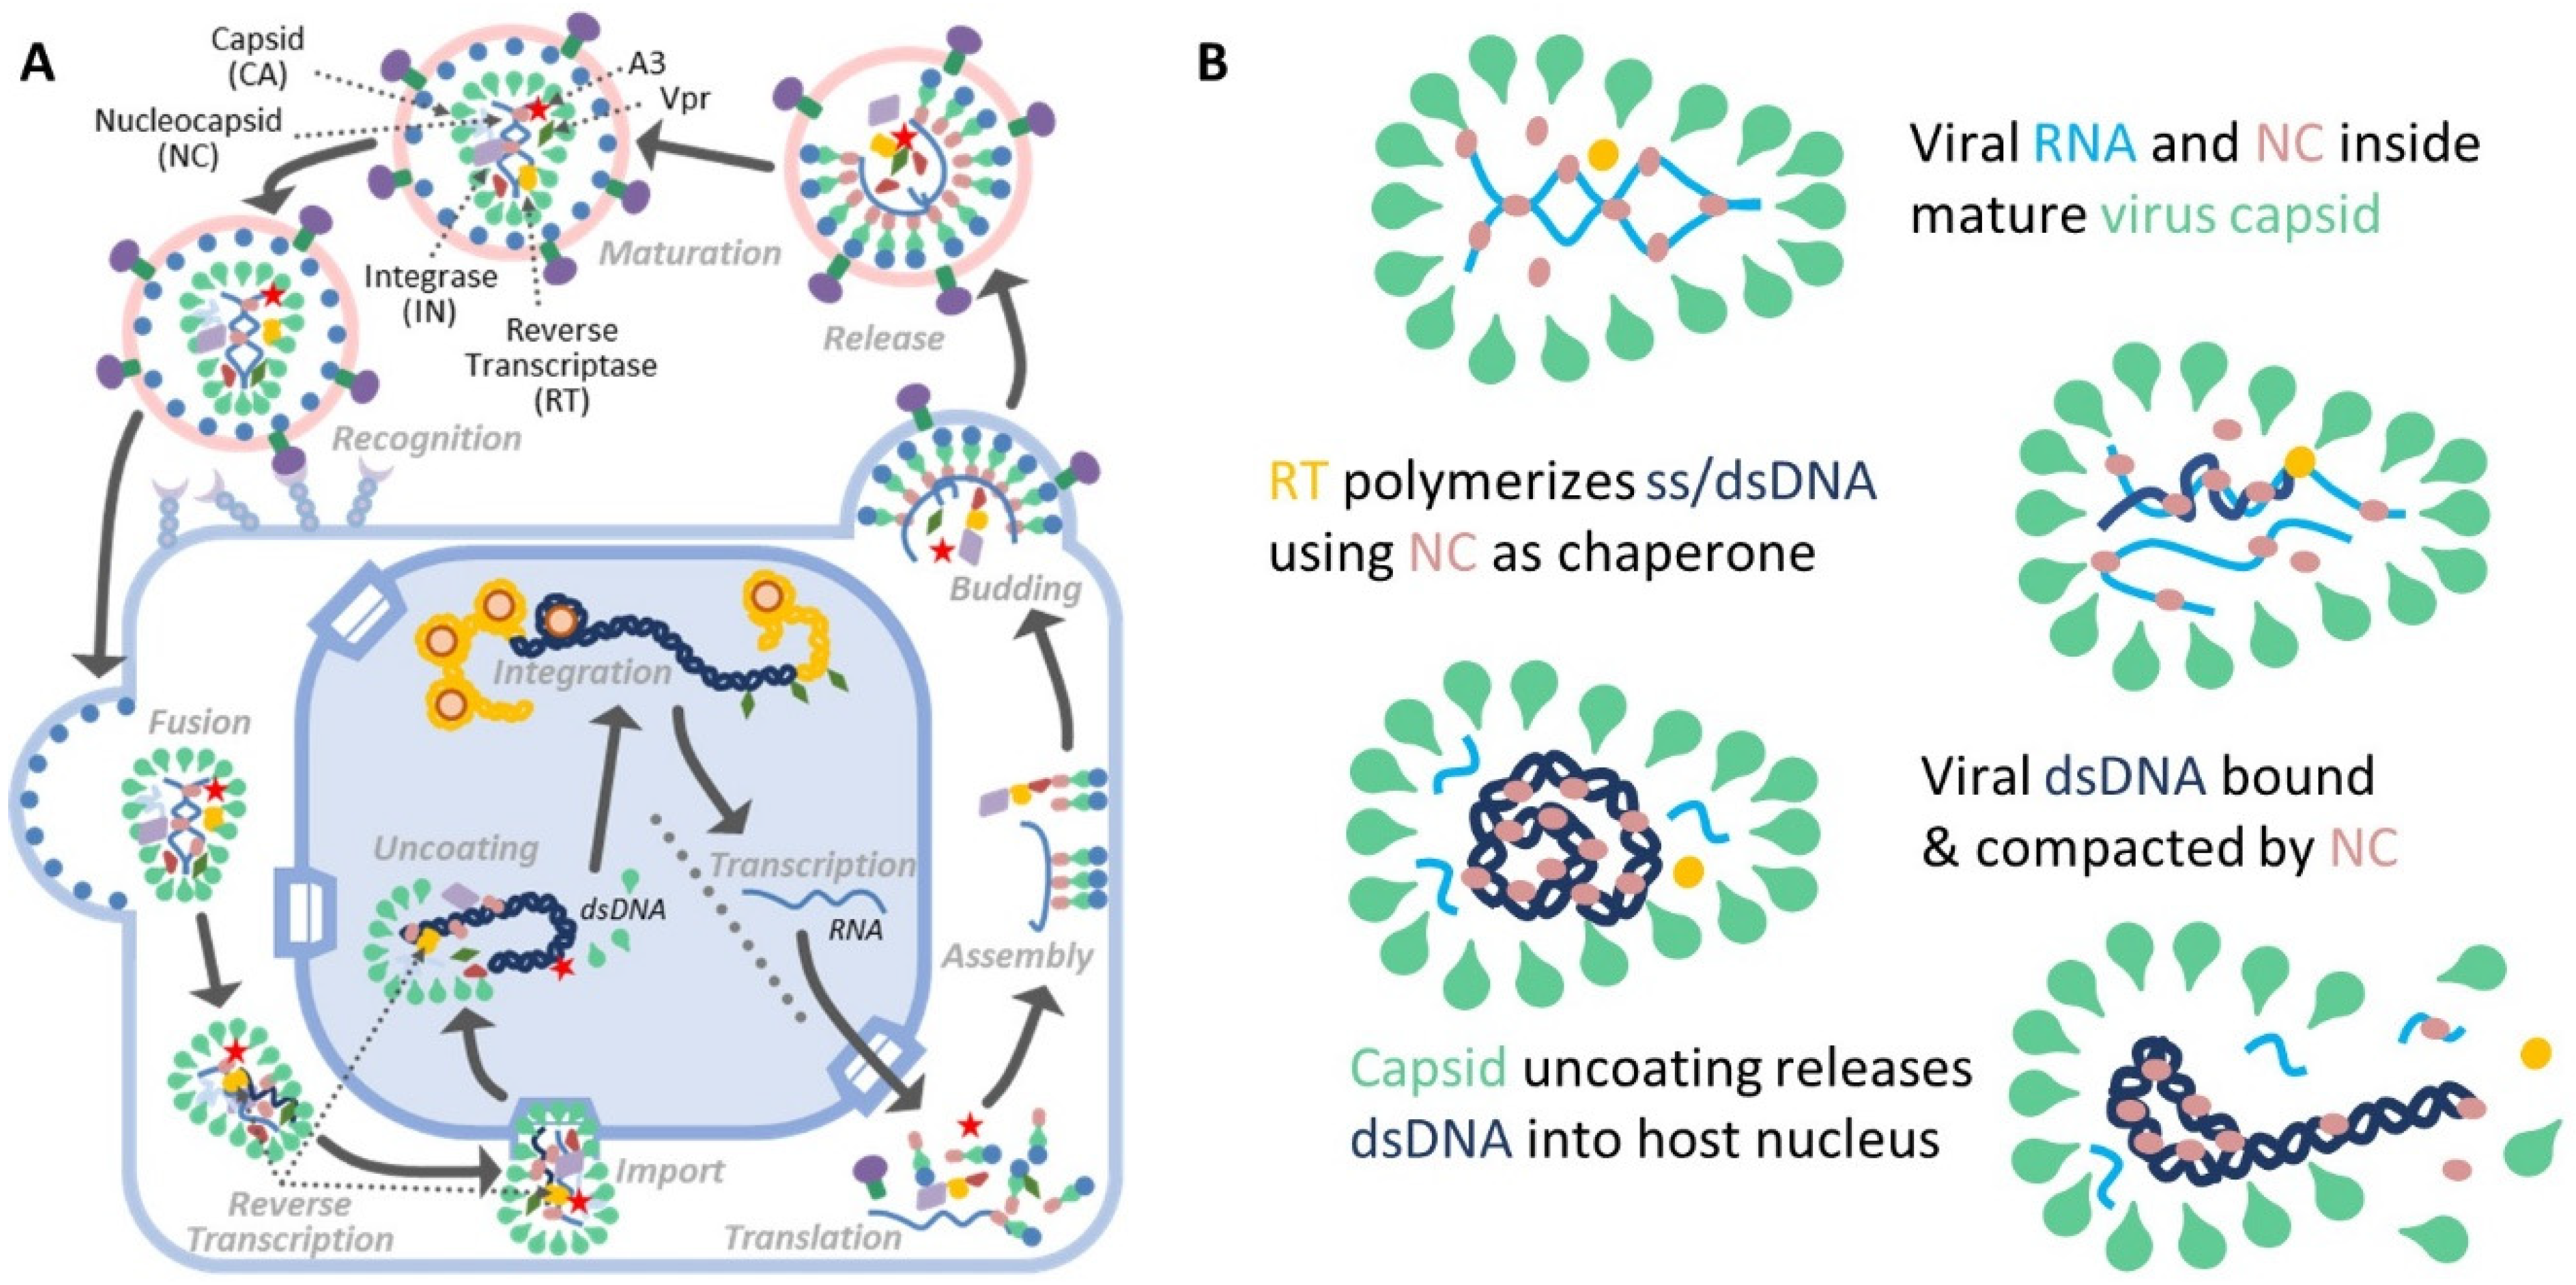
1. Introduction
2. Materials and Methods
2.1. Protein Purification and DNA Substrate
2.2. Optical Tweezers
2.3. AFM Imaging
3. Results
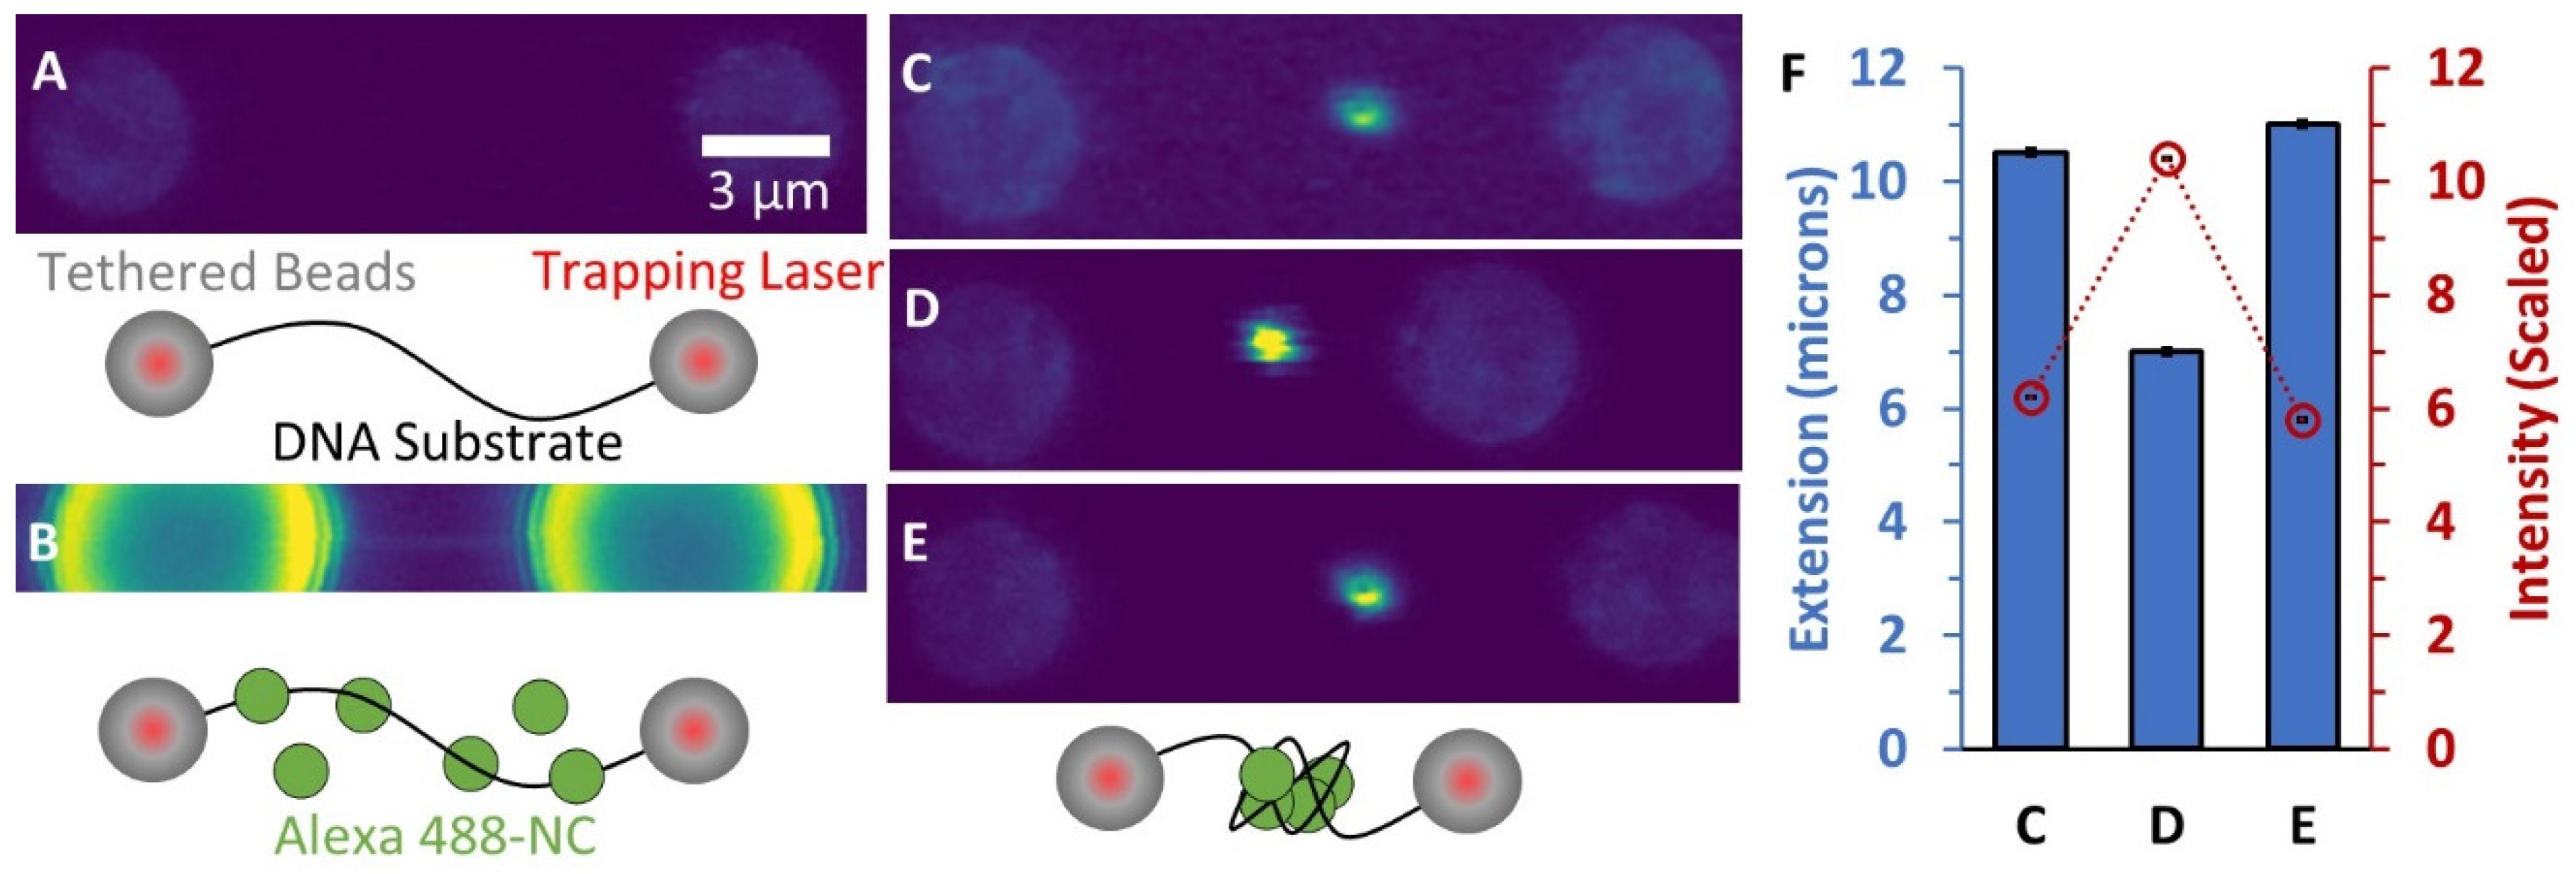
3.1. Incubation of a Single Long DNA Molecule with Fluorescently-Labeled NC Reveals a Bright, Condensed Globule
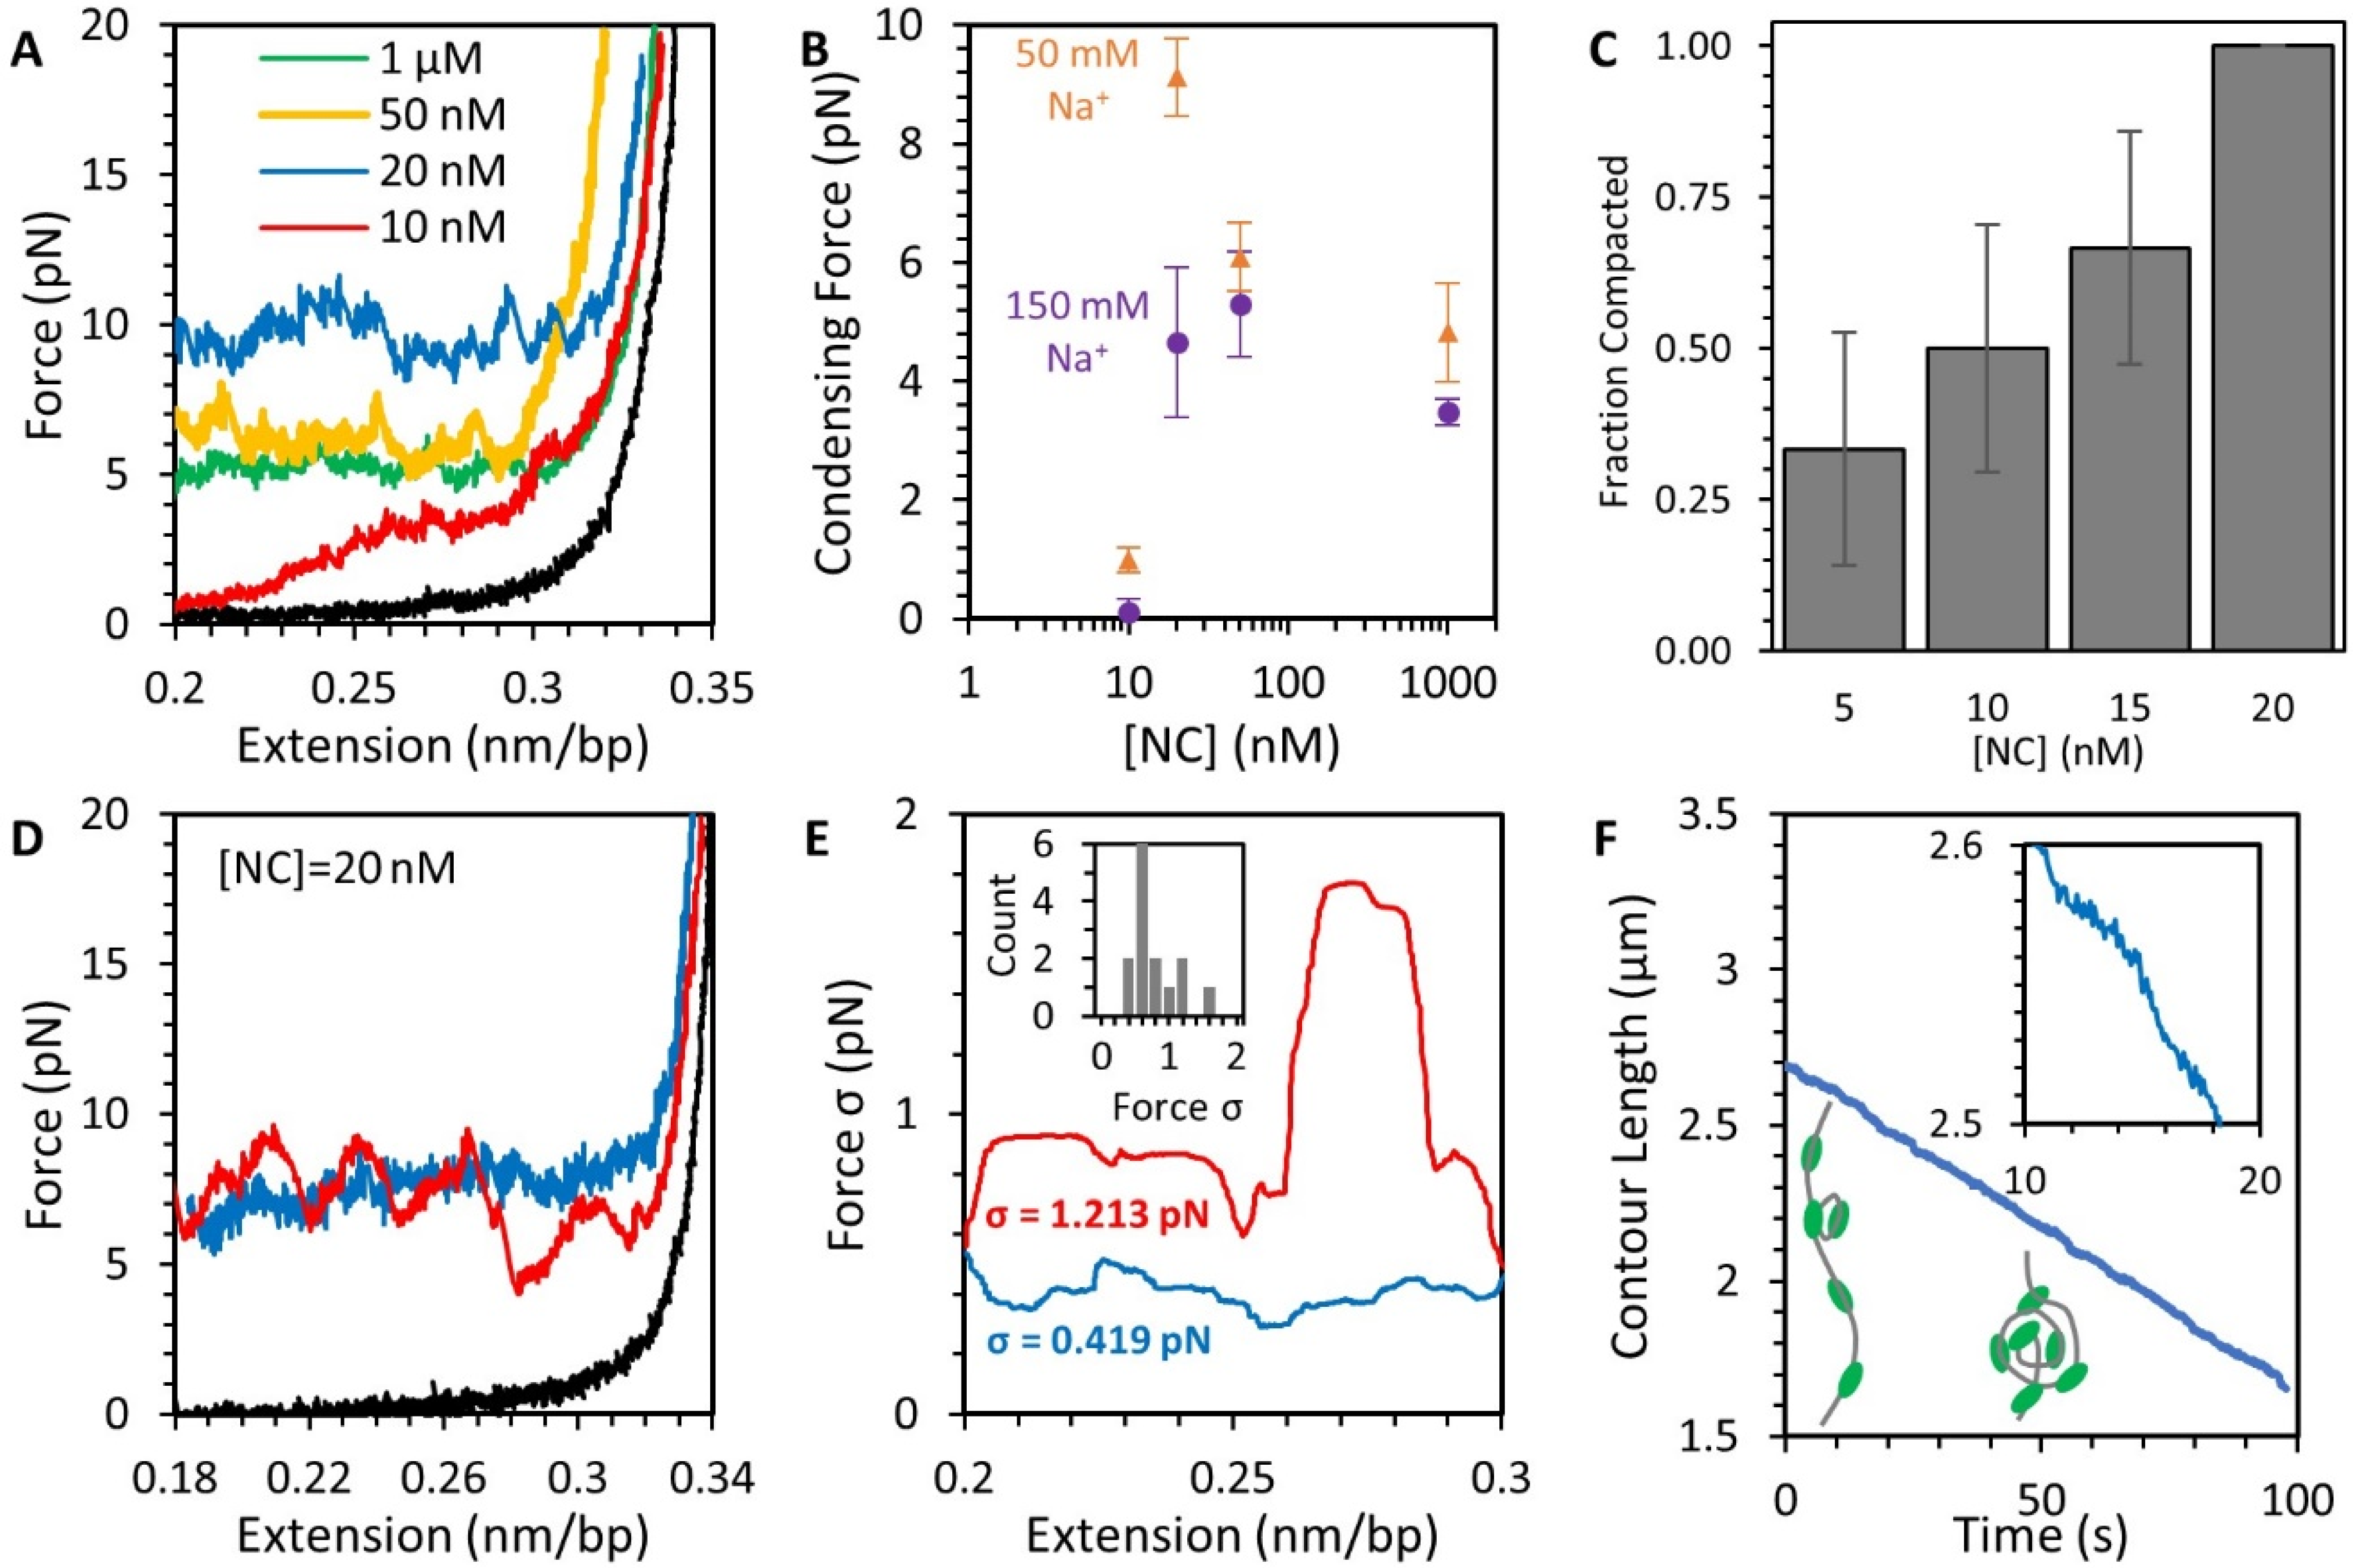
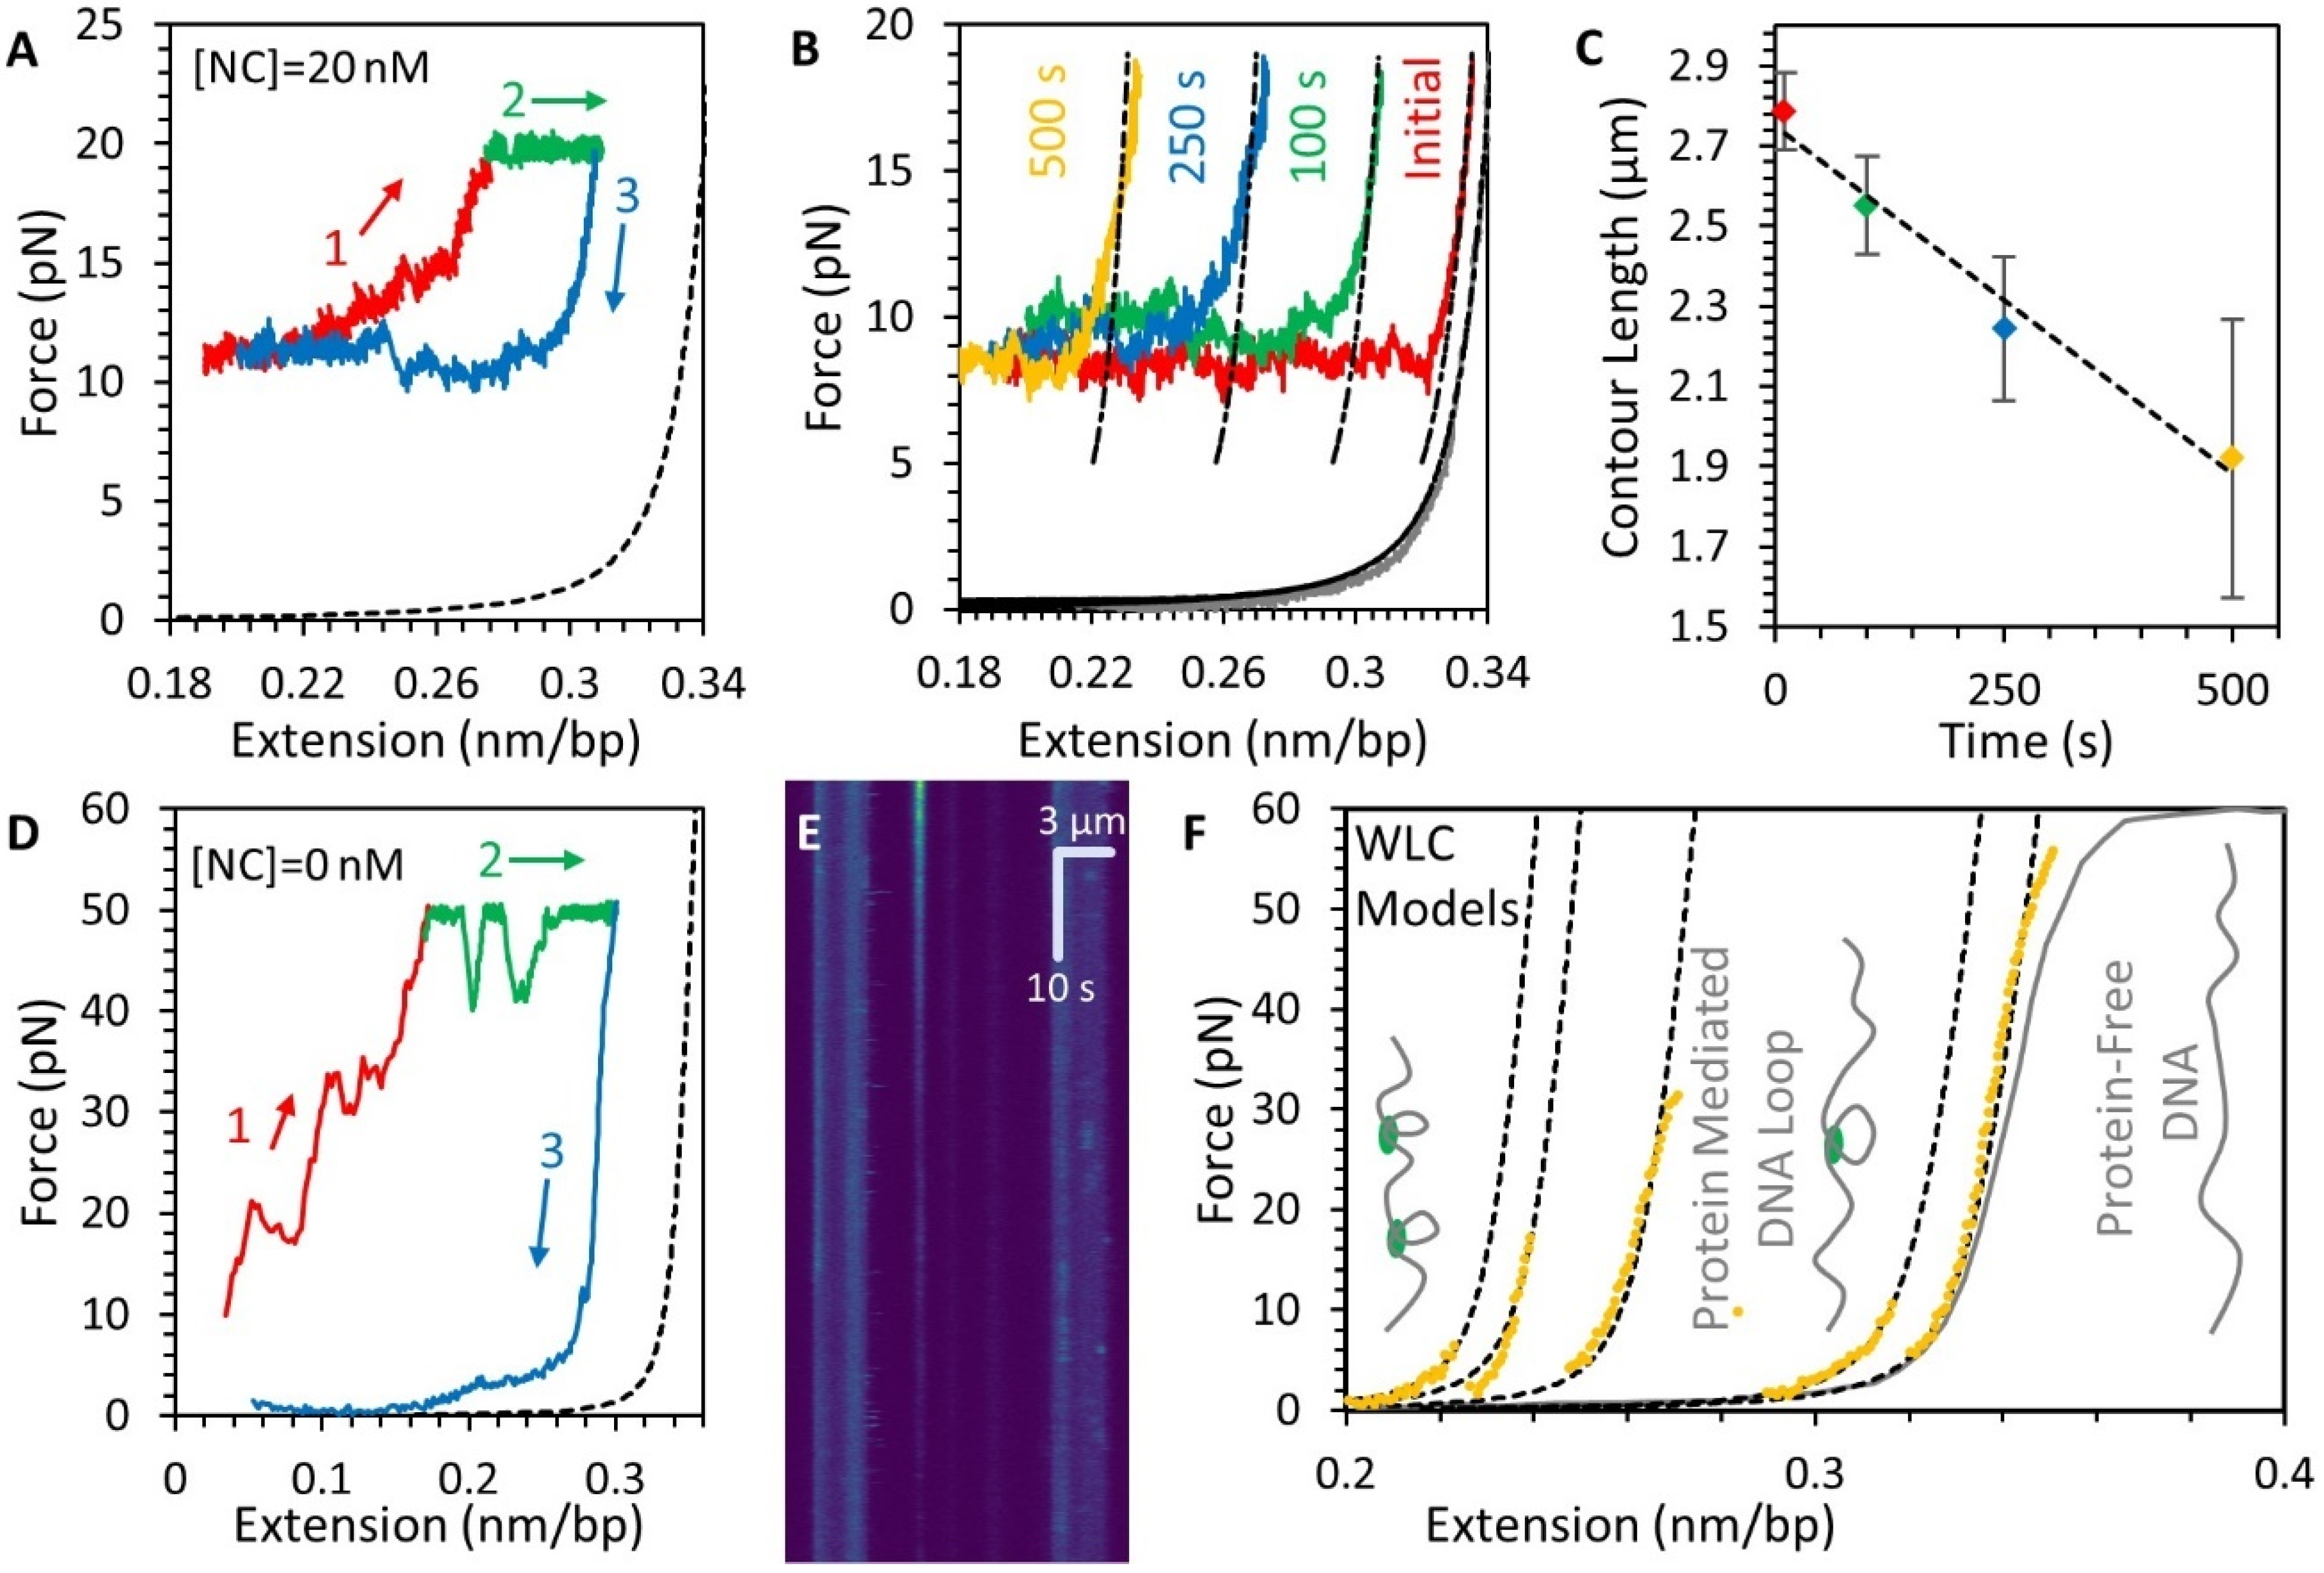
3.2. Force-Extension Measurements Determine the Conformation of DNA-NC Complexes
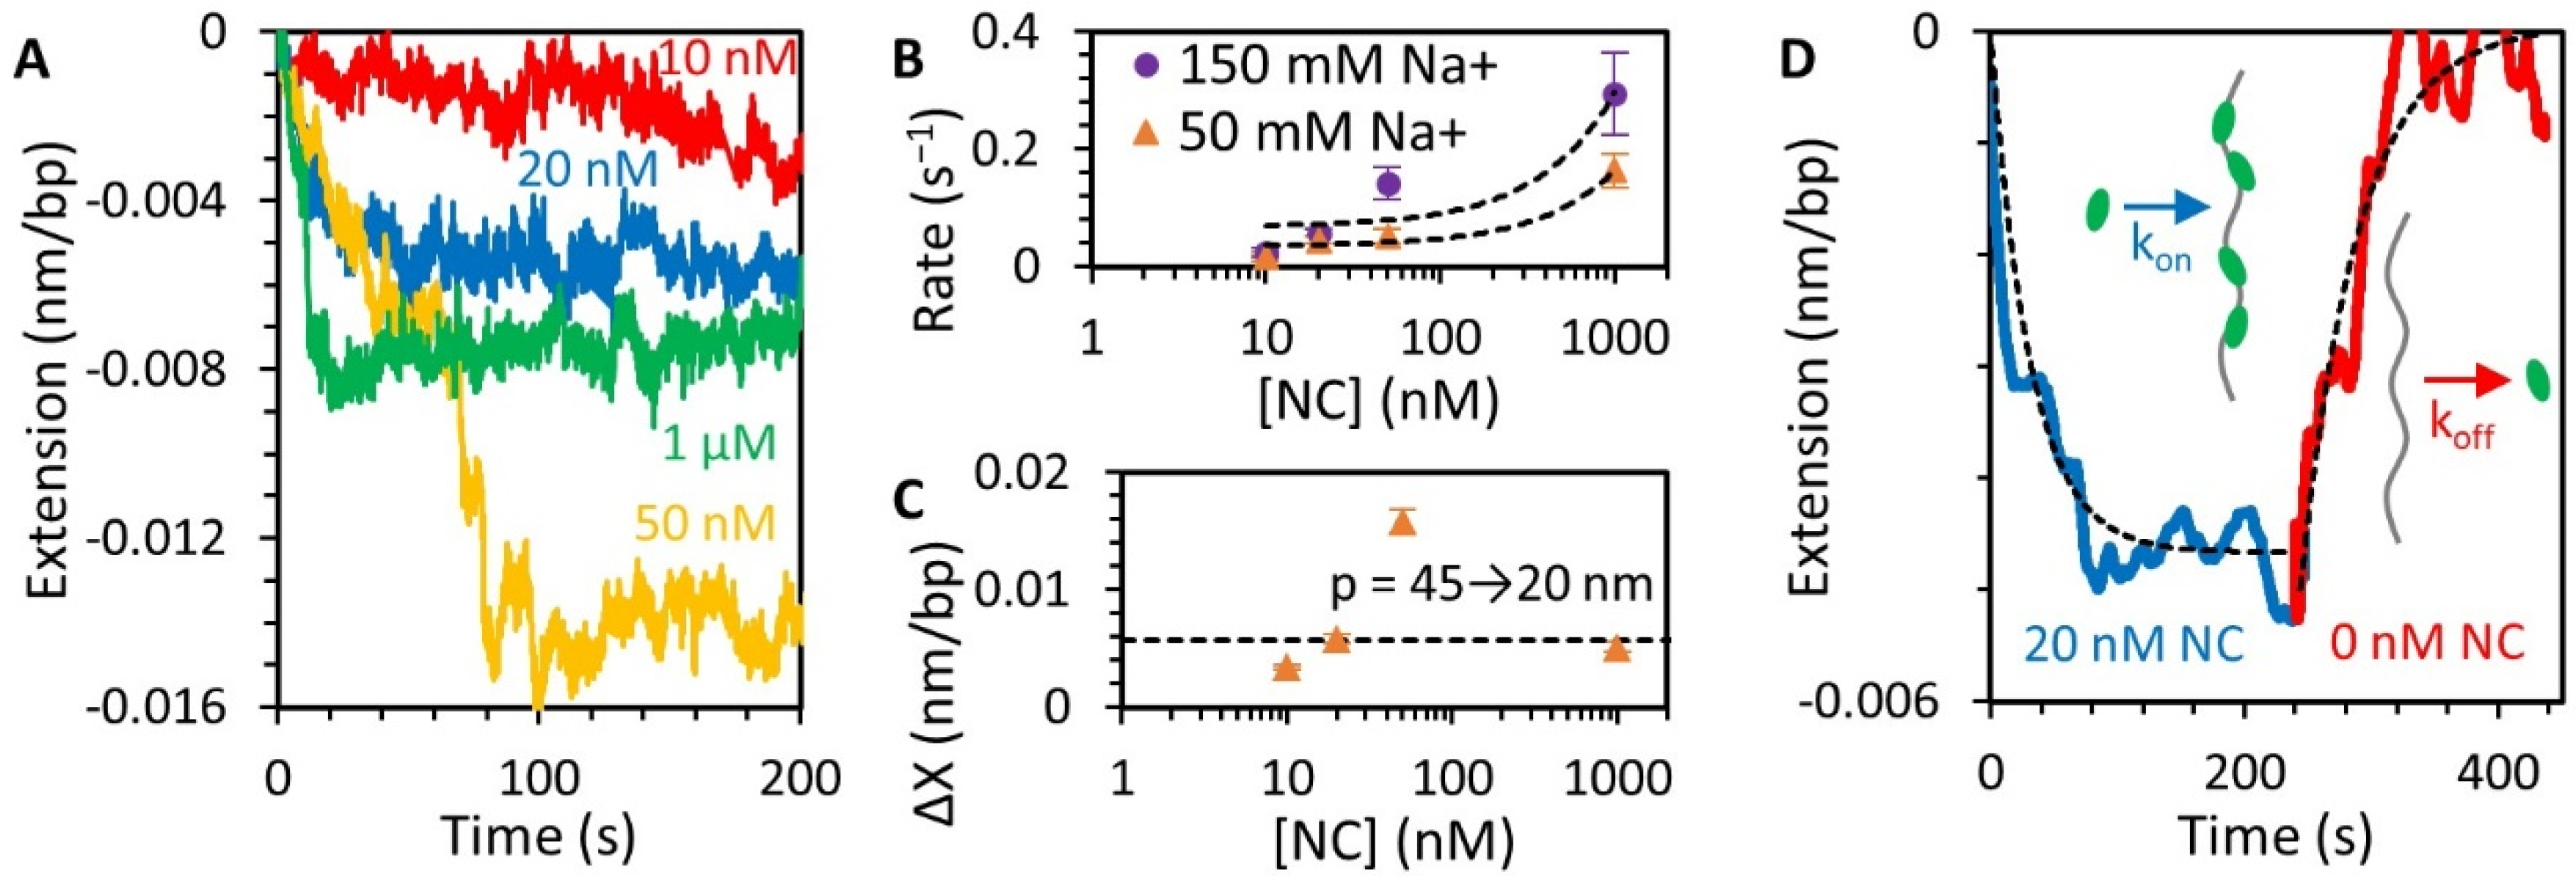
3.3. NC Binds DNA Straightened under Force through a Simple Bimolecular Mechanism
3.4. NC Mediates DNA Compaction
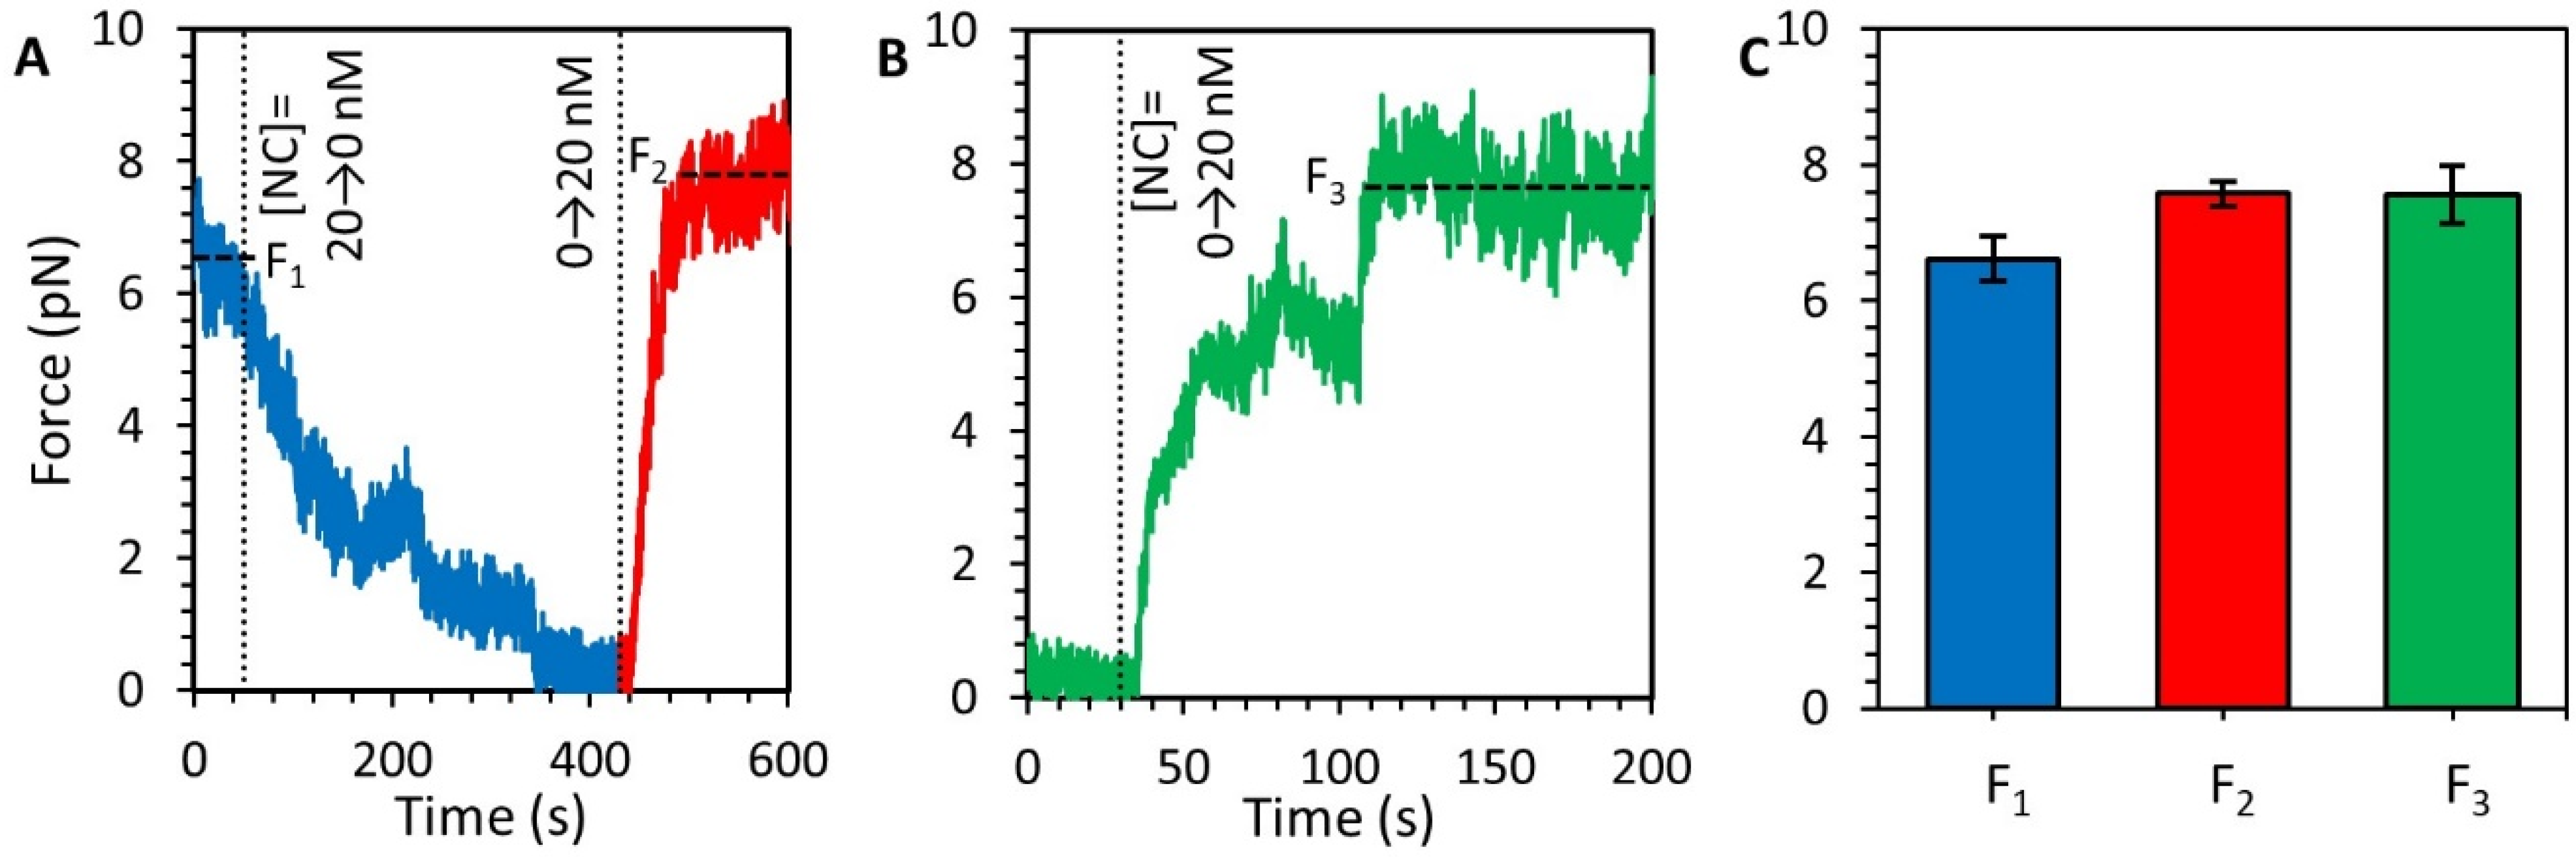
3.5. Stability of the NC-DNA Complex
3.6. NC Directly Compacts DNA at Low Force
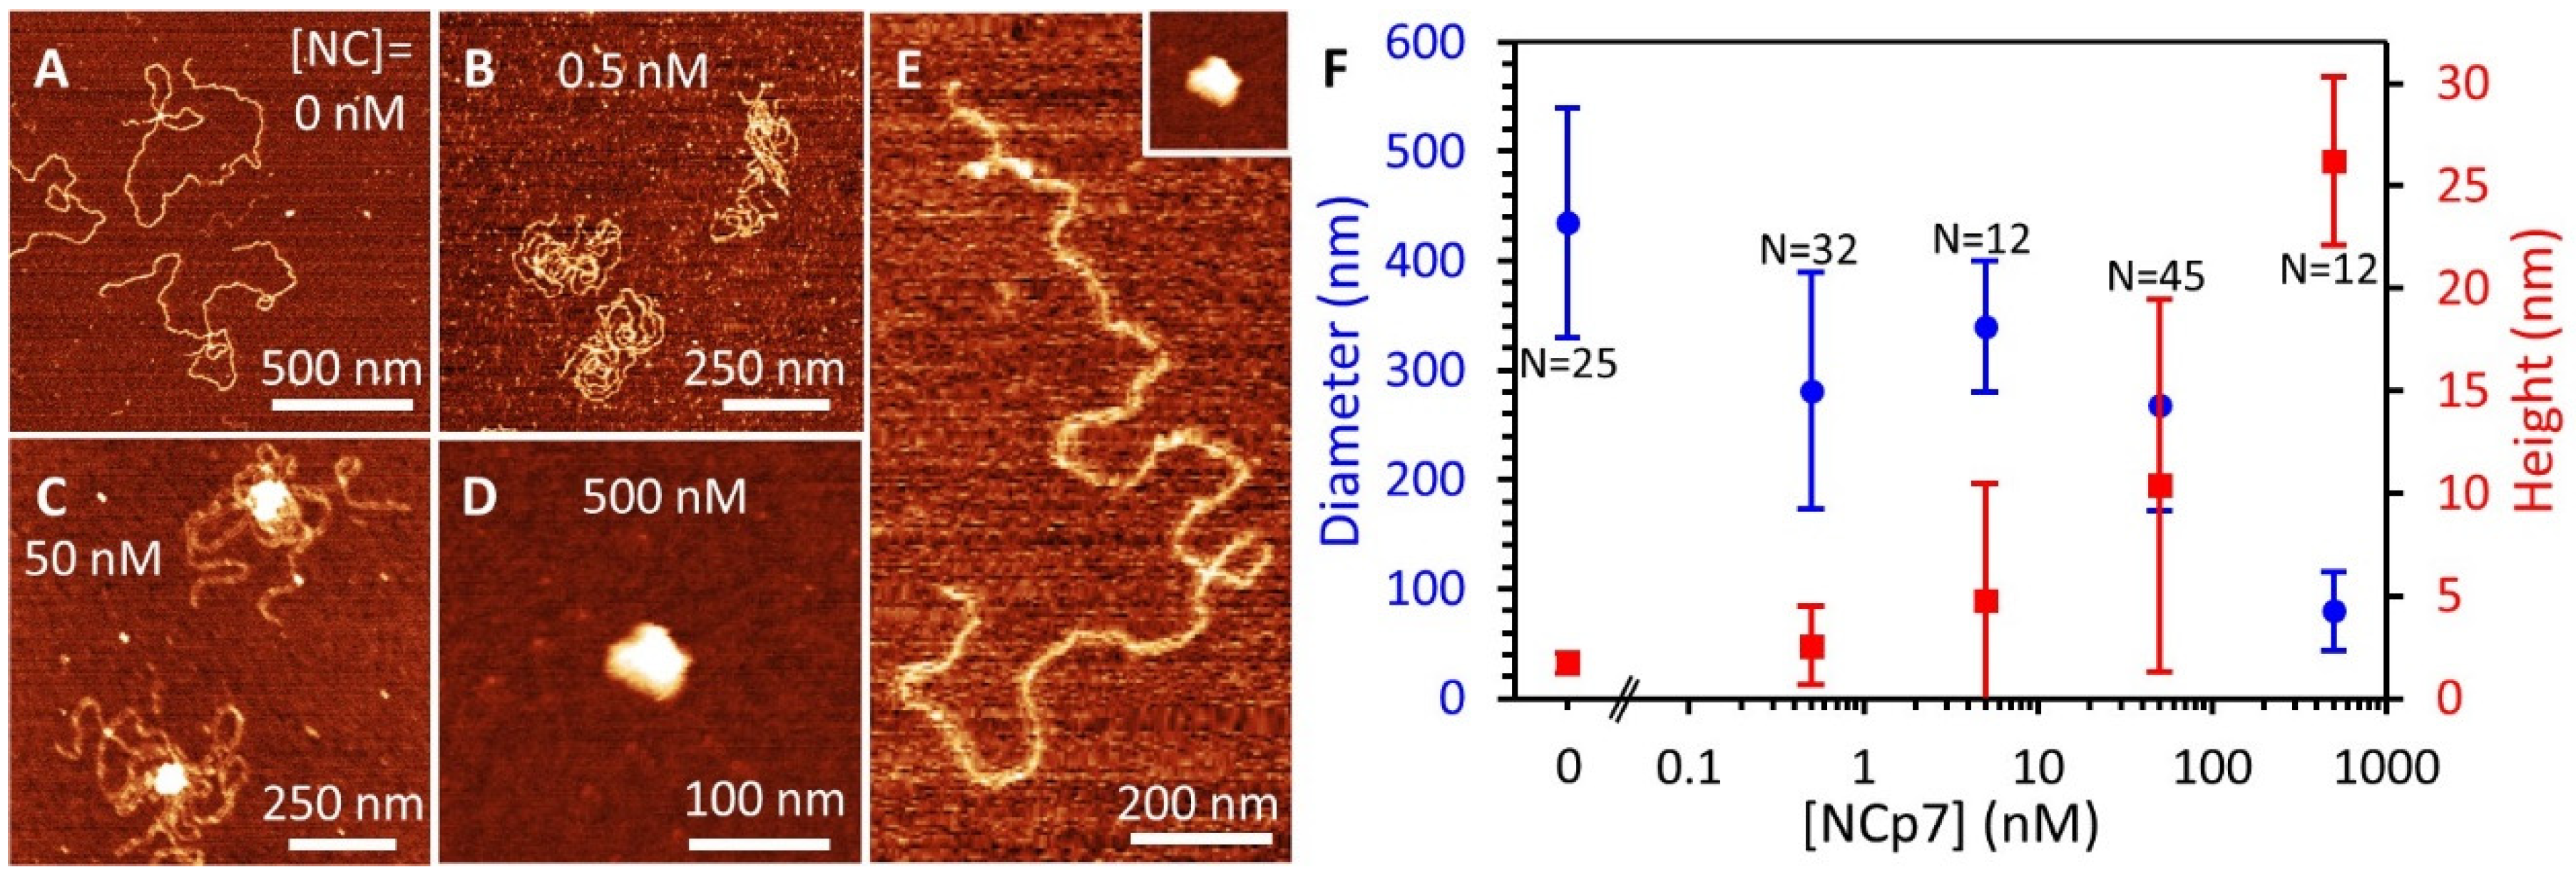
3.7. AFM Imaging Reveals the Size and Shape of Condensed DNA-NC Complexes
4. Discussion
4.1. NC-Induced DNA Condensation Is Similar to That of Other Multivalent Cations
4.2. NC Exhibits Exceptionally Strong DNA Binding Compared to Other DNA Condensing Ligands
4.3. NC Lowers the DNA Persistence Length
4.4. NC Induces Strong DNA Self-Attraction
4.5. DNA Condensation by Sub-Saturating Amounts of NC Leads to Phase Separation
4.6. Two Distinct Modes of NC/DNA Interaction and Compaction Are Likely Critical for Viral Capsid Uncoating
Supplementary Materials
Author Contributions
Funding
Institutional Review Board Statement
Informed Consent Statement
Data Availability Statement
Acknowledgments
Conflicts of Interest
References
- Coffin, J.M.; Hughes, S.H.; Varmus, H.E. Retroviruses. 1997. Available online: https://www.ncbi.nlm.nih.gov/books/NBK19376/ (accessed on 31 August 2021).
- Levin, J.G.; Guo, J.; Rouzina, I.; Musier-Forsyth, K. Nucleic acid chaperone activity of HIV-1 nucleocapsid protein: Critical role in reverse transcription and molecular mechanism. Prog. Nucleic Acid Res. Mol. Biol. 2005, 80, 217–286. [Google Scholar]
- Burdick, R.C.; Li, C.; Munshi, M.; Rawson, J.M.; Nagashima, K.; Hu, W.-S.; Pathak, V.K. HIV-1 uncoats in the nucleus near sites of integration. Proc. Natl. Acad. Sci. USA 2020, 117, 5486–5493. [Google Scholar] [CrossRef]
- Burdick, R.C.; Pathak, V.K. Efficient HIV-1 in vitro reverse transcription: Optimal capsid stability is required. Signal Transduct. Target. Ther. 2021, 6, 13. [Google Scholar] [CrossRef]
- Li, C.; Burdick, R.C.; Nagashima, K.; Hu, W.-S.; Pathak, V.K. HIV-1 cores retain their integrity until minutes before uncoating in the nucleus. Proc. Natl. Acad. Sci. USA 2021, 118, e2019467118. [Google Scholar] [CrossRef]
- Christensen, D.E.; Ganser-Pornillos, B.K.; Johnson, J.S.; Pornillos, O.; Sundquist, W.I. Reconstitution and visualization of HIV-1 capsid-dependent replication and integration in vitro. Science 2020, 370. [Google Scholar] [CrossRef]
- Aiken, C.; Rousso, I. The HIV-1 capsid and reverse transcription. Retrovirology 2021, 18. [Google Scholar] [CrossRef]
- Rankovic, S.; Deshpande, A.; Harel, S.; Aiken, C.; Rousso, I. HIV-1 uncoating occurs via a series of rapid biomechanical changes in the core related to individual stages of reverse transcription. J. Virol. 2021, 95, e00166-21. [Google Scholar] [CrossRef]
- Rankovic, S.; Ramalho, R.; Aiken, C.; Rousso, I. PF74 reinforces the HIV-1 capsid to impair reverse transcription-induced uncoating. J. Virol. 2018, 92, e00845-18. [Google Scholar] [CrossRef]
- Xu, C.; Fischer, D.K.; Rankovic, S.; Li, W.; Dick, R.A.; Runge, B.; Zadorozhnyi, R.; Ahn, J.; Aiken, C.; Polenova, T. Permeability of the HIV-1 capsid to metabolites modulates viral DNA synthesis. PLoS Biol. 2020, 18, e3001015. [Google Scholar] [CrossRef]
- Müller, T.G.; Zila, V.; Peters, K.; Schifferdecker, S.; Stanic, M.; Lucic, B.; Laketa, V.; Lusic, M.; Müller, B.; Kräusslich, H.-G. HIV-1 uncoating by release of viral cDNA from capsid-like structures in the nucleus of infected cells. Elife 2021, 10, e64776. [Google Scholar] [CrossRef] [PubMed]
- Francis, A.C.; Marin, M.; Prellberg, M.J.; Palermino-Rowland, K.; Melikyan, G.B. HIV-1 Uncoating and nuclear import precede the completion of reverse transcription in cell lines and in primary macrophages. Viruses 2020, 12, 1234. [Google Scholar] [CrossRef] [PubMed]
- Selyutina, A.; Persaud, M.; Lee, K.; KewalRamani, V.; Diaz-Griffero, F. Nuclear import of the HIV-1 core precedes reverse transcription and uncoating. Cell Rep. 2020, 32, 108201. [Google Scholar] [CrossRef] [PubMed]
- Maillet, S.; Fernandez, J.; Decourcelle, M.; El Koulali, K.; Blanchet, F.P.; Arhel, N.J.; Maarifi, G.; Nisole, S. Daxx inhibits HIV-1 reverse transcription and uncoating in a SUMO-dependent manner. Viruses 2020, 12, 636. [Google Scholar] [CrossRef] [PubMed]
- Dharan, A.; Bachmann, N.; Talley, S.; Zwikelmaier, V.; Campbell, E.M. Nuclear pore blockade reveals that HIV-1 completes reverse transcription and uncoating in the nucleus. Nat. Microbiol. 2020, 5, 1088–1095. [Google Scholar] [CrossRef]
- Fernandez, J.; Arhel, N.J. Coordination de la décapsidation et de l’import nucléaire de VIH-1 par la transportine-1. Med. Sci. 2020, 36, 203–206. [Google Scholar] [CrossRef] [PubMed]
- Ingram, Z.; Taylor, M.; Okland, G.; Martin, R.; Hulme, A.E. Characterization of HIV-1 uncoating in human microglial cell lines. Virol. J. 2020, 17, 31. [Google Scholar] [CrossRef]
- Dostálková, A.; Hadravová, R.; Kaufman, F.; Křížová, I.; Škach, K.; Flegel, M.; Hrabal, R.; Ruml, T.; Rumlová, M. A simple, high-throughput stabilization assay to test HIV-1 uncoating inhibitors. Sci. Rep. 2019, 9, 17076. [Google Scholar] [CrossRef]
- Shen, Q.; Wu, C.; Freniere, C.; Tripler, T.N.; Xiong, Y. Nuclear Import of HIV-1. Viruses 2021, 13, 2242. [Google Scholar] [CrossRef]
- Ingram, Z.; Fischer, D.K.; Ambrose, Z. Disassembling the Nature of Capsid: Biochemical, Genetic, and Imaging Approaches to Assess HIV-1 Capsid Functions. Viruses 2021, 13, 2237. [Google Scholar] [CrossRef]
- Rouzina, I.; Bruinsma, R. DNA confinement drives uncoating of the HIV Virus. Eur. Phys. J. Spec. Top. 2014, 223, 1745–1754. [Google Scholar] [CrossRef]
- Krishnamoorthy, G.; Roques, B.; Darlix, J.L.; Mély, Y. DNA condensation by the nucleocapsid protein of HIV-1: A mechanism ensuring DNA protection. Nucleic Acids Res. 2003, 31, 5425–5432. [Google Scholar] [CrossRef] [PubMed]
- Jiang, K.; Humbert, N.; Sriram, K.K.; Rouzina, I.; Mely, Y.; Westerlund, F. The HIV-1 nucleocapsid chaperone protein forms locally compacted globules on long double-stranded DNA. Nucleic Acids Res. 2021, 49, 4550–4563. [Google Scholar] [CrossRef] [PubMed]
- Mirambeau, G.; Lyonnais, S.; Coulaud, D.; Hameau, L.; Lafosse, S.; Jeusset, J.; Borde, I.; Reboud-Ravaux, M.; Restle, T.; Gorelick, R.J. HIV-1 protease and reverse transcriptase control the architecture of their nucleocapsid partner. PLoS ONE 2007, 2, e669. [Google Scholar] [CrossRef] [PubMed]
- Bloomfield, V.A. DNA condensation by multivalent cations. Biopolym. Orig. Res. Biomol. 1997, 44, 269–282. [Google Scholar] [CrossRef]
- Carteau, S.; Gorelick, R.J.; Bushman, F.D. Coupled integration of human immunodeficiency virus type 1 cDNA ends by purified integrase in vitro: Stimulation by the viral nucleocapsid protein. J. Virol. 1999, 73, 6670–6679. [Google Scholar] [CrossRef]
- Cruceanu, M.; Urbaneja, M.A.; Hixson, C.V.; Johnson, D.G.; Datta, S.A.; Fivash, M.J.; Stephen, A.G.; Fisher, R.J.; Gorelick, R.J.; Casas-Finet, J.R. Nucleic acid binding and chaperone properties of HIV-1 Gag and nucleocapsid proteins. Nucleic Acids Res. 2006, 34, 593–605. [Google Scholar] [CrossRef]
- Morse, M.; Naufer, M.N.; Feng, Y.; Chelico, L.; Rouzina, I.; Williams, M.C. HIV restriction factor APOBEC3G binds in multiple steps and conformations to search and deaminate single-stranded DNA. Elife 2019, 8, e52649. [Google Scholar] [CrossRef]
- Naufer, M.N.; Morse, M.; Möller, G.B.; McIsaac, J.; Rouzina, I.; Beuning, P.J.; Williams, M.C. Multiprotein E. coli SSB–ssDNA complex shows both stable binding and rapid dissociation due to interprotein interactions. Nucleic Acids Res. 2021, 49, 1532–1549. [Google Scholar] [CrossRef]
- Candelli, A.; Hoekstra, T.P.; Farge, G.; Gross, P.; Peterman, E.J.; Wuite, G.J. A toolbox for generating single-stranded DNA in optical tweezers experiments. Biopolym. Orig. Res. Biomol. 2013, 99, 611–620. [Google Scholar] [CrossRef]
- Chaurasiya, K.R.; Paramanathan, T.; McCauley, M.J.; Williams, M.C. Biophysical characterization of DNA binding from single molecule force measurements. Phys. Life Rev. 2010, 7, 299–341. [Google Scholar] [CrossRef]
- Heenan, P.R.; Perkins, T.T. Imaging DNA equilibrated onto mica in liquid using biochemically relevant deposition conditions. ACS Nano 2019, 13, 4220–4229. [Google Scholar] [CrossRef] [PubMed]
- Smith, S.B.; Cui, Y.; Bustamante, C. Overstretching B-DNA: The elastic response of individual double-stranded and single-stranded DNA molecules. Science 1996, 271, 795–799. [Google Scholar] [CrossRef] [PubMed]
- Van den Broek, B.; Noom, M.C.; Van Mameren, J.; Battle, C.; MacKintosh, F.C.; Wuite, G.J. Visualizing the formation and collapse of DNA toroids. Biophys. J. 2010, 98, 1902–1910. [Google Scholar] [CrossRef] [PubMed]
- Wang, H.; Musier-Forsyth, K.; Falk, C.; Barbara, P.F. Single-molecule spectroscopic study of dynamic nanoscale DNA bending behavior of HIV-1 nucleocapsid protein. J. Phys. Chem. B 2013, 117, 4183–4196. [Google Scholar] [CrossRef] [PubMed][Green Version]
- Gosule, L.C.; Schellman, J.A. Compact form of DNA induced by spermidine. Nature 1976, 259, 333–335. [Google Scholar] [CrossRef] [PubMed]
- Bloomfield, V.A. Condensation of DNA by multivalent cations: Considerations on mechanism. Biopolym. Orig. Res. Biomol. 1991, 31, 1471–1481. [Google Scholar] [CrossRef] [PubMed]
- Vuilleumier, C.; Bombarda, E.; Morellet, N.; Gerard, D.; Roques, B.; Mely, Y. Nucleic acid sequence discrimination by the HIV-1 nucleocapsid protein NCp7: A fluorescence study. Biochemistry 1999, 38, 16816–16825. [Google Scholar] [CrossRef] [PubMed]
- Webb, J.A.; Jones, C.P.; Parent, L.J.; Rouzina, I.; Musier-Forsyth, K. Distinct binding interactions of HIV-1 Gag to Psi and non-Psi RNAs: Implications for viral genomic RNA packaging. RNA 2013, 19, 1078–1088. [Google Scholar] [CrossRef]
- Ray, J.; Manning, G.S. Theory of delocalized ionic binding to polynucleotides: Structural and excluded-volume effects. Biopolym. Orig. Res. Biomol. 1992, 32, 541–549. [Google Scholar] [CrossRef]
- Ballin, J.D.; Shkel, I.A.; Record, M.T., Jr. Interactions of the KWK 6 cationic peptide with short nucleic acid oligomers: Demonstration of large coulombic end effects on binding at 0.1–0.2 M salt. Nucleic Acids Res. 2004, 32, 3271–3281. [Google Scholar] [CrossRef]
- Rouzina, I.; Bloomfield, V.A. Competitive electrostatic binding of charged ligands to polyelectrolytes: Practical approach using the non-linear Poisson-Boltzmann equation. Biophys. Chem. 1997, 64, 139–155. [Google Scholar] [CrossRef]
- Bloomfield, V.A.; Rouzina, I. [18] Use of poisson-boltzmann equation to analyze ion binding to DNA. Methods Enzymol. 1998, 295, 364–378. [Google Scholar] [PubMed]
- Rouzina, I.; Bloomfield, V.A. Influence of ligand spatial organization on competitive electrostatic binding to DNA. J. Phys. Chem. 1996, 100, 4305–4313. [Google Scholar] [CrossRef]
- Rouzina, I.; Bloomfield, V.A. Macroion attraction due to electrostatic correlation between screening counterions. 1. Mobile surface-adsorbed ions and diffuse ion cloud. J. Phys. Chem. 1996, 100, 9977–9989. [Google Scholar] [CrossRef]
- Shklovskii, B.I. Wigner crystal model of counterion induced bundle formation of rodlike polyelectrolytes. Phys. Rev. Lett. 1999, 82, 3268. [Google Scholar] [CrossRef]
- Nguyen, T.T.; Rouzina, I.; Shklovskii, B.I. Reentrant condensation of DNA induced by multivalent counterions. J. Chem. Phys. 2000, 112, 2562–2568. [Google Scholar] [CrossRef]
- Kornyshev, A.; Leikin, S. Electrostatic zipper motif for DNA aggregation. Phys. Rev. Lett. 1999, 82, 4138. [Google Scholar] [CrossRef]
- Todd, B.A.; Parsegian, V.A.; Shirahata, A.; Thomas, T.; Rau, D.C. Attractive forces between cation condensed DNA double helices. Biophys. J. 2008, 94, 4775–4782. [Google Scholar] [CrossRef]
- Murayama, Y.; Sakamaki, Y.; Sano, M. Elastic response of single DNA molecules exhibits a reentrant collapsing transition. Phys. Rev. Lett. 2003, 90, 018102. [Google Scholar] [CrossRef]
- Besteman, K.; Van Eijk, K.; Lemay, S. Charge inversion accompanies DNA condensation by multivalent ions. Nat. Phys. 2007, 3, 641–644. [Google Scholar] [CrossRef]
- Raspaud, E.; De La Cruz, M.O.; Sikorav, J.-L.; Livolant, F. Precipitation of DNA by polyamines: A polyelectrolyte behavior. Biophys. J. 1998, 74, 381–393. [Google Scholar] [CrossRef]
- Baumann, C.G.; Smith, S.B.; Bloomfield, V.A.; Bustamante, C. Ionic effects on the elasticity of single DNA molecules. Proc. Natl. Acad. Sci. USA 1997, 94, 6185–6190. [Google Scholar] [CrossRef] [PubMed]
- Baumann, C.G.; Bloomfield, V.A.; Smith, S.B.; Bustamante, C.; Wang, M.D.; Block, S.M. Stretching of single collapsed DNA molecules. Biophys. J. 2000, 78, 1965–1978. [Google Scholar] [CrossRef]
- Stewart-Maynard, K.M.; Cruceanu, M.; Wang, F.; Vo, M.N.; Gorelick, R.J.; Williams, M.C.; Rouzina, I.; Musier-Forsyth, K. Retroviral nucleocapsid proteins display nonequivalent levels of nucleic acid chaperone activity. J. Virol. 2008, 82, 10129–10142. [Google Scholar] [CrossRef] [PubMed]
- Vladescu, I.D.; McCauley, M.J.; Rouzina, I.; Williams, M.C. Mapping the phase diagram of single DNA molecule force-induced melting in the presence of ethidium. Phys. Rev. Lett. 2005, 95, 158102. [Google Scholar] [CrossRef] [PubMed]
- Vladescu, I.D.; McCauley, M.J.; Nuñez, M.E.; Rouzina, I.; Williams, M.C. Quantifying force-dependent and zero-force DNA intercalation by single-molecule stretching. Nat. Methods 2007, 4, 517–522. [Google Scholar] [CrossRef]
- Wu, H.; Mitra, M.; McCauley, M.J.; Thomas, J.A.; Rouzina, I.; Musier-Forsyth, K.; Williams, M.C.; Gorelick, R.J. Aromatic residue mutations reveal direct correlation between HIV-1 nucleocapsid protein’s nucleic acid chaperone activity and retroviral replication. Virus Res. 2013, 171, 263–277. [Google Scholar] [CrossRef]
- Wu, H.; Mitra, M.; Naufer, M.N.; McCauley, M.J.; Gorelick, R.J.; Rouzina, I.; Musier-Forsyth, K.; Williams, M.C. Differential contribution of basic residues to HIV-1 nucleocapsid protein’s nucleic acid chaperone function and retroviral replication. Nucleic Acids Res. 2014, 42, 2525–2537. [Google Scholar] [CrossRef]
- Rouzina, I.; Bloomfield, V.A. DNA bending by small, mobile multivalent cations. Biophys. J. 1998, 74, 3152–3164. [Google Scholar] [CrossRef]
- Nguyen, T.; Rouzina, I.; Shklovskii, B. Negative electrostatic contribution to the bending rigidity of charged membranes and polyelectrolytes screened by multivalent counterions. Phys. Rev. E 1999, 60, 7032. [Google Scholar] [CrossRef]
- McCauley, M.J.; Rueter, E.M.; Rouzina, I.; Maher, L.J., III; Williams, M.C. Single-molecule kinetics reveal microscopic mechanism by which High-Mobility Group B proteins alter DNA flexibility. Nucleic Acids Res. 2013, 41, 167–181. [Google Scholar] [CrossRef] [PubMed]
- Zhang, J.; McCauley, M.J.; Maher III, L.J.; Williams, M.C.; Israeloff, N. Mechanism of DNA flexibility enhancement by HMGB proteins. Nucleic Acids Res. 2009, 37, 1107–1114. [Google Scholar] [CrossRef] [PubMed][Green Version]
- McCauley, M.J.; Zimmerman, J.; Maher, L.J., III; Williams, M.C. HMGB binding to DNA: Single and double box motifs. J. Mol. Biol. 2007, 374, 993–1004. [Google Scholar] [CrossRef] [PubMed]
- Zinchenko, A.; Hiramatsu, H.; Yamaguchi, H.; Kubo, K.; Murata, S.; Kanbe, T.; Hazemoto, N.; Yoshikawa, K.; Akitaya, T. Amino acid sequence of oligopeptide causes marked difference in DNA compaction and transcription. Biophys. J. 2019, 116, 1836–1844. [Google Scholar] [CrossRef] [PubMed]
- De Guzman, R.N.; Wu, Z.R.; Stalling, C.C.; Pappalardo, L.; Borer, P.N.; Summers, M.F. Structure of the HIV-1 nucleocapsid protein bound to the SL3 Ψ-RNA recognition element. Science 1998, 279, 384–388. [Google Scholar] [CrossRef]
- Amarasinghe, G.K.; De Guzman, R.N.; Turner, R.B.; Chancellor, K.J.; Wu, Z.R.; Summers, M.F. NMR structure of the HIV-1 nucleocapsid protein bound to stem-loop SL2 of the Ψ-RNA packaging signal. Implications for genome recognition. J. Mol. Biol. 2000, 301, 491–511. [Google Scholar] [CrossRef]
- Lee, B.M.; De Guzman, R.N.; Turner, B.G.; Tjandra, N.; Summers, M.F. Dynamical behavior of the HIV-1 nucleocapsid protein. J. Mol. Biol. 1998, 279, 633–649. [Google Scholar] [CrossRef]
- Brandariz-Nuñez, A.; Robinson, S.J.; Evilevitch, A. Pressurized DNA state inside herpes capsids—A novel antiviral target. PLoS Path. 2020, 16, e1008604. [Google Scholar] [CrossRef]
- Kessl, J.J.; Kutluay, S.B.; Townsend, D.; Rebensburg, S.; Slaughter, A.; Larue, R.C.; Shkriabai, N.; Bakouche, N.; Fuchs, J.R.; Bieniasz, P.D. HIV-1 integrase binds the viral RNA genome and is essential during virion morphogenesis. Cell 2016, 166, 1257–1268.e12. [Google Scholar] [CrossRef]
- Liu, S.; Koneru, P.C.; Li, W.; Pathirage, C.; Engelman, A.N.; Kvaratskhelia, M.; Musier-Forsyth, K. HIV-1 integrase binding to genomic RNA 5′-UTR induces local structural changes in vitro and in virio. Retrovirology 2021, 18, 37. [Google Scholar] [CrossRef]


| Multivalent Cation [Reference] | Buffer | Cmin Cmid Cmax | Fmax (pN) | GDNA (kBT) | pmin (nm) | Hysteresis during Stretching | DNA Binding Kinetics |
|---|---|---|---|---|---|---|---|
| Spd3+ [53,54] | 10 mM NaHPO4, pH 7 | 200 μM N/A N/A | 1 | 0.08 ± 0.01 | 37 | Large | |
| CoHex3+ [53,54] | 10 mM NaHPO4, pH 7 | 25 μM N/A N/A | 4 | 0.32 ± 0.05 | 18 | Large | |
| Spd3+ [50] | 10 mM Tris-HCl, pH 7 | 0.5 mM 2 mM 100 mM | 1.8 ± 0.2 | 0.15 ± 0.05 | Grows with [Spd3+] and condensate size | ||
| Spe4+ [34] | 10 mM Tris 1 mM EDTA, pH 7 | 4.5 | 35 | Moderate after condensate formation | Second timescale | ||
| Spe4+ [51] | 10 mM Tris 50 mM NaCl | 10 μM 10 mM 1 M | 2.2 | Moderate after condensate formation | Second timescale | ||
| NC3.5+ [This Work] | 50 NaCl 10 mM Hepes, pH 7.5 | 10nM 20nM >1 μM | 9 ± 1 | 0.85 ± 0.1 | 20 | Large, increases with incubation | 10–100 s timescale |
Publisher’s Note: MDPI stays neutral with regard to jurisdictional claims in published maps and institutional affiliations. |
© 2022 by the authors. Licensee MDPI, Basel, Switzerland. This article is an open access article distributed under the terms and conditions of the Creative Commons Attribution (CC BY) license (https://creativecommons.org/licenses/by/4.0/).
Share and Cite
Gien, H.; Morse, M.; McCauley, M.J.; Kitzrow, J.P.; Musier-Forsyth, K.; Gorelick, R.J.; Rouzina, I.; Williams, M.C. HIV-1 Nucleocapsid Protein Binds Double-Stranded DNA in Multiple Modes to Regulate Compaction and Capsid Uncoating. Viruses 2022, 14, 235. https://doi.org/10.3390/v14020235
Gien H, Morse M, McCauley MJ, Kitzrow JP, Musier-Forsyth K, Gorelick RJ, Rouzina I, Williams MC. HIV-1 Nucleocapsid Protein Binds Double-Stranded DNA in Multiple Modes to Regulate Compaction and Capsid Uncoating. Viruses. 2022; 14(2):235. https://doi.org/10.3390/v14020235
Chicago/Turabian StyleGien, Helena, Michael Morse, Micah J. McCauley, Jonathan P. Kitzrow, Karin Musier-Forsyth, Robert J. Gorelick, Ioulia Rouzina, and Mark C. Williams. 2022. "HIV-1 Nucleocapsid Protein Binds Double-Stranded DNA in Multiple Modes to Regulate Compaction and Capsid Uncoating" Viruses 14, no. 2: 235. https://doi.org/10.3390/v14020235
APA StyleGien, H., Morse, M., McCauley, M. J., Kitzrow, J. P., Musier-Forsyth, K., Gorelick, R. J., Rouzina, I., & Williams, M. C. (2022). HIV-1 Nucleocapsid Protein Binds Double-Stranded DNA in Multiple Modes to Regulate Compaction and Capsid Uncoating. Viruses, 14(2), 235. https://doi.org/10.3390/v14020235