

Dual-RNAseq Analysis Unravels Virus-Host Interactions of MetSV and Methanosarcina mazei
 , and
, and 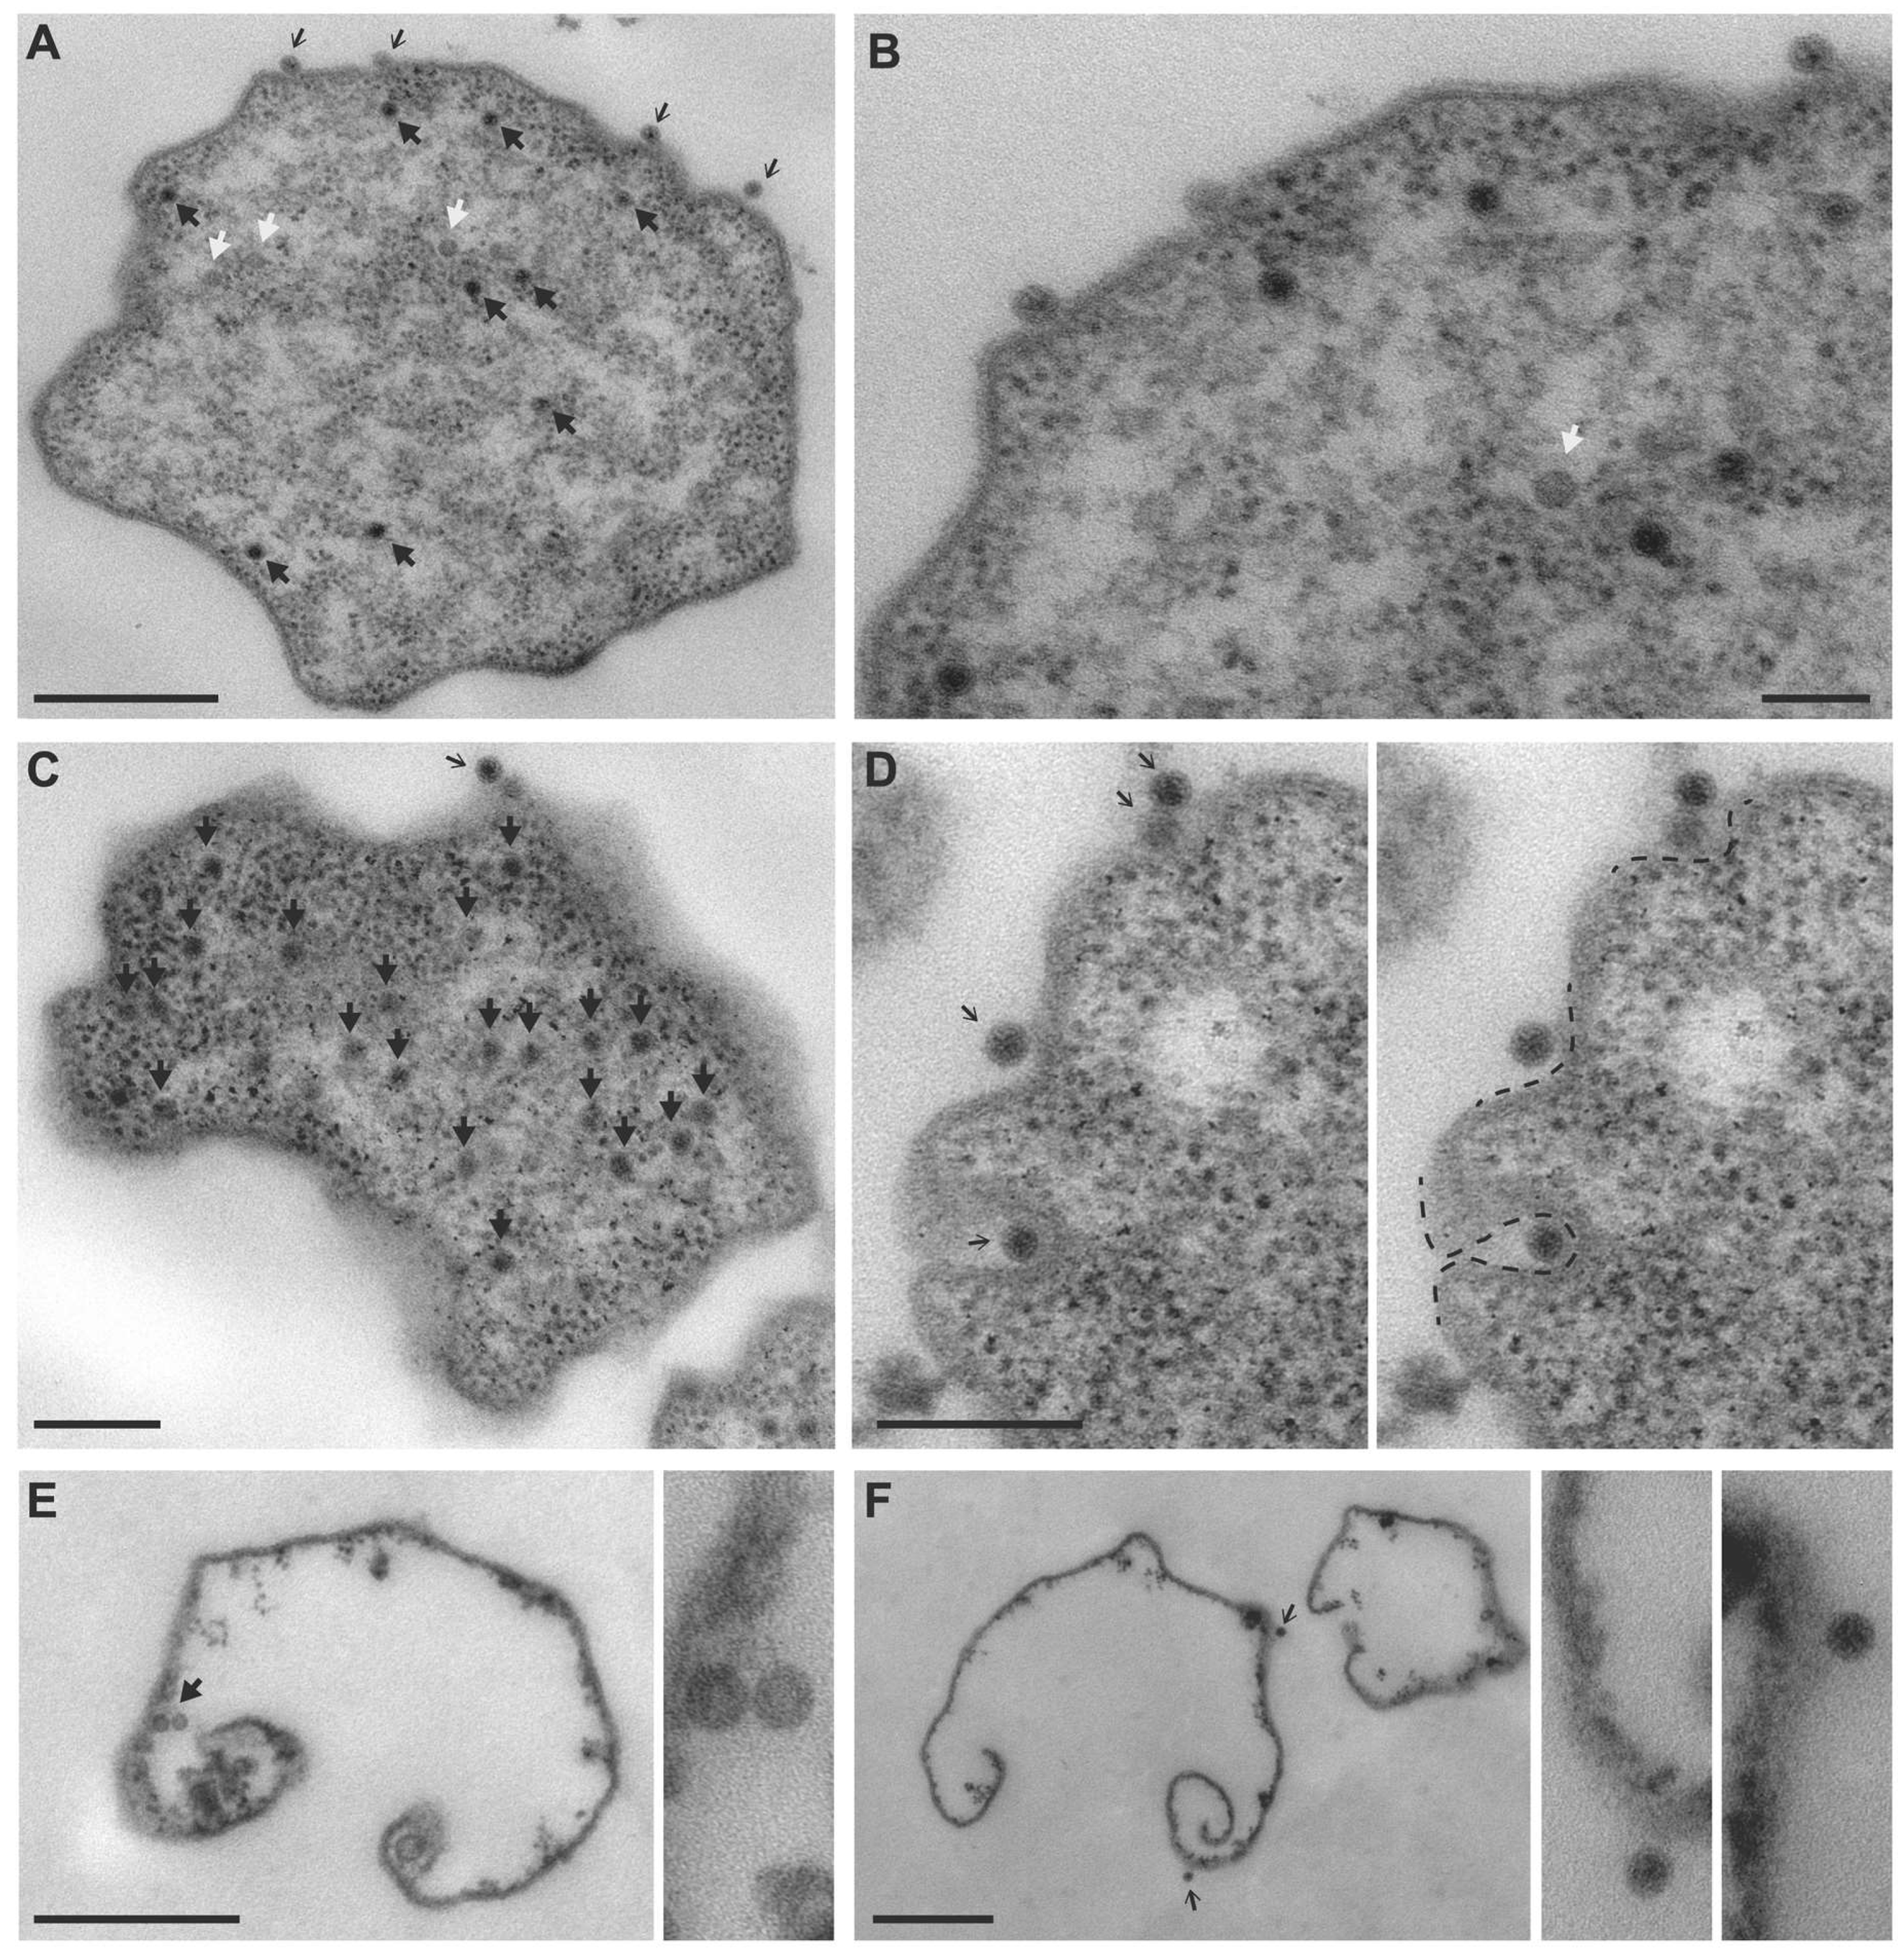
Abstract
1. Introduction
2. Materials and Methods
2.1. Growth of M. mazei, MetSV Infection and RNA Preparation
2.2. RNA Sequencing
2.3. Read Trimming, Filtering and Mapping Using READemption
2.4. Differential Expression Analysis by Clusters
2.5. Verification by qRT-PCR
2.6. Ultrastructural Analysis by Transmission Electron Microscopy (TEM)
3. Results
3.1. TEM Imaging of MetSV-Infected M. mazei Cells
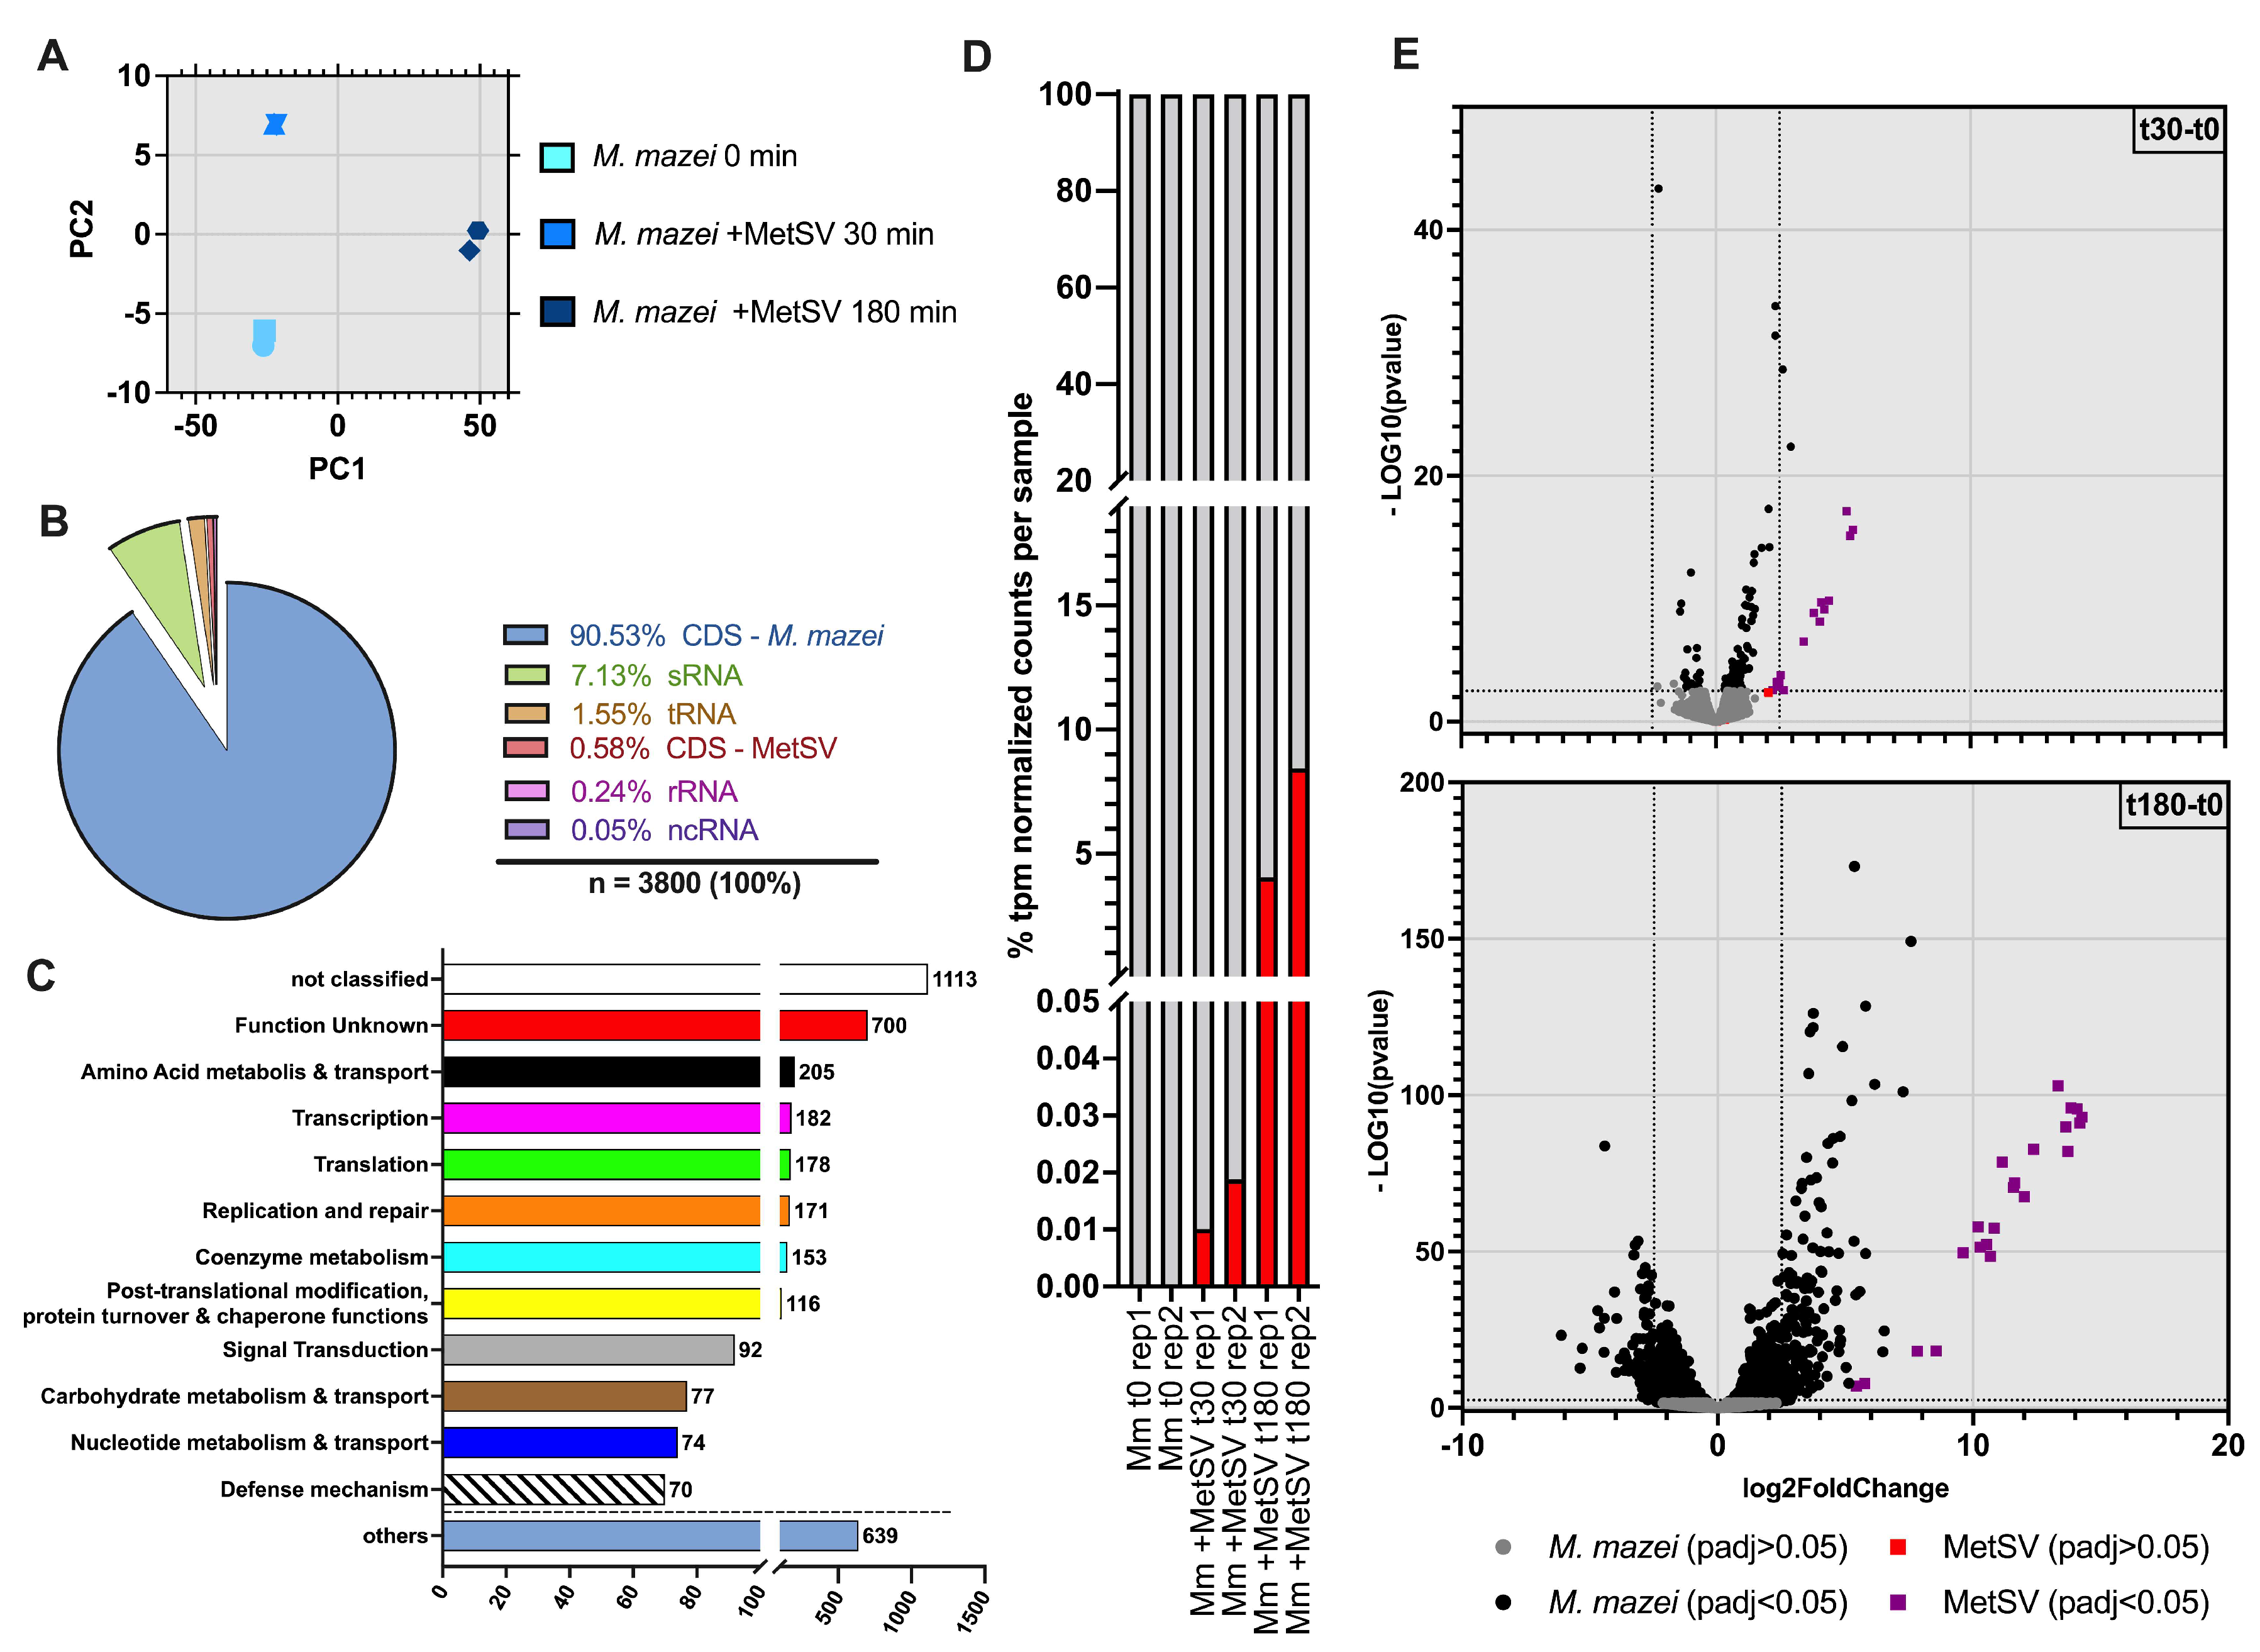
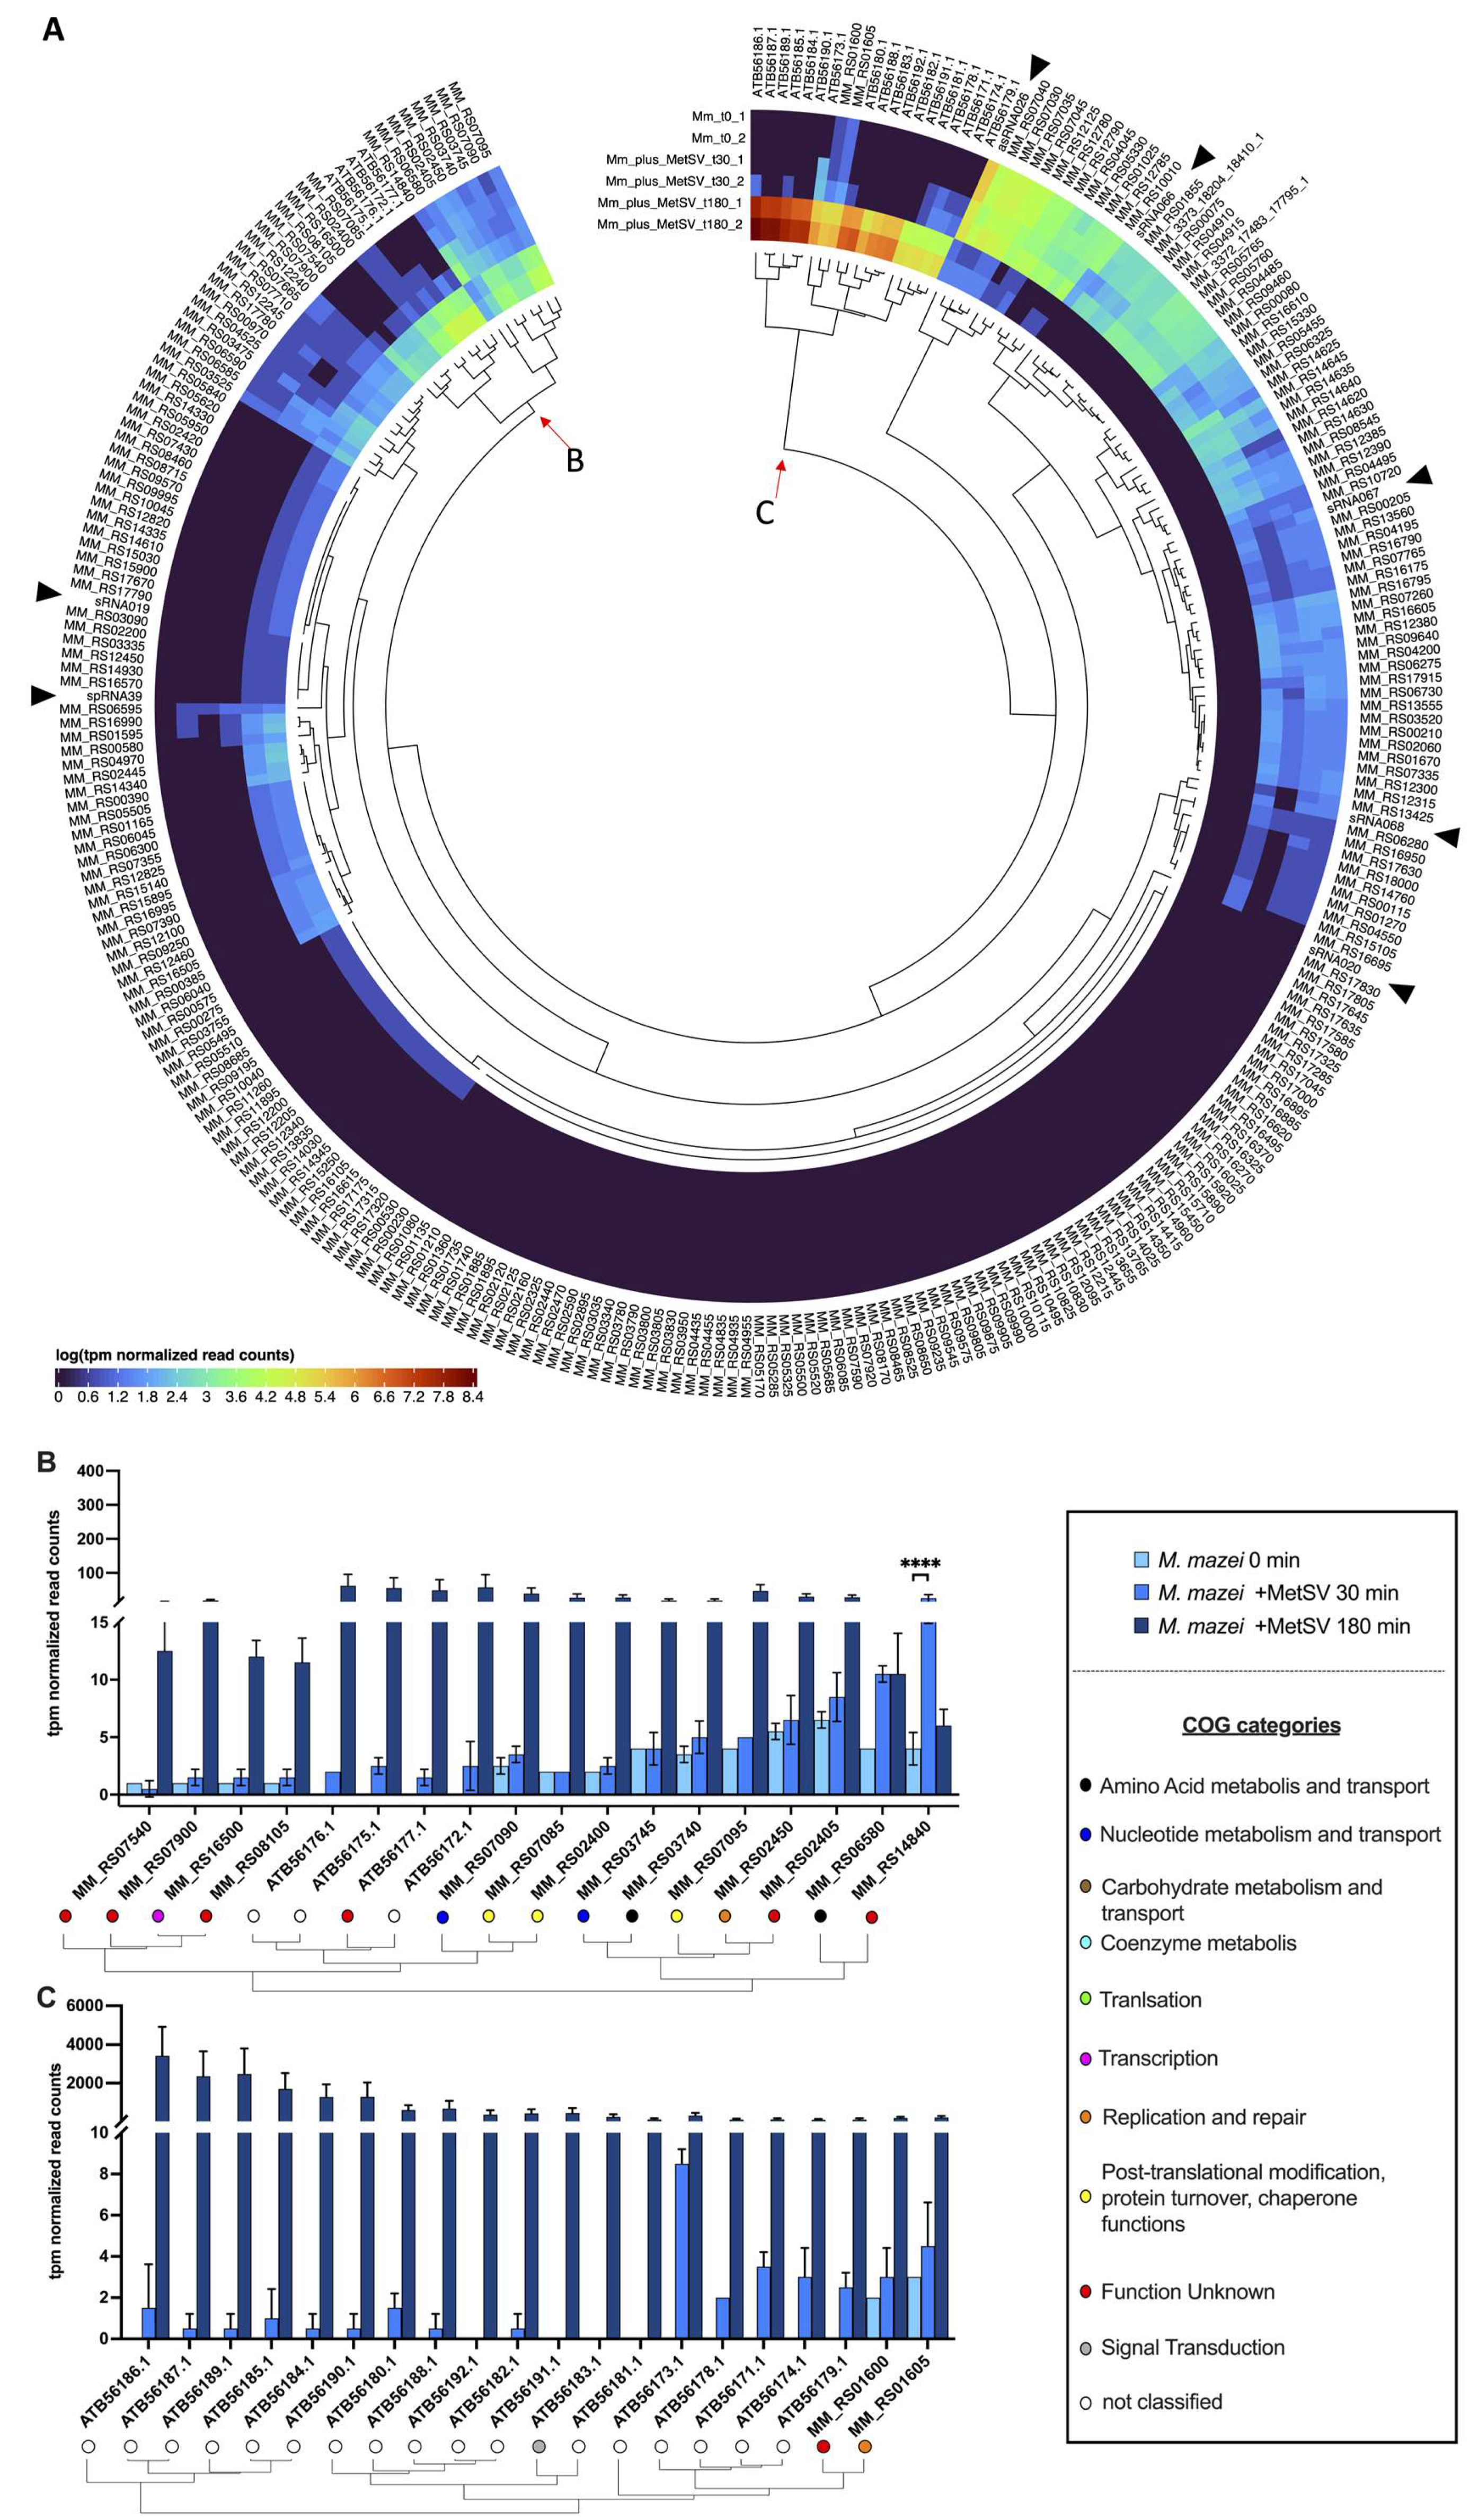
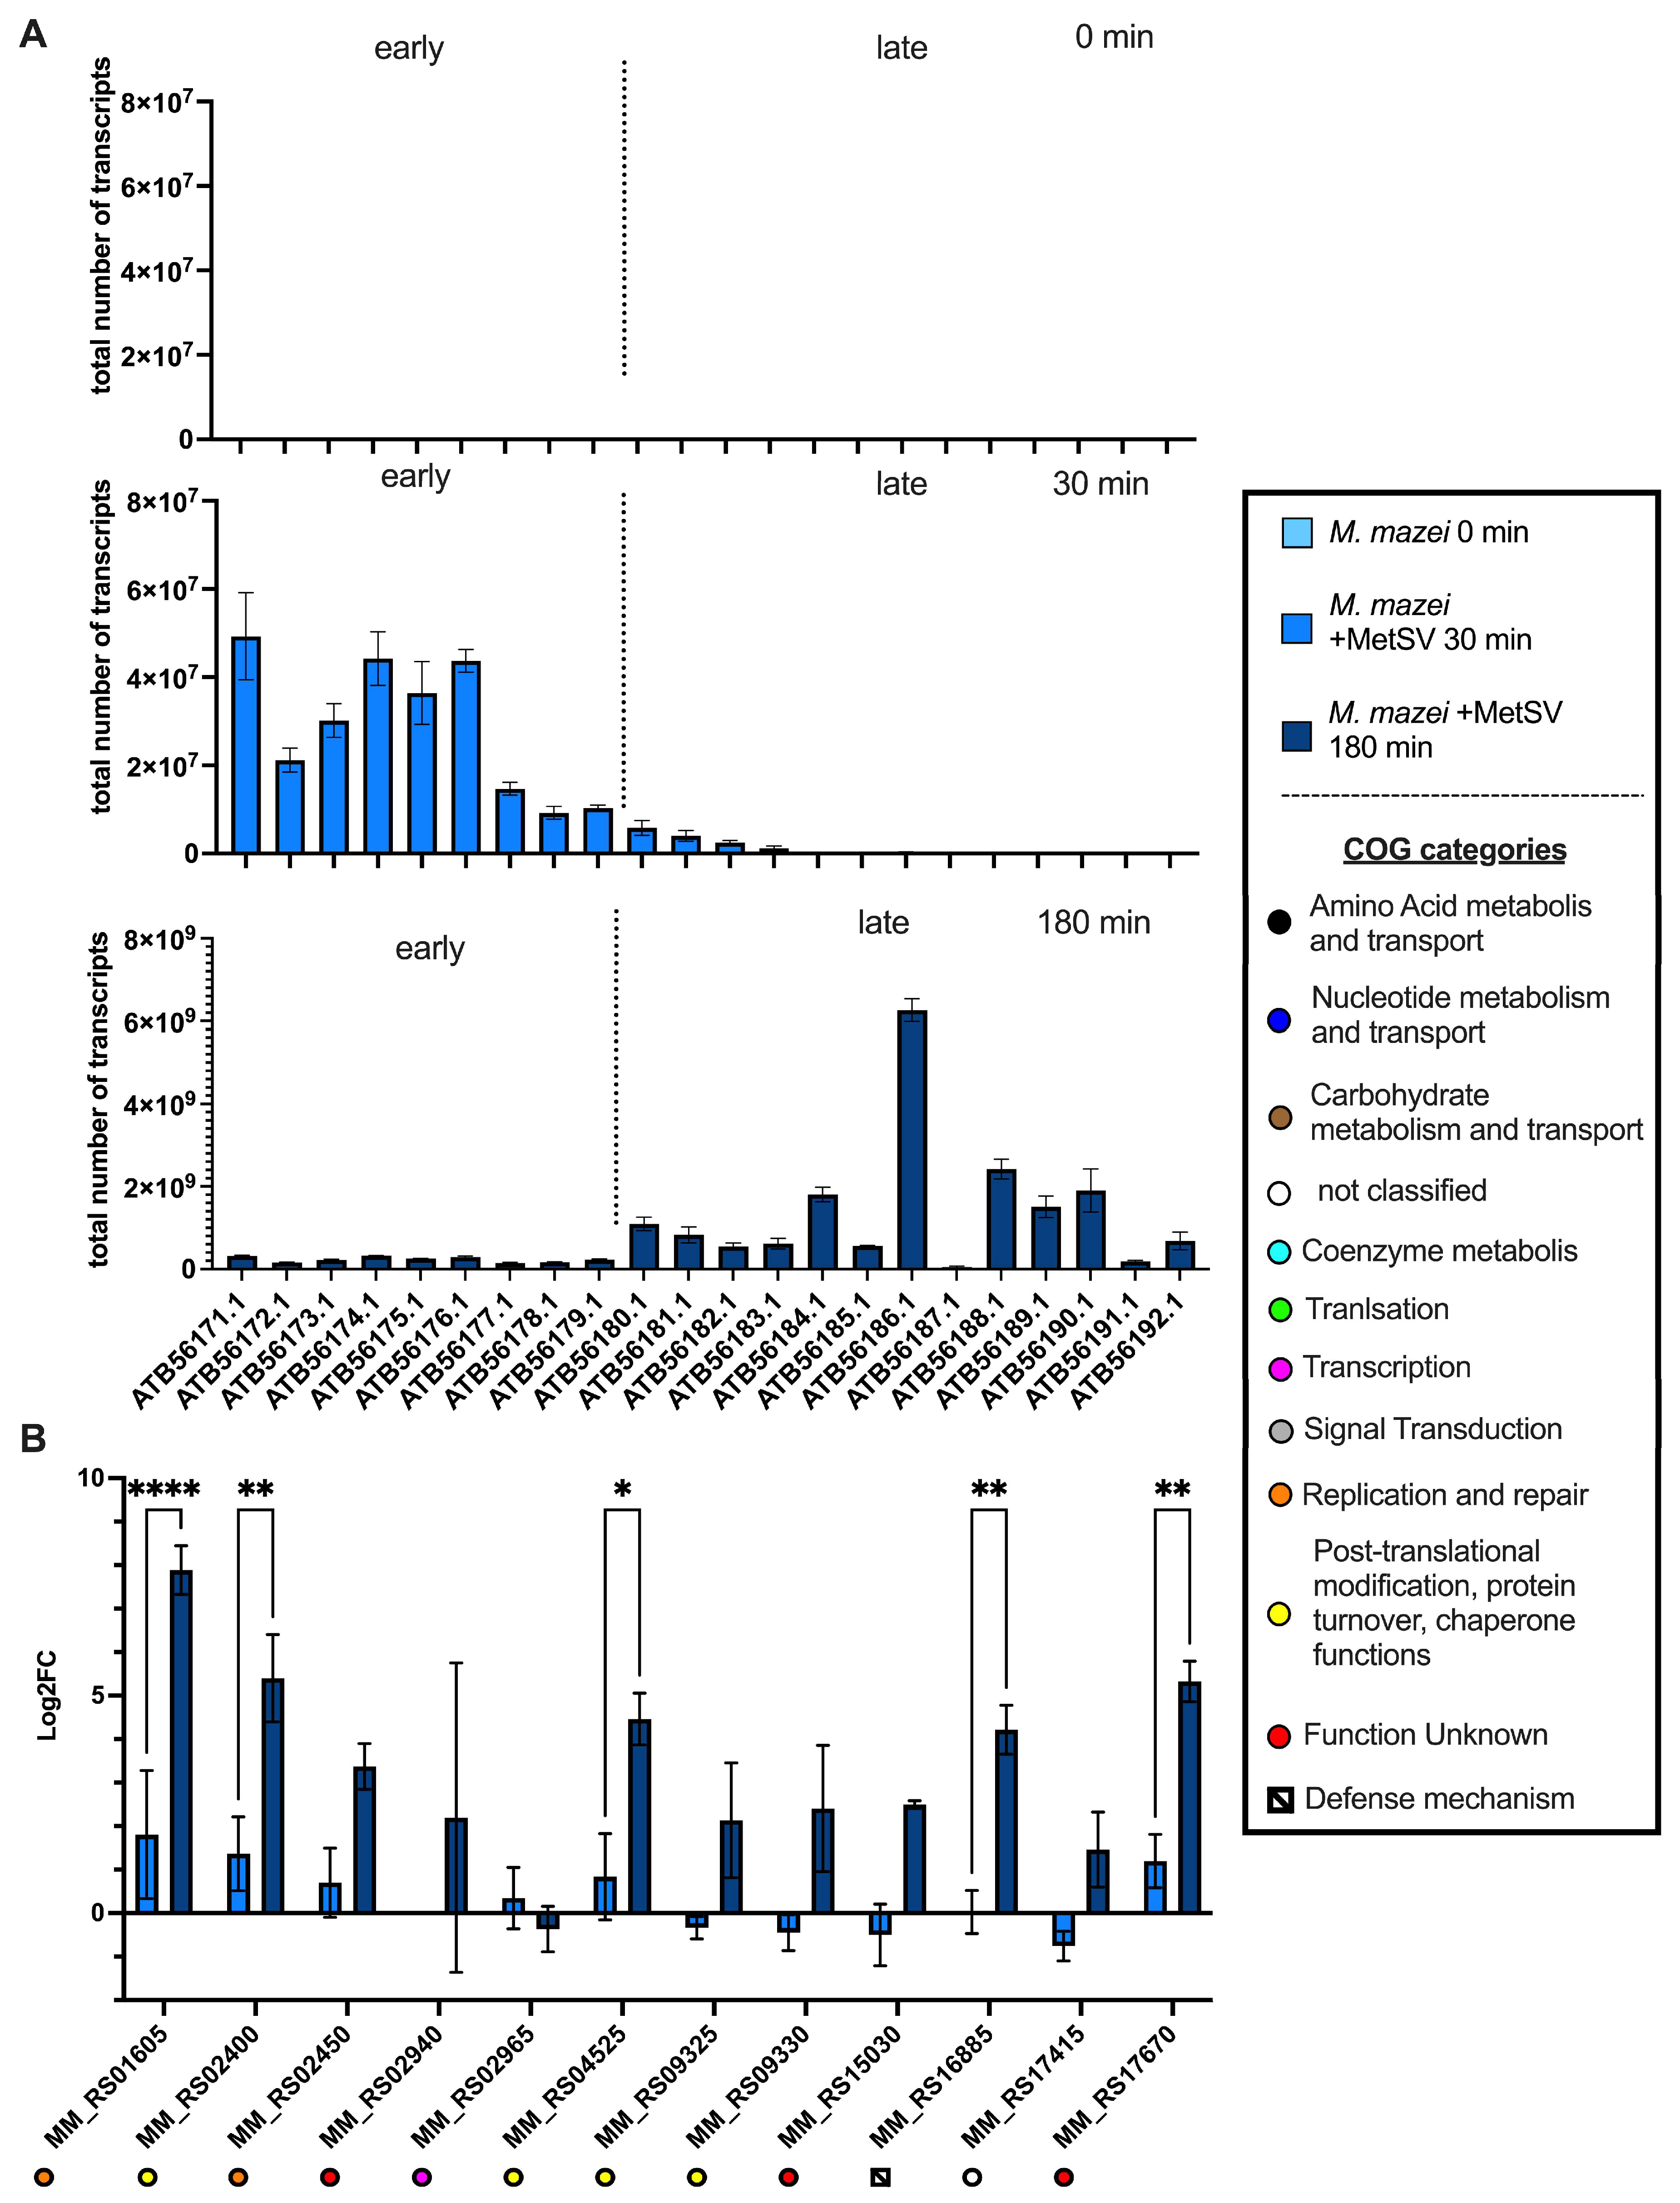
3.2. Dual-RNAseq Analysis–READemption, DESeq2 and eggNOG Results
3.2.1. MetSV Is Globally Changing M. mazei Transcriptome
3.2.2. Transcription of Viral Replication Related Genes
3.2.3. Effects of MetSV Infection on M. mazei-Derived Defense Genes
3.2.4. Transcriptional Changes of Further Genes and Gene Categories
3.2.5. Infection Changes of Host sRNAs Transcription
3.2.6. Classification of Virus Genes and Verification of RNAseq Results by qRT-PCR
4. Discussion
4.1. Transmission Electron Microscopy Demonstrates Key Steps in MetSV Infection
4.2. Dual-RNAseq
4.2.1. M. mazei Defense Reactions to Prevent MetSV Infection
4.2.2. Clusters of Co-Transcribed Genes of MetSV and M. mazei Reveal Interaction Network in Viral Replication
4.2.3. Role of Host Genes in MetSV Particle Assembly
4.2.4. Global Mechanisms in MetSV-Infected Cells and Their Potential Role in Cell Lysis
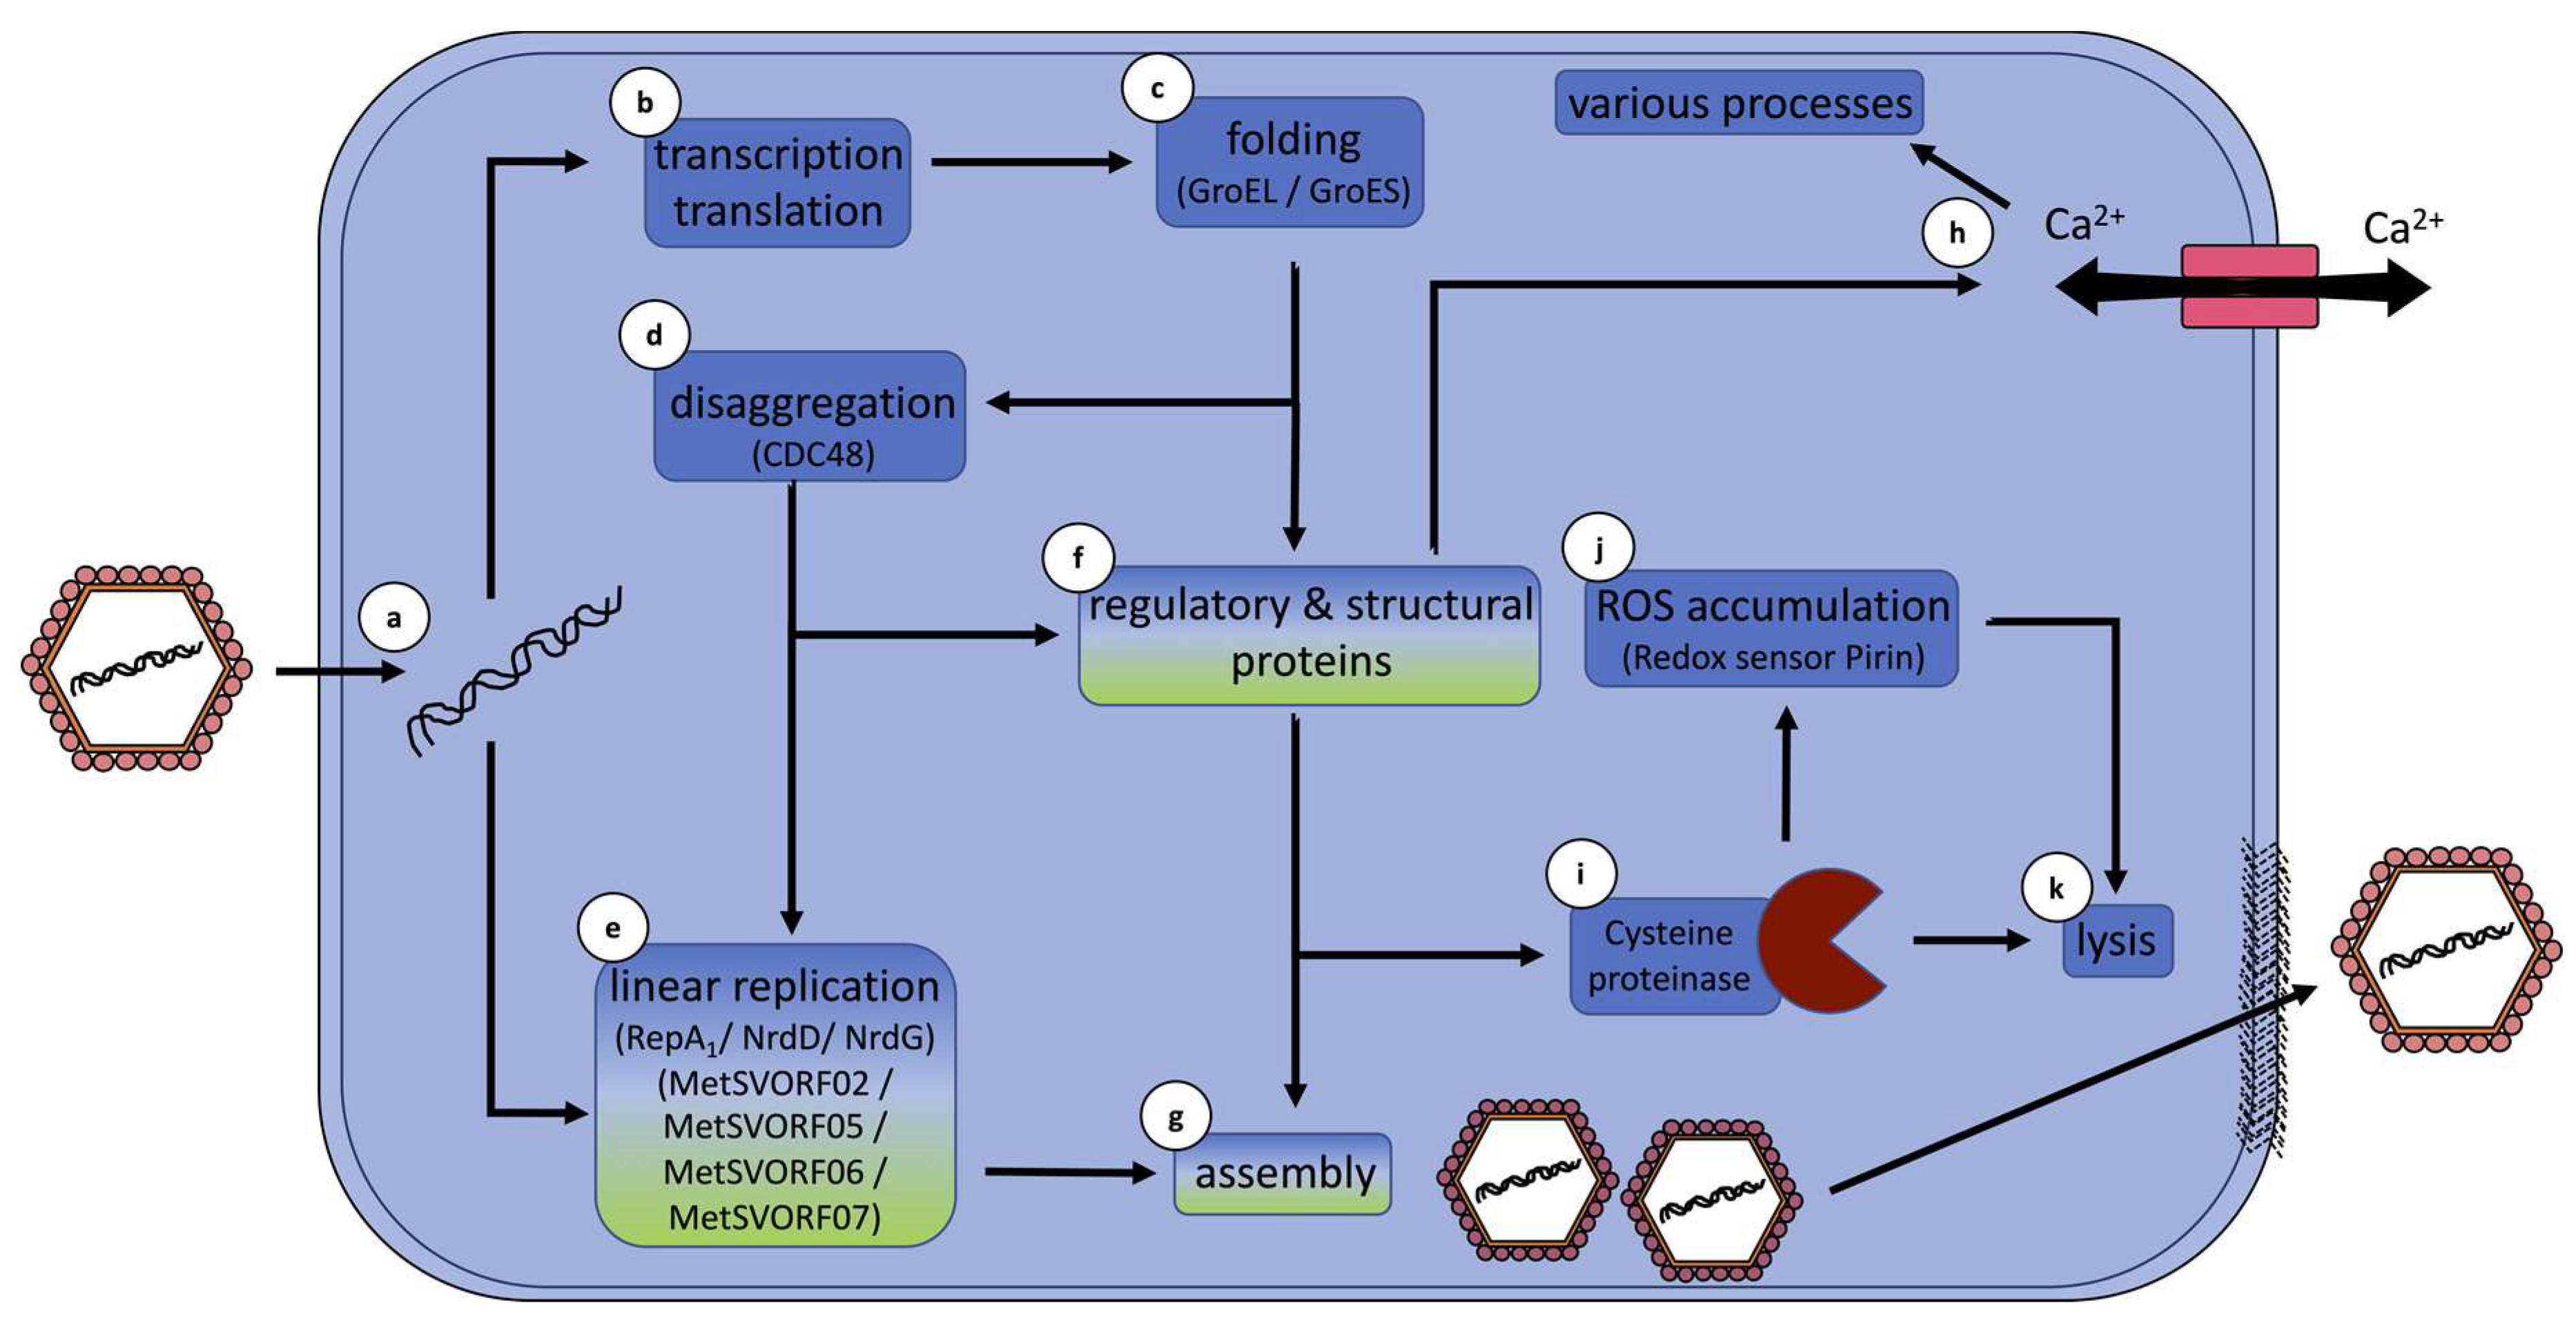
5. Hypothetical Infection Model Summarizes Conclusions
Supplementary Materials
Author Contributions
Funding
Institutional Review Board Statement
Informed Consent Statement
Data Availability Statement
Acknowledgments
Conflicts of Interest
References
- Krupovic, M.; Cvirkaite-Krupovic, V.; Iranzo, J.; Prangishvili, D.; Koonin, E.V. Viruses of archaea: Structural, functional, environmental and evolutionary genomics. Virus Res. 2017, 244, 181–193. [Google Scholar] [CrossRef] [PubMed]
- Dellas, N.; Snyder, J.C.; Bolduc, B.; Young, M.J. Archaeal Viruses: Diversity, Replication, and Structure. Annu. Rev. Virol. 2014, 1, 399–426. [Google Scholar] [CrossRef] [PubMed]
- Pietilä, M.K.; Demina, T.A.; Atanasova, N.S.; Oksanen, H.M.; Bamford, D.H. Archaeal viruses and bacteriophages: Comparisons and contrasts. Trends Microbiol. 2014, 22, 334–344. [Google Scholar] [CrossRef] [PubMed]
- Tittes, C.; Schwarzer, S.; Quax, T.E.F. Viral Hijack of Filamentous Surface Structures in Archaea and Bacteria. Viruses 2021, 13, 164. [Google Scholar] [CrossRef] [PubMed]
- Quemin, E.R.J.; Lucas, S.; Daum, B.; Quax, T.; Kühlbrandt, W.; Forterre, P.; Albers, S.-V.; Prangishvili, D.; Krupovic, M. First Insights into the Entry Process of Hyperthermophilic Archaeal Viruses. J. Virol. 2013, 87, 13379–13385. [Google Scholar] [CrossRef]
- Howard-Varona, C.; Lindback, M.M.; Bastien, G.E.; Solonenko, N.; Zayed, A.A.; Jang, H.; Andreopoulos, B.; Brewer, H.M.; Del Rio, T.G.; Adkins, J.N.; et al. Phage-specific metabolic reprogramming of virocells. ISME J. 2020, 14, 881–895. [Google Scholar] [CrossRef]
- Kutter, E.; Bryan, D.; Ray, G.; Brewster, E.; Blasdel, B.; Guttman, B. From Host to Phage Metabolism: Hot Tales of Phage T4’s Takeover of E. coli. Viruses 2018, 10, 387. [Google Scholar] [CrossRef]
- Hänninen, A.-L.; Bamford, D.H.; Bamford, J.K. Assembly of Membrane-Containing Bacteriophage PRD1 Is Dependent on GroEL and GroES. Virology 1997, 227, 207–210. [Google Scholar] [CrossRef]
- Fayet, O.; Ziegelhoffer, T.; Georgopoulos, C. The groES and groEL heat shock gene products of Escherichia coli are essential for bacterial growth at all temperatures. J. Bacteriol. 1989, 171, 1379–1385. [Google Scholar] [CrossRef]
- Prangishvili, D.; Bamford, D.H.; Forterre, P.; Iranzo, J.; Koonin, E.V.; Krupovic, M. The enigmatic archaeal virosphere. Nat. Rev. Microbiol. 2017, 15, 724–739. [Google Scholar] [CrossRef]
- Snyder, J.C.; Brumfield, S.K.; Peng, N.; She, Q.; Young, M.J. Sulfolobus Turreted Icosahedral Virus c92 Protein Responsible for the Formation of Pyramid-Like Cellular Lysis Structures. J. Virol. 2011, 85, 6287–6292. [Google Scholar] [CrossRef]
- Brumfield, S.K.; Ortmann, A.C.; Ruigrok, V.; Suci, P.; Douglas, T.; Young, M.J. Particle Assembly and Ultrastructural Features Associated with Replication of the Lytic Archaeal Virus Sulfolobus Turreted Icosahedral Virus. J. Virol. 2009, 83, 5964–5970. [Google Scholar] [CrossRef]
- Weidenbach, K.; Wolf, S.; Kupczok, A.; Kern, T.; Fischer, M.A.; Reetz, J.; Urbańska, N.; Künzel, S.; Schmitz, R.A.; Rother, M. Characterization of Blf4, an Archaeal Lytic Virus Targeting a Member of the Methanomicrobiales. Viruses 2021, 13, 1934. [Google Scholar] [CrossRef]
- Wolf, S.; Fischer, M.A.; Kupczok, A.; Reetz, J.; Kern, T.; Schmitz, R.A.; Rother, M. Characterization of the lytic archaeal virus Drs3 infecting Methanobacterium formicicum. Arch Virol. 2018, 164, 667–674. [Google Scholar] [CrossRef]
- Weidenbach, K.; Nickel, L.; Neve, H.; Alkhnbashi, O.S.; Künzel, S.; Kupczok, A.; Bauersachs, T.; Cassidy, L.; Tholey, A.; Backofen, R.; et al. Methanosarcina Spherical Virus, a Novel Archaeal Lytic Virus Targeting Methanosarcina Strains. J. Virol. 2017, 91, e00955–e01017. [Google Scholar] [CrossRef]
- Schoch, C.L.; Ciufo, S.; Domrachev, M.; Hotton, C.L.; Kannan, S.; Khovanskaya, R.; Leipe, D.; McVeigh, R.; O’Neill, K.; Robbertse, B.; et al. NCBI Taxonomy: A comprehensive update on curation, resources and tools. Database 2020, 2020, baaa062. [Google Scholar] [CrossRef]
- Nickel, L.; Weidenbach, K.; Jäger, D.; Backofen, R.; Lange, S.J.; Heidrich, N.; Schmitz, R.A. Two CRISPR-Cas systems in Methanosarcina mazeistrain Gö1 display common processing features despite belonging to different types I and III. RNA Biol. 2013, 10, 779–791. [Google Scholar] [CrossRef]
- Ehlers, C.; Veit, K.; Gottschalk, G.; Schmitz-Streit, R.A. Functional organization of a singlenifcluster in the mesophilic archaeonMethanosarcina mazeistrain Gö1. Archaea 2002, 1, 143–150. [Google Scholar] [CrossRef]
- Deppenmeier, U.; Blaut, M.; Mahlmann, A.; Gottschalk, G. Membrane-bound F420H2-dependent heterodisulfide reductase in methanogenic bacterium strain Göl andMethanolobus tindarius. FEBS Lett. 1990, 261, 199–203. [Google Scholar] [CrossRef]
- Martin, M. Cutadapt removes adapter sequences from high-throughput sequencing reads. EMBnet. J. 2011, 17, 10–12. [Google Scholar] [CrossRef]
- Förstner, K.U.; Vogel, J.; Sharma, C.M. READemption--a tool for the computational analysis of deep-sequencing-based transcriptome data. Bioinformatics 2014, 30, 3421–3423. [Google Scholar] [CrossRef] [PubMed]
- Hoffmann, S.; Otto, C.; Kurtz, S.; Sharma, C.M.; Khaitovich, P.; Vogel, J.; Stadler, P.F.; Hackermüller, J. Fast Mapping of Short Sequences with Mismatches, Insertions and Deletions Using Index Structures. PLOS Comput. Biol. 2009, 5, e1000502. [Google Scholar] [CrossRef] [PubMed]
- Otto, C.; Stadler, P.F.; Hoffmann, S. Lacking alignments? The next-generation sequencing mapper segemehl revisited. Bioinformatics 2014, 30, 1837–1843. [Google Scholar] [CrossRef] [PubMed]
- Jäger, D.; Sharma, C.M.; Thomsen, J.; Ehlers, C.; Vogel, J.; Schmitz, R.A. Deep sequencing analysis of the Methanosarcina mazei Gö1 transcriptome in response to nitrogen availability. Proc. Natl. Acad. Sci. USA 2009, 106, 21878–21882. [Google Scholar] [CrossRef] [PubMed]
- Cassidy, L.; Prasse, D.; Linke, D.; Schmitz, R.A.; Tholey, A. Combination of Bottom-up 2D-LC-MS and Semi-top-down GelFree-LC-MS Enhances Coverage of Proteome and Low Molecular Weight Short Open Reading Frame Encoded Peptides of the Archaeon Methanosarcina mazei. J. Proteome Res. 2016, 15, 3773–3783. [Google Scholar] [CrossRef]
- Wagner, G.P.; Kin, K.; Lynch, V.J. Measurement of mRNA abundance using RNA-seq data: RPKM measure is inconsistent among samples. Theory Biosci. 2012, 131, 281–285. [Google Scholar] [CrossRef]
- Love, M.I.; Huber, W.; Anders, S. Moderated estimation of fold change and dispersion for RNA-seq data with DESeq2. Genome Biol. 2014, 15, 550. [Google Scholar] [CrossRef]
- Gu, Z.; Gu, L.; Eils, R.; Schlesner, M.; Brors, B. circlize implements and enhances circular visualization in R. Bioinformatics 2014, 30, 2811–2812. [Google Scholar] [CrossRef]
- Gu, Z. Complex heatmap visualization. iMeta 2022, 1, e43. [Google Scholar] [CrossRef]
- Gu, Z.; Eils, R.; Schlesner, M. Complex heatmaps reveal patterns and correlations in multidimensional genomic data. Bioinformatics 2016, 32, 2847–2849. [Google Scholar] [CrossRef]
- R Core Team. R: A Language and Environment for Statistical Computing; R Foundation for Statistical Computing: Vienna, Austria, 2022; Available online: https://www.R-project.org/ (accessed on 10 March 2022).
- Wickham, H. Programming with ggplot2. In ggplot2. Use R! Springer: Cham, Switzerland, 2016; pp. 241–253. [Google Scholar] [CrossRef]
- Cantalapiedra, C.P.; Hernández-Plaza, A.; Letunic, I.; Bork, P.; Huerta-Cepas, J. eggNOG-mapper v2: Functional Annotation, Orthology Assignments, and Domain Prediction at the Metagenomic Scale. Mol. Biol. Evol. 2021, 38, 5825–5829. [Google Scholar] [CrossRef]
- Huerta-Cepas, J.; Szklarczyk, D.; Heller, D.; Hernández-Plaza, A.; Forslund, S.K.; Cook, H.V.; Mende, D.R.; Letunic, I.; Rattei, T.; Jensen, L.J.; et al. eggNOG 5.0: A hierarchical, functionally and phylogenetically annotated orthology resource based on 5090 organisms and 2502 viruses. Nucleic Acids Res. 2018, 47, D309–D314. [Google Scholar] [CrossRef]
- Buchfink, B.; Reuter, K.; Drost, H.-G. Sensitive protein alignments at tree-of-life scale using DIAMOND. Nat. Methods 2021, 18, 366–368. [Google Scholar] [CrossRef]
- Weidenbach, K.; Ehlers, C.; Kock, J.; Ehrenreich, A.; Schmitz, R.A. Insights into the NrpR regulon in Methanosarcina mazei Gö1. Arch. Microbiol. 2008, 190, 319–332. [Google Scholar] [CrossRef] [PubMed]
- Veit, K.; Ehlers, C.; Schmitz, R.A. Effects of Nitrogen and Carbon Sources on Transcription of Soluble Methyltransferases in Methanosarcina mazei Strain Gö1. J. Bacteriol. 2005, 187, 6147–6154. [Google Scholar] [CrossRef]
- Whelan, J.A.; Russell, N.B.; Whelan, M.A. A method for the absolute quantification of cDNA using real-time PCR. J. Immunol. Methods 2003, 278, 261–269. [Google Scholar] [CrossRef]
- Ulbricht, A.; Nickel, L.; Weidenbach, K.; Gebauer, H.V.; Kießling, C.; Förstner, K.; Schmitz, R. The CARF Protein MM_0565 Affects Transcription of the Casposon-Encoded cas1-solo Gene in Methanosarcina mazei Gö1. Biomolecules 2020, 10, 1161. [Google Scholar] [CrossRef]
- Krupovic, M.; Makarova, K.S.; Forterre, P.; Prangishvili, D.; Koonin, E.V. Casposons: A new superfamily of self-synthesizing DNA transposons at the origin of prokaryotic CRISPR-Cas immunity. BMC Biol. 2014, 12, 36. [Google Scholar] [CrossRef]
- Joys, T.M. Correlation Between Susceptibility to Bacteriophage PBS1 and Motility in Bacillus subtilis. J. Bacteriol. 1965, 90, 1575–1577. [Google Scholar] [CrossRef]
- Klein, R.; Rössler, N.; Iro, M.; Scholz, H.; Witte, A. Haloarchaeal myovirus φCh1 harbours a phase variation system for the production of protein variants with distinct cell surface adhesion specificities. Mol. Microbiol. 2012, 83, 137–150. [Google Scholar] [CrossRef]
- Maulding, N.D.; Seiler, S.; Pearson, A.; Kreusser, N.; Stuart, J.M. Dual RNA-Seq analysis of SARS-CoV-2 correlates specific human transcriptional response pathways directly to viral expression. Sci. Rep. 2022, 12, 1329. [Google Scholar] [CrossRef] [PubMed]
- Rosani, U.; Young, T.; Bai, C.-M.; Alfaro, A.C.; Venier, P. Dual Analysis of Virus-Host Interactions: The Case of Ostreid herpesvirus 1 and the Cupped Oyster Crassostrea gigas. Evol. Bioinform. 2019, 15, 1176934319831305. [Google Scholar] [CrossRef] [PubMed]
- Fabozzi, G.; Oler, A.J.; Liu, P.; Chen, Y.; Mindaye, S.; Dolan, M.A.; Kenney, H.; Gucek, M.; Zhu, J.; Rabin, R.L.; et al. Strand-Specific Dual RNA Sequencing of Bronchial Epithelial Cells Infected with Influenza A/H3N2 Viruses Reveals Splicing of Gene Segment 6 and Novel Host-Virus Interactions. J. Virol. 2018, 92, e00518. [Google Scholar] [CrossRef] [PubMed]
- Krupovic, M.; Shmakov, S.; Makarova, K.S.; Forterre, P.; Koonin, E.V. Recent Mobility of Casposons, Self-Synthesizing Transposons at the Origin of the CRISPR-Cas Immunity. Genome Biol. Evol. 2016, 8, 375–386. [Google Scholar] [CrossRef]
- Mustafin, R.N.; Khusnutdinova, E.K. The role of transposable elements in the ecological morphogenesis under the influence of stress. Vavilov J. Genet. Breed. 2019, 23, 380–389. [Google Scholar] [CrossRef]
- Schrader, L.; Schmitz, J. The impact of transposable elements in adaptive evolution. Mol. Ecol. 2018, 28, 1537–1549. [Google Scholar] [CrossRef]
- Madlung, A. The Effect of Stress on Genome Regulation and Structure. Ann. Bot. 2004, 94, 481–495. [Google Scholar] [CrossRef]
- Pfeifer, F.; Blaseio, U. Transposition burst of the ISH27 insertion element family inHalobacterium halobium. Nucleic Acids Res. 1990, 18, 6921–6925. [Google Scholar] [CrossRef]
- Macchietto, M.G.; Langlois, R.A.; Shen, S.S. Virus-induced transposable element expression up-regulation in human and mouse host cells. Life Sci. Alliance 2020, 3, e201900536. [Google Scholar] [CrossRef]
- Rodríguez-Beltrán, J.; Rodríguez-Rojas, A.; Guelfo, J.R.; Couce, A.; Blázquez, J. The Escherichia coli SOS Gene dinF Protects against Oxidative Stress and Bile Salts. PLoS ONE 2012, 7, e34791. [Google Scholar] [CrossRef]
- Kenyon, C.J.; Walker, G.C. DNA-damaging agents stimulate gene expression at specific loci in Escherichia coli. Proc. Natl. Acad. Sci. USA 1980, 77, 2819–2823. [Google Scholar] [CrossRef]
- Williams, R.J. Restriction Endonucleases: Classification, Properties, and Applications. Mol. Biotechnol. 2003, 23, 225–244. [Google Scholar] [CrossRef]
- Payne, L.J.; Todeschini, T.C.; Wu, Y.; Perry, B.J.; Ronson, C.W.; Fineran, P.C.; Nobrega, F.L.; A Jackson, S. Identification and classification of antiviral defence systems in bacteria and archaea with PADLOC reveals new system types. Nucleic Acids Res. 2021, 49, 10868–10878. [Google Scholar] [CrossRef]
- Bize, A.; Karlsson, E.A.; Ekefjärd, K.; Quax, T.E.F.; Pina, M.; Prevost, M.-C.; Forterre, P.; Tenaillon, O.; Bernander, R.; Prangishvili, D. A unique virus release mechanism in the Archaea. Proc. Natl. Acad. Sci. USA 2009, 106, 11306–11311. [Google Scholar] [CrossRef]
- Zhao, S.; Ye, Z.; Stanton, R. Misuse of RPKM or TPM normalization when comparing across samples and sequencing protocols. Rna 2020, 26, 903–909. [Google Scholar] [CrossRef]
- Li, B.; Dewey, C.N. RSEM: Accurate transcript quantification from RNA-Seq data with or without a reference genome. BMC Bioinformatics. 2011, 12, 323. [Google Scholar] [CrossRef]
- Li, B.; Ruotti, V.; Stewart, R.M.; Thomson, J.A.; Dewey, C.N. RNA-Seq gene expression estimation with read mapping uncertainty. Bioinformatics 2010, 26, 493–500. [Google Scholar] [CrossRef]
- Hoeben, R.C.; Uil, T.G. Adenovirus DNA Replication. Cold Spring Harb. Perspect. Biol. 2013, 5, a013003. [Google Scholar] [CrossRef]
- Salas, M.; de Vega, M. Protein-Primed Replication of Bacteriophage Φ29 DNA. Enzymes 2016, 39, 137–167. [Google Scholar] [CrossRef]
- Savilahti, H.; Bamford, D.H. Protein-primed DNA replication: Role of inverted terminal repeats in the Escherichia coli bacteriophage PRD1 life cycle. J. Virol. 1993, 67, 4696–4703. [Google Scholar] [CrossRef]
- Nordlund, P.; Reichard, P. Ribonucleotide reductases. Annu. Rev. Biochem. 1998, 67, 71–98. [Google Scholar] [CrossRef]
- Si, M.-R.; Zhang, L.; Yang, Z.-F.; Xu, Y.-X.; Liu, Y.-B.; Jiang, C.-Y.; Wang, Y.; Shen, X.-H.; Liu, S.-J. NrdH Redoxin Enhances Resistance to Multiple Oxidative Stresses by Acting as a Peroxidase Cofactor in Corynebacterium glutamicum. Appl. Environ. Microbiol. 2014, 80, 1750–1762. [Google Scholar] [CrossRef] [PubMed]
- Pakula, T.M.; Caldentey, J.; Serrano, M.; Gutierrez, C.; Hermoso, J.M.; Salas, M.; Bamford, D.H. Characterization of a DNA binding protein of bacteriophage PRD1 involved in DNA replication. Nucleic Acids Res. 1990, 18, 6553–6557. [Google Scholar] [CrossRef] [PubMed]
- Moshe, A.; Gorovits, R. Virus-Induced Aggregates in Infected Cells. Viruses 2012, 4, 2218–2232. [Google Scholar] [CrossRef] [PubMed]
- Niehl, A.; Amari, K.; Heinlein, M. CDC48 function during TMV infection. Plant Signal. Behav. 2013, 8, e22865. [Google Scholar] [CrossRef]
- Zhou, Y.; Yang, W.; Kirberger, M.; Lee, H.-W.; Ayalasomayajula, G.; Yang, J.J. Prediction of EF-hand calcium-binding proteins and analysis of bacterial EF-hand proteins. Proteins: Struct. Funct. Bioinform. 2006, 65, 643–655. [Google Scholar] [CrossRef]
- Carafoli, E. Calcium signaling: A tale for all seasons. Proc. Natl. Acad. Sci. USA 2002, 99, 1115–1122. [Google Scholar] [CrossRef]
- Mohanta, T.K.; Yadav, D.; Khan, A.L.; Hashem, A.; Abd_Allah, E.; Al-Harrasi, A. Molecular Players of EF-hand Containing Calcium Signaling Event in Plants. Int. J. Mol. Sci. 2019, 20, 1476. [Google Scholar] [CrossRef]
- Park, H.-S.; Lee, S.C.; Cardenas, M.E.; Heitman, J. Calcium-Calmodulin-Calcineurin Signaling: A Globally Conserved Virulence Cascade in Eukaryotic Microbial Pathogens. Cell Host Microbe. 2019, 26, 453–462. [Google Scholar] [CrossRef]
- Asai, A.; Qiu, J.-H.; Narita, Y.; Chi, S.; Saito, N.; Shinoura, N.; Hamada, H.; Kuchino, Y.; Kirino, T. High Level Calcineurin Activity Predisposes Neuronal Cells to Apoptosis. J. Biol. Chem. 1999, 274, 34450–34458. [Google Scholar] [CrossRef]
- Domínguez, D.C.; Guragain, M.; Patrauchan, M. Calcium binding proteins and calcium signaling in prokaryotes. Cell Calcium 2015, 57, 151–165. [Google Scholar] [CrossRef]
- Sarkisova, S.A.; Lotlikar, S.R.; Guragain, M.; Kubat, R.; Cloud, J.; Franklin, M.J.; Patrauchan, M.A. A Pseudomonas aeruginosa EF-Hand Protein, EfhP (PA4107), Modulates Stress Responses and Virulence at High Calcium Concentration. PLoS ONE 2014, 9, e98985. [Google Scholar] [CrossRef]
- Salmon, B.L.; Oksman, A.; Goldberg, D.E. Malaria parasite exit from the host erythrocyte: A two-step process requiring extraerythrocytic proteolysis. Proc. Natl. Acad. Sci. USA 2000, 98, 271–276. [Google Scholar] [CrossRef]
- Sajid, M.; McKerrow, J. Cysteine proteases of parasitic organisms☆. Mol. Biochem. Parasitol. 2002, 120, 1–21. [Google Scholar] [CrossRef]
- Freitas, C.D.; Silva, R.O.; Ramos, M.V.; Porfírio, C.T.; Farias, D.F.; Sousa, J.S.; Oliveira, J.P.; Souza, P.F.; Dias, L.P.; Grangeiro, T.B. Identification, characterization, and antifungal activity of cysteine peptidases from Calotropis procera latex. Phytochemistry 2019, 169, 112163. [Google Scholar] [CrossRef]
- Torres-Ossandón, M.J.; Vega-Gálvez, A.; Salas, C.E.; Rubio, J.; Silva-Moreno, E.; Castillo, L. Antifungal activity of proteolytic fraction (P1G10) from (Vasconcellea cundinamarcensis) latex inhibit cell growth and cell wall integrity in Botrytis cinerea. Int. J. Food Microbiol. 2018, 289, 7–16. [Google Scholar] [CrossRef]
- Perez-Dominguez, F.; Carrillo-Beltrán, D.; Blanco, R.; Muñoz, J.; León-Cruz, G.; Corvalan, A.; Urzúa, U.; Calaf, G.; Aguayo, F. Role of Pirin, an Oxidative Stress Sensor Protein, in Epithelial Carcinogenesis. Biology 2021, 10, 116. [Google Scholar] [CrossRef]
- Suleman, M.; Chen, A.; Ma, H.; Wen, S.; Zhao, W.; Lin, D.; Wu, G.; Li, Q. PIR promotes tumorigenesis of breast cancer by upregulating cell cycle activator E2F1. Cell Cycle 2019, 18, 2914–2927. [Google Scholar] [CrossRef]
- Talà, A.; Damiano, F.; Gallo, G.; Pinatel, E.; Calcagnile, M.; Testini, M.; Fico, D.; Rizzo, D.; Sutera, A.; Renzone, G.; et al. Pirin: A novel redox-sensitive modulator of primary and secondary metabolism in Streptomyces. Metab. Eng. 2018, 48, 254–268. [Google Scholar] [CrossRef]
- Hihara, Y.; Muramatsu, M.; Nakamura, K.; Sonoike, K. A cyanobacterial gene encoding an ortholog of Pirin is induced under stress conditions. FEBS Lett. 2004, 574, 101–105. [Google Scholar] [CrossRef]
- Orzaez, D.; De Jong, A.J.; Woltering, E.J. A tomato homologue of the human protein PIRIN is induced during programmed cell death. Plant Mol. Biol. 2001, 46, 459–468. [Google Scholar] [CrossRef] [PubMed]
- Goulard, C.; Langrand, S.; Carniel, E.; Chauvaux, S. The Yersinia pestis Chromosome Encodes Active Addiction Toxins. J. Bacteriol. 2010, 192, 3669–3677. [Google Scholar] [CrossRef] [PubMed]
- Makarova, K.S.; Grishin, N.V.; Koonin, E.V. The HicAB cassette, a putative novel, RNA-targeting toxin-antitoxin system in archaea and bacteria. Bioinformatics 2006, 22, 2581–2584. [Google Scholar] [CrossRef] [PubMed]


Publisher’s Note: MDPI stays neutral with regard to jurisdictional claims in published maps and institutional affiliations. |
© 2022 by the authors. Licensee MDPI, Basel, Switzerland. This article is an open access article distributed under the terms and conditions of the Creative Commons Attribution (CC BY) license (https://creativecommons.org/licenses/by/4.0/).
Share and Cite
Gehlert, F.O.; Sauerwein, T.; Weidenbach, K.; Repnik, U.; Hallack, D.; Förstner, K.U.; Schmitz, R.A. Dual-RNAseq Analysis Unravels Virus-Host Interactions of MetSV and Methanosarcina mazei. Viruses 2022, 14, 2585. https://doi.org/10.3390/v14112585
Gehlert FO, Sauerwein T, Weidenbach K, Repnik U, Hallack D, Förstner KU, Schmitz RA. Dual-RNAseq Analysis Unravels Virus-Host Interactions of MetSV and Methanosarcina mazei. Viruses. 2022; 14(11):2585. https://doi.org/10.3390/v14112585
Chicago/Turabian StyleGehlert, Finn O., Till Sauerwein, Katrin Weidenbach, Urska Repnik, Daniela Hallack, Konrad U. Förstner, and Ruth A. Schmitz. 2022. "Dual-RNAseq Analysis Unravels Virus-Host Interactions of MetSV and Methanosarcina mazei" Viruses 14, no. 11: 2585. https://doi.org/10.3390/v14112585
APA StyleGehlert, F. O., Sauerwein, T., Weidenbach, K., Repnik, U., Hallack, D., Förstner, K. U., & Schmitz, R. A. (2022). Dual-RNAseq Analysis Unravels Virus-Host Interactions of MetSV and Methanosarcina mazei. Viruses, 14(11), 2585. https://doi.org/10.3390/v14112585