

Influence of Staphylococcus aureus Strain Background on Sa3int Phage Life Cycle Switches
 , ,
, ,  ,
,  and
and 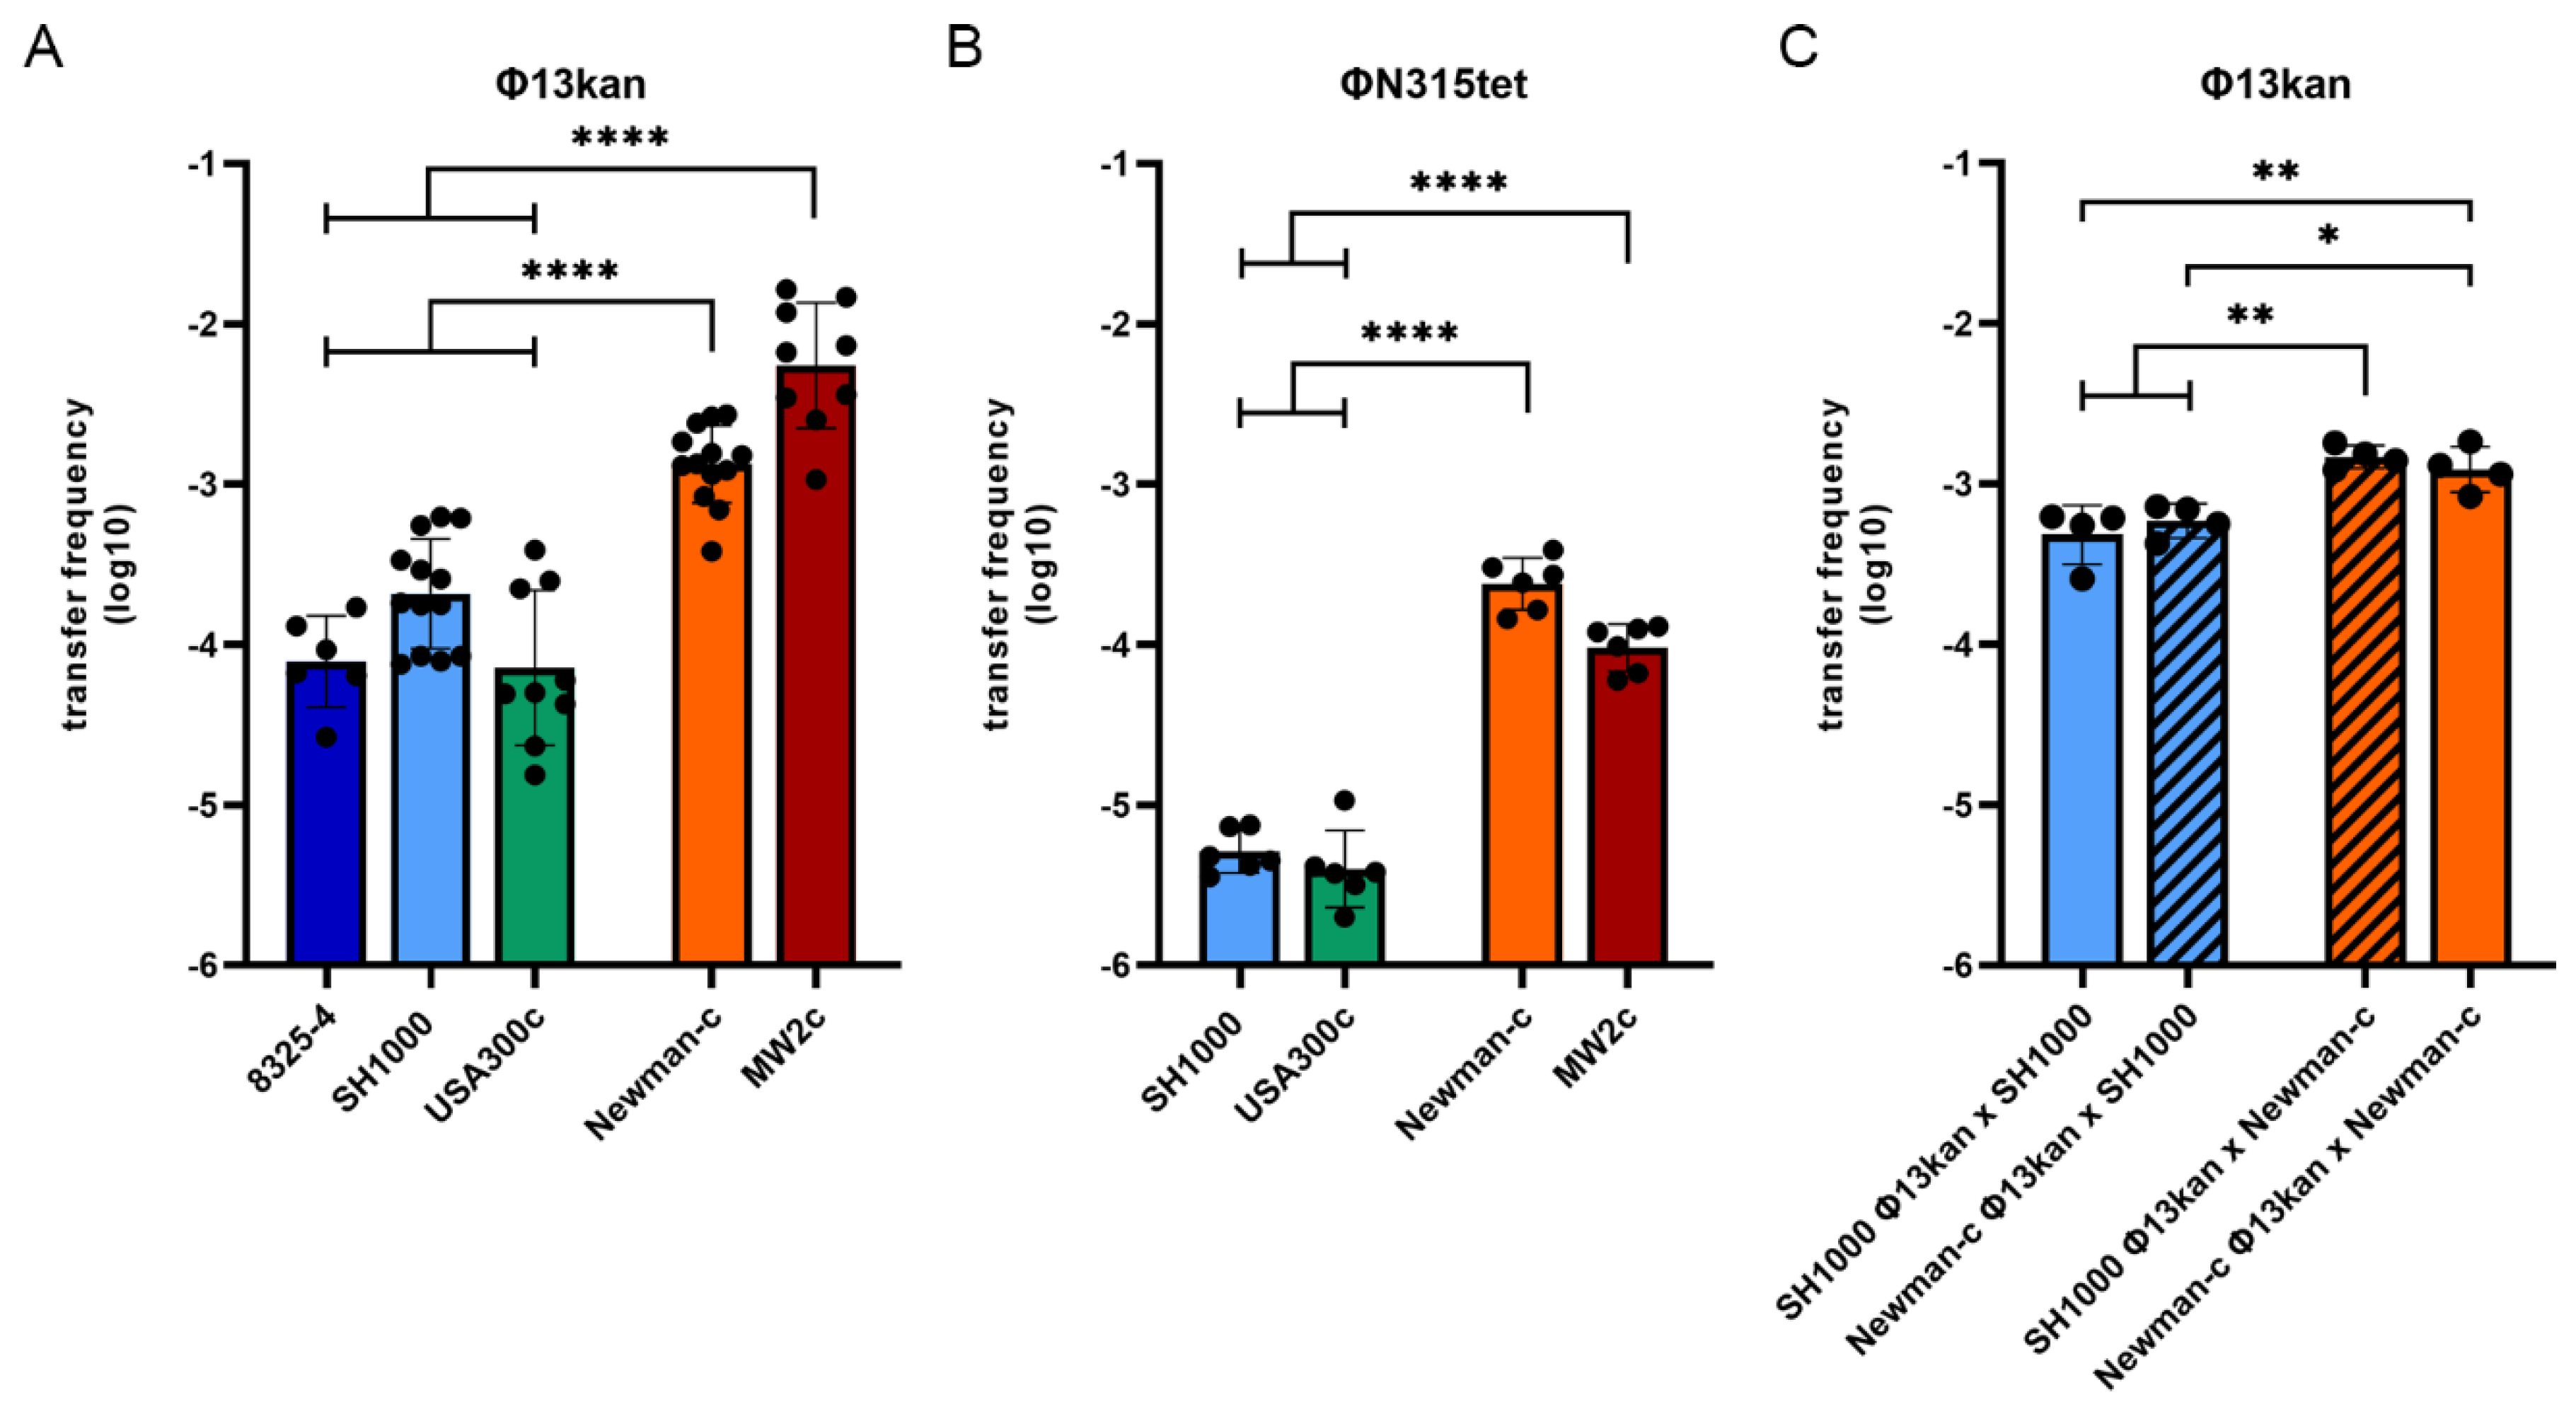
Abstract
1. Introduction
2. Materials and Methods
2.1. Growth Conditions
2.2. Strain Construction
2.2.1. Selection of Strep Resistant Strains
2.2.2. Generation of Phage Cured USA300 (USA300c)
2.2.3. Generation of Phage Lysates and Lysogens
2.2.4. Construction of Phage ΦN315tet
2.2.5. Construction of Phage Φ13kan-Δrep
2.3. Phage Transfer Assay
2.4. Lysogenization Assay
2.5. Plaque Assay
2.6. Phage Adsorption Assay
2.7. Prophage Spontaneous Induction or Induction Using Mitomycin C
2.8. Northern Blot Analysis and Preparation of RNA-Probes
2.9. TagRNAseq and RNAseq
2.9.1. Differential Expression Analysis of Phage-Encoded Genes Using tagRNA-seq
2.9.2. Determination of TSSs
2.10. Statistical Analysis
3. Results
3.1. Sa3int Phage Transfer during Co-Cultivation Depends on the Bacterial Host Strain
3.2. Strain-Dependent Differences in Sa3int Phage Transfer Are Determined by the Recipient
3.3. Phage Adsorption Does Not Account for Strain Dependent Phage Integration
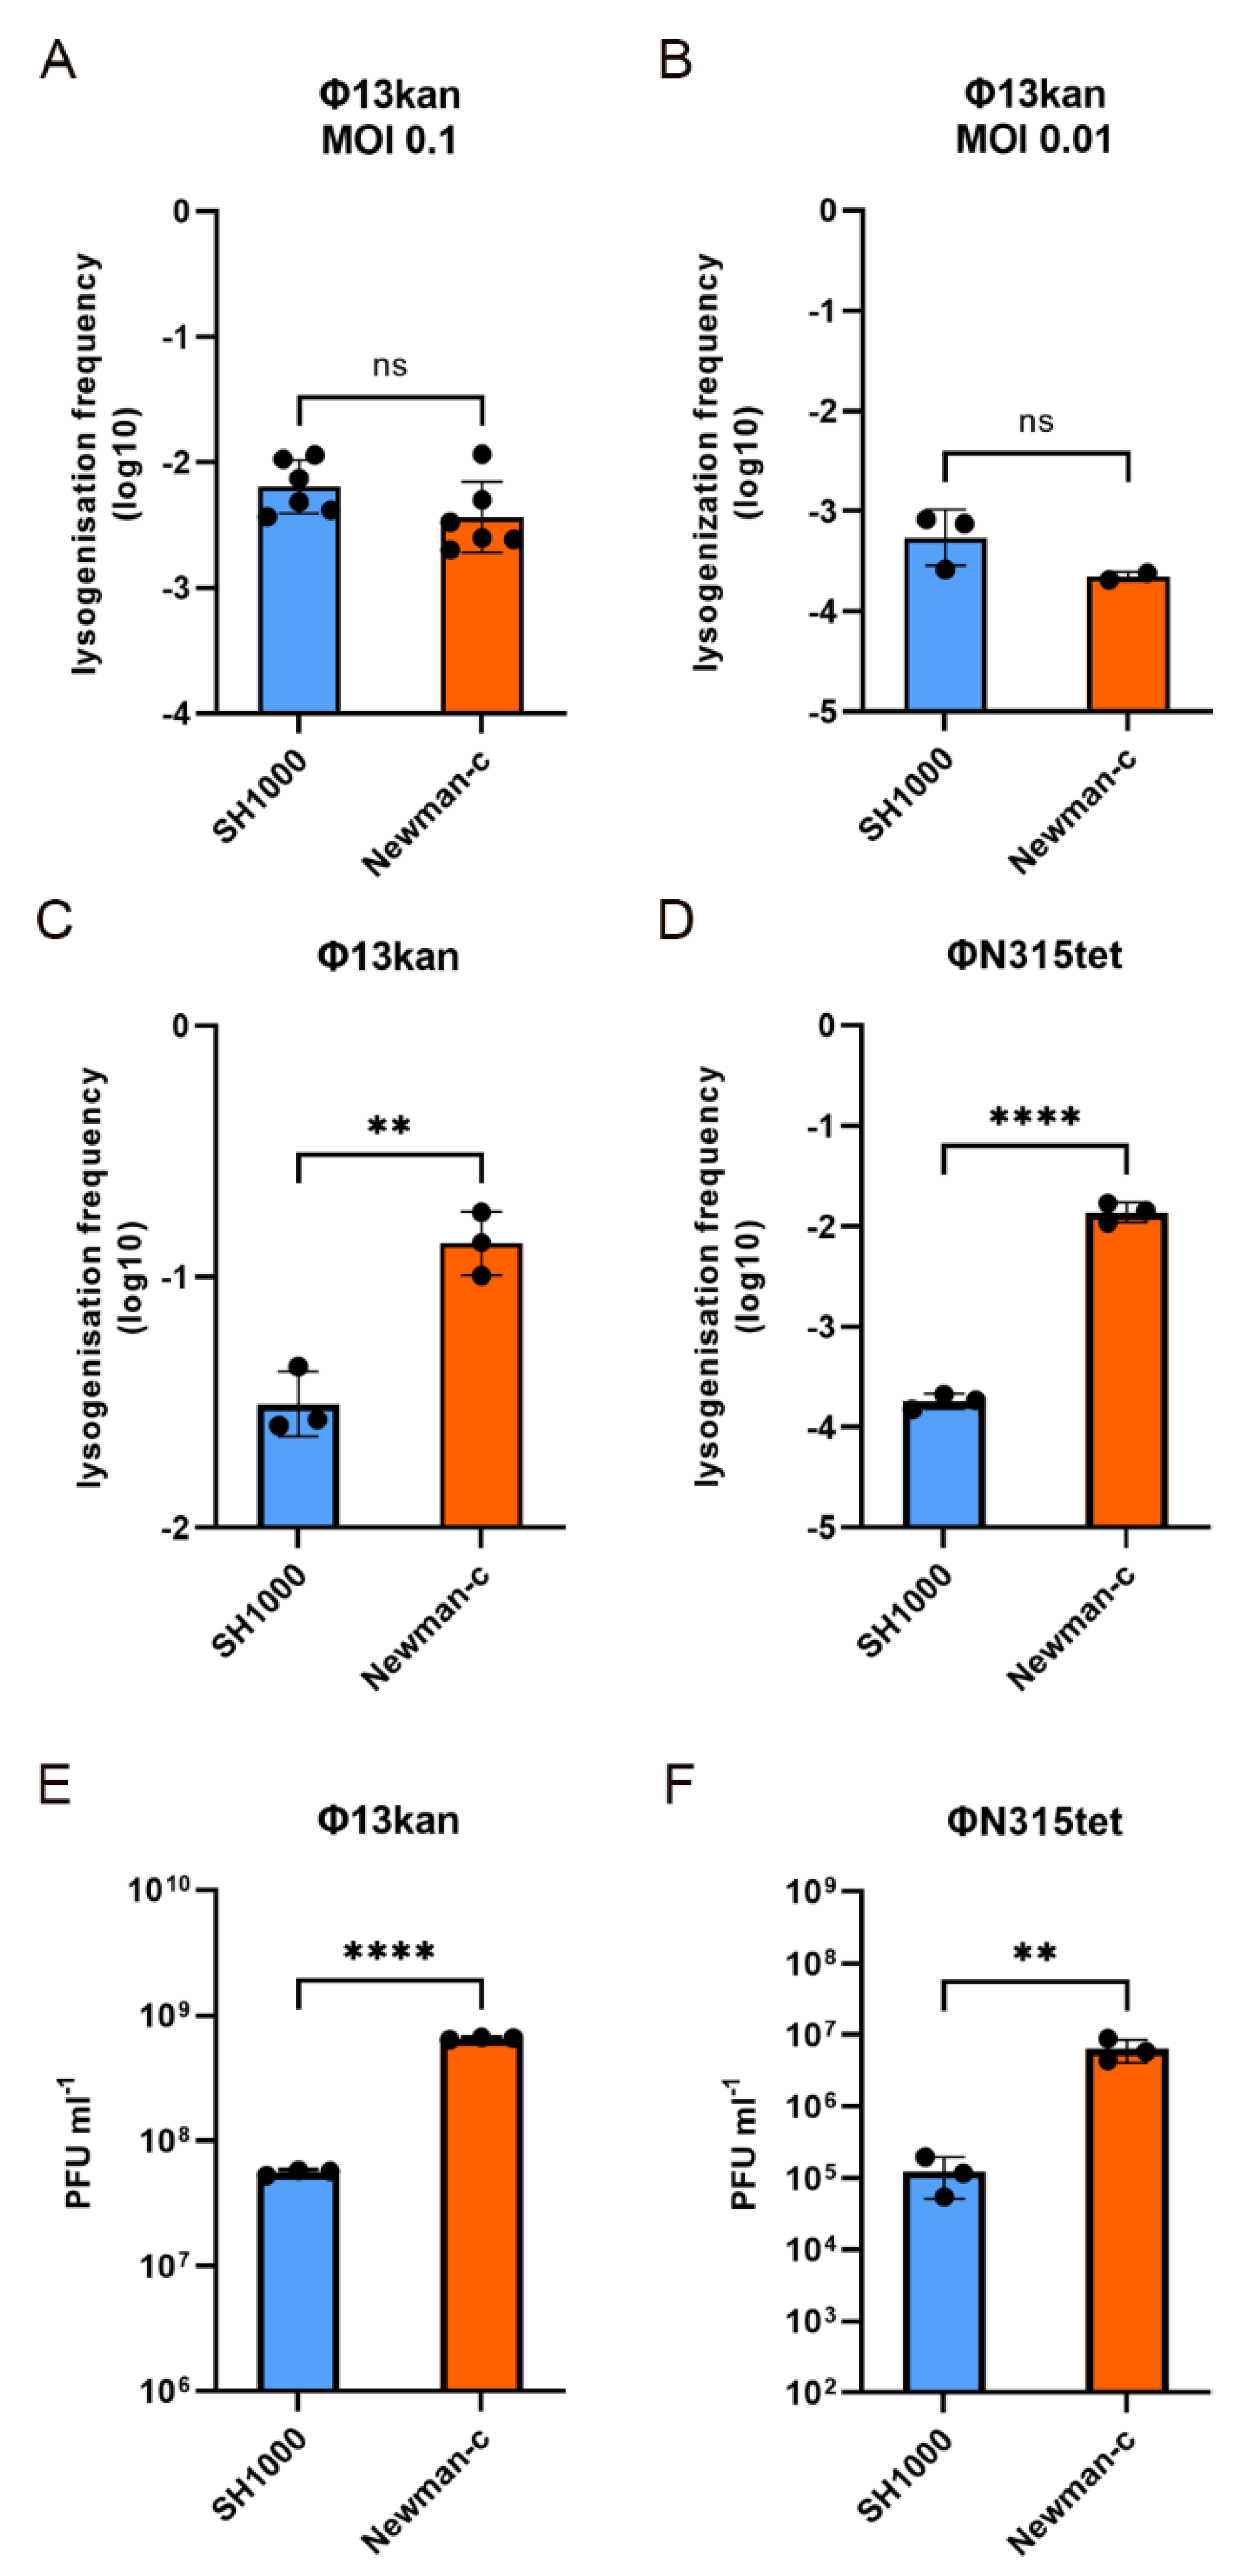
3.4. Strain Dependent Sa3int Lysogenization and Replication
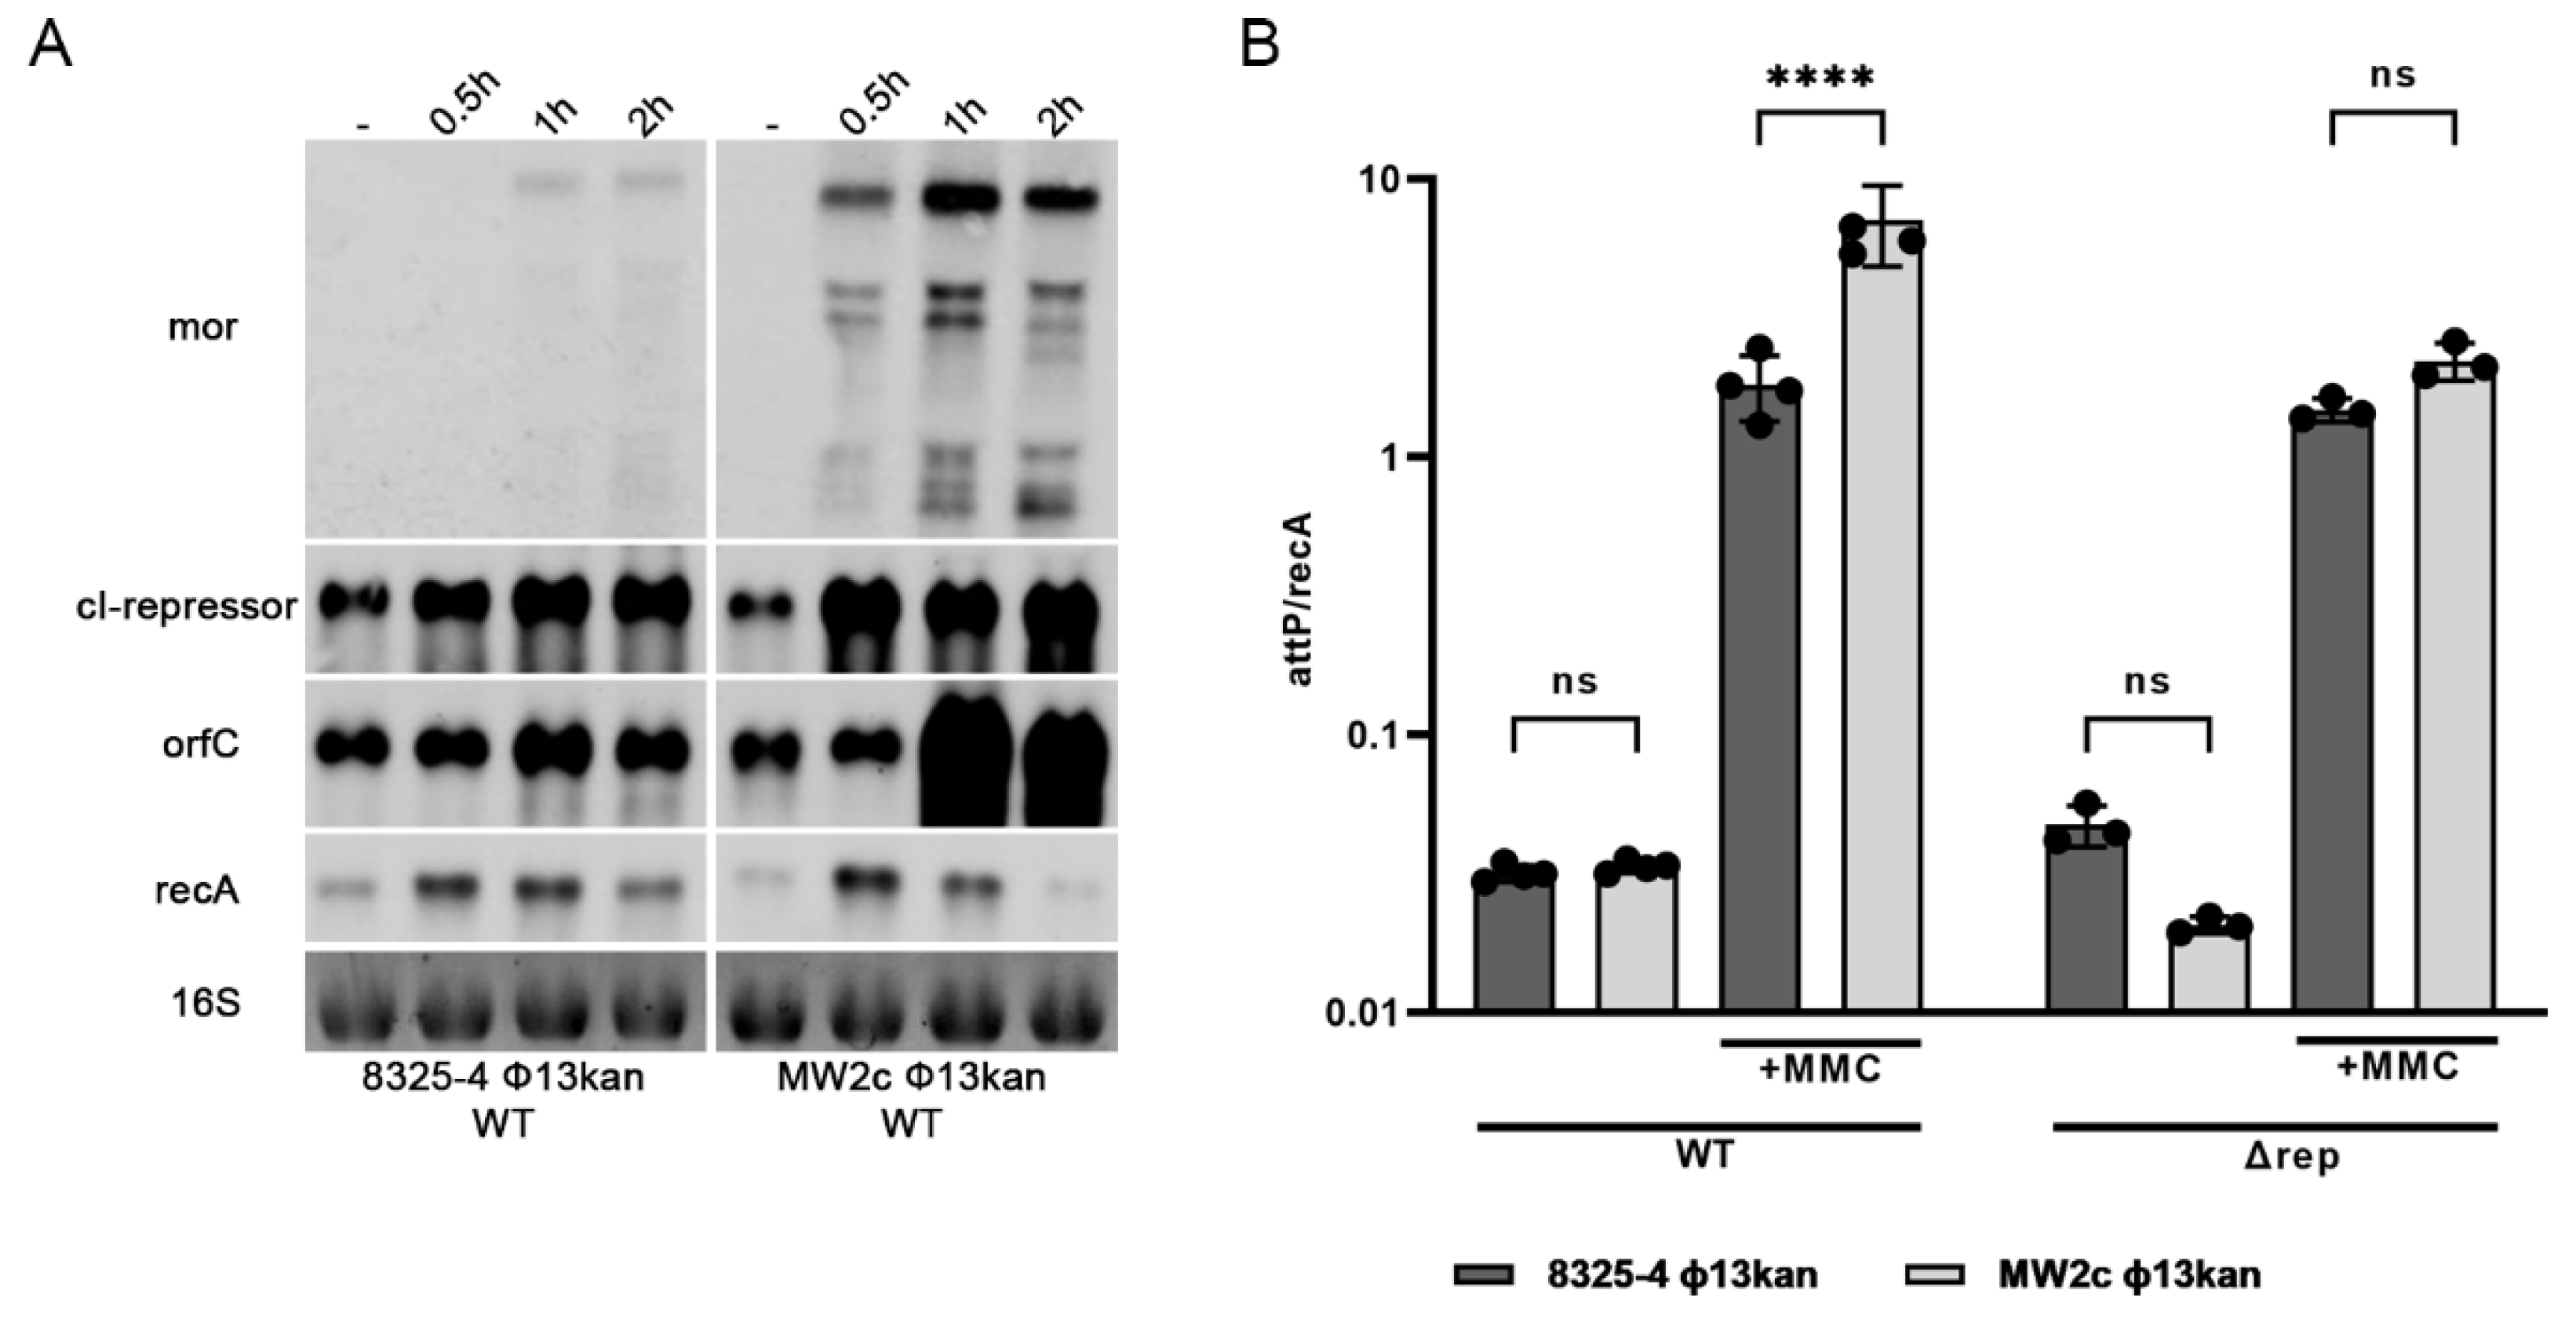
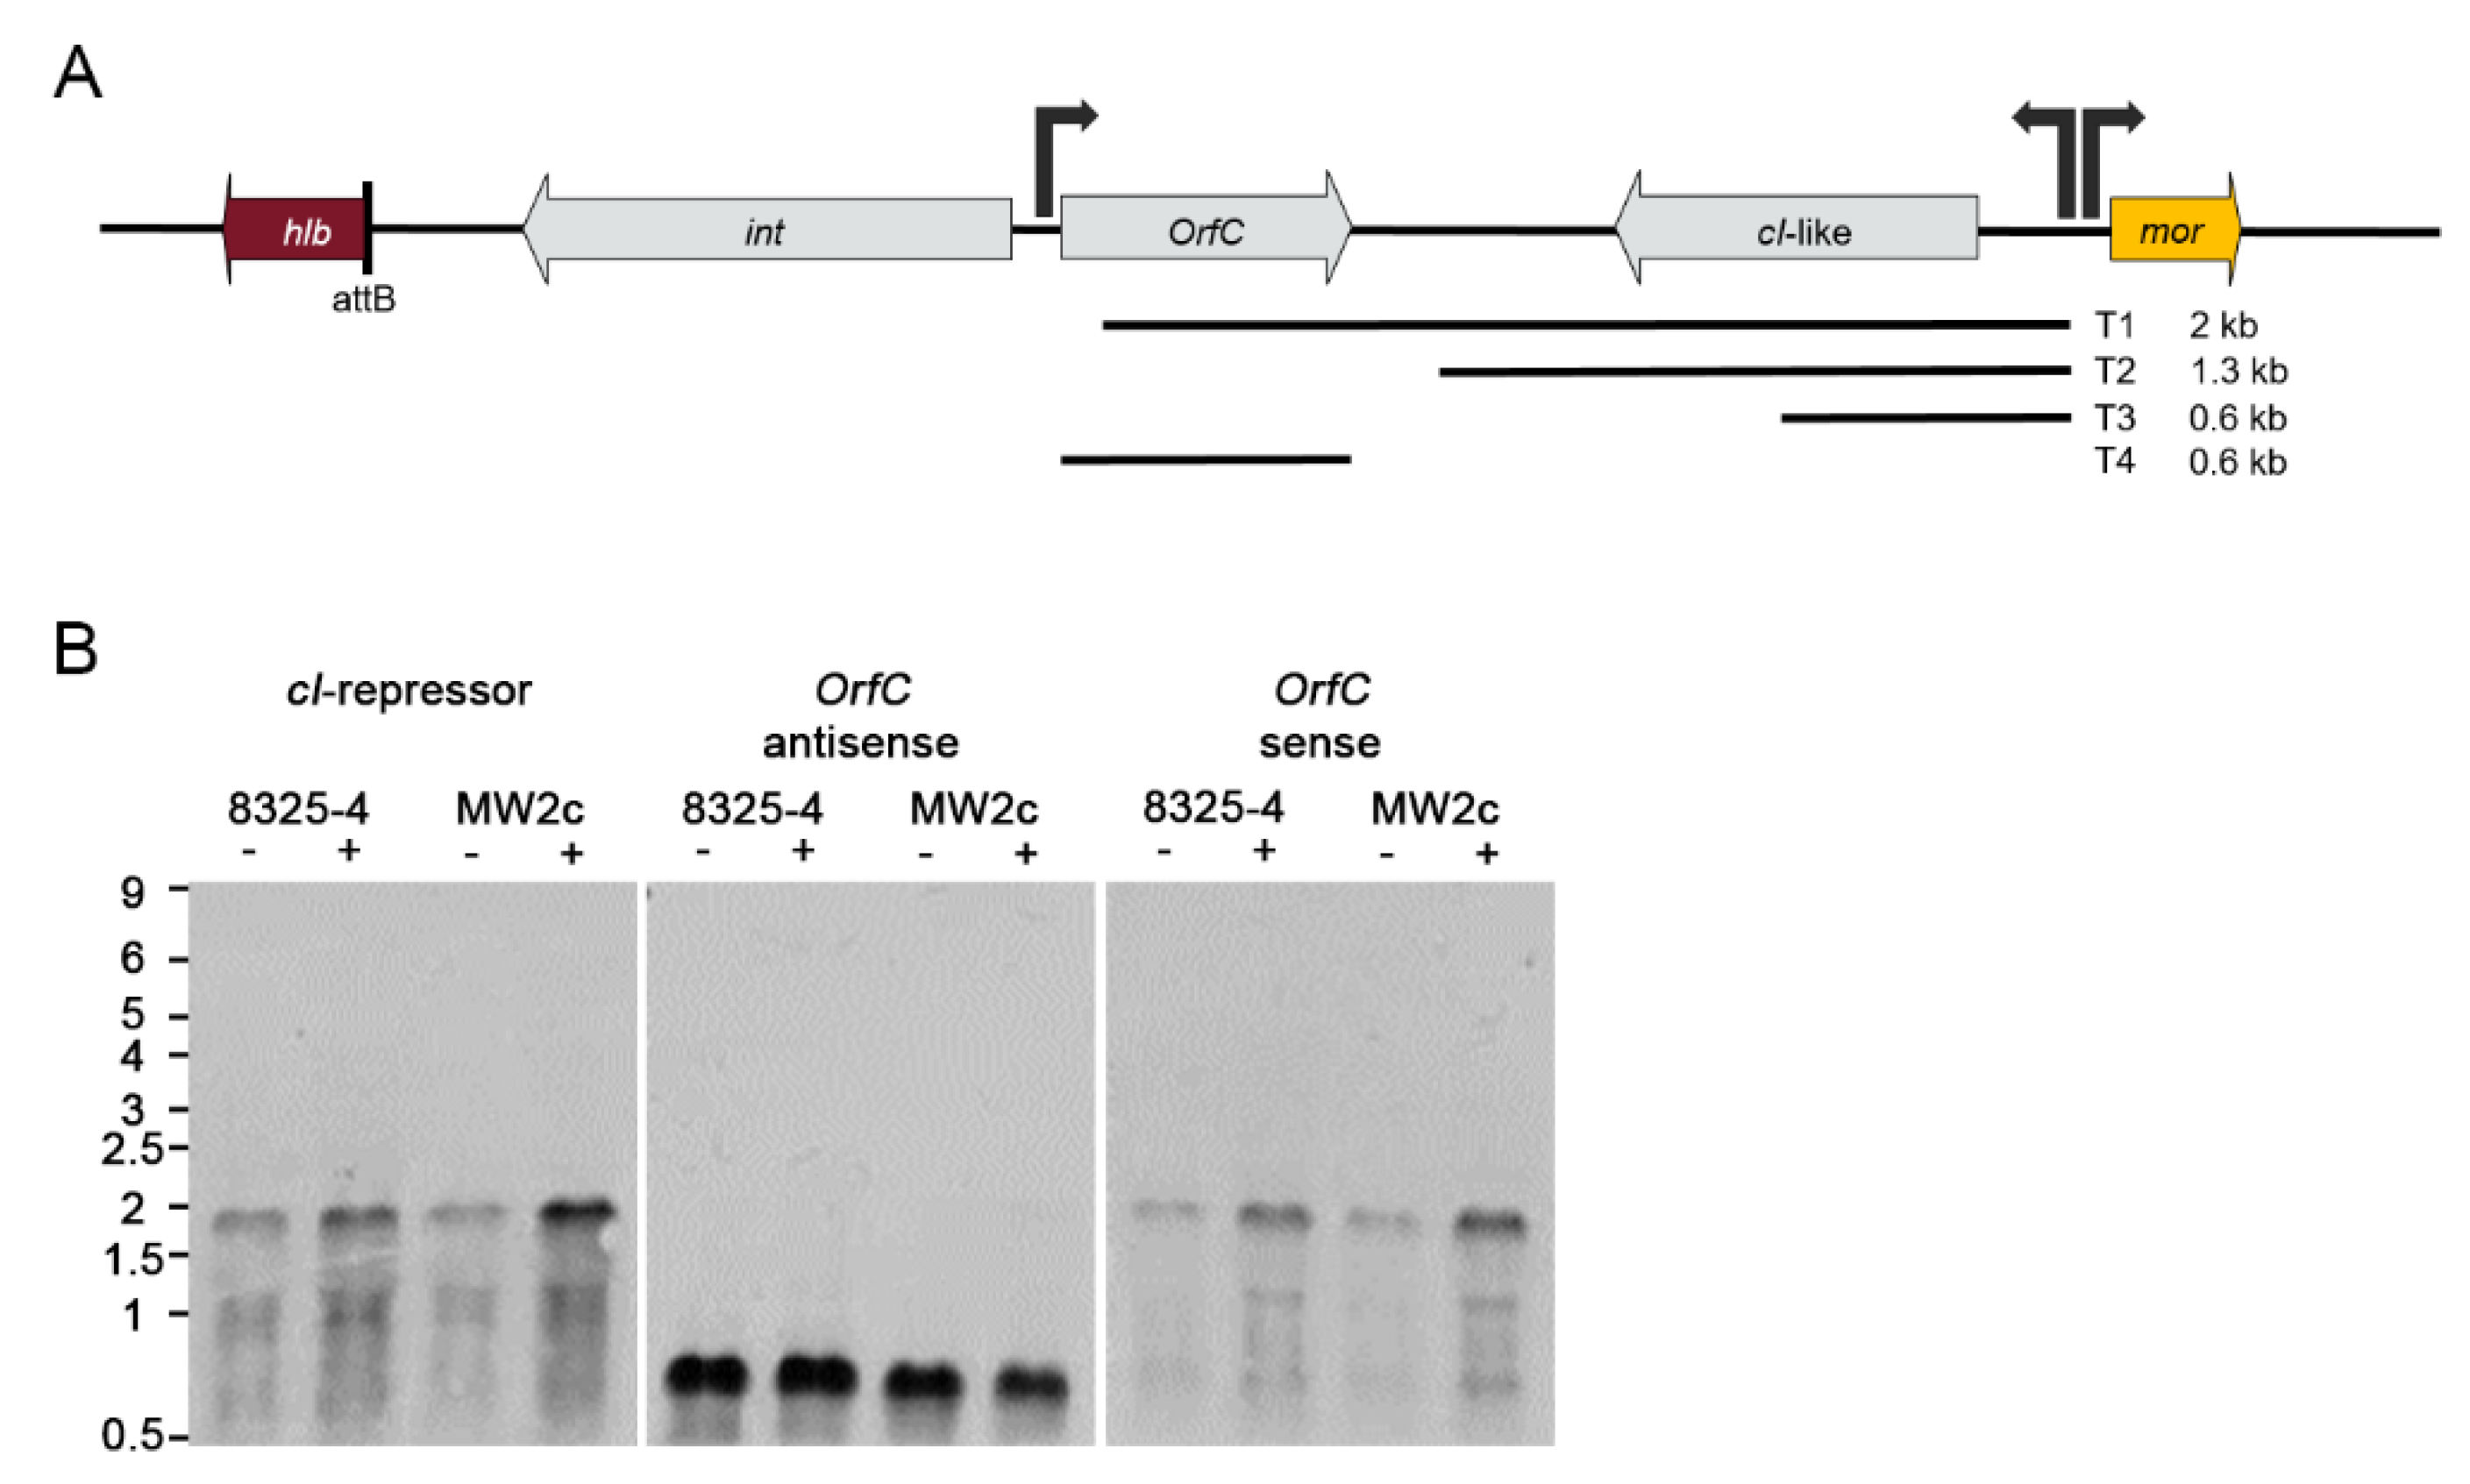
3.5. Phage Gene Expression Is Dependent on the Host Strain Background
3.6. Induction of Φ13kan-Δrep Is Not Strain Dependent
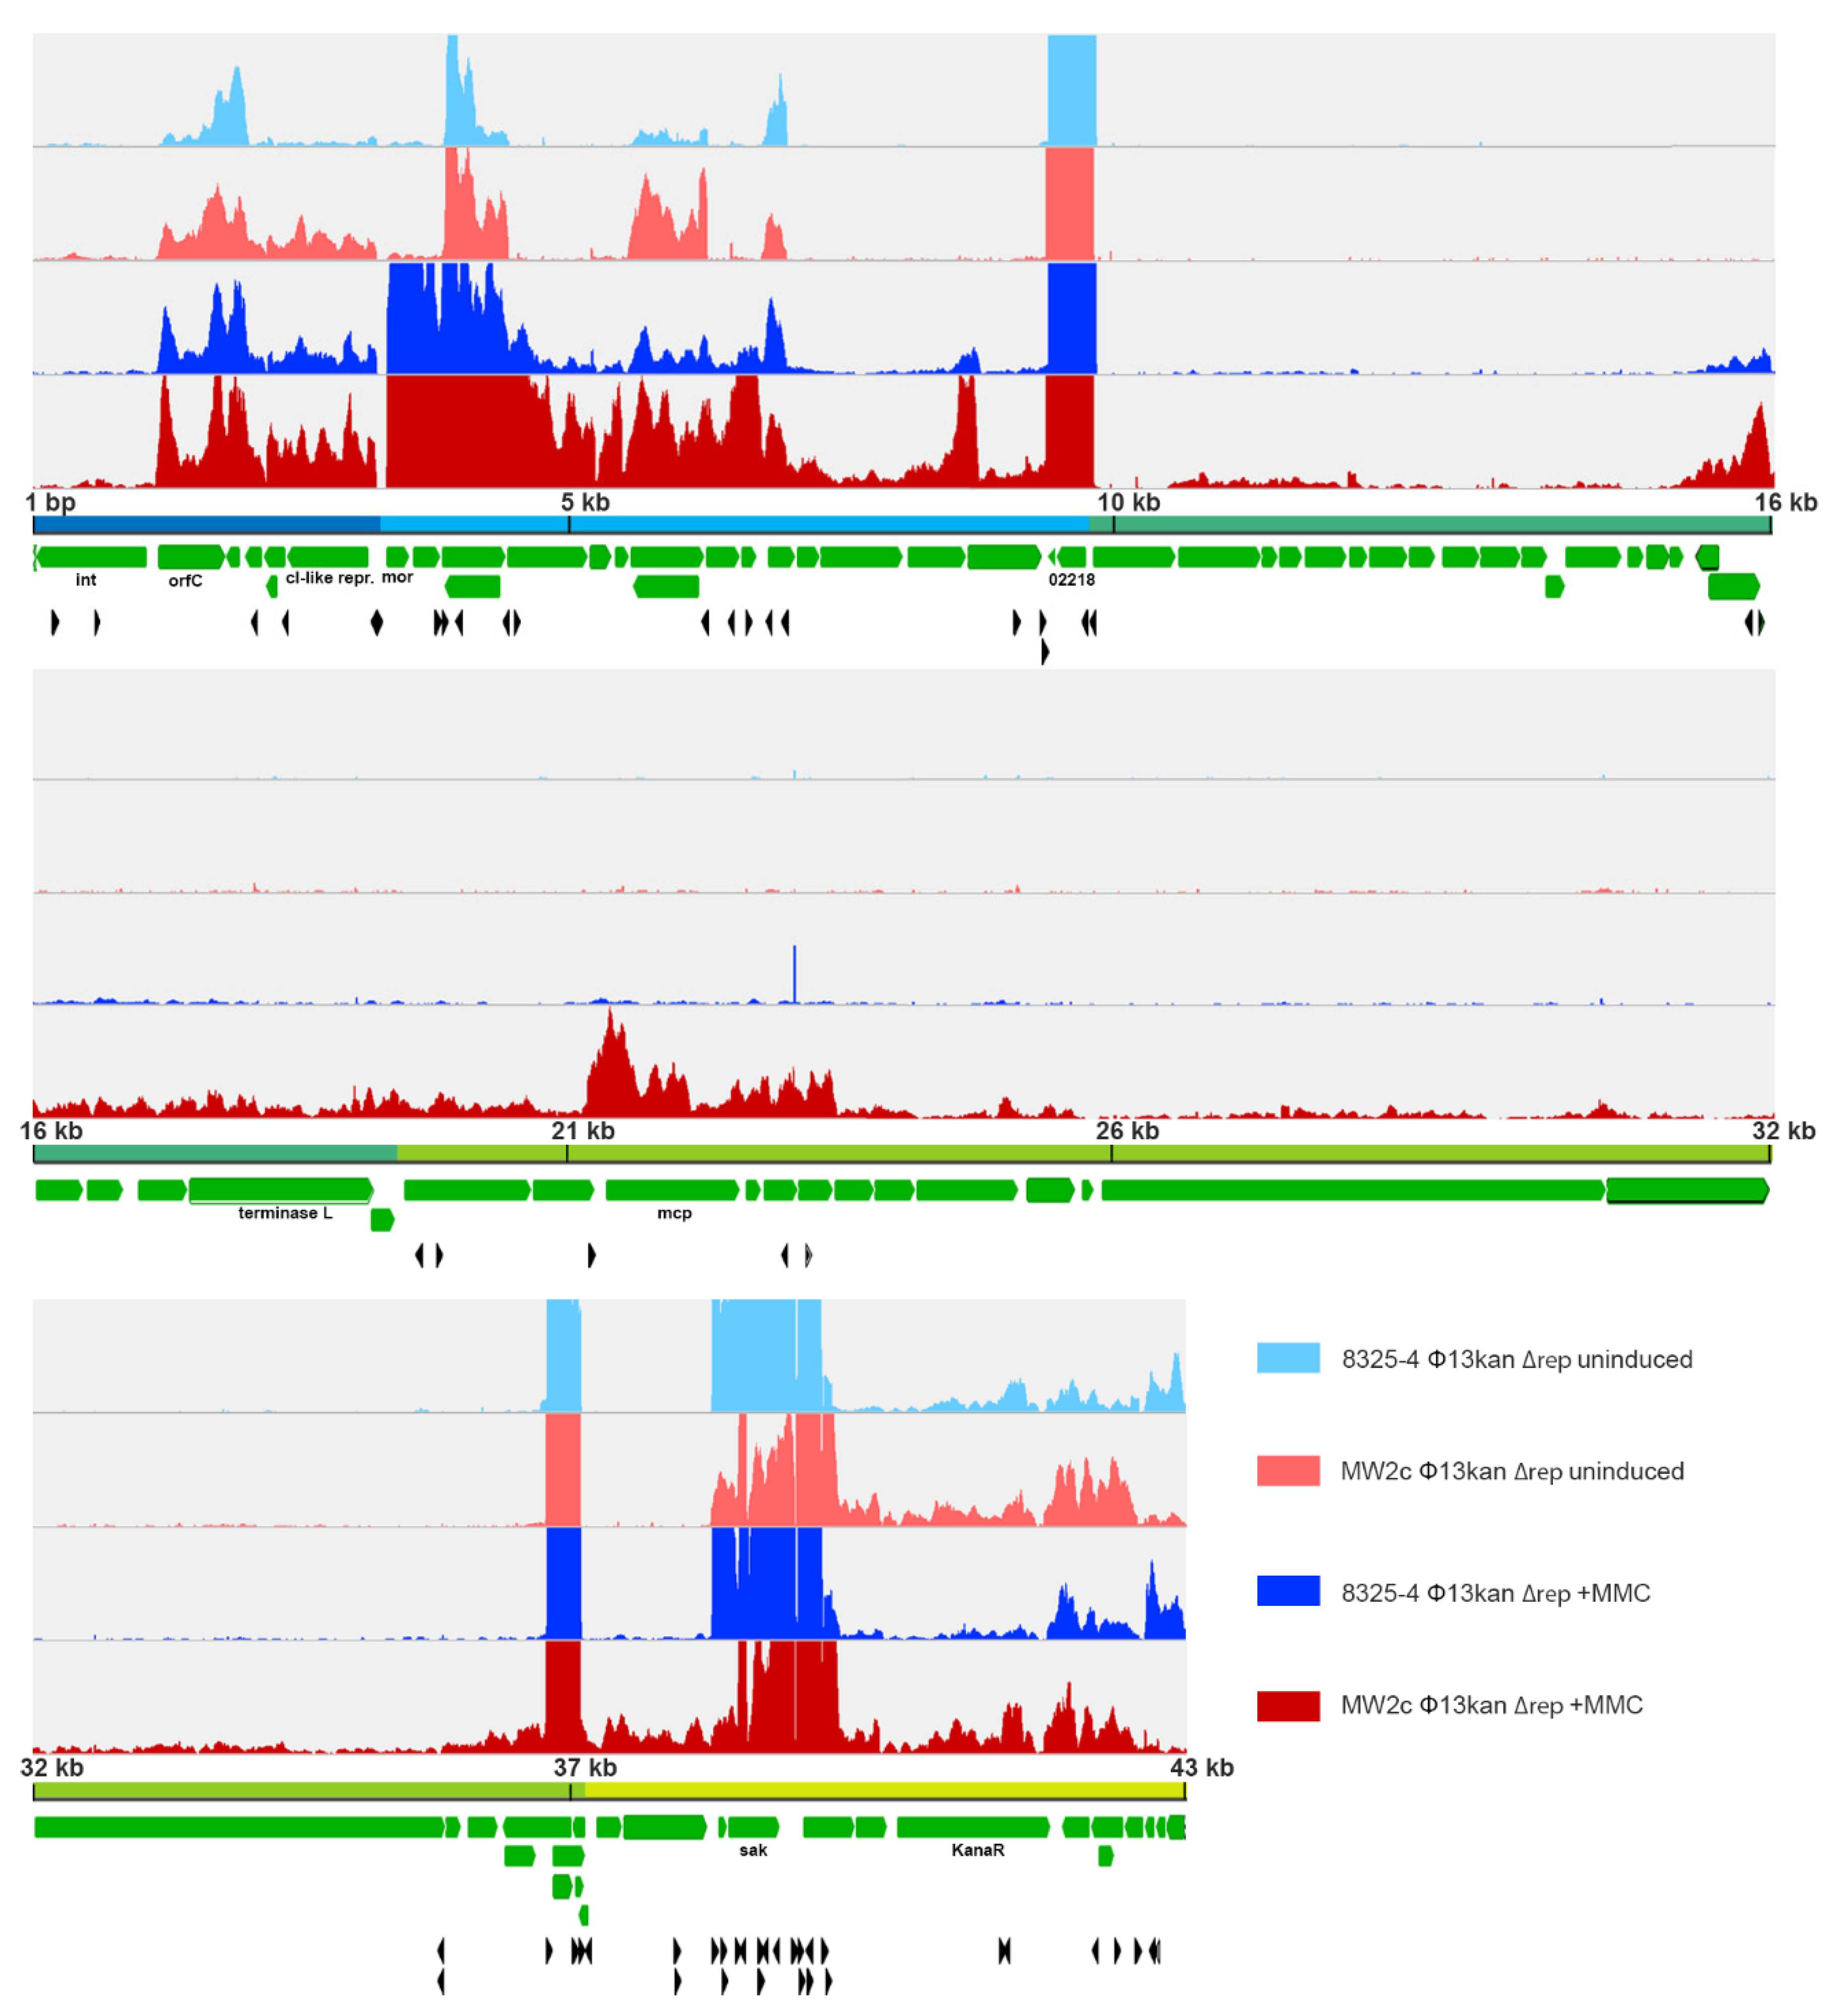
3.7. Transcriptional Start Site Prediction of Φ13kan-Δrep
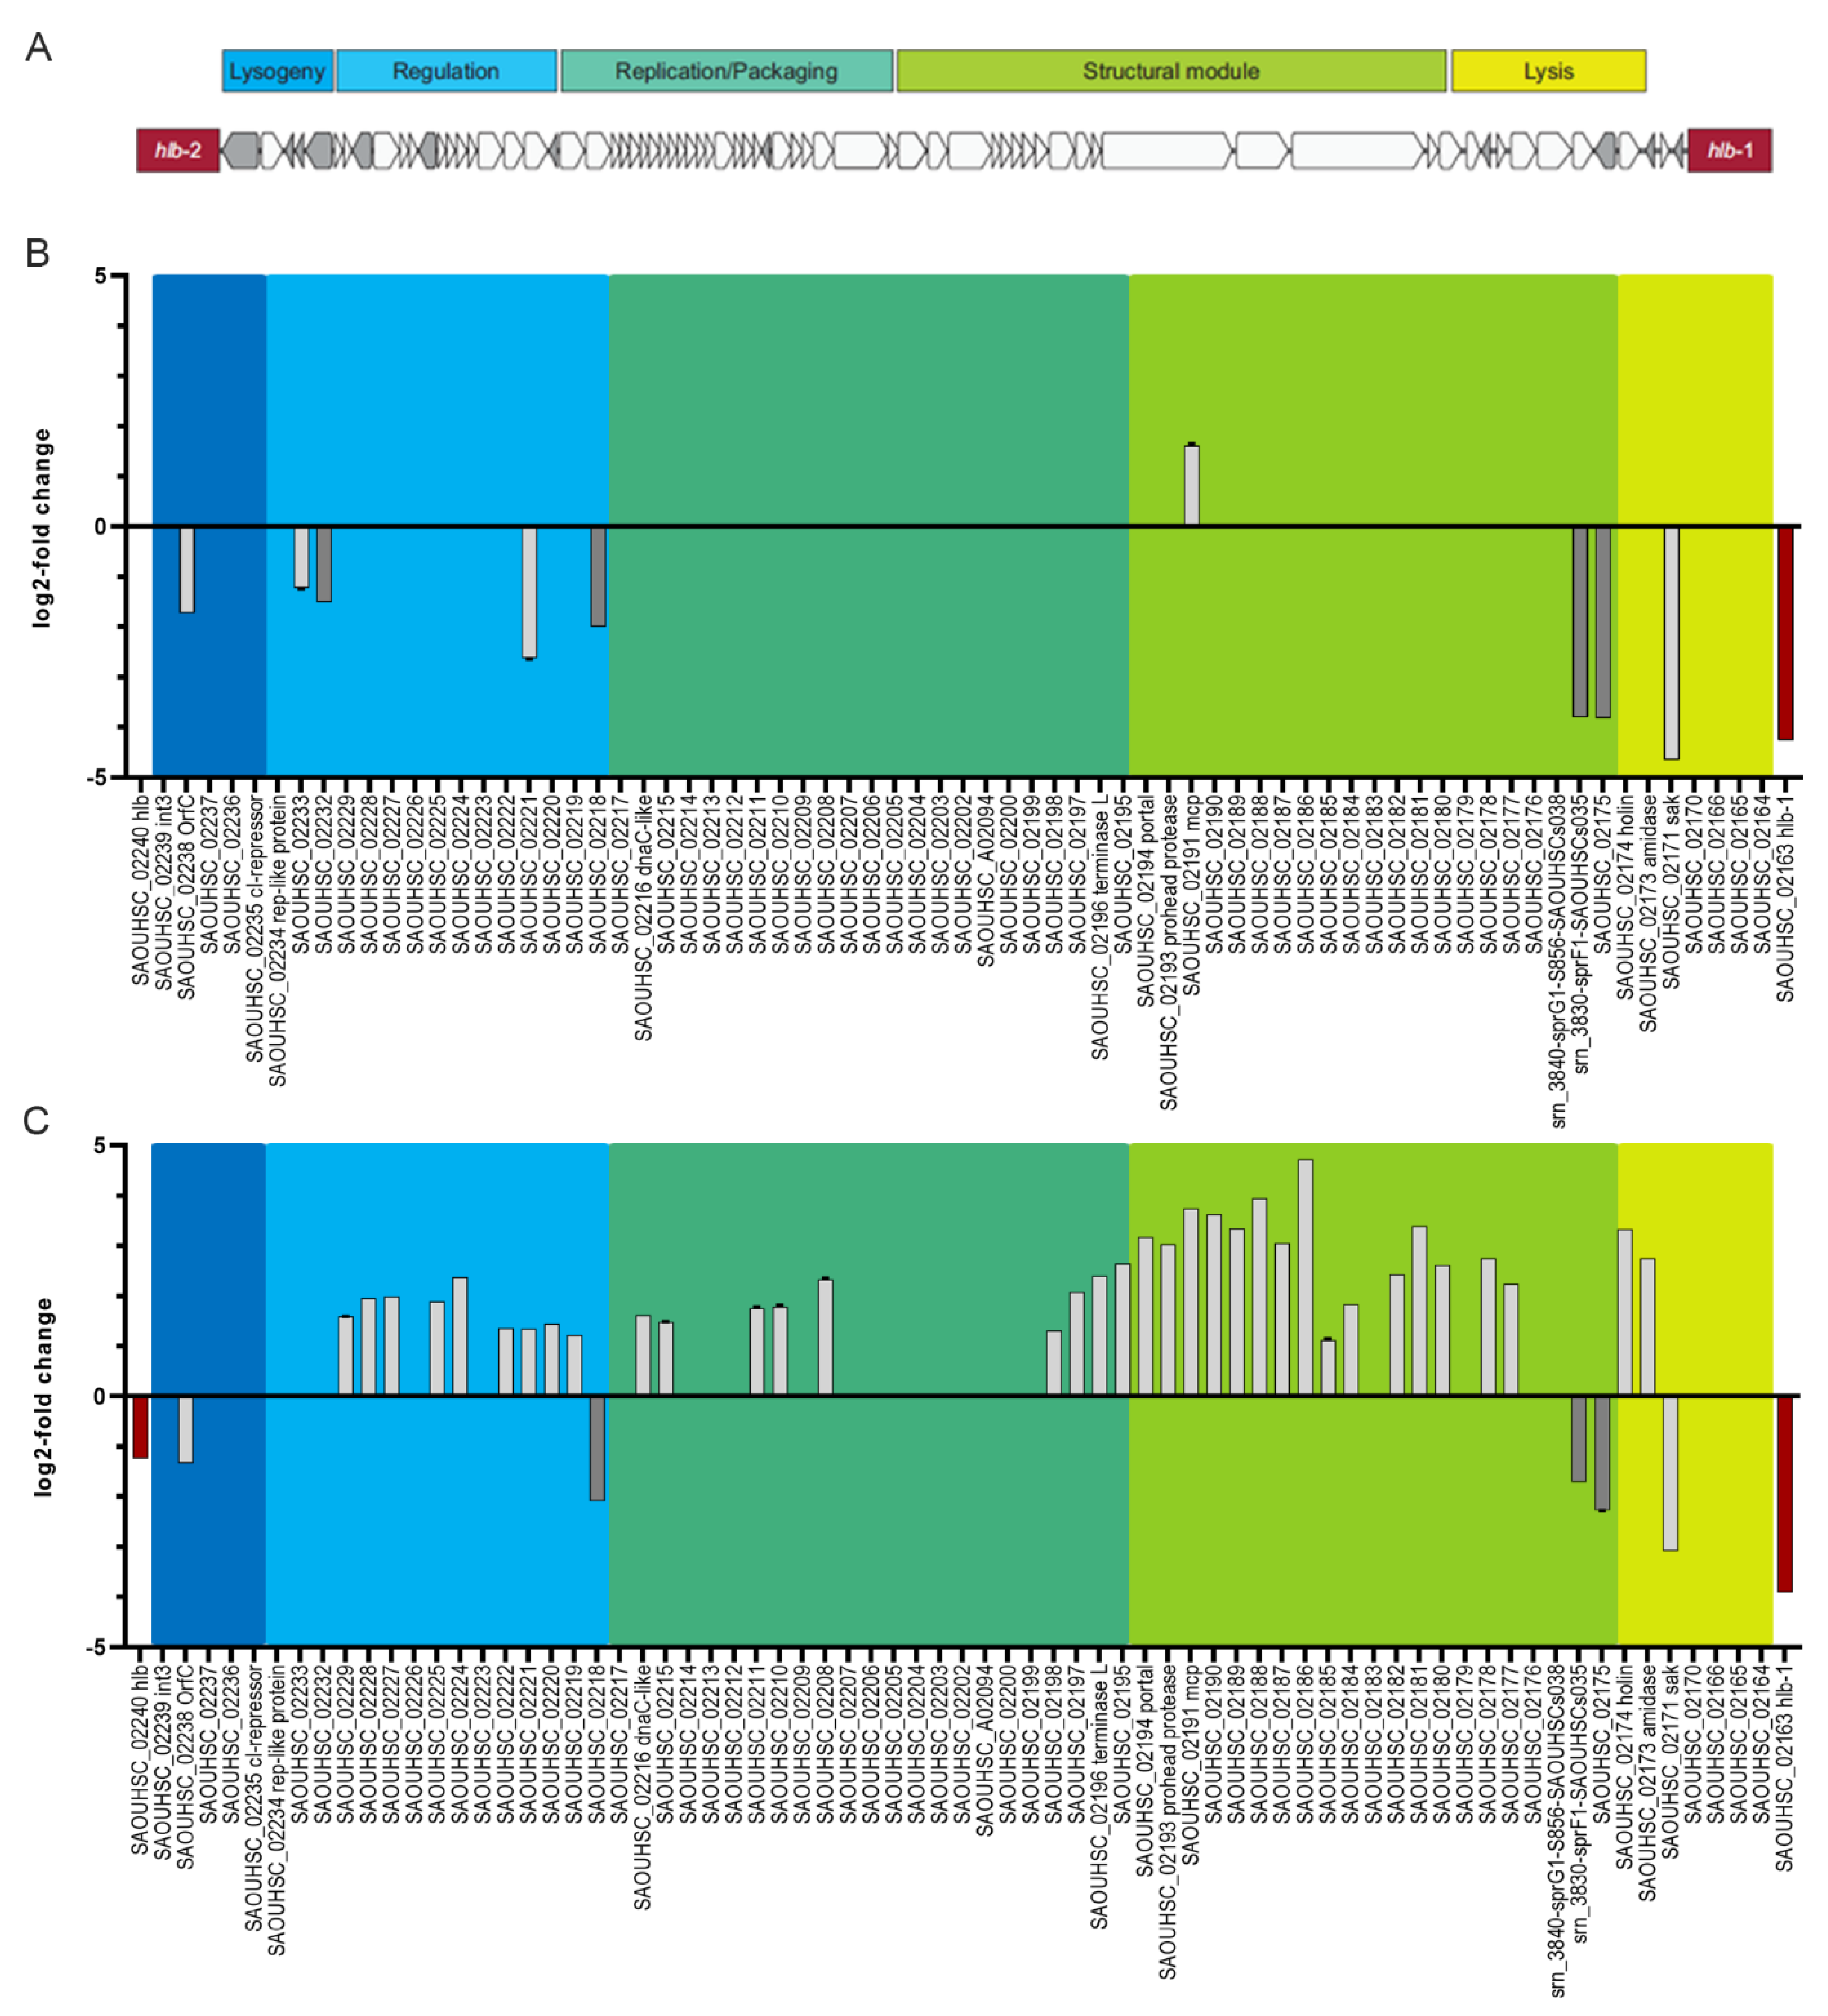
3.8. Strain-Dependent Gene Expression of Φ13kan-Δrep
4. Discussion
Supplementary Materials
Author Contributions
Funding
Institutional Review Board Statement
Informed Consent Statement
Data Availability Statement
Acknowledgments
Conflicts of Interest
References
- Matuszewska, M.; Murray, G.G.R.; Harrison, E.M.; Holmes, M.A.; Weinert, L.A. The Evolutionary Genomics of Host Specificity in Staphylococcus aureus. Trends Microbiol. 2020, 28, 465–477. [Google Scholar] [CrossRef]
- Balasubramanian, D.; Harper, L.; Shopsin, B.; Torres, V.J. Staphylococcus aureus pathogenesis in diverse host environments. Pathog. Dis. 2017, 75, ftx005. [Google Scholar] [CrossRef]
- Turner, N.A.; Sharma-Kuinkel, B.K.; Maskarinec, S.A.; Eichenberger, E.M.; Shah, P.P.; Carugati, M.; Holland, T.L.; Fowler, V.G., Jr. Methicillin-resistant Staphylococcus aureus: An overview of basic and clinical research. Nat. Rev. Microbiol. 2019, 17, 203–218. [Google Scholar] [CrossRef]
- Sakr, A.; Bregeon, F.; Mege, J.L.; Rolain, J.M.; Blin, O. Staphylococcus aureus Nasal Colonization: An Update on Mechanisms, Epidemiology, Risk Factors, and Subsequent Infections. Front. Microbiol. 2018, 9, 2419. [Google Scholar] [CrossRef]
- Haag, A.F.; Fitzgerald, J.R.; Penades, J.R. Staphylococcus aureus in Animals. Microbiol. Spectr. 2019, 7. [Google Scholar] [CrossRef]
- Richardson, E.J.; Bacigalupe, R.; Harrison, E.M.; Weinert, L.A.; Lycett, S.; Vrieling, M.; Robb, K.; Hoskisson, P.A.; Holden, M.T.G.; Feil, E.J.; et al. Gene exchange drives the ecological success of a multi-host bacterial pathogen. Nat. Ecol. Evol. 2018, 2, 1468–1478. [Google Scholar] [CrossRef]
- McCarthy, A.J.; Witney, A.A.; Lindsay, J.A. Staphylococcus aureus temperate bacteriophage: Carriage and horizontal gene transfer is lineage associated. Front. Cell. Infect. Microbiol. 2012, 2, 6. [Google Scholar] [CrossRef] [PubMed]
- Ingmer, H.; Gerlach, D.; Wolz, C. Temperate Phages of Staphylococcus aureus. Microbiol. Spectr. 2019, 7. [Google Scholar] [CrossRef] [PubMed]
- Chaguza, C.; Smith, J.T.; Bruce, S.A.; Gibson, R.; Martin, I.W.; Andam, C.P. Prophage-encoded immune evasion factors are critical for Staphylococcus aureus host infection, switching, and adaptation. Cell Genom. 2022. [Google Scholar] [CrossRef]
- Rohmer, C.; Wolz, C. The Role of hlb-Converting Bacteriophages in Staphylococcus aureus Host Adaption. Microb. Physiol. 2021, 31, 109–122. [Google Scholar] [CrossRef] [PubMed]
- Bouiller, K.; Bertrand, X.; Hocquet, D.; Chirouze, C. Human Infection of Methicillin-Susceptible Staphylococcus aureus CC398: A Review. Microorganisms 2020, 8, 1737. [Google Scholar] [CrossRef] [PubMed]
- Sung, J.M.; Lloyd, D.H.; Lindsay, J.A. Staphylococcus aureus host specificity: Comparative genomics of human versus animal isolates by multi-strain microarray. Microbiol. Read. 2008, 154, 1949–1959. [Google Scholar] [CrossRef]
- Goerke, C.; Pantucek, R.; Holtfreter, S.; Schulte, B.; Zink, M.; Grumann, D.; Broker, B.M.; Doskar, J.; Wolz, C. Diversity of prophages in dominant Staphylococcus aureus clonal lineages. J. Bacteriol. 2009, 191, 3462–3468. [Google Scholar] [CrossRef] [PubMed]
- van Wamel, W.J.; Rooijakkers, S.H.; Ruyken, M.; van Kessel, K.P.; van Strijp, J.A. The innate immune modulators staphylococcal complement inhibitor and chemotaxis inhibitory protein of Staphylococcus aureus are located on beta-hemolysin-converting bacteriophages. J. Bacteriol. 2006, 188, 1310–1315. [Google Scholar] [CrossRef]
- Goerke, C.; Wirtz, C.; Fluckiger, U.; Wolz, C. Extensive phage dynamics in Staphylococcus aureus contributes to adaptation to the human host during infection. Mol. Microbiol. 2006, 61, 1673–1685. [Google Scholar] [CrossRef]
- Deghorain, M.; Van Melderen, L. The Staphylococci phages family: An overview. Viruses 2012, 4, 3316–3335. [Google Scholar] [CrossRef]
- Kahankova, J.; Pantucek, R.; Goerke, C.; Ruzickova, V.; Holochova, P.; Doskar, J. Multilocus PCR typing strategy for differentiation of Staphylococcus aureus siphoviruses reflecting their modular genome structure. Environ. Microbiol. 2010, 12, 2527–2538. [Google Scholar] [CrossRef]
- Oliveira, H.; Sampaio, M.; Melo, L.D.R.; Dias, O.; Pope, W.H.; Hatfull, G.F.; Azeredo, J. Staphylococci phages display vast genomic diversity and evolutionary relationships. BMC Genom. 2019, 20, 357. [Google Scholar] [CrossRef]
- Zhou, W.; Wen, H.; Li, Y.; Gao, Y.; Zheng, X.; Yuan, L.; Zhu, G.; Yang, Z. Whole-Genome Analysis Reveals That Bacteriophages Promote Environmental Adaptation of Staphylococcus aureus via Gene Exchange, Acquisition, and Loss. Viruses 2022, 14, 1199. [Google Scholar] [CrossRef]
- Wirtz, C.; Witte, W.; Wolz, C.; Goerke, C. Transcription of the phage-encoded Panton-Valentine leukocidin of Staphylococcus aureus is dependent on the phage life-cycle and on the host background. Microbiol. Read. 2009, 155, 3491–3499. [Google Scholar] [CrossRef]
- Gerlach, D.; Guo, Y.; De Castro, C.; Kim, S.H.; Schlatterer, K.; Xu, F.F.; Pereira, C.; Seeberger, P.H.; Ali, S.; Codee, J.; et al. Methicillin-resistant Staphylococcus aureus alters cell wall glycosylation to evade immunity. Nature 2018, 563, 705–709. [Google Scholar] [CrossRef] [PubMed]
- Bae, T.; Baba, T.; Hiramatsu, K.; Schneewind, O. Prophages of Staphylococcus aureus Newman and their contribution to virulence. Mol. Microbiol. 2006, 62, 1035–1047. [Google Scholar] [CrossRef] [PubMed]
- Geiger, T.; Francois, P.; Liebeke, M.; Fraunholz, M.; Goerke, C.; Krismer, B.; Schrenzel, J.; Lalk, M.; Wolz, C. The stringent response of Staphylococcus aureus and its impact on survival after phagocytosis through the induction of intracellular PSMs expression. PLoS Pathog. 2012, 8, e1003016. [Google Scholar] [CrossRef]
- Monk, I.R.; Shah, I.M.; Xu, M.; Tan, M.W.; Foster, T.J. Transforming the untransformable: Application of direct transformation to manipulate genetically Staphylococcus aureus and Staphylococcus epidermidis. mBio 2012, 3, e00277-11. [Google Scholar] [CrossRef]
- Xia, G.; Corrigan, R.M.; Winstel, V.; Goerke, C.; Grundling, A.; Peschel, A. Wall teichoic Acid-dependent adsorption of staphylococcal siphovirus and myovirus. J. Bacteriol. 2011, 193, 4006–4009. [Google Scholar] [CrossRef] [PubMed]
- Innocenti, N.; Golumbeanu, M.; Fouquier d‘Herouel, A.; Lacoux, C.; Bonnin, R.A.; Kennedy, S.P.; Wessner, F.; Serror, P.; Bouloc, P.; Repoila, F.; et al. Whole-genome mapping of 5‘ RNA ends in bacteria by tagged sequencing: A comprehensive view in Enterococcus faecalis. RNA 2015, 21, 1018–1030. [Google Scholar] [CrossRef]
- Berscheid, A.; Sass, P.; Weber-Lassalle, K.; Cheung, A.L.; Bierbaum, G. Revisiting the genomes of the Staphylococcus aureus strains NCTC 8325 and RN4220. Int. J. Med. Microbiol. 2012, 302, 84–87. [Google Scholar] [CrossRef]
- Forstner, K.U.; Vogel, J.; Sharma, C.M. READemption-a tool for the computational analysis of deep-sequencing-based transcriptome data. Bioinformatics 2014, 30, 3421–3423. [Google Scholar] [CrossRef]
- Hoffmann, S.; Otto, C.; Kurtz, S.; Sharma, C.M.; Khaitovich, P.; Vogel, J.; Stadler, P.F.; Hackermüller, J. Fast mapping of short sequences with mismatches, insertions and deletions using index structures. PLoS Comput. Biol. 2009, 5, e1000502. [Google Scholar] [CrossRef]
- Bischler, T.; Tan, H.S.; Nieselt, K.; Sharma, C.M. Differential RNA-seq (dRNA-seq) for annotation of transcriptional start sites and small RNAs in Helicobacter pylori. Methods 2015, 86, 89–101. [Google Scholar] [CrossRef]
- Dugar, G.; Herbig, A.; Forstner, K.U.; Heidrich, N.; Reinhardt, R.; Nieselt, K.; Sharma, C.M. High-resolution transcriptome maps reveal strain-specific regulatory features of multiple Campylobacter jejuni isolates. PLoS Genet. 2013, 9, e1003495. [Google Scholar] [CrossRef] [PubMed]
- Tang, Y.; Nielsen, L.N.; Hvitved, A.; Haaber, J.K.; Wirtz, C.; Andersen, P.S.; Larsen, J.; Wolz, C.; Ingmer, H. Commercial Biocides Induce Transfer of Prophage Phi13 from Human Strains of Staphylococcus aureus to Livestock CC398. Front. Microbiol. 2017, 8, 2418. [Google Scholar] [CrossRef] [PubMed]
- Haaber, J.; Leisner, J.J.; Cohn, M.T.; Catalan-Moreno, A.; Nielsen, J.B.; Westh, H.; Penades, J.R.; Ingmer, H. Bacterial viruses enable their host to acquire antibiotic resistance genes from neighbouring cells. Nat. Commun. 2016, 7, 13333. [Google Scholar] [CrossRef]
- Moller, A.G.; Lindsay, J.A.; Read, T.D. Determinants of Phage Host Range in Staphylococcus Species. Appl. Environ. Microbiol. 2019, 85. [Google Scholar] [CrossRef]
- Kristensen, C.S.; Varming, A.K.; Leinweber, H.A.K.; Hammer, K.; Lo Leggio, L.; Ingmer, H.; Kilstrup, M. Characterization of the genetic switch from phage 13 important for Staphylococcus aureus colonization in humans. Microbiol. Open 2021, 10, e1245. [Google Scholar] [CrossRef] [PubMed]
- Saenz-Lahoya, S.; Bitarte, N.; Garcia, B.; Burgui, S.; Vergara-Irigaray, M.; Valle, J.; Solano, C.; Toledo-Arana, A.; Lasa, I. Noncontiguous operon is a genetic organization for coordinating bacterial gene expression. Proc. Natl. Acad. Sci. USA 2019, 116, 1733–1738. [Google Scholar] [CrossRef]
- Pedersen, M.; Neergaard, J.T.; Cassias, J.; Rasmussen, K.K.; Lo Leggio, L.; Sneppen, K.; Hammer, K.; Kilstrup, M. Repression of the lysogenic PR promoter in bacteriophage TP901-1 through binding of a CI-MOR complex to a composite OM-OR operator. Sci. Rep. 2020, 10, 8659. [Google Scholar] [CrossRef] [PubMed]
- Rasmussen, K.K.; Palencia, A.; Varming, A.K.; El-Wali, H.; Boeri Erba, E.; Blackledge, M.; Hammer, K.; Herrmann, T.; Kilstrup, M.; Lo Leggio, L.; et al. Revealing the mechanism of repressor inactivation during switching of a temperate bacteriophage. Proc. Natl. Acad. Sci. USA 2020, 117, 20576–20585. [Google Scholar] [CrossRef]
- Pedersen, M.; Hammer, K. The role of MOR and the CI operator sites on the genetic switch of the temperate bacteriophage TP901-1. J. Mol. Biol. 2008, 384, 577–589. [Google Scholar] [CrossRef]
- Lacoux, C.; Fouquier d‘Herouel, A.; Wessner-Le Bohec, F.; Innocenti, N.; Bohn, C.; Kennedy, S.P.; Rochat, T.; Bonnin, R.A.; Serror, P.; Aurell, E.; et al. Dynamic insights on transcription initiation and RNA processing during bacterial adaptation. RNA 2020, 26, 382–395. [Google Scholar] [CrossRef]
- Marincola, G.; Schafer, T.; Behler, J.; Bernhardt, J.; Ohlsen, K.; Goerke, C.; Wolz, C. RNase Y of Staphylococcus aureus and its role in the activation of virulence genes. Molecular Microbiol. 2012, 85, 817–832. [Google Scholar] [CrossRef] [PubMed]
- Yin, Z.; Kaelber, J.T.; Ebright, R.H. Structural basis of Q-dependent antitermination. Proc. Natl. Acad. Sci. USA 2019, 116, 18384–18390. [Google Scholar] [CrossRef] [PubMed]
- Feiner, R.; Argov, T.; Rabinovich, L.; Sigal, N.; Borovok, I.; Herskovits, A.A. A new perspective on lysogeny: Prophages as active regulatory switches of bacteria. Nat. Rev. Microbiol. 2015, 13, 641–650. [Google Scholar] [CrossRef] [PubMed]
- Pasechnek, A.; Rabinovich, L.; Stadnyuk, O.; Azulay, G.; Mioduser, J.; Argov, T.; Borovok, I.; Sigal, N.; Herskovits, A.A. Active Lysogeny in Listeria monocytogenes is a bacteria-phage adaptive response in the mammalian environment. Cell Rep. 2020, 32, 107956. [Google Scholar] [CrossRef] [PubMed]
- Pfeifer, E.; Hunnefeld, M.; Popa, O.; Frunzke, J. Impact of xenogeneic silencing on phage-host interactions. J. Mol. Biol. 2019, 431, 4670–4683. [Google Scholar] [CrossRef]
- Xia, G.; Wolz, C. Phages of Staphylococcus aureus and their impact on host evolution. Infect. Genet. Evol. J. Mol. Epidemiol. Evol. Genet. Infect. Dis. 2014, 21, 593–601. [Google Scholar] [CrossRef]
- Millman, A.; Melamed, S.; Amitai, G.; Sorek, R. Diversity and classification of cyclic-oligonucleotide-based anti-phage signalling systems. Nat. Microbiol. 2020, 5, 1608–1615. [Google Scholar] [CrossRef]
- Millman, A.; Bernheim, A.; Stokar-Avihail, A.; Fedorenko, T.; Voichek, M.; Leavitt, A.; Oppenheimer-Shaanan, Y.; Sorek, R. Bacterial Retrons Function in Anti-Phage Defense. Cell 2020, 183, 1551–1561.e12. [Google Scholar] [CrossRef]
- Goerke, C.; Matias y Papenberg, S.; Dasbach, S.; Dietz, K.; Ziebach, R.; Kahl, B.C.; Wolz, C. Increased frequency of genomic alterations in Staphylococcus aureus during chronic infection is in part due to phage mobilization. J. Infect. Dis. 2004, 189, 724–734. [Google Scholar] [CrossRef]


Publisher’s Note: MDPI stays neutral with regard to jurisdictional claims in published maps and institutional affiliations. |
© 2022 by the authors. Licensee MDPI, Basel, Switzerland. This article is an open access article distributed under the terms and conditions of the Creative Commons Attribution (CC BY) license (https://creativecommons.org/licenses/by/4.0/).
Share and Cite
Rohmer, C.; Dobritz, R.; Tuncbilek-Dere, D.; Lehmann, E.; Gerlach, D.; George, S.E.; Bae, T.; Nieselt, K.; Wolz, C. Influence of Staphylococcus aureus Strain Background on Sa3int Phage Life Cycle Switches. Viruses 2022, 14, 2471. https://doi.org/10.3390/v14112471
Rohmer C, Dobritz R, Tuncbilek-Dere D, Lehmann E, Gerlach D, George SE, Bae T, Nieselt K, Wolz C. Influence of Staphylococcus aureus Strain Background on Sa3int Phage Life Cycle Switches. Viruses. 2022; 14(11):2471. https://doi.org/10.3390/v14112471
Chicago/Turabian StyleRohmer, Carina, Ronja Dobritz, Dilek Tuncbilek-Dere, Esther Lehmann, David Gerlach, Shilpa Elizabeth George, Taeok Bae, Kay Nieselt, and Christiane Wolz. 2022. "Influence of Staphylococcus aureus Strain Background on Sa3int Phage Life Cycle Switches" Viruses 14, no. 11: 2471. https://doi.org/10.3390/v14112471
APA StyleRohmer, C., Dobritz, R., Tuncbilek-Dere, D., Lehmann, E., Gerlach, D., George, S. E., Bae, T., Nieselt, K., & Wolz, C. (2022). Influence of Staphylococcus aureus Strain Background on Sa3int Phage Life Cycle Switches. Viruses, 14(11), 2471. https://doi.org/10.3390/v14112471