
Personalized Virus Load Curves for Acute Viral Infections


Abstract
:1. Introduction
2. Materials and Methods
2.1. Data Sets
2.2. Data Fitting Procedure
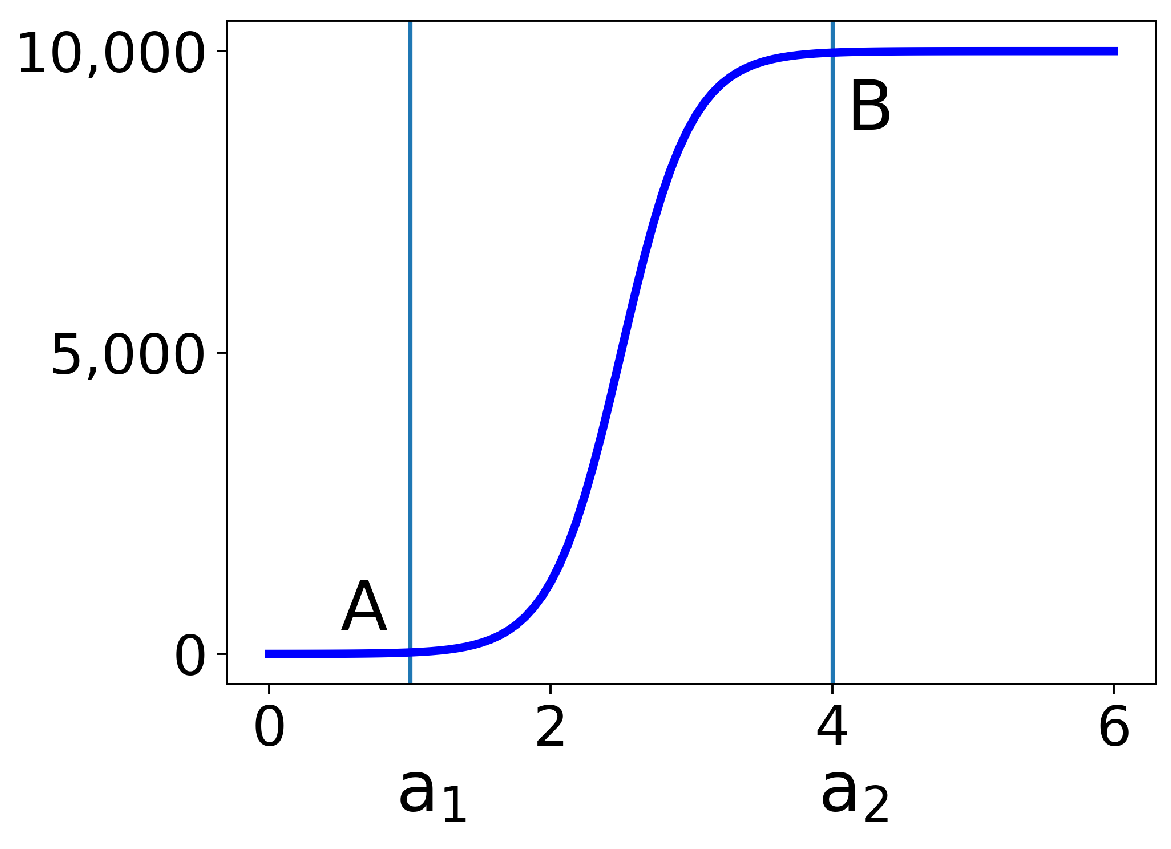
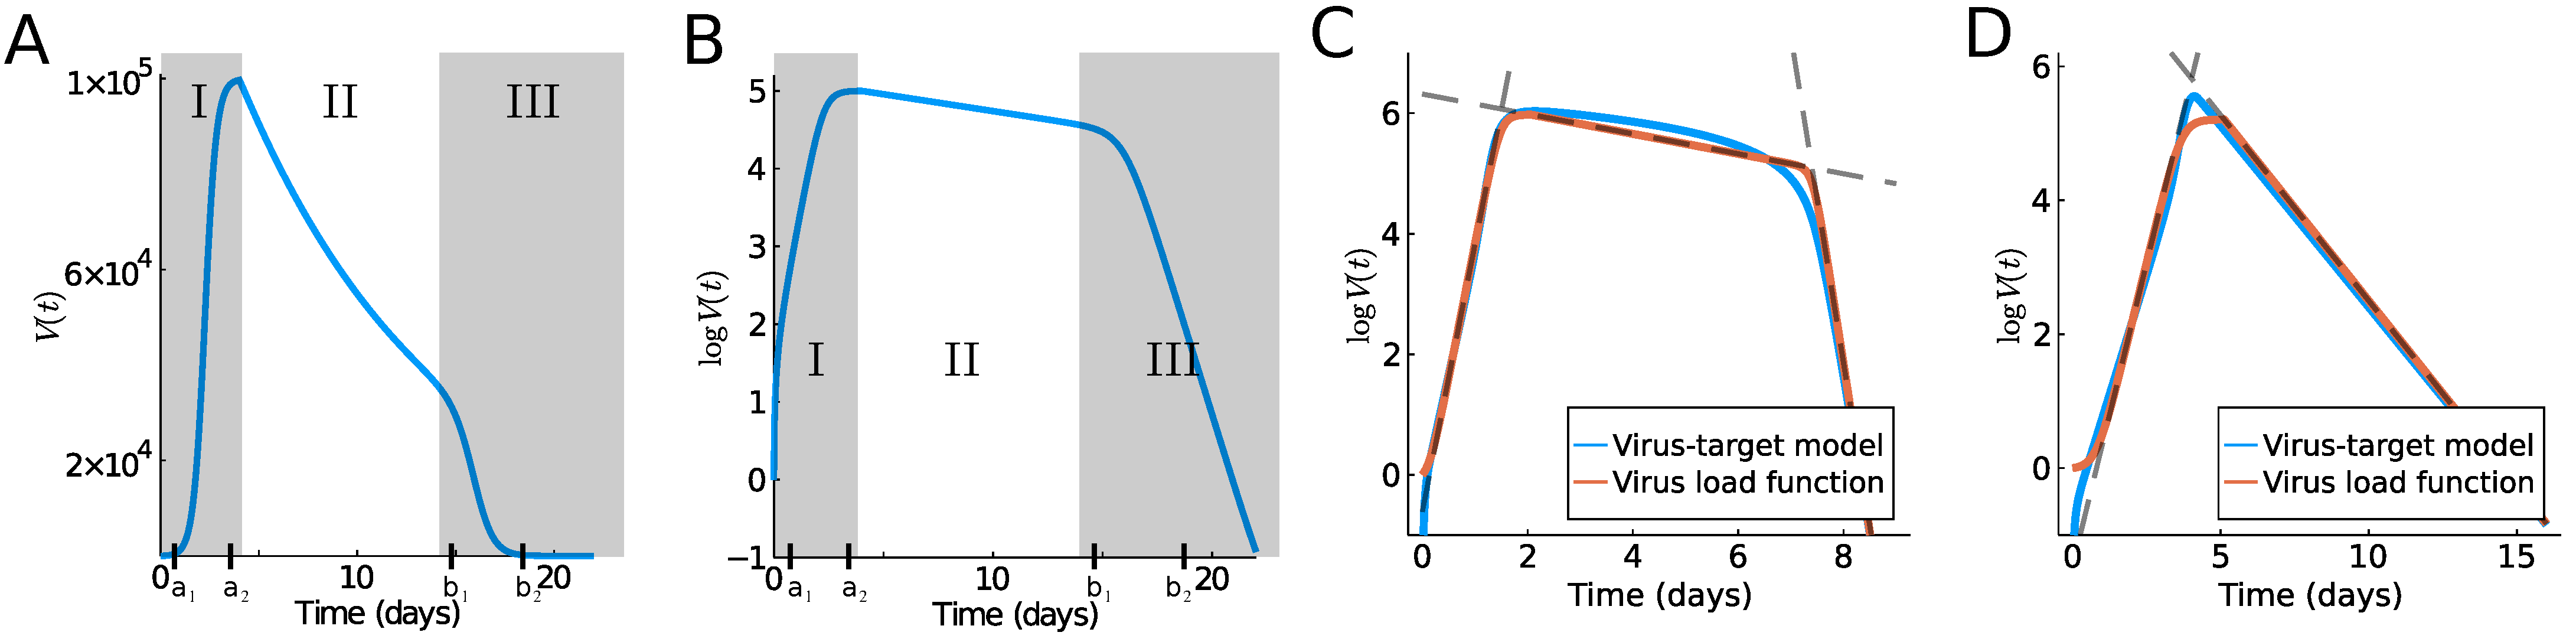
2.3. Hyperbolic Tangent
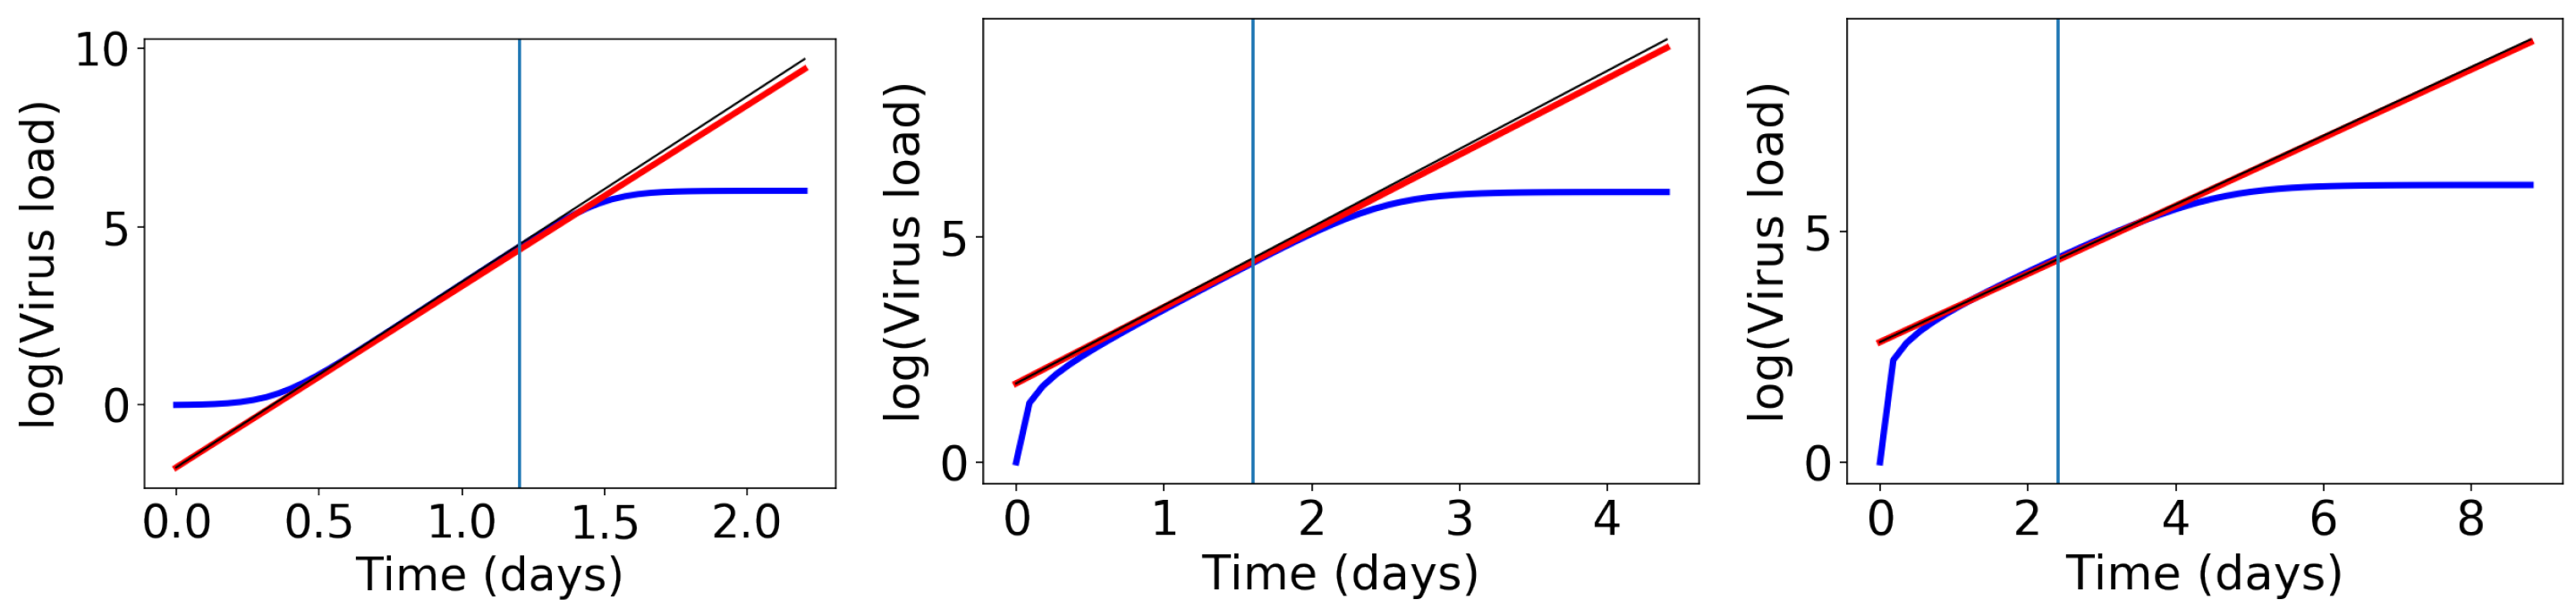
2.4. Computation of Exponential Growth Rates
2.5. Viral Target Model
3. Results
3.1. Mice Influenza A Data
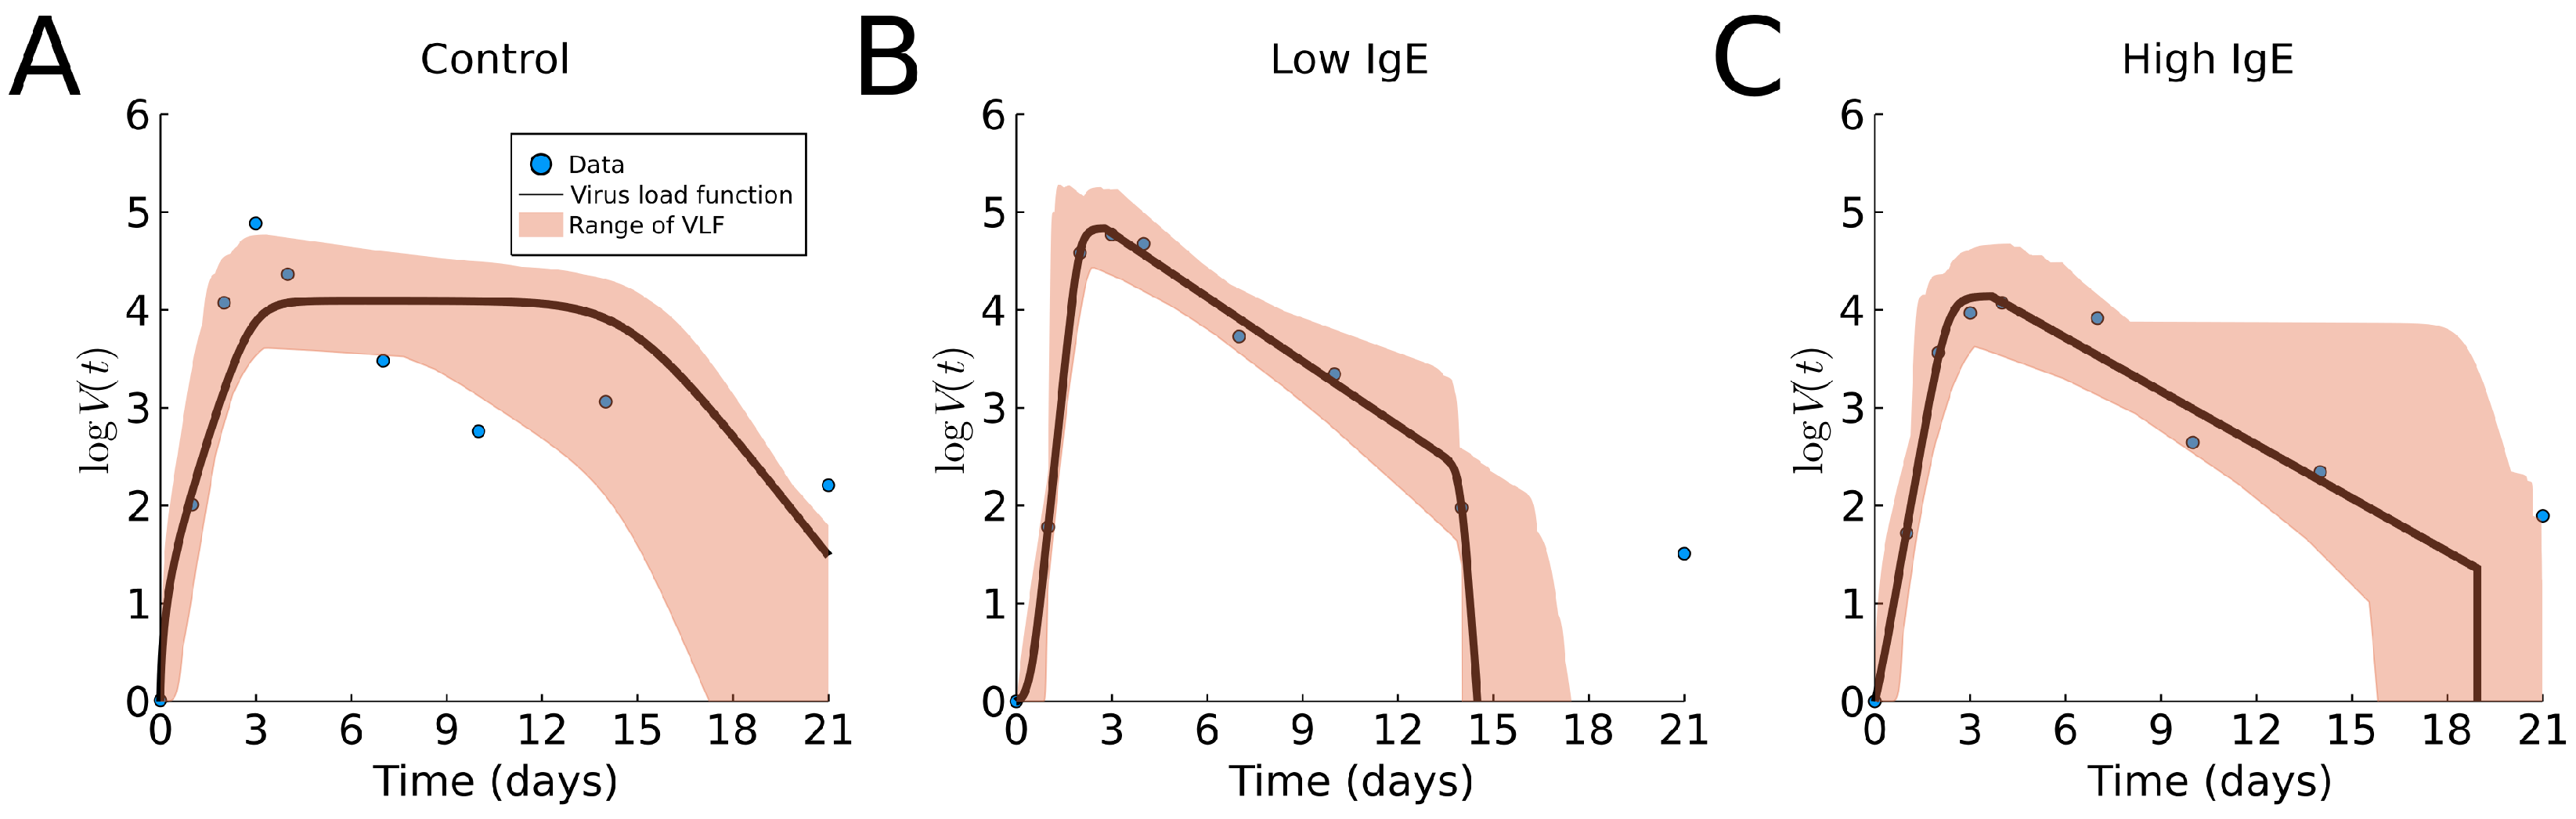
3.2. Human Rhinovirus Data
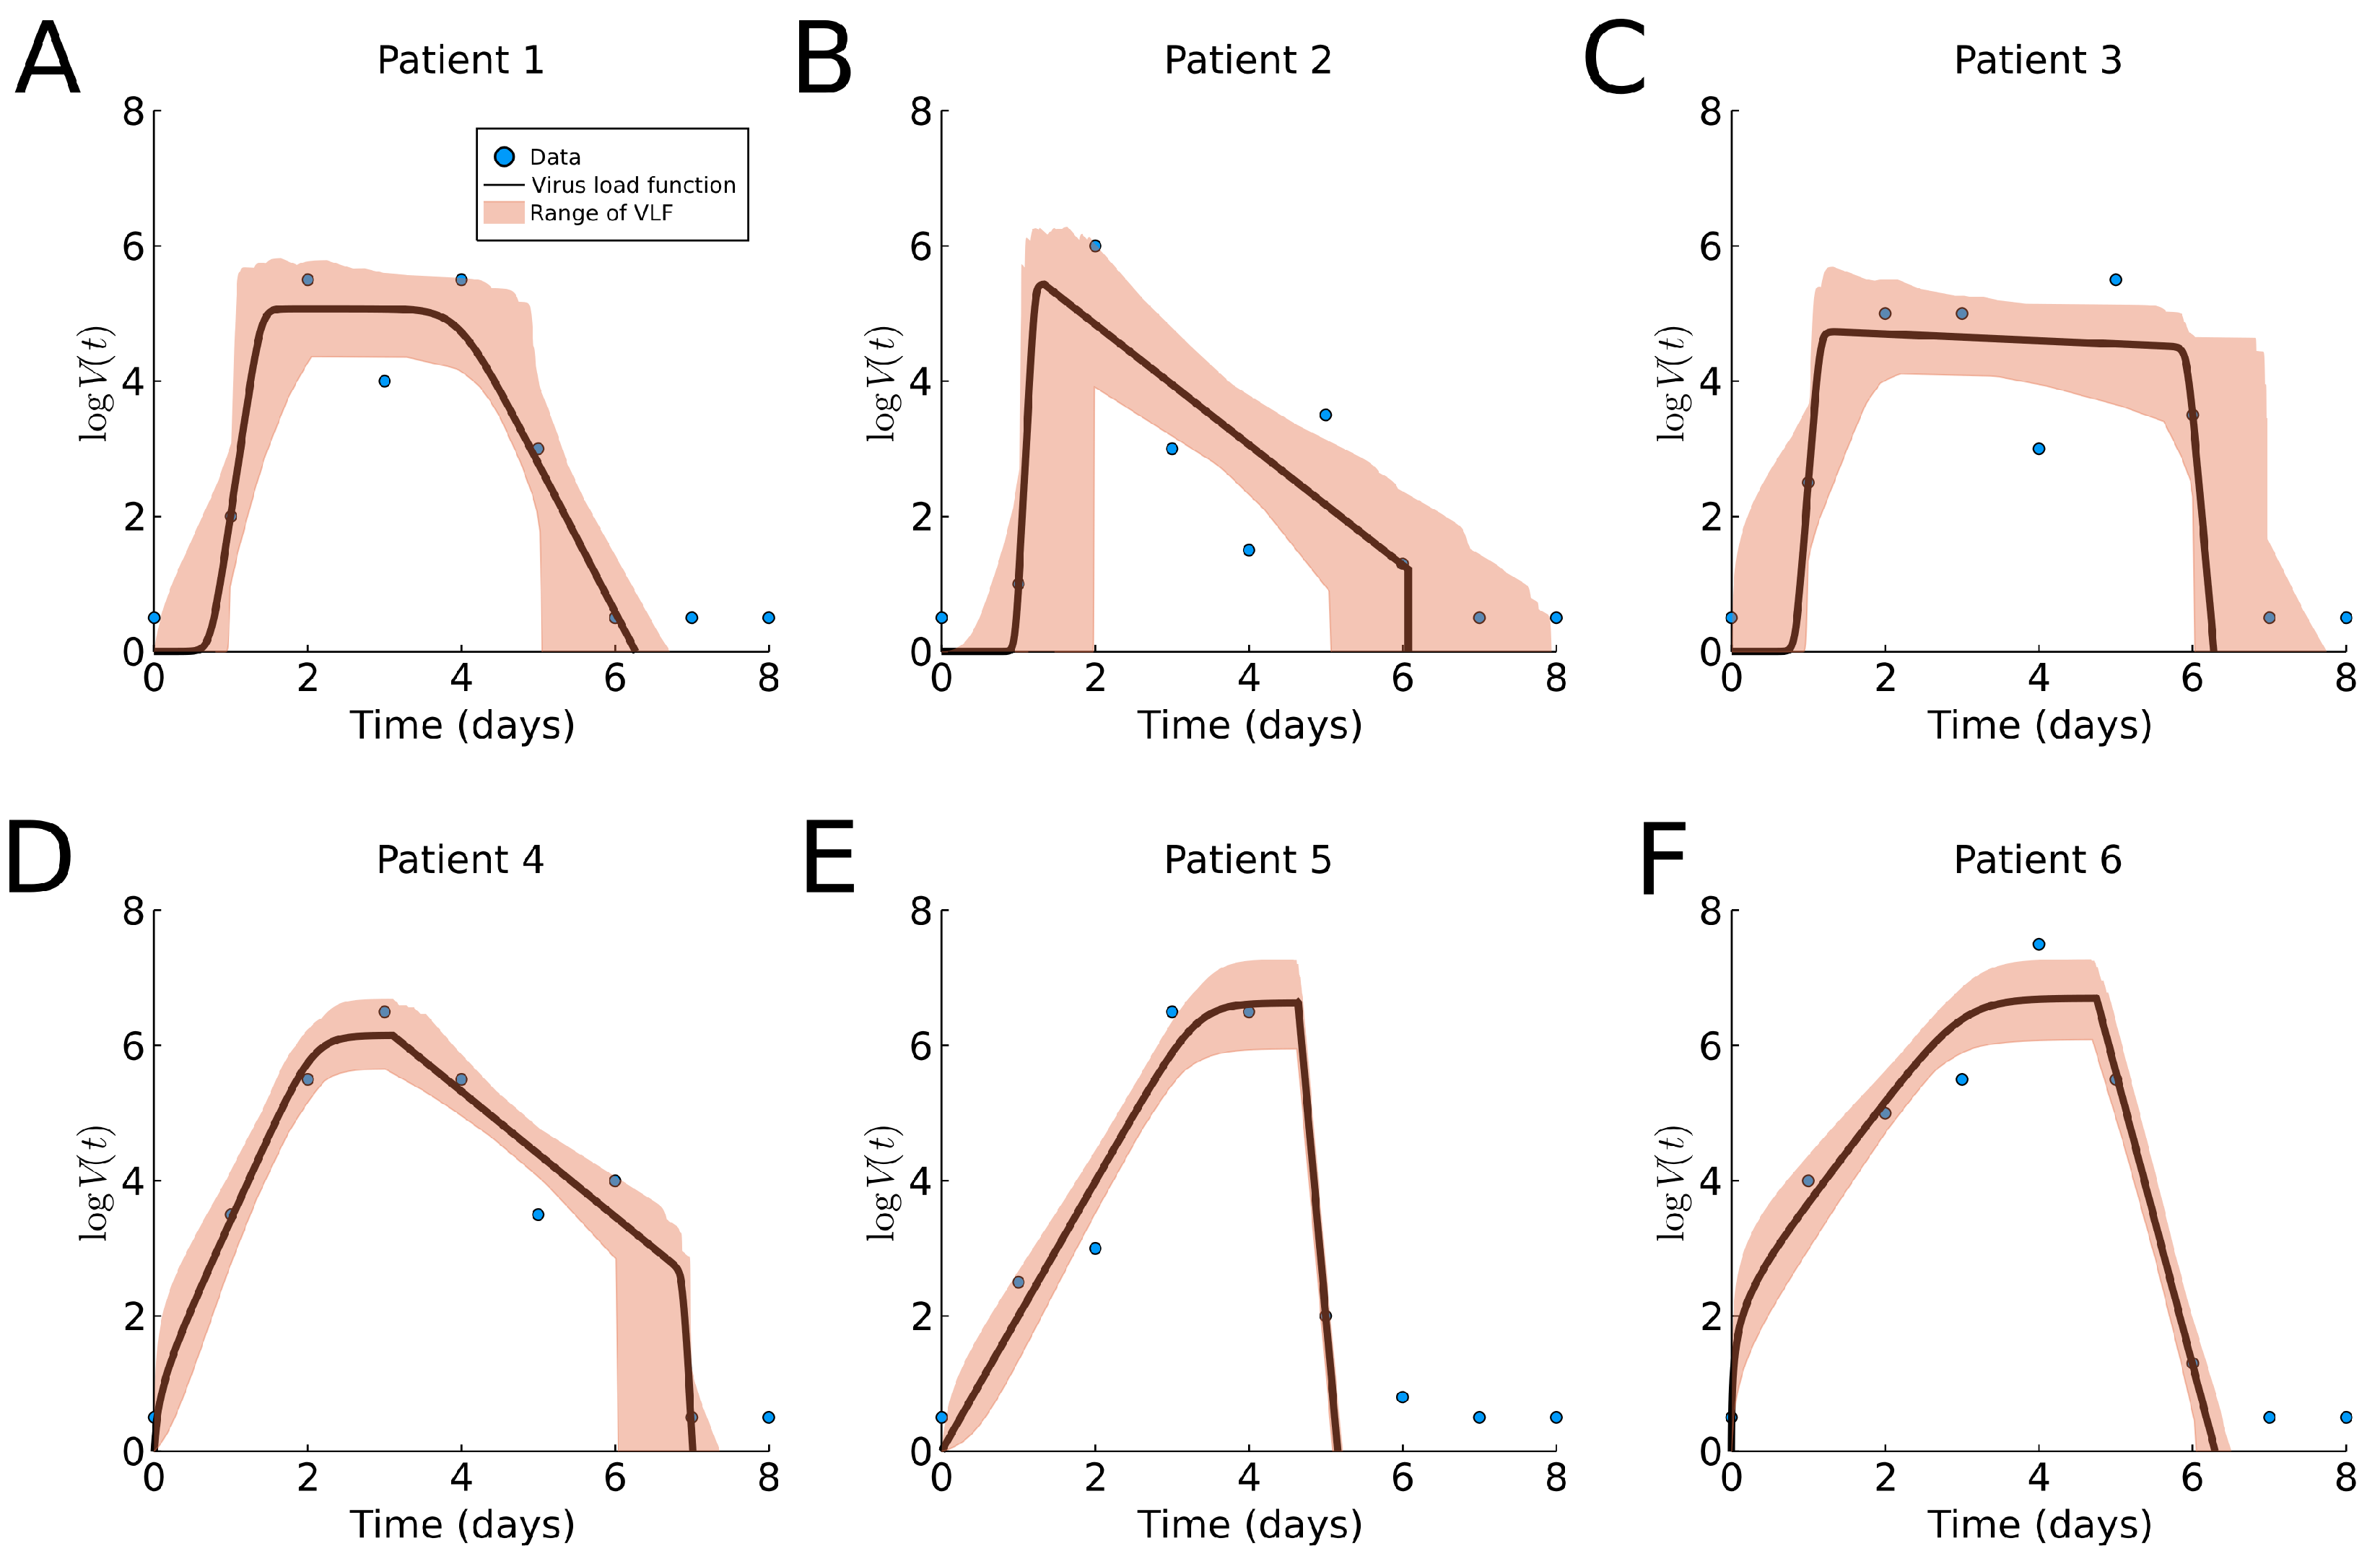
3.3. Human Influenza A Data
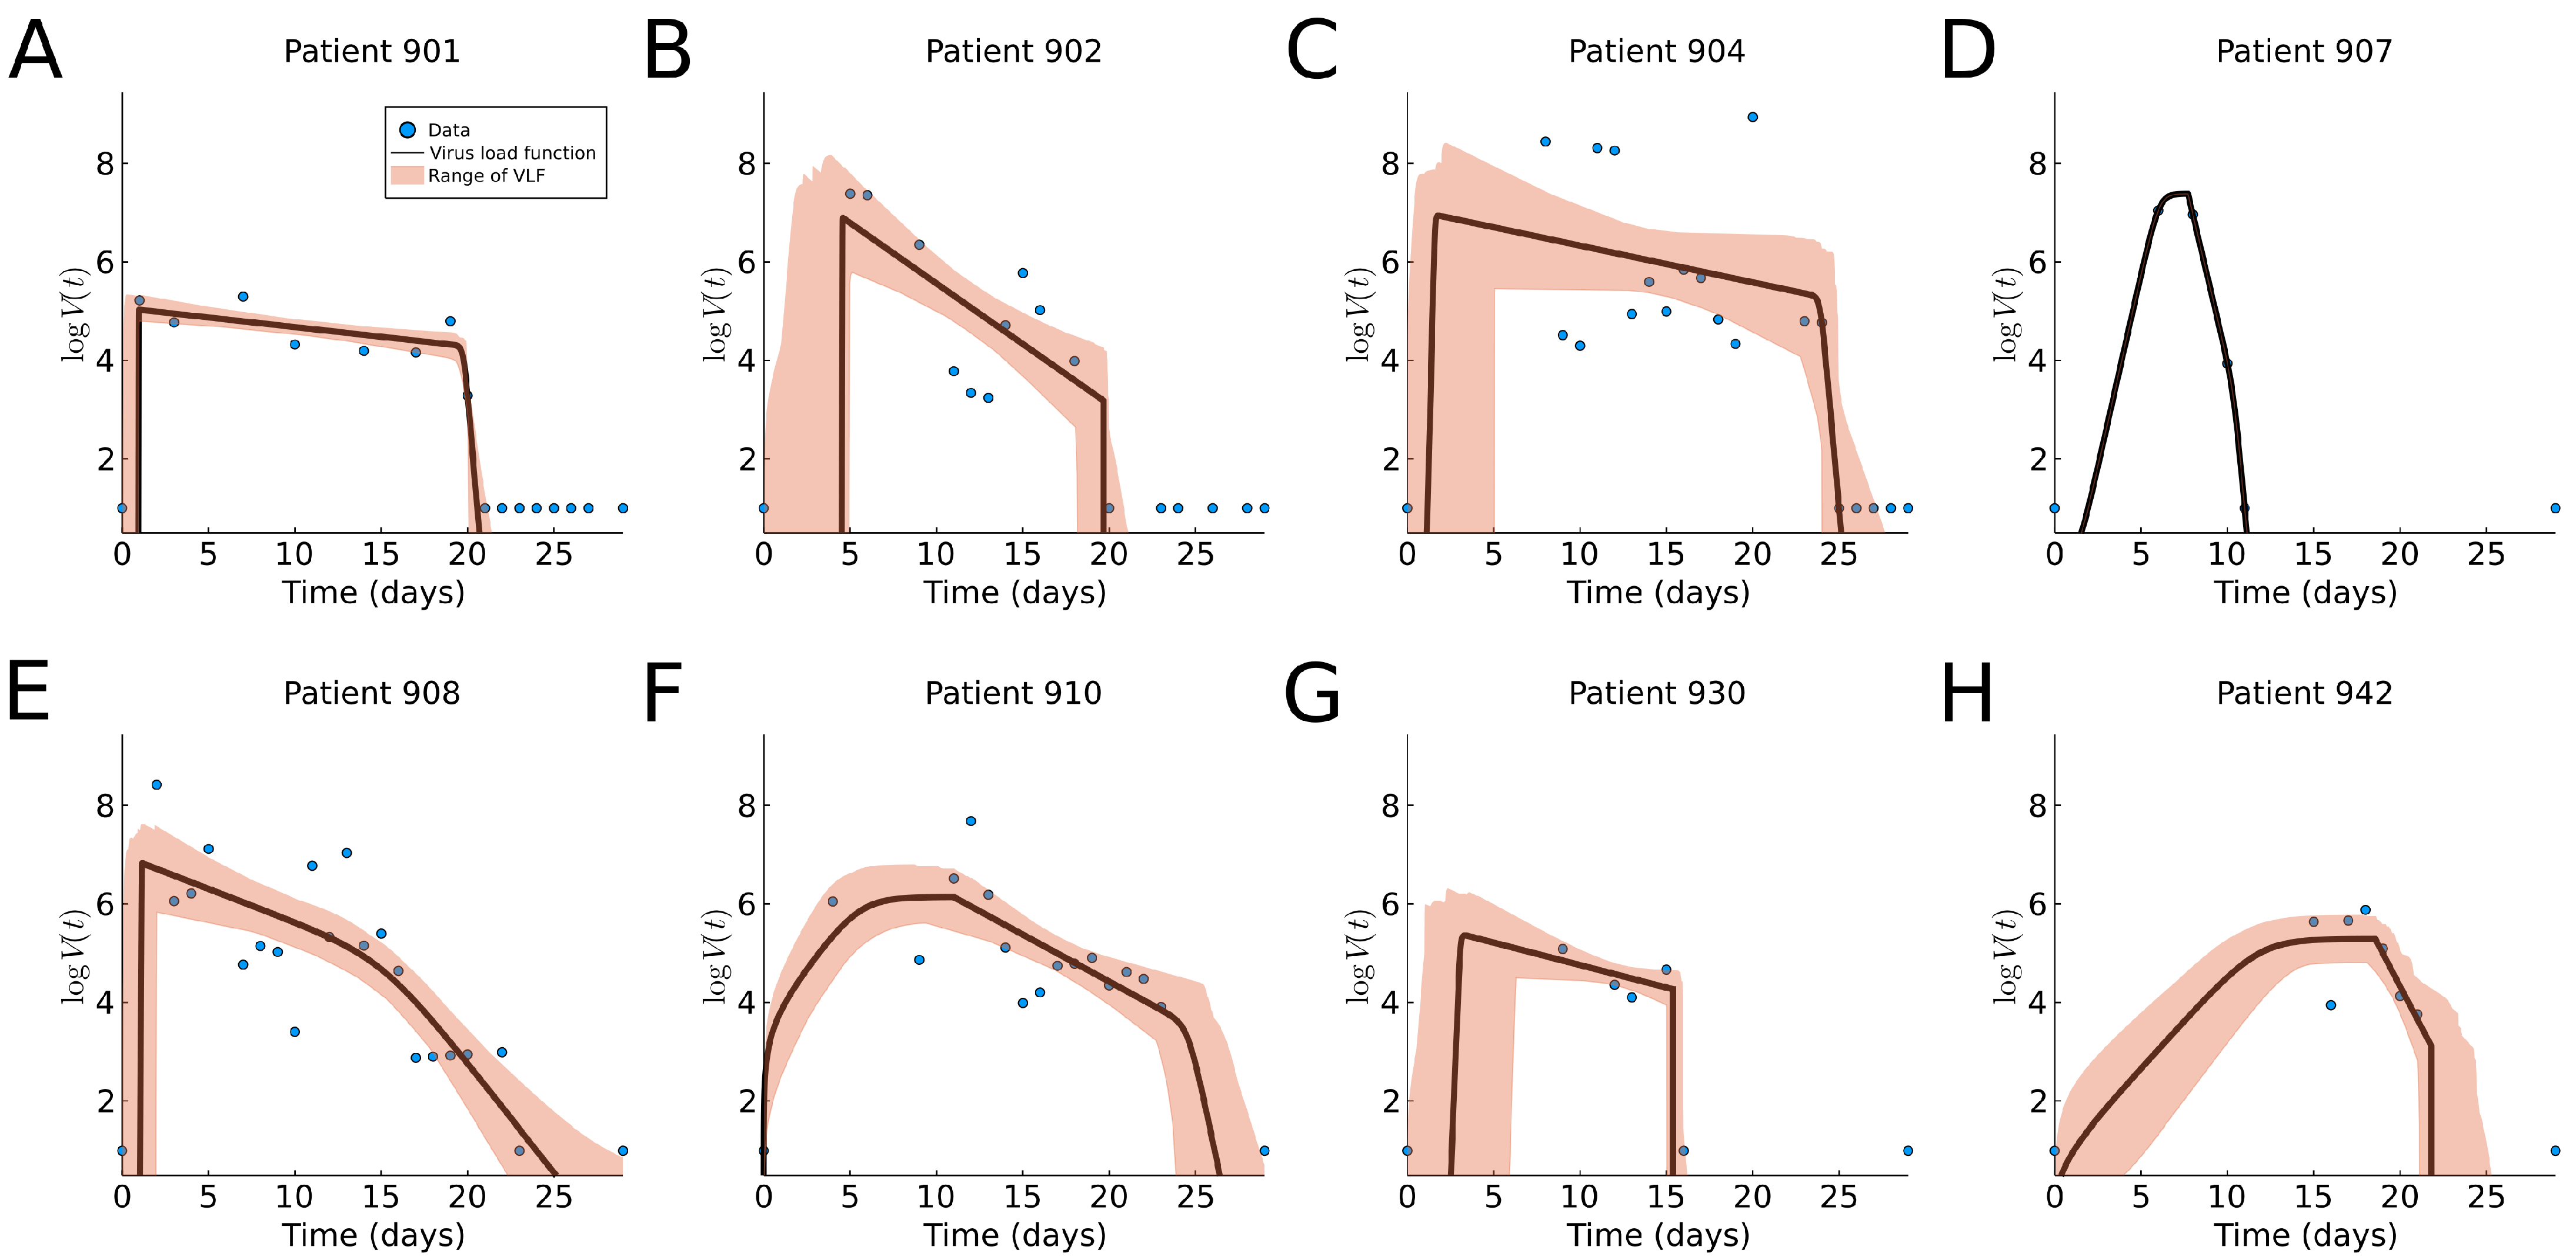
3.4. Human SARS-CoV-2 Data
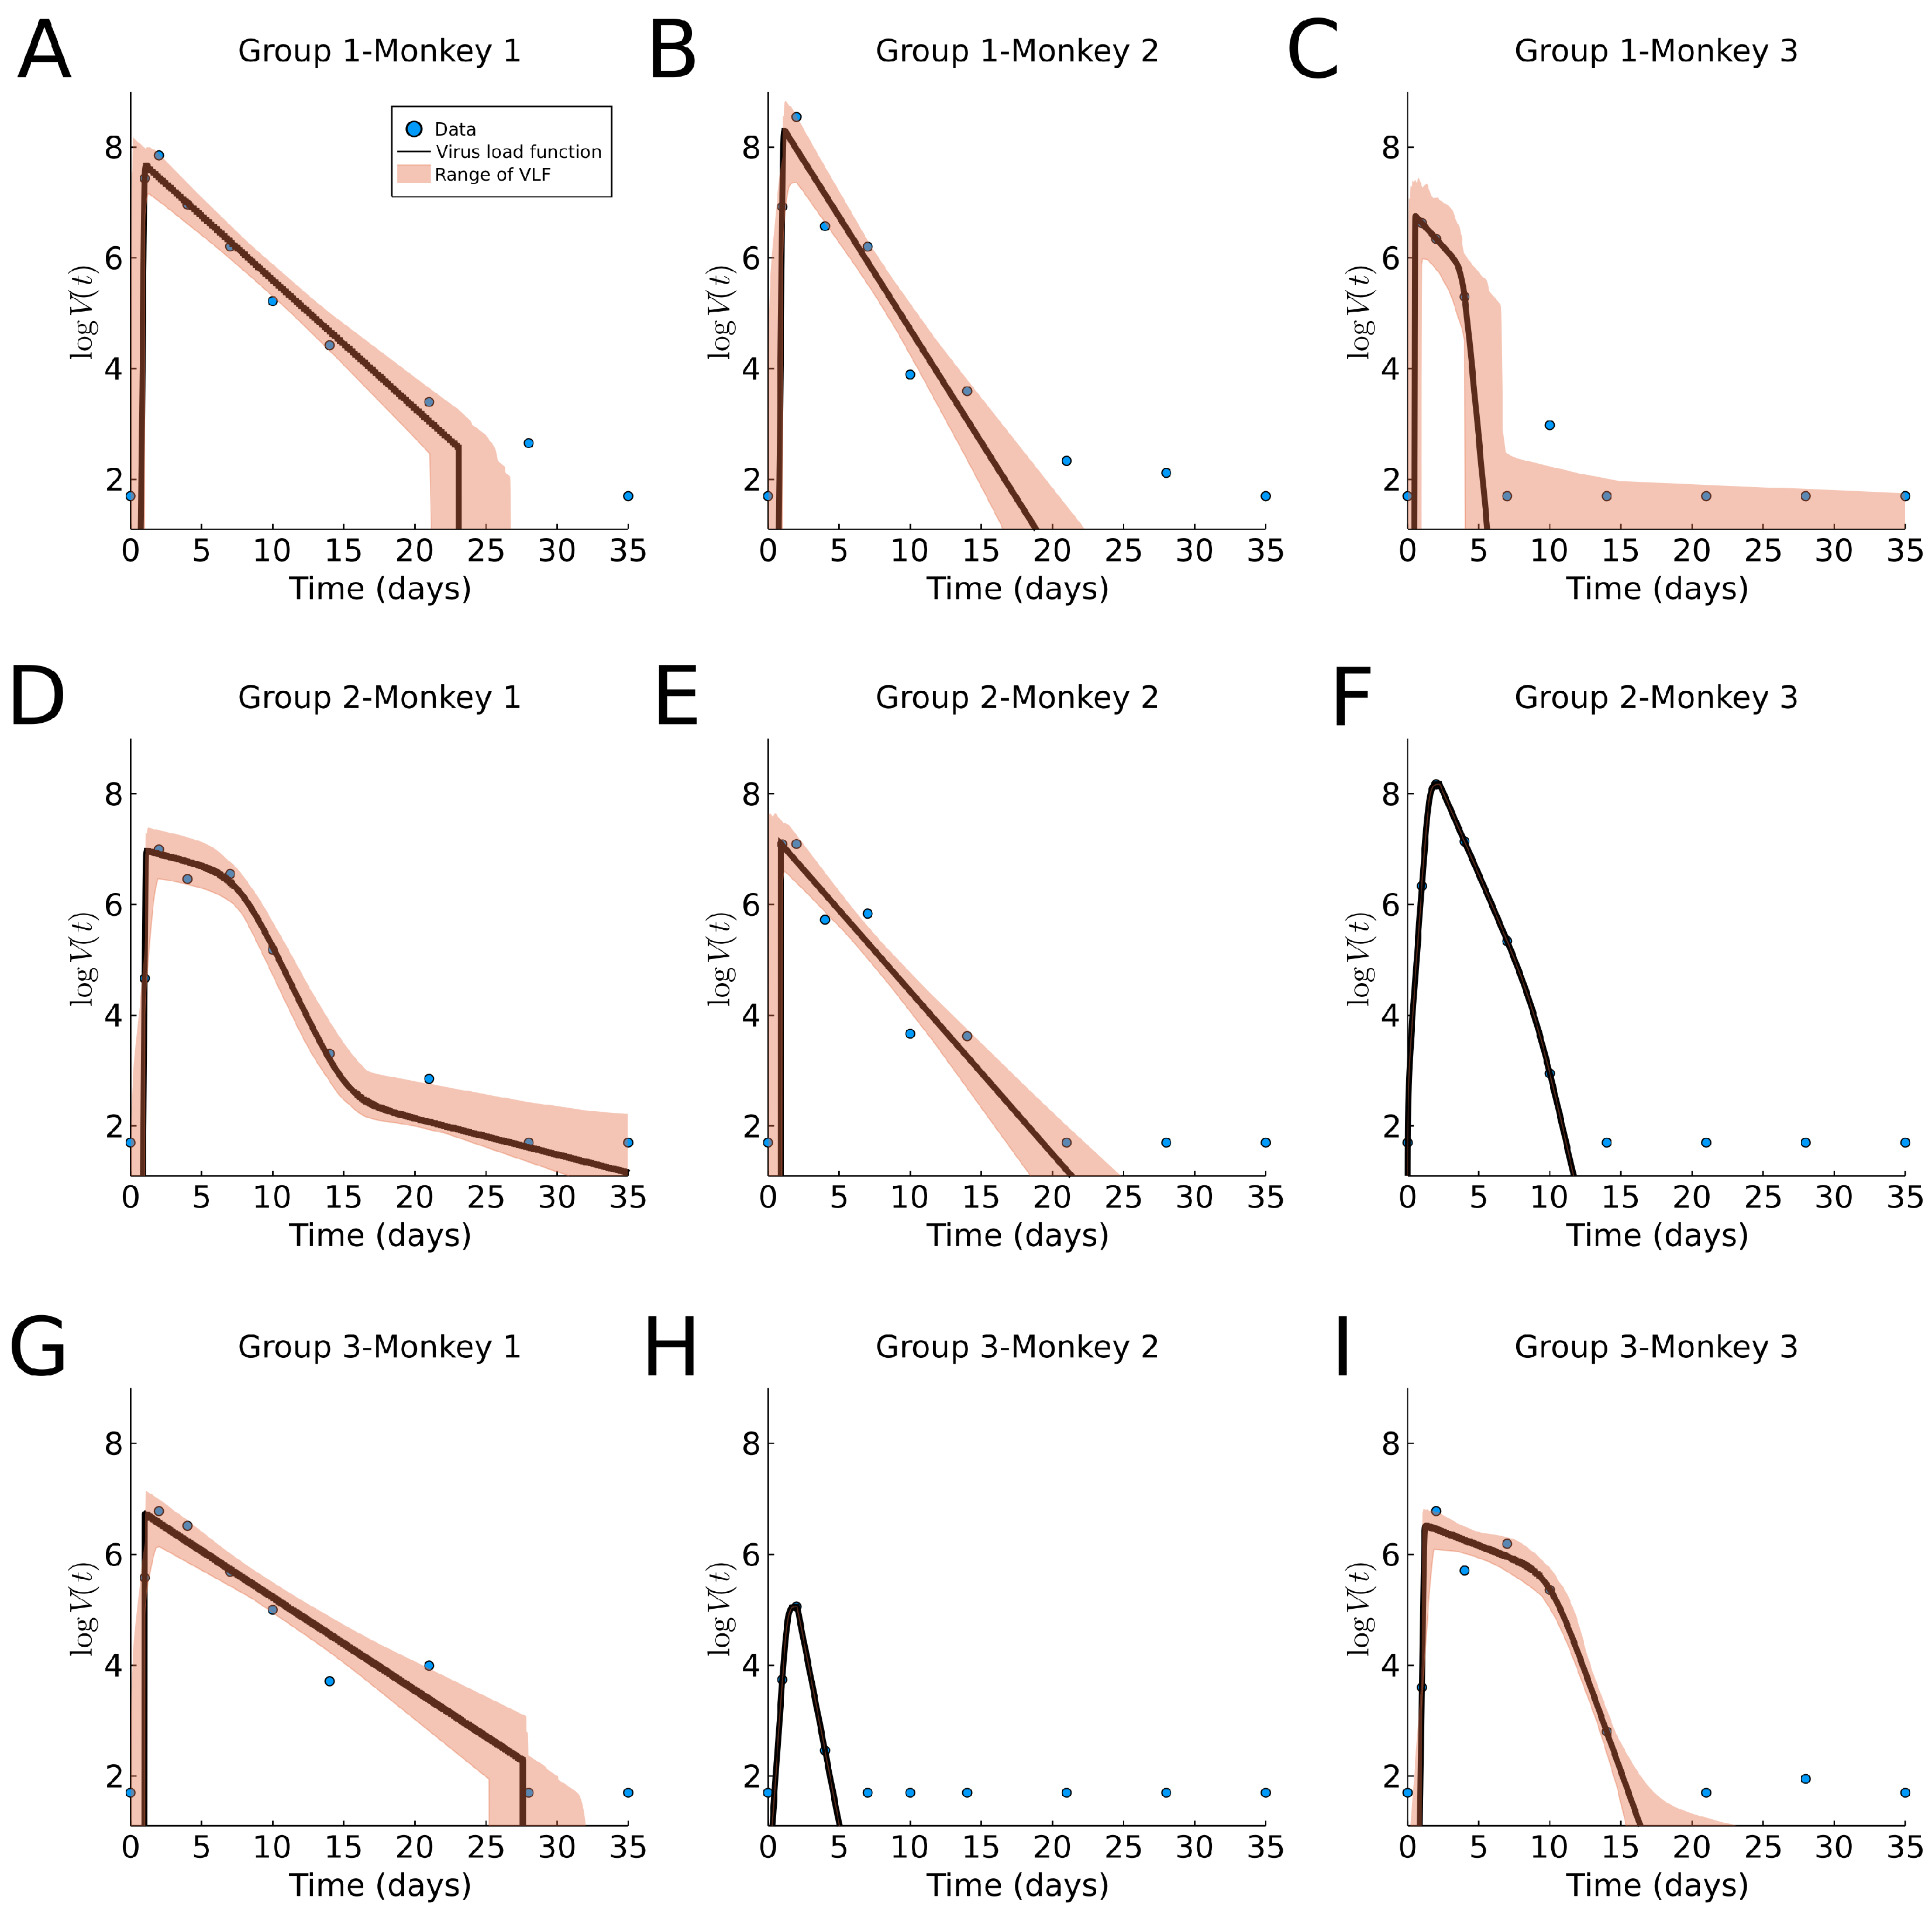
3.5. Macaque Monkey Data
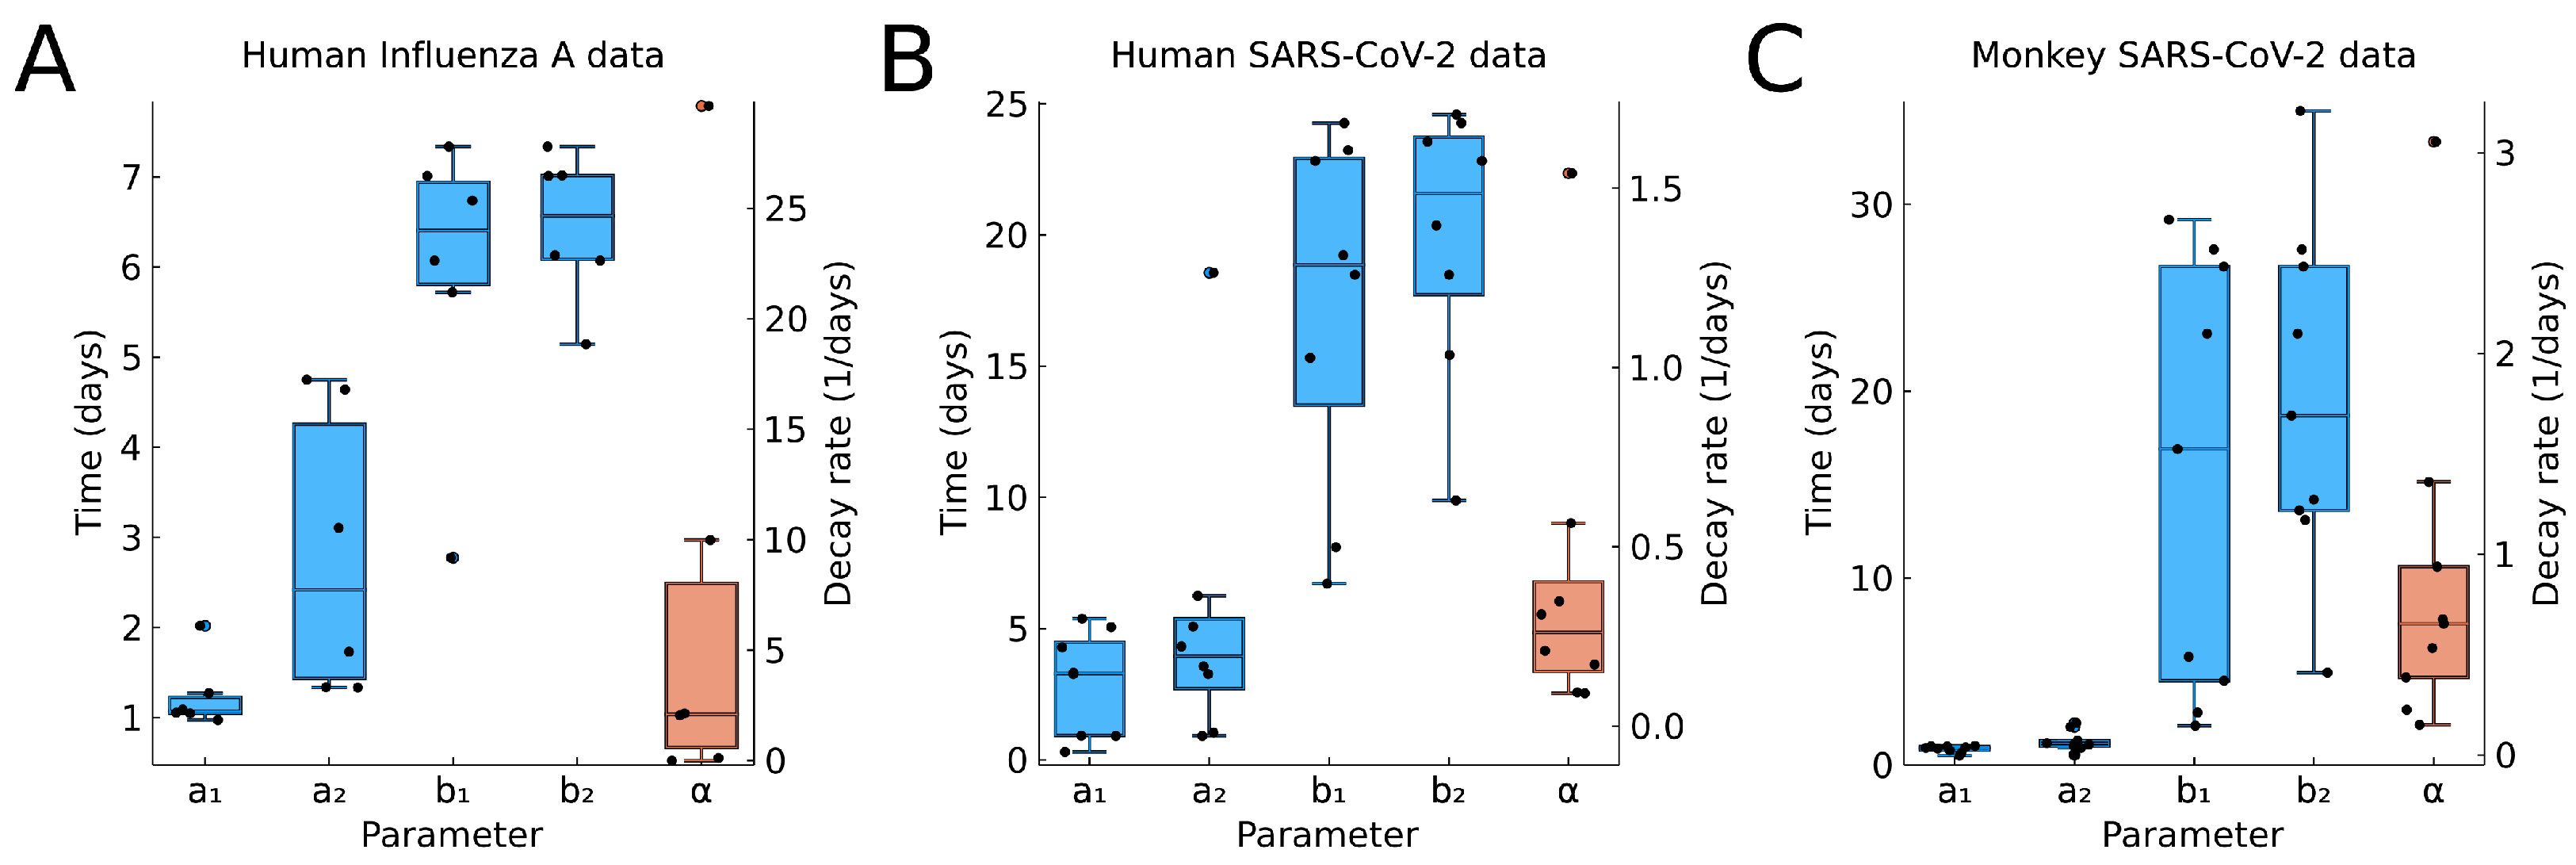
3.6. Parameter Distributions
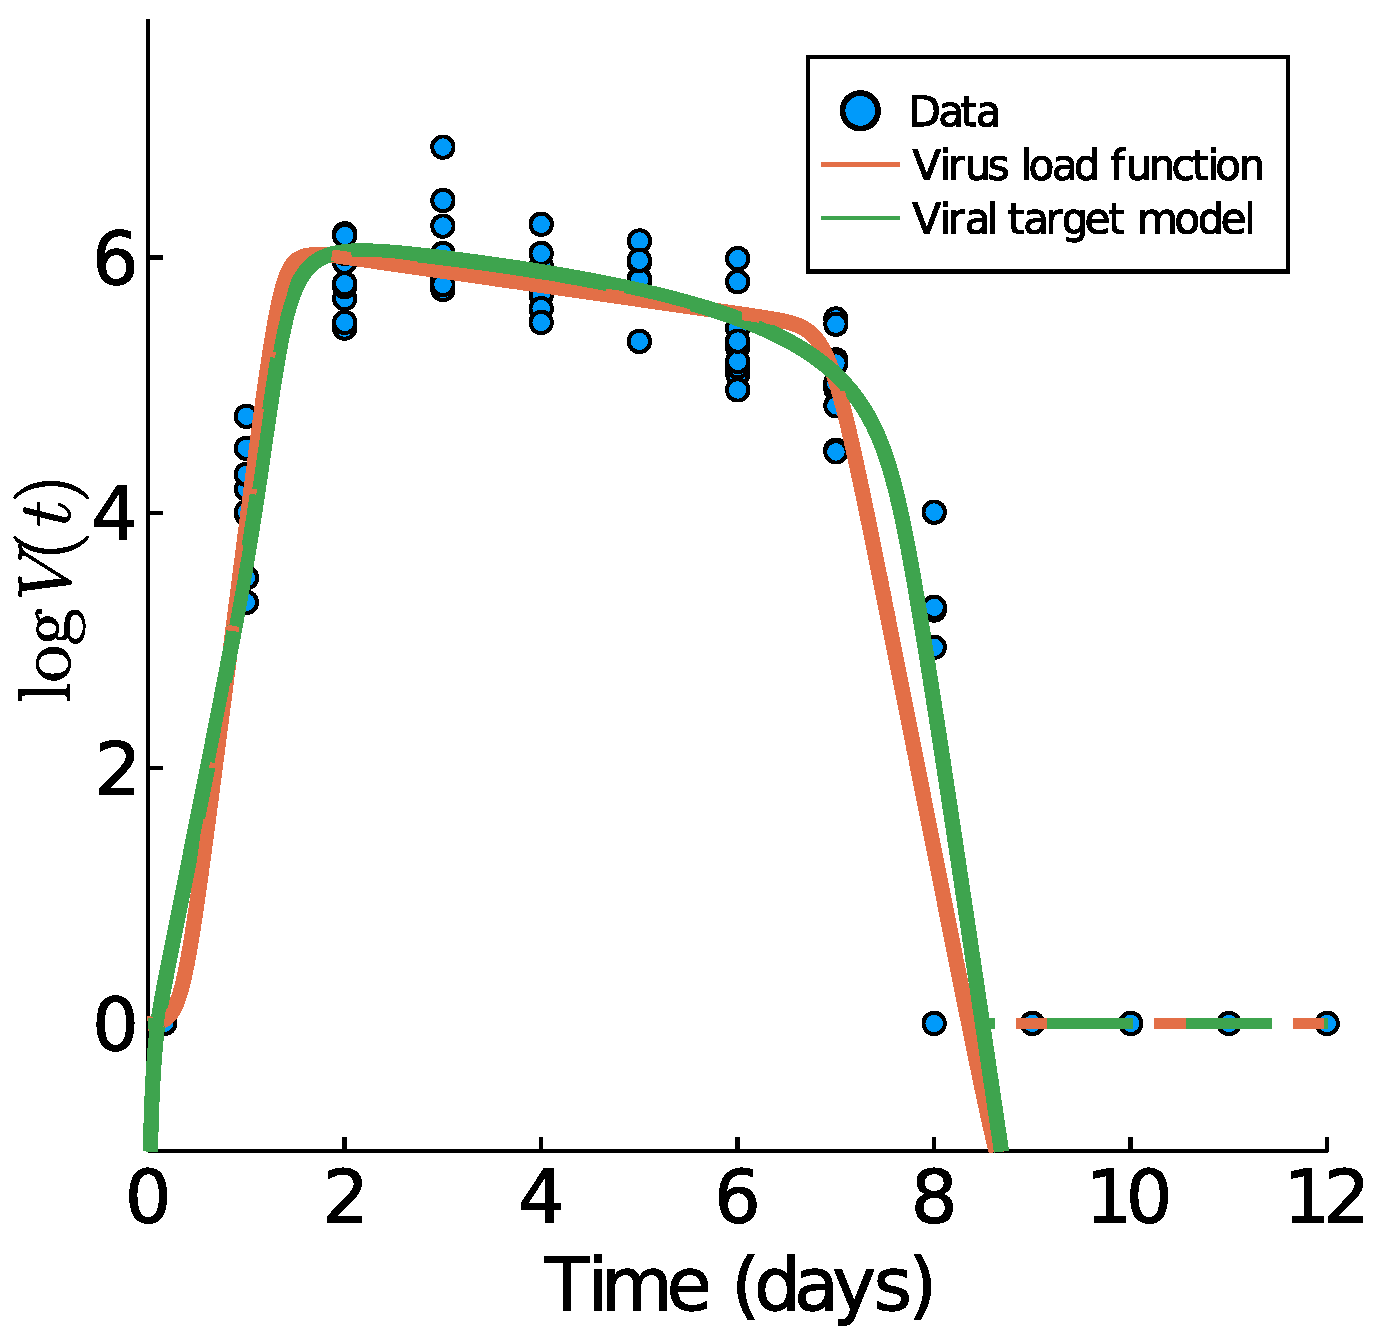
3.7. Comparison to the Virus-Target Model of Smith et al.
4. Discussion
Author Contributions
Funding
Institutional Review Board Statement
Data Availability Statement
Acknowledgments
Conflicts of Interest
Appendix A

| Data | RSS | |||||||
|---|---|---|---|---|---|---|---|---|
| Group | Mice influenza A | |||||||
| Mice | 6.05 | 0.94 | 1.52 | 0.26 | 6.25 | 7.63 | 36.192 | 9.08 |
| (5.92, 6.11) | (0.91, 0.99) | (1.15, 1.97) | (0.19, 0.34) | (6.16, 6.33) | (7.57, 7.73) | ≤37.282 | – | |
| Group | Human rhinovirus | |||||||
| Control | 4.10 | 0.34 | 5.30 | 0.00 | 8.33 | 21.00 | 5.306 | 1.05 |
| (3.48, 4.89) | (0.00, 1.36) | (1.47, 6.72) | (0.00, 0.56) | (3.93, 12.38) | (17.77, 21.00) | ≤9.332 | – | |
| Low IgE | 4.83 | 1.14 | 2.79 | 0.50 | 13.33 | 14.58 | 2.335 | 3.16 |
| (4.43, 5.31) | (0.87, 1.37) | (1.04, 3.65) | (0.25, 0.74) | (9.69, 17.51) | (14.02, 18.78) | ≤4.106 | – | |
| High IgE | 4.14 | 0.89 | 3.67 | 0.42 | 18.94 | 18.94 | 3.892 | 1.87 |
| (3.37, 4.69) | (0.00, 1.37) | (1.02, 6.66) | (0.00, 0.78) | (14.64, 21.00) | (16.04, 21.00) | ≤6.846 | – | |
| Patient | Human influenza A | |||||||
| Patient 1 | 5.07 | 1.05 | 1.73 | 0.00 | 2.77 | 5.14 | 1.986 | 7.69 |
| (4.36, 5.98) | (0.68, 1.39) | (1.01, 3.53) | (0.00, 1.57) | (2.13, 5.18) | (4.84, 6.23) | ≤3.493 | – | |
| Patient 2 | 5.43 | 1.09 | 1.34 | 2.05 | 6.07 | 6.07 | 6.451 | 20.93 |
| (3.71, 6.83) | (0.81, 2.00) | (1.00, 2.74) | (0.69, 3.53) | (2.17, 8.00) | (5.02, 8.00) | ≤11.346 | – | |
| Patient 3 | 4.73 | 0.97 | 1.33 | 0.12 | 5.72 | 6.13 | 3.675 | 14.44 |
| (4.07, 5.92) | (0.00, 1.28) | (1.01, 4.91) | (0.00, 1.53) | (3.47, 6.99) | (6.01, 7.46) | ≤6.464 | – | |
| Patient 4 | 6.15 | 1.05 | 3.11 | 2.13 | 6.74 | 7.02 | 1.304 | 2.53 |
| (5.63, 6.69) | (0.58, 1.36) | (2.60, 3.73) | (1.36, 3.11) | (4.78, 6.99) | (6.03, 7.81) | ≤2.293 | – | |
| Patient 5 | 6.63 | 2.02 | 4.64 | 29.63 | 7.34 | 7.34 | 1.700 | 1.98 |
| (5.95, 7.30) | (1.57, 2.35) | (4.55, 4.73) | (27.95, 31.13) | (4.63, 8.00) | (5.25, 8.00) | ≤2.990 | – | |
| Patient 6 | 6.70 | 1.27 | 4.75 | 9.98 | 7.01 | 7.01 | 1.606 | 1.49 |
| (6.07, 7.33) | (0.39, 1.83) | (4.49, 4.97) | (8.19, 11.90) | (4.55, 8.00) | (5.44, 8.00) | ≤2.826 | – | |
| Patient | Human SARS-CoV-2 | |||||||
| Patient 901 | 5.04 | 0.92 | 0.92 | 0.09 | 19.23 | 20.36 | 0.832 | Inf |
| (4.84, 5.33) | (0.00, 0.99) | (0.06, 1.66) | (0.05, 0.15) | (18.07, 19.96) | (20.01, 20.86) | ≤1.075 | – | |
| Patient 902 | 7.21 | 3.27 | 3.27 | 0.57 | 18.49 | 18.49 | 12.274 | 4849.14 |
| (5.80, 8.70) | (0.00, 5.00) | (0.55, 7.23) | (0.28, 0.85) | (14.30, 19.99) | (18.00, 22.21) | ≤15.856 | – | |
| Patient 904 | 6.75 | 4.29 | 4.32 | 0.17 | 23.23 | 24.58 | 36.754 | 143.82 |
| (5.38, 8.53) | (0.03, 7.97) | (1.39, 9.40) | (0.00, 0.54) | (18.67, 24.99) | (23.16, 26.35) | ≤44.957 | – | |
| Patient 907 | 7.14 | 0.31 | 3.57 | 0.09 | 8.10 | 9.88 | 0.000 | 1.60 |
| (7.14, 7.14) | (0.31, 0.31) | (3.57, 3.57) | (0.09, 0.09) | (8.10, 8.10) | (9.88, 9.88) | ≤0.000 | – | |
| Patient 908 | 6.84 | 0.92 | 1.04 | 0.31 | 6.72 | 23.56 | 20.774 | 44.01 |
| (5.68, 7.98) | (0.00, 1.99) | (0.01, 4.42) | (0.04, 0.55) | (2.05, 11.26) | (19.16, 28.42) | ≤25.153 | – | |
| Patient 910 | 6.74 | 3.32 | 5.08 | 0.35 | 24.26 | 24.26 | 9.211 | 2.96 |
| (5.71, 7.92) | (0.01, 4.00) | (1.59, 9.60) | (0.13, 0.55) | (19.60, 28.68) | (23.01, 28.97) | ≤11.899 | – | |
| Patient 930 | 5.10 | 5.38 | 6.25 | 0.21 | 15.32 | 15.43 | 0.381 | 5.97 |
| (4.62, 5.89) | (1.48, 8.87) | (3.34, 9.83) | (0.06, 0.36) | (14.50, 15.98) | (15.01, 16.00) | ≤0.862 | – | |
| Patient 942 | 5.29 | 5.06 | 18.56 | 1.54 | 22.82 | 22.82 | 2.470 | 0.39 |
| (4.94, 5.64) | (0.10, 10.23) | (17.38, 19.69) | (0.57, 3.15) | (17.91, 27.93) | (21.02, 28.16) | ≤4.344 | – | |
| Group-Monkey | Monkey SARS-CoV-2 | |||||||
| 1-1 | 7.66 | 0.88 | 1.10 | 0.53 | 23.08 | 23.08 | 1.407 | 23.29 |
| (7.15, 8.22) | (0.00, 1.00) | (0.02, 2.49) | (0.43, 0.64) | (19.03, 27.43) | (21.21, 27.76) | ≤2.297 | – | |
| 1-2 | 8.30 | 0.94 | 1.18 | 0.94 | 29.18 | 35.00 | 2.249 | 22.48 |
| (7.36, 9.00) | (0.00, 1.00) | (1.01, 3.04) | (0.72, 1.16) | (24.94, 33.46) | (30.91, 35.00) | ≤3.672 | – | |
| 1-3 | 6.76 | 0.50 | 0.55 | 0.65 | 2.81 | 4.94 | 1.636 | 108.32 |
| (5.96, 7.89) | (0.00, 1.00) | (0.01, 2.71) | (0.00, 2.42) | (0.28, 6.97) | (4.00, 9.72) | ≤2.670 | – | |
| 2-1 | 6.97 | 0.99 | 1.15 | 0.15 | 2.11 | 13.11 | 0.753 | 31.56 |
| (6.47, 7.39) | (0.58, 1.07) | (1.02, 3.03) | (0.02, 0.23) | (1.15, 3.22) | (11.31, 15.29) | ≤1.229 | – | |
| 2-2 | 7.10 | 0.91 | 0.91 | 0.68 | 26.67 | 26.67 | 1.310 | 1813.34 |
| (6.60, 7.78) | (0.00, 1.00) | (0.01, 2.16) | (0.55, 0.84) | (21.77, 30.81) | (23.97, 31.34) | ≤2.138 | – | |
| 2-3 | 8.18 | 0.78 | 2.25 | 1.36 | 4.51 | 13.63 | 0.000 | 3.56 |
| (8.18, 8.18) | (0.78, 0.78) | (2.25, 2.25) | (1.36, 1.36) | (4.51, 4.51) | (13.63, 13.63) | ≤ 0.000 | – | |
| 3-1 | 6.73 | 1.00 | 1.01 | 0.39 | 27.58 | 27.58 | 1.264 | 333.07 |
| (6.14, 7.15) | (0.00, 1.00) | (1.01, 3.42) | (0.29, 0.49) | (22.80, 31.28) | (24.98, 32.70) | ≤2.063 | – | |
| 3-2 | 5.06 | 0.65 | 2.04 | 3.05 | 16.91 | 18.70 | 0.000 | 3.75 |
| (5.06, 5.06) | (0.65, 0.65) | (2.04, 2.04) | (3.05, 3.05) | (16.91, 16.91) | (18.70, 18.70) | ≤0.000 | – | |
| 3-3 | 6.52 | 1.02 | 1.30 | 0.23 | 5.79 | 14.20 | 0.527 | 18.22 |
| (6.10, 6.82) | (0.94, 1.15) | (1.07, 2.69) | (0.01, 0.44) | (2.89, 8.93) | (12.55, 16.05) | ≤0.859 | – | |
References
- Zhou, F.; Yu, T.; Du, R.; Fan, G.; Liu, Y.; Liu, Z.; Xiang, J.; Wang, Y.; Song, B.; Gu, X.; et al. Clinical course and risk factors for mortality of adult impatients with COVID-19 in Wuhan, China: A retrospective cohort study. Lancet 2020, 395, 1054–1062. [Google Scholar] [CrossRef]
- Madjid, M.; Safavi-Naeini, P.; Solomon, S.D.; Vardeny, O. Potential Effects of Coronaviruses on the Cardiovascular System. JAMA Cardiol. 2020, 5, 831. [Google Scholar] [CrossRef] [Green Version]
- Lippi, G.; Plebani, M.; Henry, B.M. Thrombocytopenia is associated with severe coronavirus disease 2019 (COVID-19) infections: A meta-analysis. Clin. Chim. Acta 2020, 506, 145–148. [Google Scholar] [CrossRef] [PubMed]
- Néant, N.; Lingas, G.; Le Hingrat, Q.; Ghosn, J.; Engelmann, I.; Lepiller, Q.; Gaymard, A.; Ferré, V.; Hartard, C.; Plantier, J.C.; et al. Modeling SARS-CoV-2 viral kinetics and association with mortality in hospitalized patients from the French COVID cohort. Proc. Natl. Acad. Sci. USA 2021, 118, e2017962118. [Google Scholar] [CrossRef] [PubMed]
- To, K.K.W.; Tsang, O.T.Y.; Leung, W.S.; Tam, A.R.; Wu, T.C.; Lung, D.C.; Yip, C.C.Y.; Cai, J.P.; Chan, J.M.C.; Chik, T.S.H.; et al. Temporal profiles of viral load in posterior oropharyngeal saliva samples and serum antibody responses during infection by SARS-CoV-2: An observational cohort study. Lancet Infect. Dis. 2020, 20, 565–574. [Google Scholar] [CrossRef] [Green Version]
- Chandrashekar, A.; Liu, J.; Martinot, A.J.; McMahan, K.; Mercado, N.B.; Peter, L.; Tostanoski, L.H.; Yu, J.; Maliga, Z.; Nekorchuk, M.; et al. SARS-CoV-2 infection protects against rechallenge in rhesus macaques. Science 2020, 817, eabc4776. [Google Scholar] [CrossRef] [PubMed]
- Baccam, P.; Beauchemin, C.; Macken, C.A.; Hayden, F.G.; Perelson, A.S. Kinetics of Influenza A Virus Infection in Humans. J. Virol. 2006, 80, 7590–7599. [Google Scholar] [CrossRef] [Green Version]
- Smith, A.M. Host-pathogen kinetics during influenza infection and coinfection: Insights from predictive modeling. Immunol. Rev. 2018, 285, 97–112. [Google Scholar] [CrossRef] [Green Version]
- Hillen, T. A Standard Virus-Load Function. bioRxiv 2020. Available online: https://www.medrxiv.org/content/10.1101/2020.06.19.20135814v1.full.pdf (accessed on 1 March 2021).
- Smith, A.P.; Moquin, D.J.; Bernhauerova, V.; Smith, A.M. Influenza virus infection model with density dependence supports biphasic viral decay. Front. Microbiol. 2018, 9, 1554. [Google Scholar] [CrossRef] [Green Version]
- Myers, M.; Smith, A.; Lane, L.; Moquin, D.; Vogel, P.; Woolard, S.; Smith, A.M. Dynamically Linking Influenza Virus Infection with Lung Injury to Predicy Disease Severity. bioRxiv 2021. Available online: https://www.biorxiv.org/content/10.1101/555276v2 (accessed on 1 March 2021).
- Olobatuyi, O.; de Vries, G.; Hillen, T. A Reaction-Diffusion Model for Radiation-Induced Bystander Effects. J. Math. Biol. 2017, 75, 341–372. [Google Scholar] [CrossRef] [PubMed]
- Jenner, A.L.; Aogo, R.A.; Alfonso, S.; Crowe, V.; Smith, A.P.; Morel, P.A.; Davis, C.L.; Smith, A.M.; Craig, M. COVID-19 virtual patient cohort reveals immune mechanisms driving disease outcomes. bioRxiv 2021. Available online: https://www.biorxiv.org/content/10.1101/2021.01.05.425420v1 (accessed on 28 May 2021).
- Getz, M.; Wang, Y.; An, G.; Becker, A.; Cockrell, C.; Collier, N.; Craig, M.; Davis, C.; Faeder, J.; Versypt, A.; et al. Rapid community-driven development of a SARS-CoV-2 tissue simulator. bioRxiv 2020. Available online: https://www.biorxiv.org/content/10.1101/2020.04.02.019075v3 (accessed on 1 March 2021).
- Pucci, F.; Bogaerts, P.; Rooman, M. Modeling the Molecular Impact of SARS-CoV-2 Infection on the Renin-Angiotensin System. Viruses 2020, 12, 1367. [Google Scholar] [CrossRef] [PubMed]
- Kennedy, J.L.; Shaker, M.; McMeen, V.; Gern, J.; Carper, H.; Murphy, D.; Lee, W.M.; Bochkov, Y.A.; Vrtis, R.F.; Platts-Mills, T.; et al. Comparison of viral load in individuals with and without asthma during infections with rhinovirus. Am. J. Respir. Crit. Care Med. 2014, 189, 532–539. [Google Scholar] [CrossRef] [Green Version]
- Murphy, B.R.; Rennels, M.B.; Douglas, R.G.; Betts, R.F.; Couch, R.B.; Cate, T.R.; Chanock, R.M.; Kendal, A.P.; Maassab, H.F.; Suwanagool, S.; et al. Evaluation of Influenza A/Hong Kong/123/77 (H1N1) ts-1A2 and Cold-Adapted Recombinant Viruses in Seronegative Adult Volunteers. Infect. Immun. 1980, 29, 348–355. [Google Scholar] [CrossRef]
- Smith, A.; Perelson, A. Influenza A virus infection kinetics: Quantitative data and models. Wiley Interdiscip. Rev. Syst. Biol. Med. 2011, 3, 429–445. [Google Scholar] [CrossRef] [Green Version]
- Woo, H.J.; Reifman, J. Quantitative Modeling of Virus Evolutionary Dynamics and Adaptation in Serial Passages Using Empirically Inferred Fitness Landscapes. J. Virol. 2014, 88, 1039–1050. [Google Scholar] [CrossRef] [Green Version]
- Sprott, D.A. Statistical Inference in Science; Springer: Berlin/Heidelberg, Germany, 2000. [Google Scholar]
- Burnham, K.P.; Anderson, D.R. Model Selection and Multimodel Inference; Springer: Berlin/Heidelberg, Germany, 2010. [Google Scholar]
- Smith, A.; Adler, F.; Perelson, A. An accurate two-phse approximate solution to an acute viral infection model. J. Math. Biol. 2010, 60, 711–726. [Google Scholar] [CrossRef] [Green Version]
- Beauchemin, C.A.; Handel, A. A review of mathematical models of influenza A infections within a host or cell culture: Lessons learned and challenges ahead. BMC Public Health 2011, 11, S7. [Google Scholar] [CrossRef] [Green Version]
- Peter, S.; Hölzer, M.; Lamkiewicz, K.; di Fenizio, P.; Hwaeer, H.A.; Marz, M.; Schuster, S.; Dittrich, P.; Ibrahim, B. Structure and Hierarchy of Influenza Virus Models Revealed by Reaction Network Analysis. Viruses 2019, 11, 449. [Google Scholar] [CrossRef] [Green Version]
- Pinky, L.; Dobrovolny, H. SARS-CoV-2 coinfections: Could influenza and the common cold be beneficial? J. Med. Virol. 2020, 92, 2623–2630. [Google Scholar] [CrossRef]
- Hernandez-Vargas, E.; Velasco-Hernandez, J. In-host Mathematical Modelling of COVID-19 in Humans. Annu. Rev. Control 2020, 50, 448–456. [Google Scholar] [CrossRef]
- Fatehi, F.; Bingham, R.; Dykeman, E.; Stockley, P.; Twarock, R. Comparing antiviral strategies against COVID-19 via multi-scale within host modelling. arXiv 2020, arXiv:2010.08957. [Google Scholar]
- Goyal, A.; Cardozo-Ojeda, E.; Schiffer, J. Potency and timing of antiviral therapy as determinants of duration of SARS-CoV-2 shedding and intensity of inflammatory response. Sci. Adv. 2020, 6, 47. [Google Scholar] [CrossRef]
- Torneri, A.; Libin, P.V.; Vanderlocht, J.; Vandamme, A.-M.; Neyts, J.; Hens, N. A prospect on the use of antiviral drugs to control local outbreaks of COVID-19. BMC Med. 2020, 18, 191. [Google Scholar] [CrossRef] [PubMed]
- Ejima, K.; Kim, K.; Ito, Y.; Iwanami, S.; Ohashi, H.; Koizumi, Y.; Watashi, K.; Bento, A.; Aihara, K.; Iwami, S. Inferring Timing of Infection Using Within-host SARS-CoV-2 Infection Dynamics Model: Are “Imported Cases” Truly Imported? medRxiv 2020. [Google Scholar] [CrossRef]
- Dobrovolny, H. Quantifying the effect of Remdesivir in rhesus macaques infected with SARS-CoV-2. Virology 2020, 550, 61–69. [Google Scholar] [CrossRef] [PubMed]
- Kim, K.; Ejima, K.; Iwanami, S.; Fujita, Y.; Ohashi, H.; Koizumi, Y.; Asai, Y.; Nakaoka, S.; Watashi, K.; Aihara, K.; et al. A quantitative model used to compare within-host SARS-CoV-2, MERS-CoV, and SARS-CoV dynamics provides insights into the pathogenesis and treatment of SARS-CoV-2. PLoS Biol. 2021, 19, e3001128. [Google Scholar] [CrossRef] [PubMed]
- Du, Z.; Nugent, C.; Galvani, A.; Krug, R.; Meyers, L.A. Modeling mitigation of influenza epidemics by baloxavir. Nat. Commun. 2020, 11, 2750. [Google Scholar] [CrossRef] [PubMed]
- Du, S.; Yuan, W. Mathematical modeling of interaction between innate and adaptive immune responses in COVID-19 and implications for viral pathogenesis. J. Med. Virol. 2020, 92, 1615–1628. [Google Scholar] [CrossRef]
- Blanco-Rodríguez, R.; Du, X.; Hernández-Vargas, E. Untangling the cell immune response dynamic for severe and critical cases of SARS-CoV-2 infection. bioRxiv 2020. [Google Scholar] [CrossRef]
- Benefield, A.; Skrip, L.; Clement, A.; Althouse, R.; Chang, S.; Althouse, B. SARS-CoV-2 viral load peaks prior to symptom onset: A systematic review and individual-pooled analysis of coronavirus viral load from 66 studies. medRxiv 2020. [Google Scholar] [CrossRef]
- Vegvari, C.; Hadjichrysanthou, C.; Cauet, E.; Lawrence, E.; Cori, A.; de Wolf, F.; Anderson, R. How Can Viral Dynamics Models Inform Endpoint Measures in Clinical Trials of Therapies for Acute Viral Infections? PLoS ONE 2016, 11, e0158237. [Google Scholar] [CrossRef] [Green Version]
- Cevik, M.; Kuppalli, K.; Kindrachuk, J.; Peiris, M. Virology, transmission, and pathogenesis of SARS-CoV-2. BMJ 2020, 371, m3862. [Google Scholar] [CrossRef]
- Deeks, S.; Overbaugh, J.; Phillips, A.; Buchbinder, S. HIV Infection. Nat. Rev. Dis. Prim. 2015, 1, 15035. [Google Scholar] [CrossRef]
- McElreath, R. Statistical Rethinking; CRC Press: Boca Raton, FL, USA, 2020. [Google Scholar]


| Parameter | A, B | C | D | Meaning (Units) |
|---|---|---|---|---|
| maximum virus load (TCID) | ||||
| minimum virus load (TCID) | ||||
| 0.5 | 0.9 | 2.2 | onset of virus growth (d) | |
| 4 | 2.07 | 5.1 | enter virus saturation (d) | |
| 0.1 | 0.38 | 1.3 | intermediate decay rate (d) | |
| 13 | 6.9 | 16 | onset of rapid decay (d) | |
| 19 | 7.9 | 23.8 | reach virus clearance (d) |
| Parameter | C | D | Figure 4 | Meaning (Units) |
|---|---|---|---|---|
| virus infection rate (TCID d) | ||||
| p | 1.7 | 0.8 | 1.66 | virus production rate (TCID cell d) |
| c | 12.48 | 12.48 | 13.58 | virus decay rate (d) |
| k | 4 | 4 | 4 * | infection maturation rate (d) |
| base decay rate of infect. cells (cell d) | ||||
| 113,400 | 113,400 | 31,280 | half saturation constant (cells) | |
| T initial condition (cells) | ||||
| 75 | 75 | 75 | initial condition (cells) | |
| 0 | 0 | 0 | initial condition (cells) | |
| 0 | 0 | 0 | V initial condition (cells) | |
| 9.268 | 1.134 | 6.948 | basic reproduction number |
Publisher’s Note: MDPI stays neutral with regard to jurisdictional claims in published maps and institutional affiliations. |
© 2021 by the authors. Licensee MDPI, Basel, Switzerland. This article is an open access article distributed under the terms and conditions of the Creative Commons Attribution (CC BY) license (https://creativecommons.org/licenses/by/4.0/).
Share and Cite
Contreras, C.; Newby, J.M.; Hillen, T. Personalized Virus Load Curves for Acute Viral Infections. Viruses 2021, 13, 1815. https://doi.org/10.3390/v13091815
Contreras C, Newby JM, Hillen T. Personalized Virus Load Curves for Acute Viral Infections. Viruses. 2021; 13(9):1815. https://doi.org/10.3390/v13091815
Chicago/Turabian StyleContreras, Carlos, Jay M. Newby, and Thomas Hillen. 2021. "Personalized Virus Load Curves for Acute Viral Infections" Viruses 13, no. 9: 1815. https://doi.org/10.3390/v13091815
APA StyleContreras, C., Newby, J. M., & Hillen, T. (2021). Personalized Virus Load Curves for Acute Viral Infections. Viruses, 13(9), 1815. https://doi.org/10.3390/v13091815