Article

PHIDA: A High Throughput Turbidimetric Data Analytic Tool to Compare Host Range Profiles of Bacteriophages Isolated Using Different Enrichment Methods

1
Guelph Research and Development Centre, Agriculture and Agri-Food Canada, Guelph, ON N1G 5C9, Canada
2
Department of Molecular and Cellular Biology, College of Biological Science, University of Guelph, Guelph, ON N1G 2W1, Canada
3
Faculty of Applied Science and Technology, The Sheridan College Institute of Technology and Advanced Learning, Oakville, ON L6H 2L1, Canada
*
Author to whom correspondence should be addressed.
Viruses 2021, 13(11), 2120; https://doi.org/10.3390/v13112120
Submission received: 18 September 2021 / Revised: 8 October 2021 / Accepted: 12 October 2021 / Published: 21 October 2021
(This article belongs to the Special Issue Bacteriophages in Food Applications)

Abstract

:
Bacteriophages are viruses that infect bacteria and are present in niches where bacteria thrive. In recent years, the suggested application areas of lytic bacteriophage have been expanded to include therapy, biocontrol, detection, sanitation, and remediation. However, phage application is constrained by the phage’s host range—the range of bacterial hosts sensitive to the phage and the degree of infection. Even though phage isolation and enrichment techniques are straightforward protocols, the correlation between the enrichment technique and host range profile has not been evaluated. Agar-based methods such as spotting assay and efficiency of plaquing (EOP) are the most used methods to determine the phage host range. These methods, aside from being labor intensive, can lead to subjective and incomplete results as they rely on qualitative observations of the lysis/plaques, do not reflect the lytic activity in liquid culture, and can overestimate the host range. In this study, phages against three bacterial genera were isolated using three different enrichment methods. Host range profiles of the isolated phages were quantitatively determined using a high throughput turbidimetric protocol and the data were analyzed with an accessible analytic tool “PHIDA”. Using this tool, the host ranges of 9 Listeria, 14 Salmonella, and 20 Pseudomonas phages isolated with different enrichment methods were quantitatively compared. A high variability in the host range index (HRi) ranging from 0.86–0.63, 0.07–0.24, and 0.00–0.67 for Listeria, Salmonella, and Pseudomonas phages, respectively, was observed. Overall, no direct correlation was found between the phage host range breadth and the enrichment method in any of the three target bacterial genera. The high throughput method and analytics tool developed in this study can be easily adapted to any phage study and can provide a consensus for phage host range determination.

1. Introduction

Bacteriophages (phages) are viruses that specifically infect bacteria [1]. With an approximate number of 1031 particles, phages are thought to be the most abundant biological entities on Earth [2]. Due to their ability to lyse their bacterial hosts, lytic phages have been applied in a wide variety of scenarios to combat bacterial pathogens, including therapy (as therapeutic and prophylactic) [3,4], biocontrol, sanitation, preservation [5], detection [6], and remediation [7].
The host range of a phage is usually understood as the breadth of bacteria (strains, species or genera) that it can infect [8]. Although this is a straightforward concept, different techniques for determining the host range can produce divergent results, leading to the suggestion that host range can be defined according to the technique used to assess it [8]. Compared to conventional antimicrobials, phages are specific in their bactericidal activity and capable of infecting hosts generally at a strain, species, or in some cases genus level, leaving non-targeted bacteria unharmed [5,9]. This specificity is driven by different factors such as phage-encoded receptor binding proteins, phage–host interactions during infection, phage-resistance mechanisms, and the presence of related prophages or plasmids [8,10,11,12]. Generally, the selection of a phage with broad or narrow host range during isolation depends on the application. For example, broad host range phages are more desirable for therapeutic and biocontrol applications since multiple strains, serovars, or isolates of the target pathogen(s) are often involved in infections or food contamination [13,14,15,16]. Conversely, broad host phages, especially those capable of infecting multiple genera, could affect beneficial microbiota during therapeutic and biocontrol applications [15]. On the other hand, narrow host range and highly specific phages that bind and infect certain bacterial species are useful for the development of specific and sensitive biosensors for pathogenic or indicator bacteria in clinical, veterinary, and food scenarios [17,18,19]. Additionally, a narrow host range phage would also be more suitable for therapeutic applications when targeting a specific clinical bacterial strain [20].
Phage isolation methods are fairly simple and are traditionally performed using one-step enrichment of environmental samples with single or multiple bacterial targets grown under planktonic conditions before isolating individual plaques. These protocols can yield phages with both narrow and broad host range profiles [8,21,22]. More recently, the use of a sequential series of bacterial strains has been proposed as an alternative phage enrichment strategy to boost the likelihood of isolating broad host range phage strains [23]. Although these approaches are useful for phage isolation, no relationship between the enrichment method and the phage host range has been reported. Thus, the process of isolating phage strains with a desired host range remains challenging, requiring intensive labor and an element of chance.
Additionally, there are different reported protocols to determine phage host range, such as spot testing, the efficiency of plaquing (EOP), and liquid culture-based assay [22,24,25]. Among these, spot testing is one of the most reported host range determination techniques [16,25]. It is easy to perform as it requires only a small volume of phage suspension to be spotted on a bacterial lawn, and produces a straightforward binary result of lysis versus no lysis [8]. Although simple, differences in the clarity of the lytic zones can lead to subjective results regarding the killing efficacy of the phage. Furthermore, this method has been shown to overestimate the host range when compared to other methods, such as EOP [25]. Additionally, since this method relies on applying high phage titer, it does not distinguish between productive infection (phage replication) and lysis due to other mechanisms such as abortive infection and lysis from without [26]. On the other hand, the EOP method consists of spotting serially-diluted phage suspensions onto a bacterial lawn to measure the titer of phage progeny of a particular phage infecting a bacterial strain. Then, the EOP is calculated based on the titer observed in the most susceptible strain (EOP = 1) [25]. This method is considered the ‘gold standard’ approach for phage host range determination, despite being time consuming and labor intensive. Furthermore, it does not reflect the lytic activity of a phage in liquid culture. For example, phages showing high EOP may not exhibit similarly strong lytic activity against bacteria grown under planktonic conditions (e.g., slowly adsorbing phages) [25,27,28,29]. Comparatively, liquid culture-based host range assay is a real-time measurement of culture optical density (OD) in the presence of phage at a given multiplicity of infection (MOI) and it is useful to determine the phage virulence, host range, and development of phage resistance [26]. This assay provides information on the bacterial growth kinetics in the presence of phage and allows to associate quantitative values to the virulence and host range of phages [30].
In this study, we compared three different enrichment methods; (1) single strain (SS), (2) cocktail of strains (CE), and (3) cyclic sequential (CS) (Figure 1) to isolate phages against three genera: (1) Listeria spp., (2) Salmonella spp., and (3) Pseudomonas spp., and evaluated the host range profiles of the isolated phages using a high throughput turbidimetric approach that allows for quantitative screening of the effect of phage on the growth of multiple bacterial strains. Additionally, the host range data was analyzed using a rapid and sensitive data analytics tool, PHIDA (http://mahmouel.dev.fast.sheridanc.on.ca/Index_files/downloads.html), and a numerical value (host range index) was assigned to each individual phage to compare the enrichment methods. This method is highly scalable and can be adapted to accommodate multiple phages and bacterial hosts in a single experiment.

2. Materials and Methods

2.1. Bacterial Strains and Growth Conditions

Bacterial strains used for phage isolation and host range determination are listed in Table S1. All strains were stored at −80 °C in 25% (v/v) glycerol. Salmonella and Pseudomonas strains were streaked out on tryptic soy agar (TSB, DifcoTM, BD, USA) and incubated overnight at 37 °C. Salmonella and environmental Pseudomonas strains were grown by inoculating a single colony in tryptic soy broth (TSB, DifcoTM, BD, USA) and incubated overnight at 37 °C for further use. Listeria and clinical Pseudomonas strains were cultivated on brain heart infusion agar (BHIA) at 37 °C to obtain single colonies. Individual colonies were inoculated into BHI broth and incubated overnight at 37 °C. Calcium and Magnesium (CM) buffer (0.735 g/L CaCl2·2H2O: 2.5 g/L MgSO4·7H2O; 0.05 g/L gelatin; 6 mL/L 1M Tris buffer; pH 7.2 buffer) was used for phage propagation and dilutions.

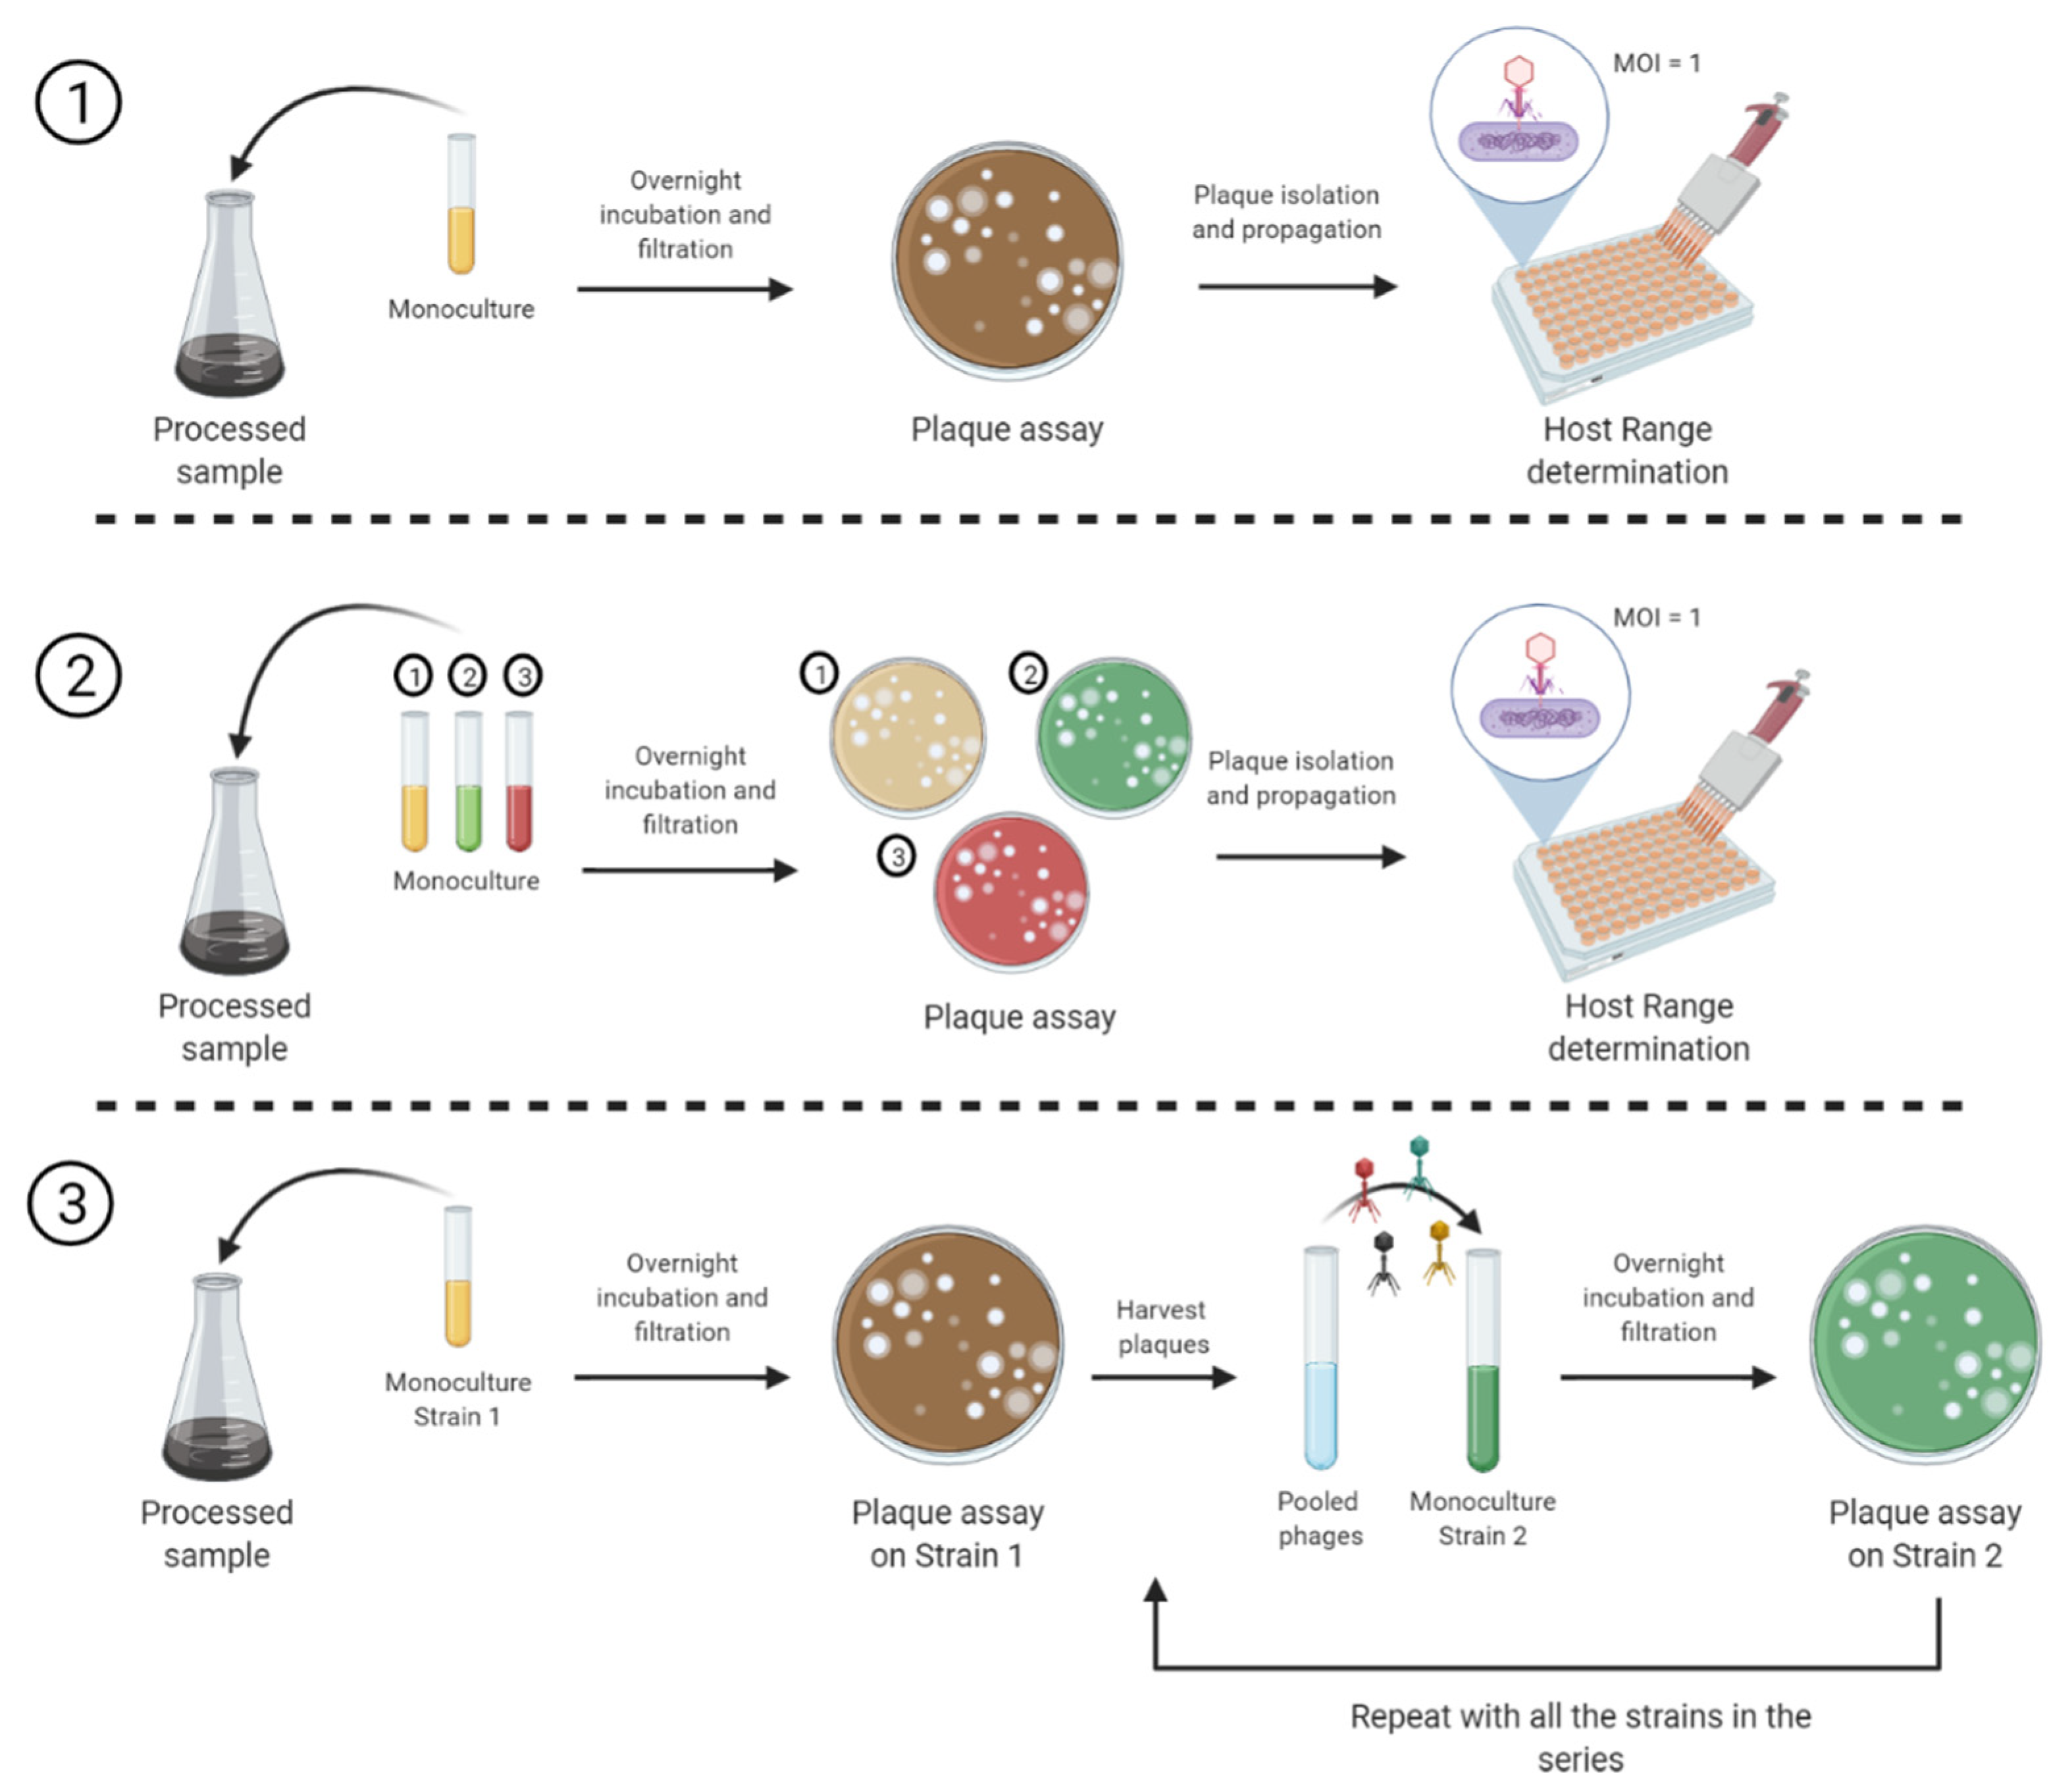
2.2. Sample Enrichment for Phage Isolation

Wastewater was collected from the Waterloo wastewater treatment plant (Waterloo, Ontario, Canada). For phage isolation from wastewater, samples were processed by incubating the primary sludge with 5 mM tetrasodium pyrophosphate (Na4P2O7·10H2O) for 15 min at room temperature to free viral particles from the sediment, as previously described [32]. The sample was then centrifuged at 5000× g at 4 °C for 20 min and filtered through a 0.22-μm sterile syringe filter (Thermo Fisher Scientific, Mississauga, Canada), the filtrate was stored at 4 °C for further enrichment. The last two steps were omitted for samples collected from food processing facilities. For isolation of Listeria phages, run-off water samples from food processing facilities were mixed with 4× concentrated Listeria Special Broth (LSB, Bio-Rad®, Hercules, CA, USA) to a final concentration of 1× to inhibit the growth of competitor bacteria present in the sample and incubated at 30 °C with moderate agitation for 24 h. Listex P100TM was provided to us by Micreos and was included in this work as a reference phage.
All samples were enriched independently by three protocols as described in Figure 1. Briefly, for (1) Single strain (SS): processed sample was enriched with an overnight monoculture and incubated overnight. The mixture was then centrifuged, filtered through a 0.22-μm sterile syringe filter, and the presence of phage was verified by plaque assay on the same host used for enrichment. (2) Cocktail enrichment (CE): processed sample was enriched with equal ratios of overnight monocultures (cocktail) and incubated overnight. The mixture was then centrifuged, filtered through a 0.22-μm sterile syringe filter, and the presence of phage was verified by plaque assay on every host used for the enrichment. (3) Cyclic sequential (CS) was performed as previously described (Yu et al. 2016) with some modifications. Briefly, the processed sample was enriched with an overnight monoculture of the first host in the series and incubated overnight. The mixture was then centrifuged, filtered through a 0.22-μm sterile syringe filter, and the presence of phage was verified by plaque assay on the first host. Clear plaques were harvested using a sterile micropipette tip and resuspended in 300 μL of CM buffer. Harvested phages were propagated using the soft agar overlay method, as previously described [33]. Presence of phage was verified by plaque assay on the second host. The same process is repeated with all the hosts in the series. The sequence of strains is shown in Table S2. After every enrichment method, clear plaques usually indicative of lytic phages—were harvested, purified, and propagated for host range determination [34,35]. The enrichment methods used for isolating the phages presented in this study are summarized in Table S2.

2.3. Host Range Pattern Determination

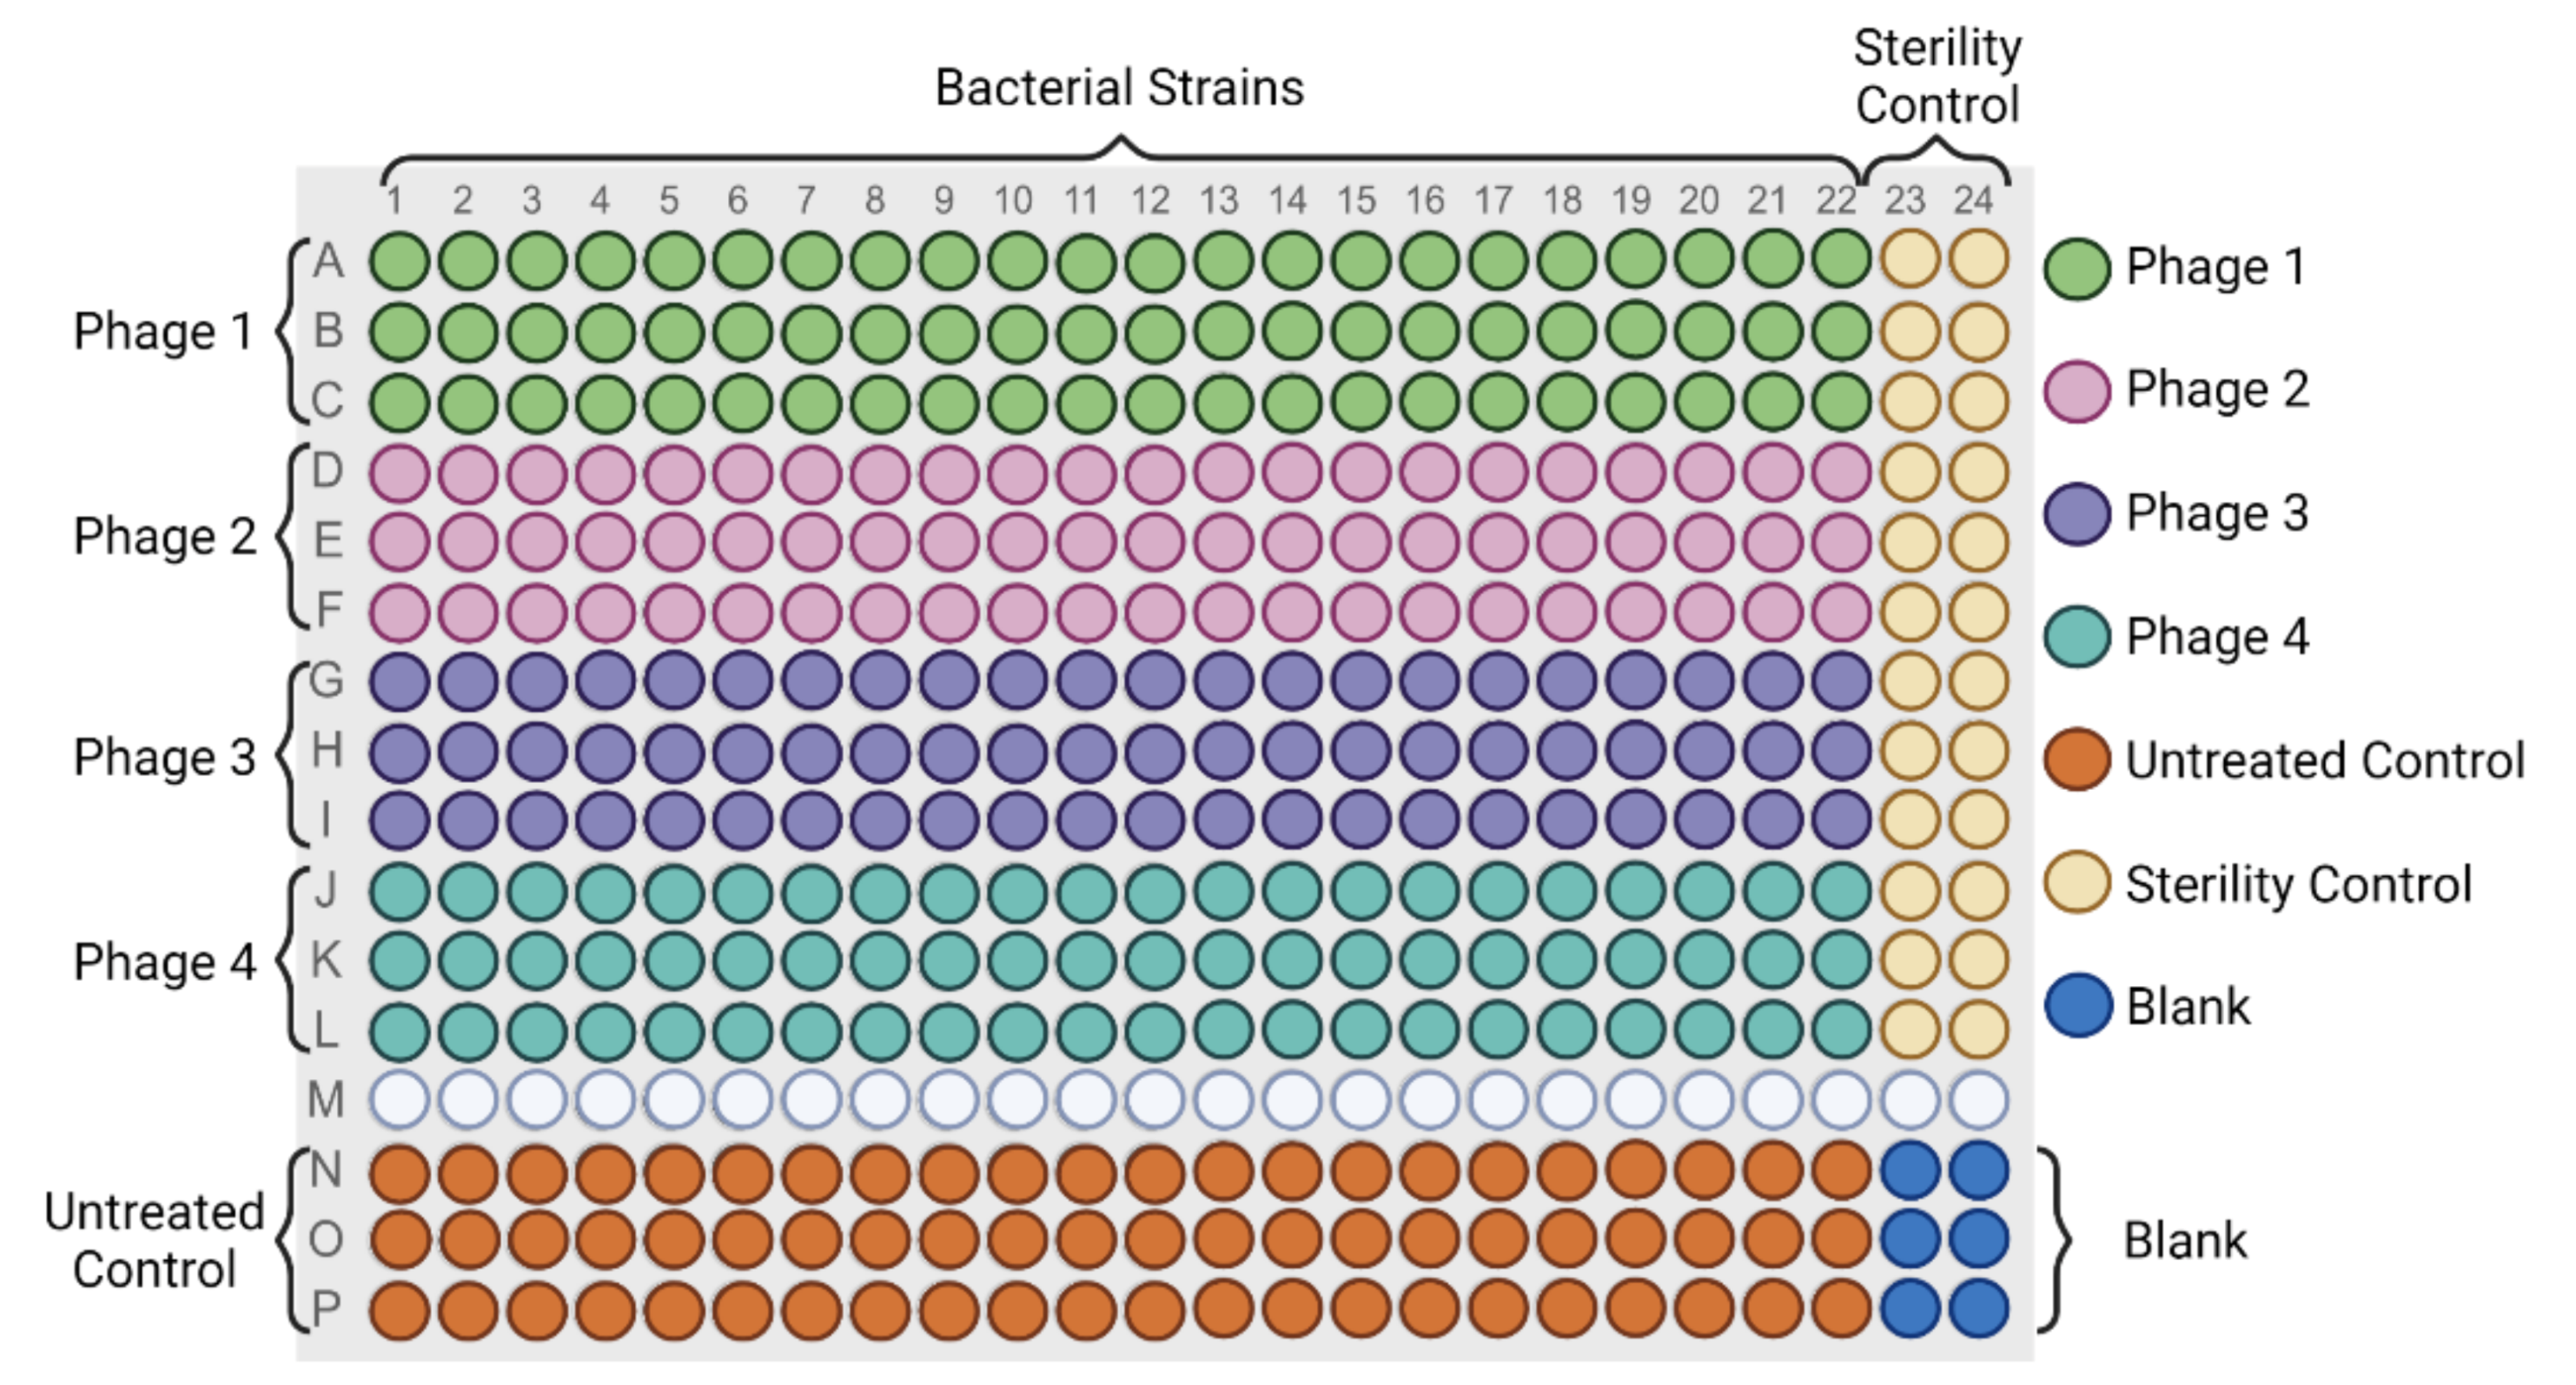
2.3.1. High Throughput Host Range Characterization in Liquid Culture

Host range of the isolated phages was determined using a high throughput turbidimetric assay in a 384-well plate (Corning, Corning, NY, USA) format (Figure 2). This method allows to test up to four phages against 22 bacterial strains with technical triplicates in a single assay. Phages were titrated and diluted to a final concentration of 7 log10 PFU/mL in CM phage buffer. Overnight cultures of all strains (Table S1) were diluted in 2 X TSB for Salmonella and environmental Pseudomonas isolates and 2 X BHI for Listeria and Pseudomonas clinical isolates to a final concentration of 7 log10 CFU/mL. Bacteria were mixed with phage in a total volume of 100 µL (50 µL of bacteria dilution + 50 µL of phage dilution) to a final theoretical Multiplicity Of Infection (MOI) of 1 (7 log10 PFU/mL /7 log10 CFU/mL). The plate was incubated at 25 °C for 24 h for Salmonella and Pseudomonas and 40 h for Listeria with continuous double orbital slow agitation using a BioTek Synergy H1 Hybrid Multi-Mode Reader (Winooski, VT, USA). Readings at 600-nm wavelength were taken at 30-min intervals.

2.3.2. PHIDA: Data Analytics Tool for Efficient Host Range Determination

Growth curves were analyzed through calculating the time difference between phage treated bacteria cells and untreated control to reach a detection threshold (OD600 = 0.2) that represents an early stage of the exponential growth phase of target bacterial strains. Host range was reported according to the growth inhibition efficiency of the phage against a specific host: C = complete growth inhibition, D+ = delay of ≥5 h to reach threshold, and D = delay of growth of <5 h, and N/L, N/L+, or N/L++ according to the endpoint OD600 value (Figure 3). The manual detection of these patterns in the data collected from the experiment is time consuming and less accurate. A simple data analytics tool—Phage–host Interaction Data Analyzer (PHIDA)—has been developed to automate the process. The tool facilitates visualizing and cleaning the data, automates identifying replicates that meet a pre-determined OD growth trend, detects the host-range pattern of each replicate automatically, and creates a final report that shows the patterns detected, the average OD, the maximum OD, and the detection time of each sample. The tool was developed using Microsoft Excel because of its ease of use and accessibility features in addition to its powerful analysis/visualization built-in functions. The tool allows researchers to set a group of parameter values for meeting the requirements of various host range experiments. The compatibility of the spread sheets with most analytics software platforms facilitates further analysis and building better host range models through the integration with other software packages.

2.3.3. Implementation of the Data Analytics Tool

The data analytics tool, PHIDA, was implemented using combinations of statistical, lookup, and reference functions of Microsoft Excel in two spreadsheets to determine the effect of phage treatment on bacterial growth in liquid culture. The first sheet is titled data analyzer and outlier detector. This sheet allocates the first nine rows for entering the experiment information, including the experiment parameter values such as the starting time of the experiment, the minimum growth rate, and the interval time in minutes between consecutive readings. The following seven rows are allocated to formulas that calculate the average growth rate of the last three growth rate readings per each sample in the experiment, identify the detection time, detect the growth trend, and classify each sample into a specific designation. The built-in Excel functions that have been used for completing these calculation and analytics tasks include Slope, Indirect, Address, Index, Match, Column, and If. The remaining rows contain the growth rate readings of all samples. The second sheet generates a report based on the data and parameters entered into the first sheet. PHIDA can be easily adapted for other phage–host interaction experiments by reconfiguring the parameter values as needed. The PHIDA tool and a short user’s guide are available at http://mahmouel.dev.fast.sheridanc.on.ca/Index_files/downloads.html. Researchers can download and use the tool for their experiments.

2.3.4. Definition of the Host Range Index

A set of host range measures and metrics were defined and formulated based on bacterial growth inhibition times to quantify the host range of any given phage using a new metric named Host Range index and denoted by HRi. The first measure is the maximum inhibition time (Tmax). Tmax is the duration of the experiment (24 h for Pseudomonas and Salmonella spp., 40 h for Listeria spp.) minus the time required to reach the detection threshold (OD600 = 0.2) of the untreated control. The second measure is the normalized value of Tmax and named maximum inhibition score (Imax). The maximum theoretical host range score (HRmax) is defined as the number of strains tested for the host range (The HRmax for this work is 22). Using these measures, an inhibition score (Is) of a phage against a specific bacterial strain can be defined as the quotient of dividing the actual inhibition time (Tactual) by Tmax:
I s   25   ° C ,   24   or   40   h ,   T S B   or   B H I = T a c t u a l T m a x
Thus, the host range index (HRi) of a phage is defined as the summation of the phage’s inhibition scores against the panel of bacterial strains divided by HRmax:
H R i   25   ° C ,   24   or   40   h ,   T S B   or   B H I = I s H R m a x
The HRi can be used to facilitate the quantitative comparison of the host range of different phages against the same panel of strains treated in the same conditions. Figure S2 shows an example of these calculations.

3. Results

3.1. Development of The High Throughput Host Range Assay and PHIDA

A high throughput turbidimetric host range determination assay in liquid culture was developed. This assay was performed in a 384-well plate format that allows to test the growth inhibition effect of four different phages against 22 bacterial strains including technical triplicates in a single assay (Figure 2). Bacterial cultures (7 log10 CFU/mL) were treated with the phage (7 log10 PFU/mL) at a theoretical MOIinput of 1. The assay was carried out at 25 °C for 24 h for Salmonella and Pseudomonas, and 40 h for Listeria to achieve consistent optical density results for all tested strains. Using this assay different growth kinetics and inhibition patterns were observed across all tested bacterial strains and phages. The real-time measurements of the growth kinetics provided data to quantitatively designate the growth inhibition efficacy of a phage against a single bacterial host as well as an overall host range for all strains in the test panel (Figure 4, Figure 5, Figure 6 and Figure 7, Tables S3–S6). Moreover, phage–host interactions can be predicted. For instance, in phages with a designation of D or D+, where the bacterial growth is halted for a certain period of time and normal growth is observed thereafter, selection for phage resistant mutants might be the case.
A freely available Microsoft-Excel-based tool called “PHIDA” was developed to rapidly analyze the obtained OD data. The tool is programmed using combinations of statistical, modelling, lookup, and reference functions of Microsoft Excel to determine the effect of phage treatment on bacterial growth in liquid culture. PHIDA allows the user to enter the data, set the experiment parameters, and update the analysis results automatically after each change in the experiment data or the experiment settings. PHIDA analyzes the experiment data to identify outliers for cleaning the data, and automatically identifies replicates that meet a pre-determined OD growth trend that could be set as a parameter. More importantly, PHIDA automatically detects the host–range characterization of each replicate according to the Growth inhibition designations shown in Figure 3. A threshold of detection was designated as OD600 = 0.2 as it represents an early stage of the exponential growth in the bacterial strains tested. However, PHIDA allows to set different detection thresholds based on the bacterial strain tested. The tool also automatically generates a report displayed in an additional excel sheet to allow printing it or exporting the report for further analysis by other analysis tools. The correctness of the tool results was demonstrated by the exact match between the tool results and the pre-determined results by lab managers for the same replicates.

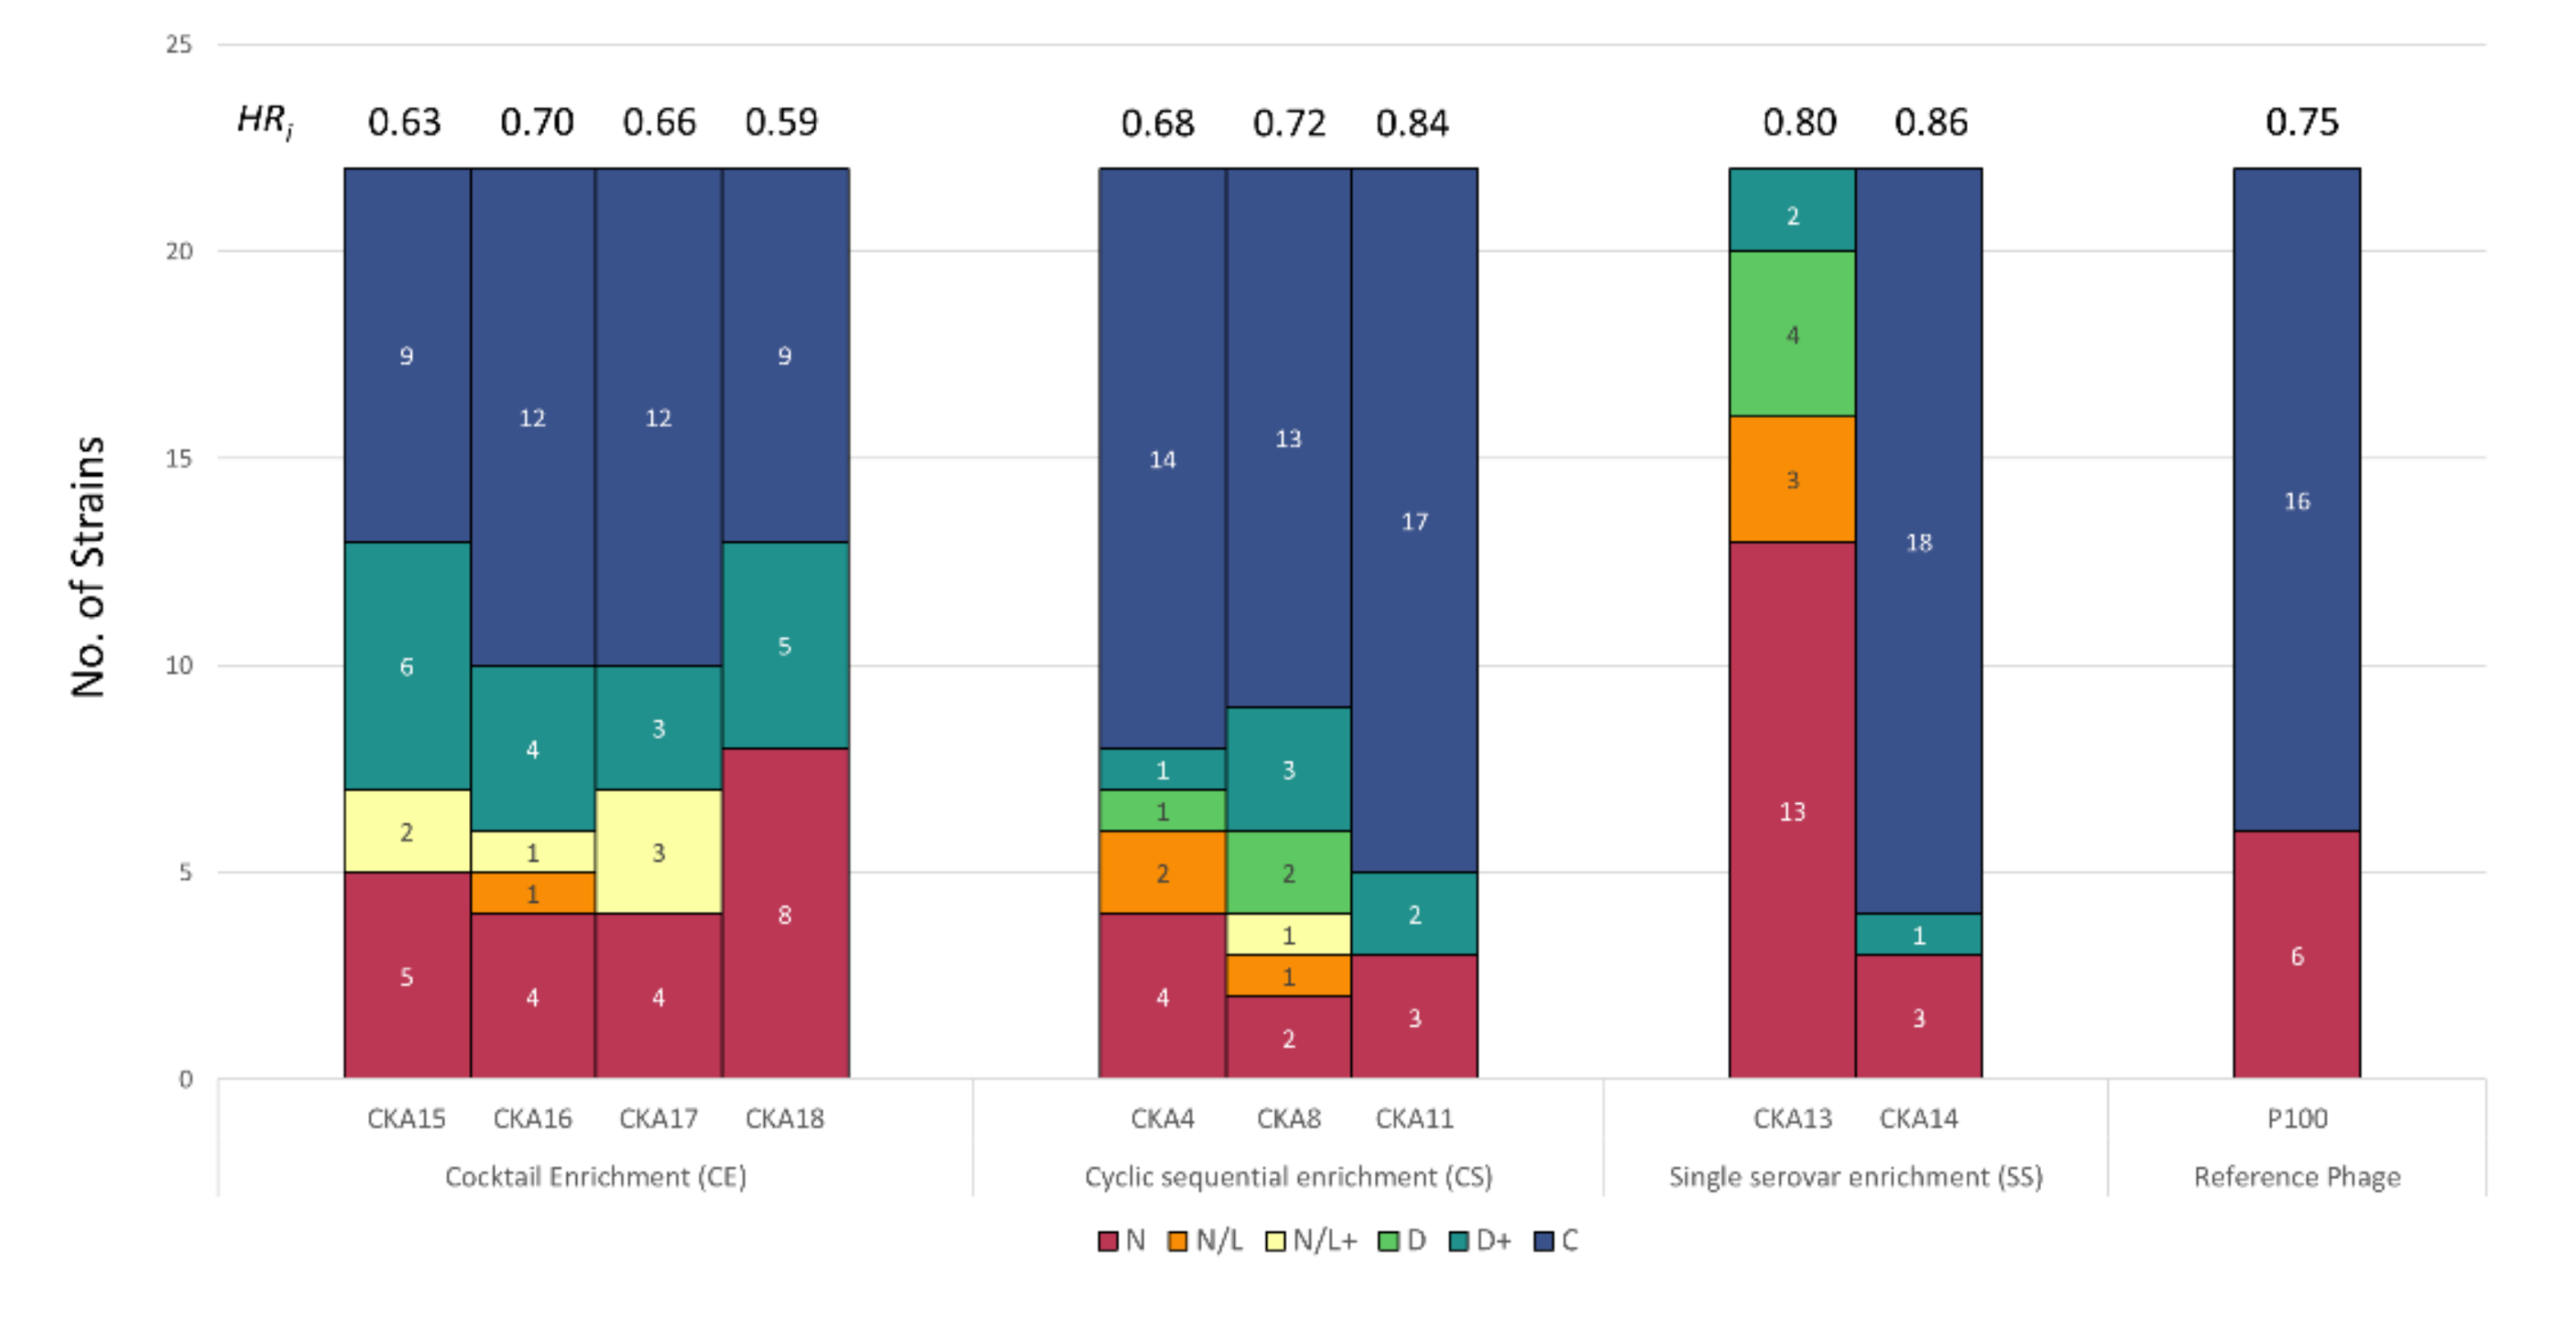
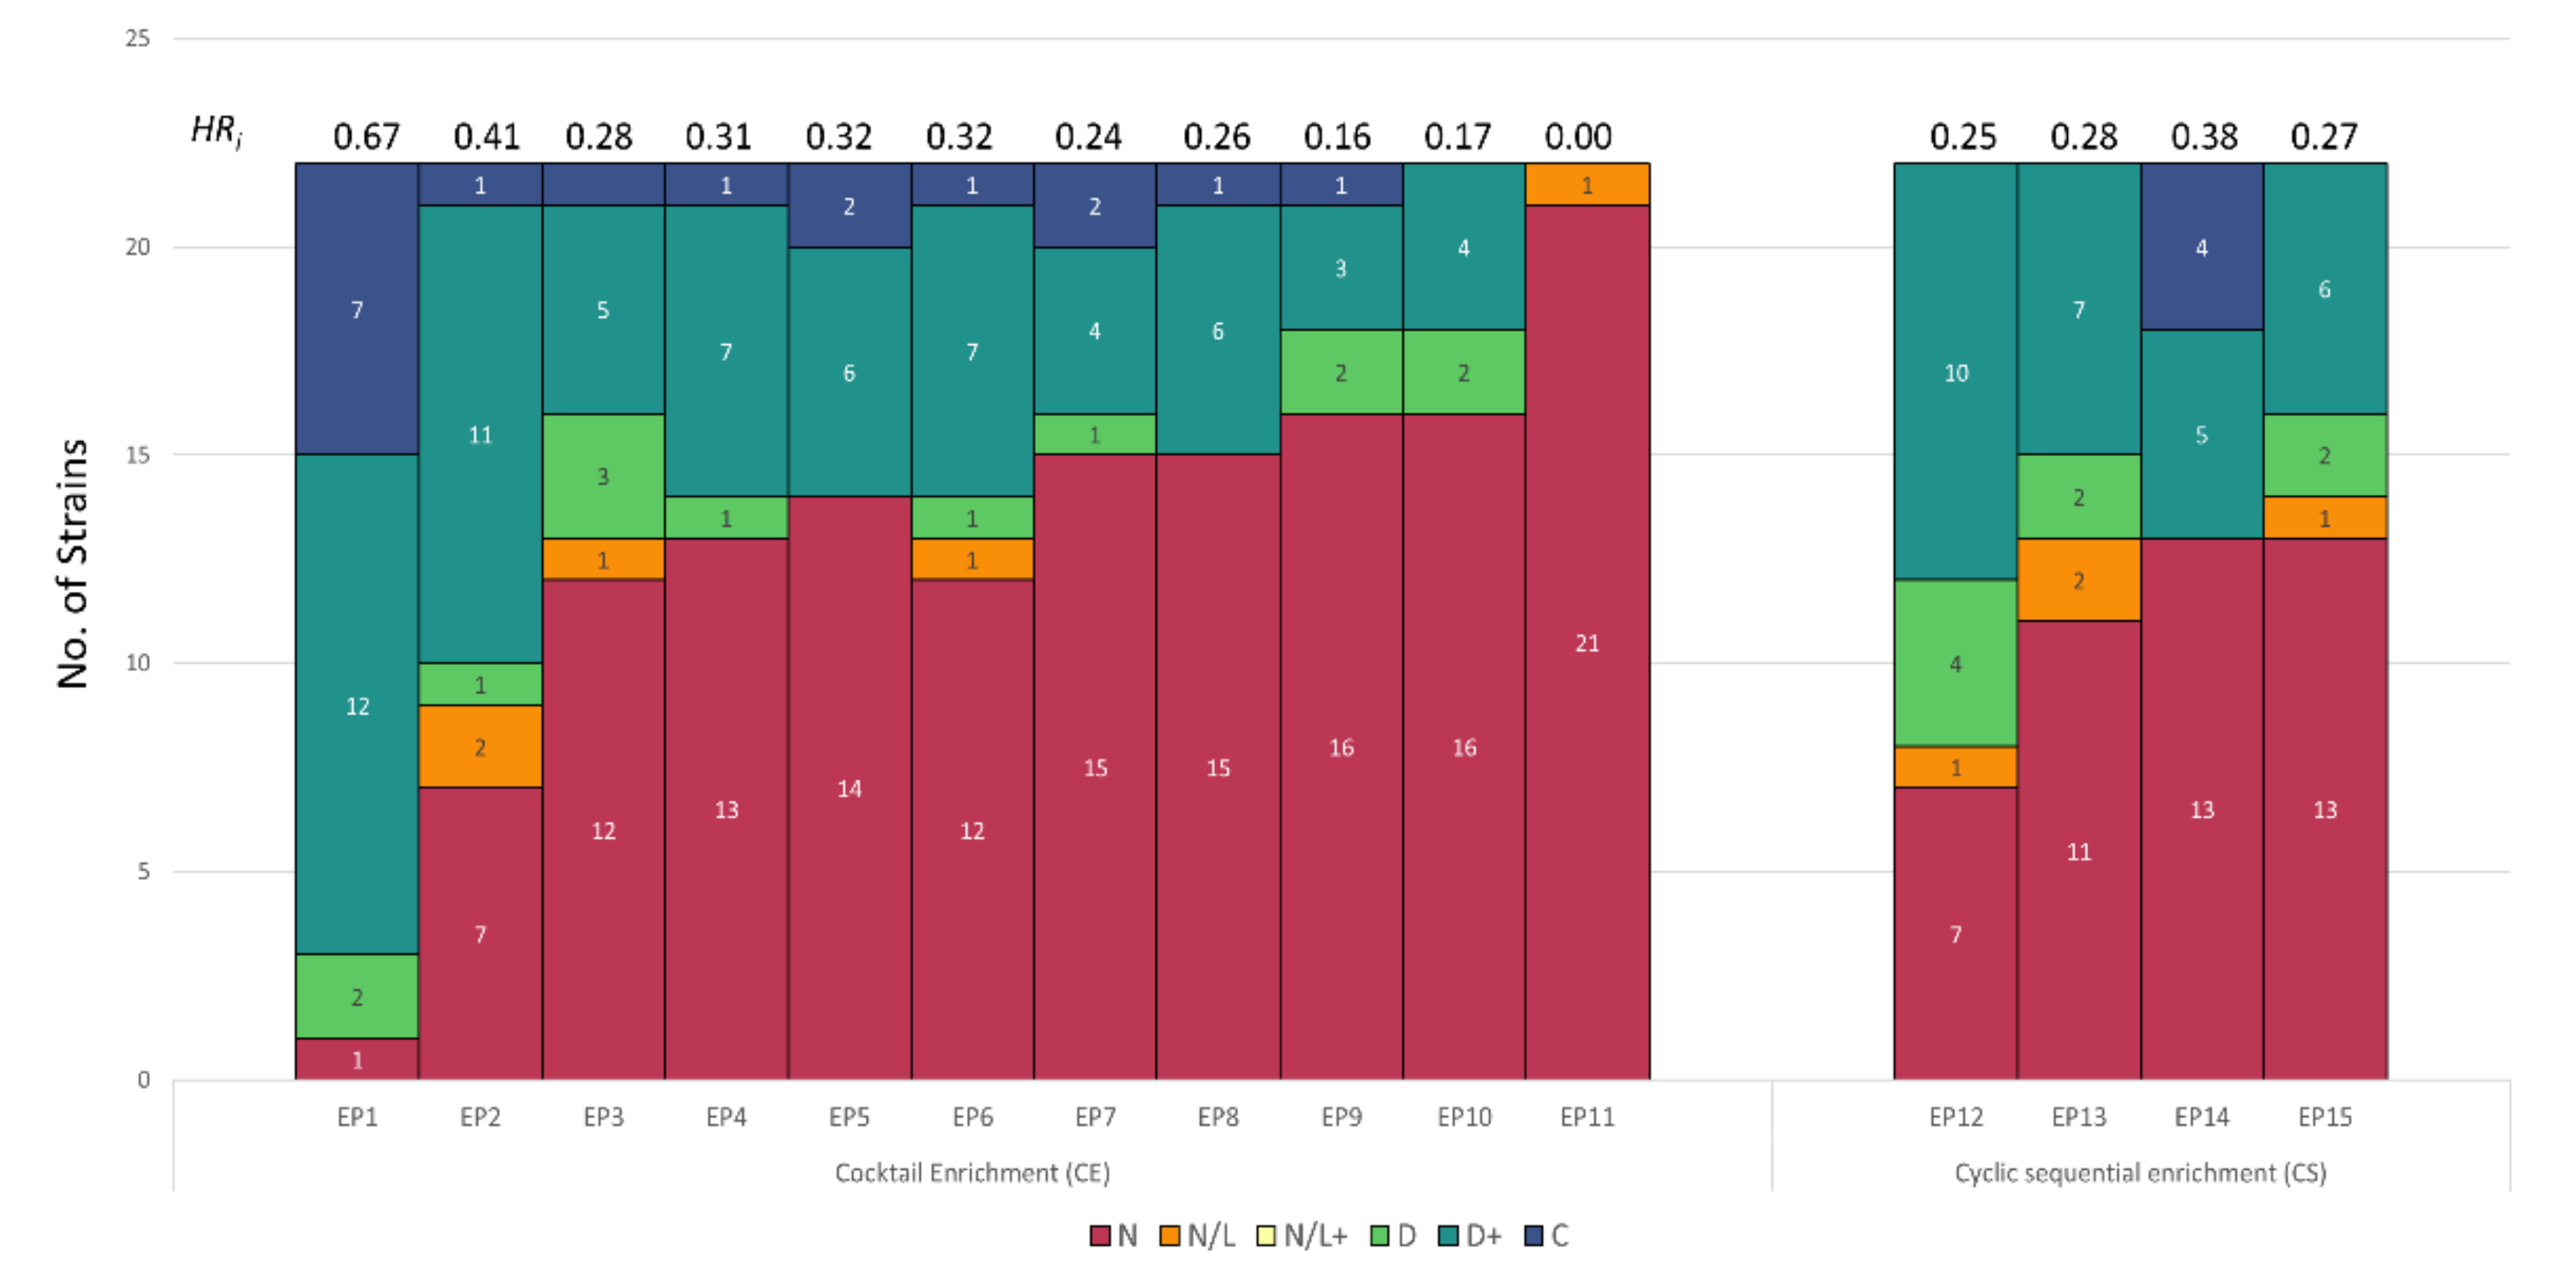
3.2. Host Range Pattern/Profile of the Isolated Listeria spp. Phages

Eighteen Listeria phage isolates were obtained from effluent from a meat processing facility and two different poultry plants using the enrichment approaches outlined in Figure 1. A plaque assay was performed by spotting 10 µL of phage suspension of these phage isolates (plus Listex P100™ phage included as a reference) on 19 strains of Listeria (Figure S1). Based on the plaque assay host range pattern and degree of lysis on different strains, it was found that at least 9 out of the 18 isolated phages represent unique isolates (Figure S1).
The nine selected phages in addition to the reference Listex P100™ phage were screened using the turbidimetric host range assay, as described above. The analyzed results are summarized in Figure 4 and Table S3. For the phages isolated by the CE method, two (CKA15 and CKA18) completely inhibited 41% of the tested Listeria strains and two (CKA16 and CKA17) completely inhibited 55% of them. Between 23–32% of the tested strains were unaffected by these phages and 23–32% were also delayed in growth. Between 59 and 77% of the tested strains were completely inhibited by the presence of phages isolated by the CS method, 9–23% were delayed, and 14–27% were unaffected. For the two phages isolated by single strain enrichment, CKA14 completely inhibited growth in 82% of the strains, delayed growth in 9%, and had no effect on 9%. The other phage isolated by this method (CKA13) delayed the growth of 32% of the tested strains and had no effect on 62% of them. Listex P100™ phage completely inhibited the growth of 73% and had no effect on 27% of the tested strains.
Based on the panel of strains screened, Listeria phages that had the highest HRi-values were CKA14 (SE method) and CKA11 (CS method), with scores of 0.86 and 0.84, respectively. Listex P100™ phage had the third highest HRi value of the tested Listeria phages with a score of 0.75. HRi values for this set of phages ranged from 0.08 to 0.86 (Figure 4 and Table S3).

3.3. Host Range Pattern/Profile of the Isolated Salmonella spp. Phages

A total of 14 Salmonella phages were enriched and isolated from wastewater using the methods depicted in Figure 1. Host ranges of the isolated Salmonella phages are summarized in Figure 5 and Table S4. Three phages with unique host range profiles named SP12, SP13, and SP14 were isolated using the SS method. These phages inhibited the growth of 50%, 23%, and 36% of the tested Salmonella serovars (n = 22), respectively. SP13 was the only phage that showed complete inhibition against 13% of the tested strains. Interestingly, four phages (SP1, SP2, SP3 and SP4) were isolated using the CE method and considered different phage strains based on their plaque morphology. However, these phages showed almost identical host range profile and delayed the growth of 50% of the same Salmonella serovars, suggesting the re-isolation of the same phage. On the other hand, seven phages (SP5, SP6, SP7, SP8, SP9, SP10 and SP11) were isolated using the CS method. SP5 and SP6 phage isolates had similar host range profiles and considered as reisolates of the same phage. The remaining five phages exhibited distinct host range profiles and inhibited the growth of 40–77% of the tested Salmonella serovars.
Based on the tested panel of Salmonella serovars, the HRi was calculated for all the isolated phages (Figure 5, Table S4). The HRi showed to be highly variable among all isolated phages (0.075–0.24) as well as in phages isolated with the same enrichment method ranging from 0.08–0.17 for SS, 0.13–0.14 for CE, and 0.075–0.24 for CS. SP5 and SP8 isolated with CS method exhibited the highest HRi, 0.24 and 0.21, respectively.

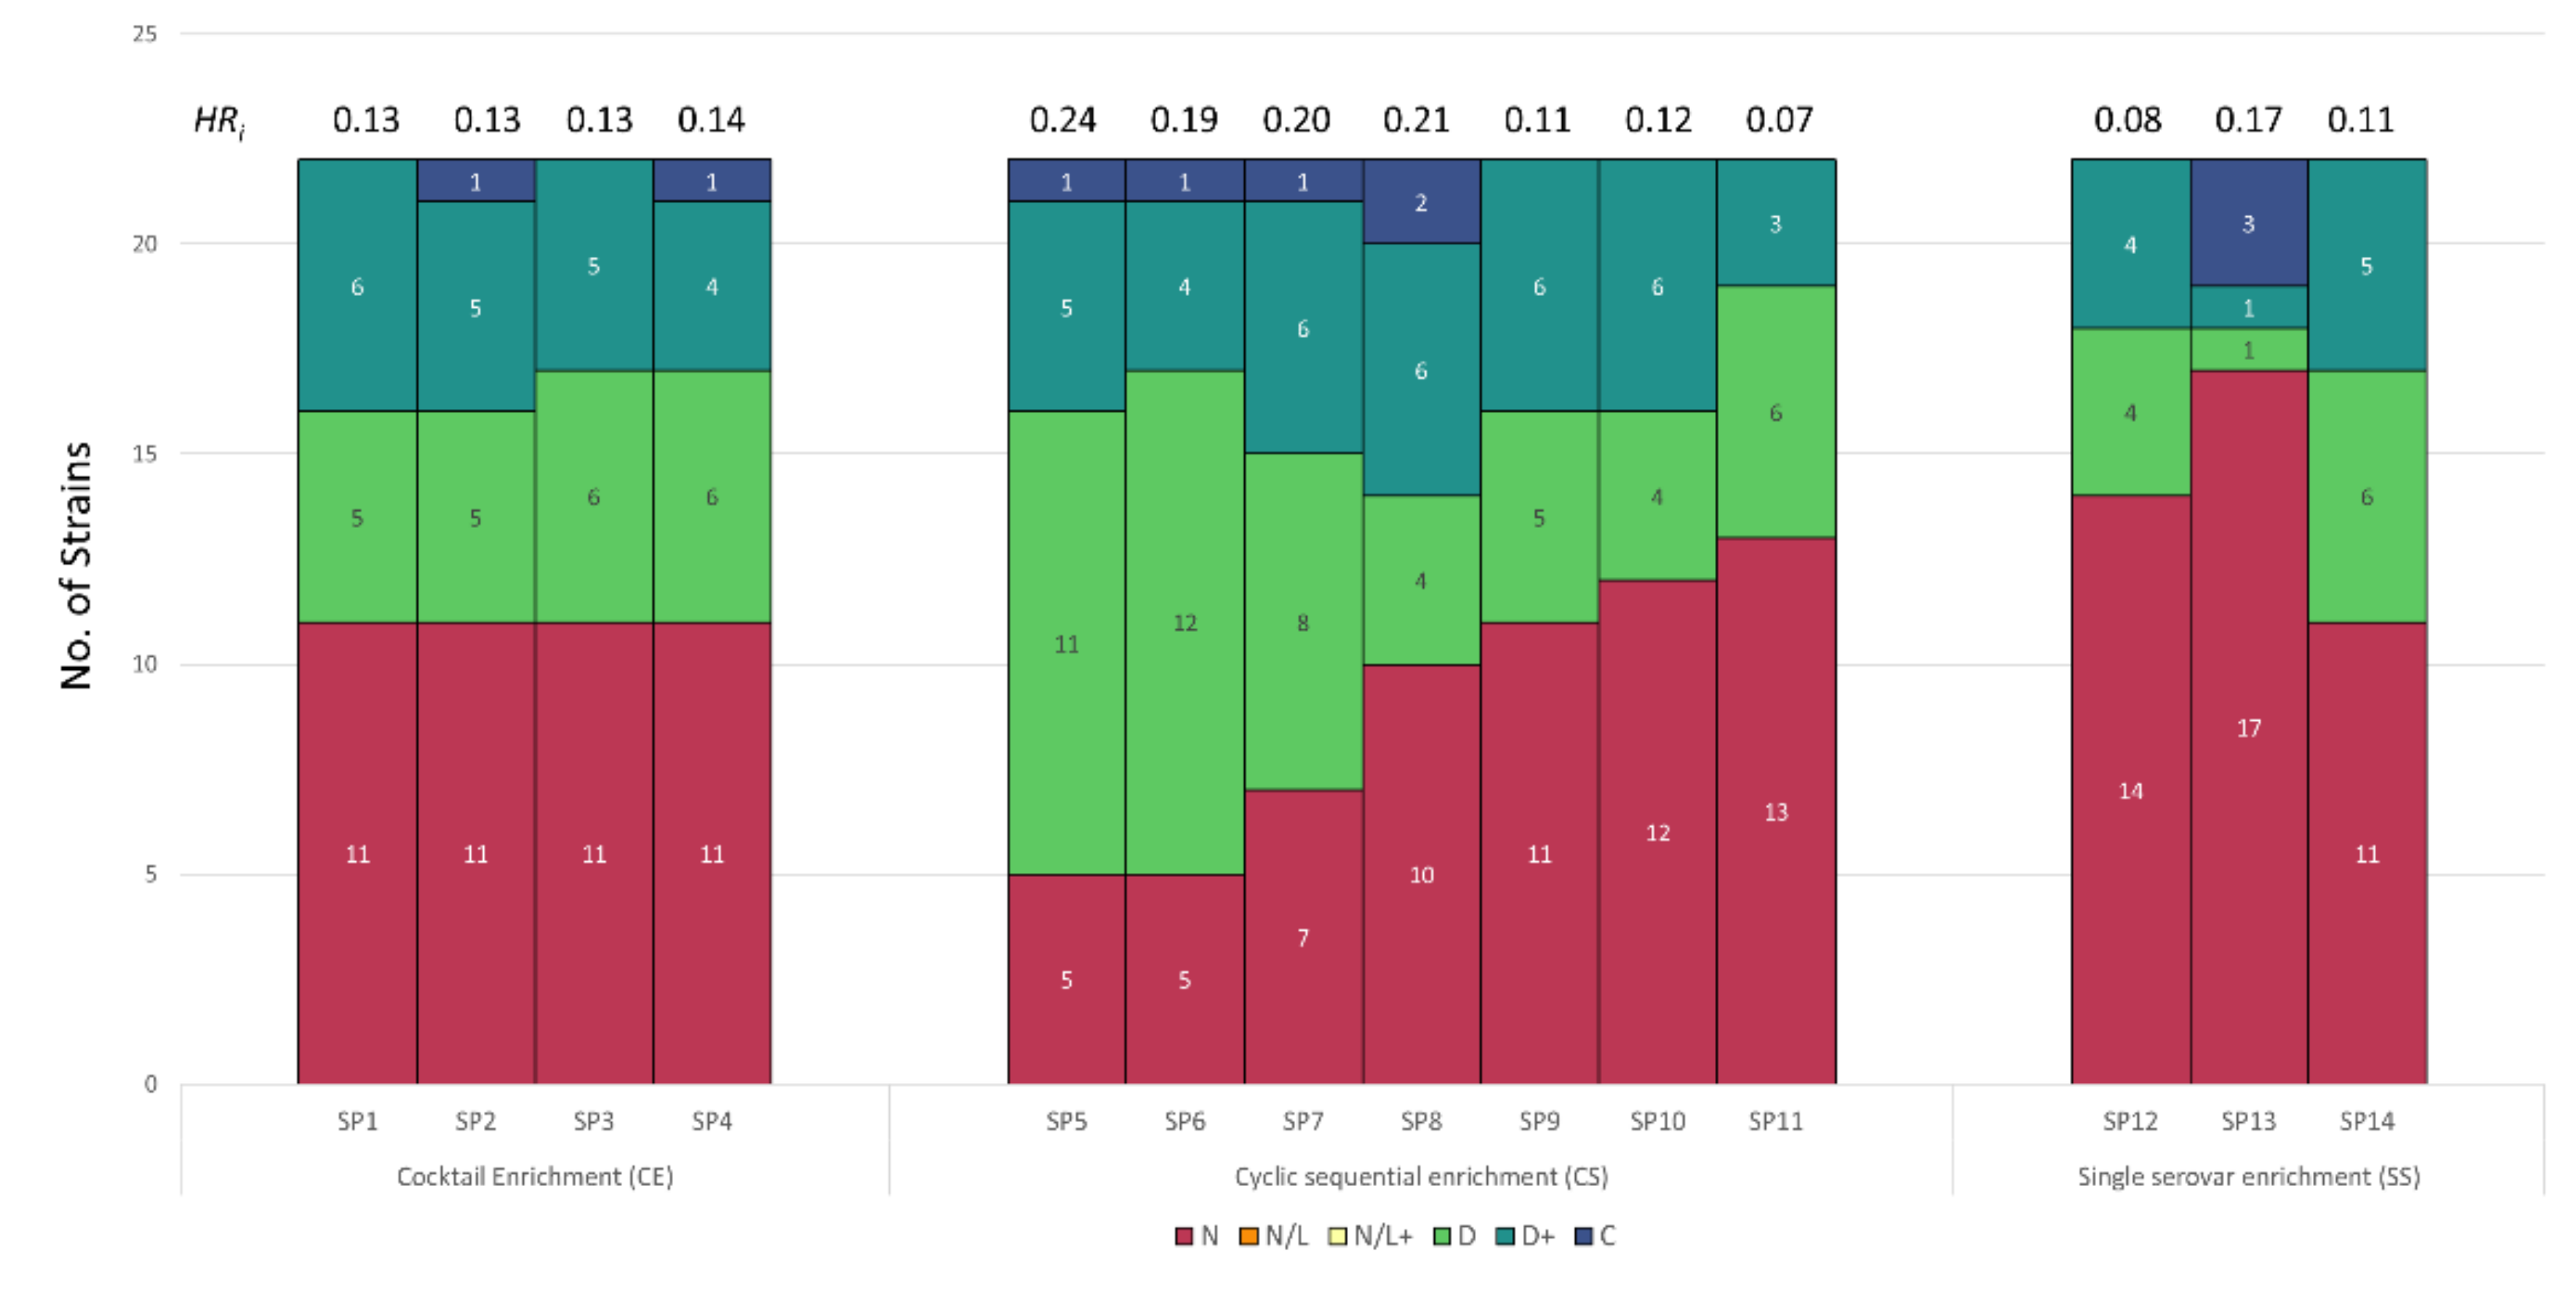
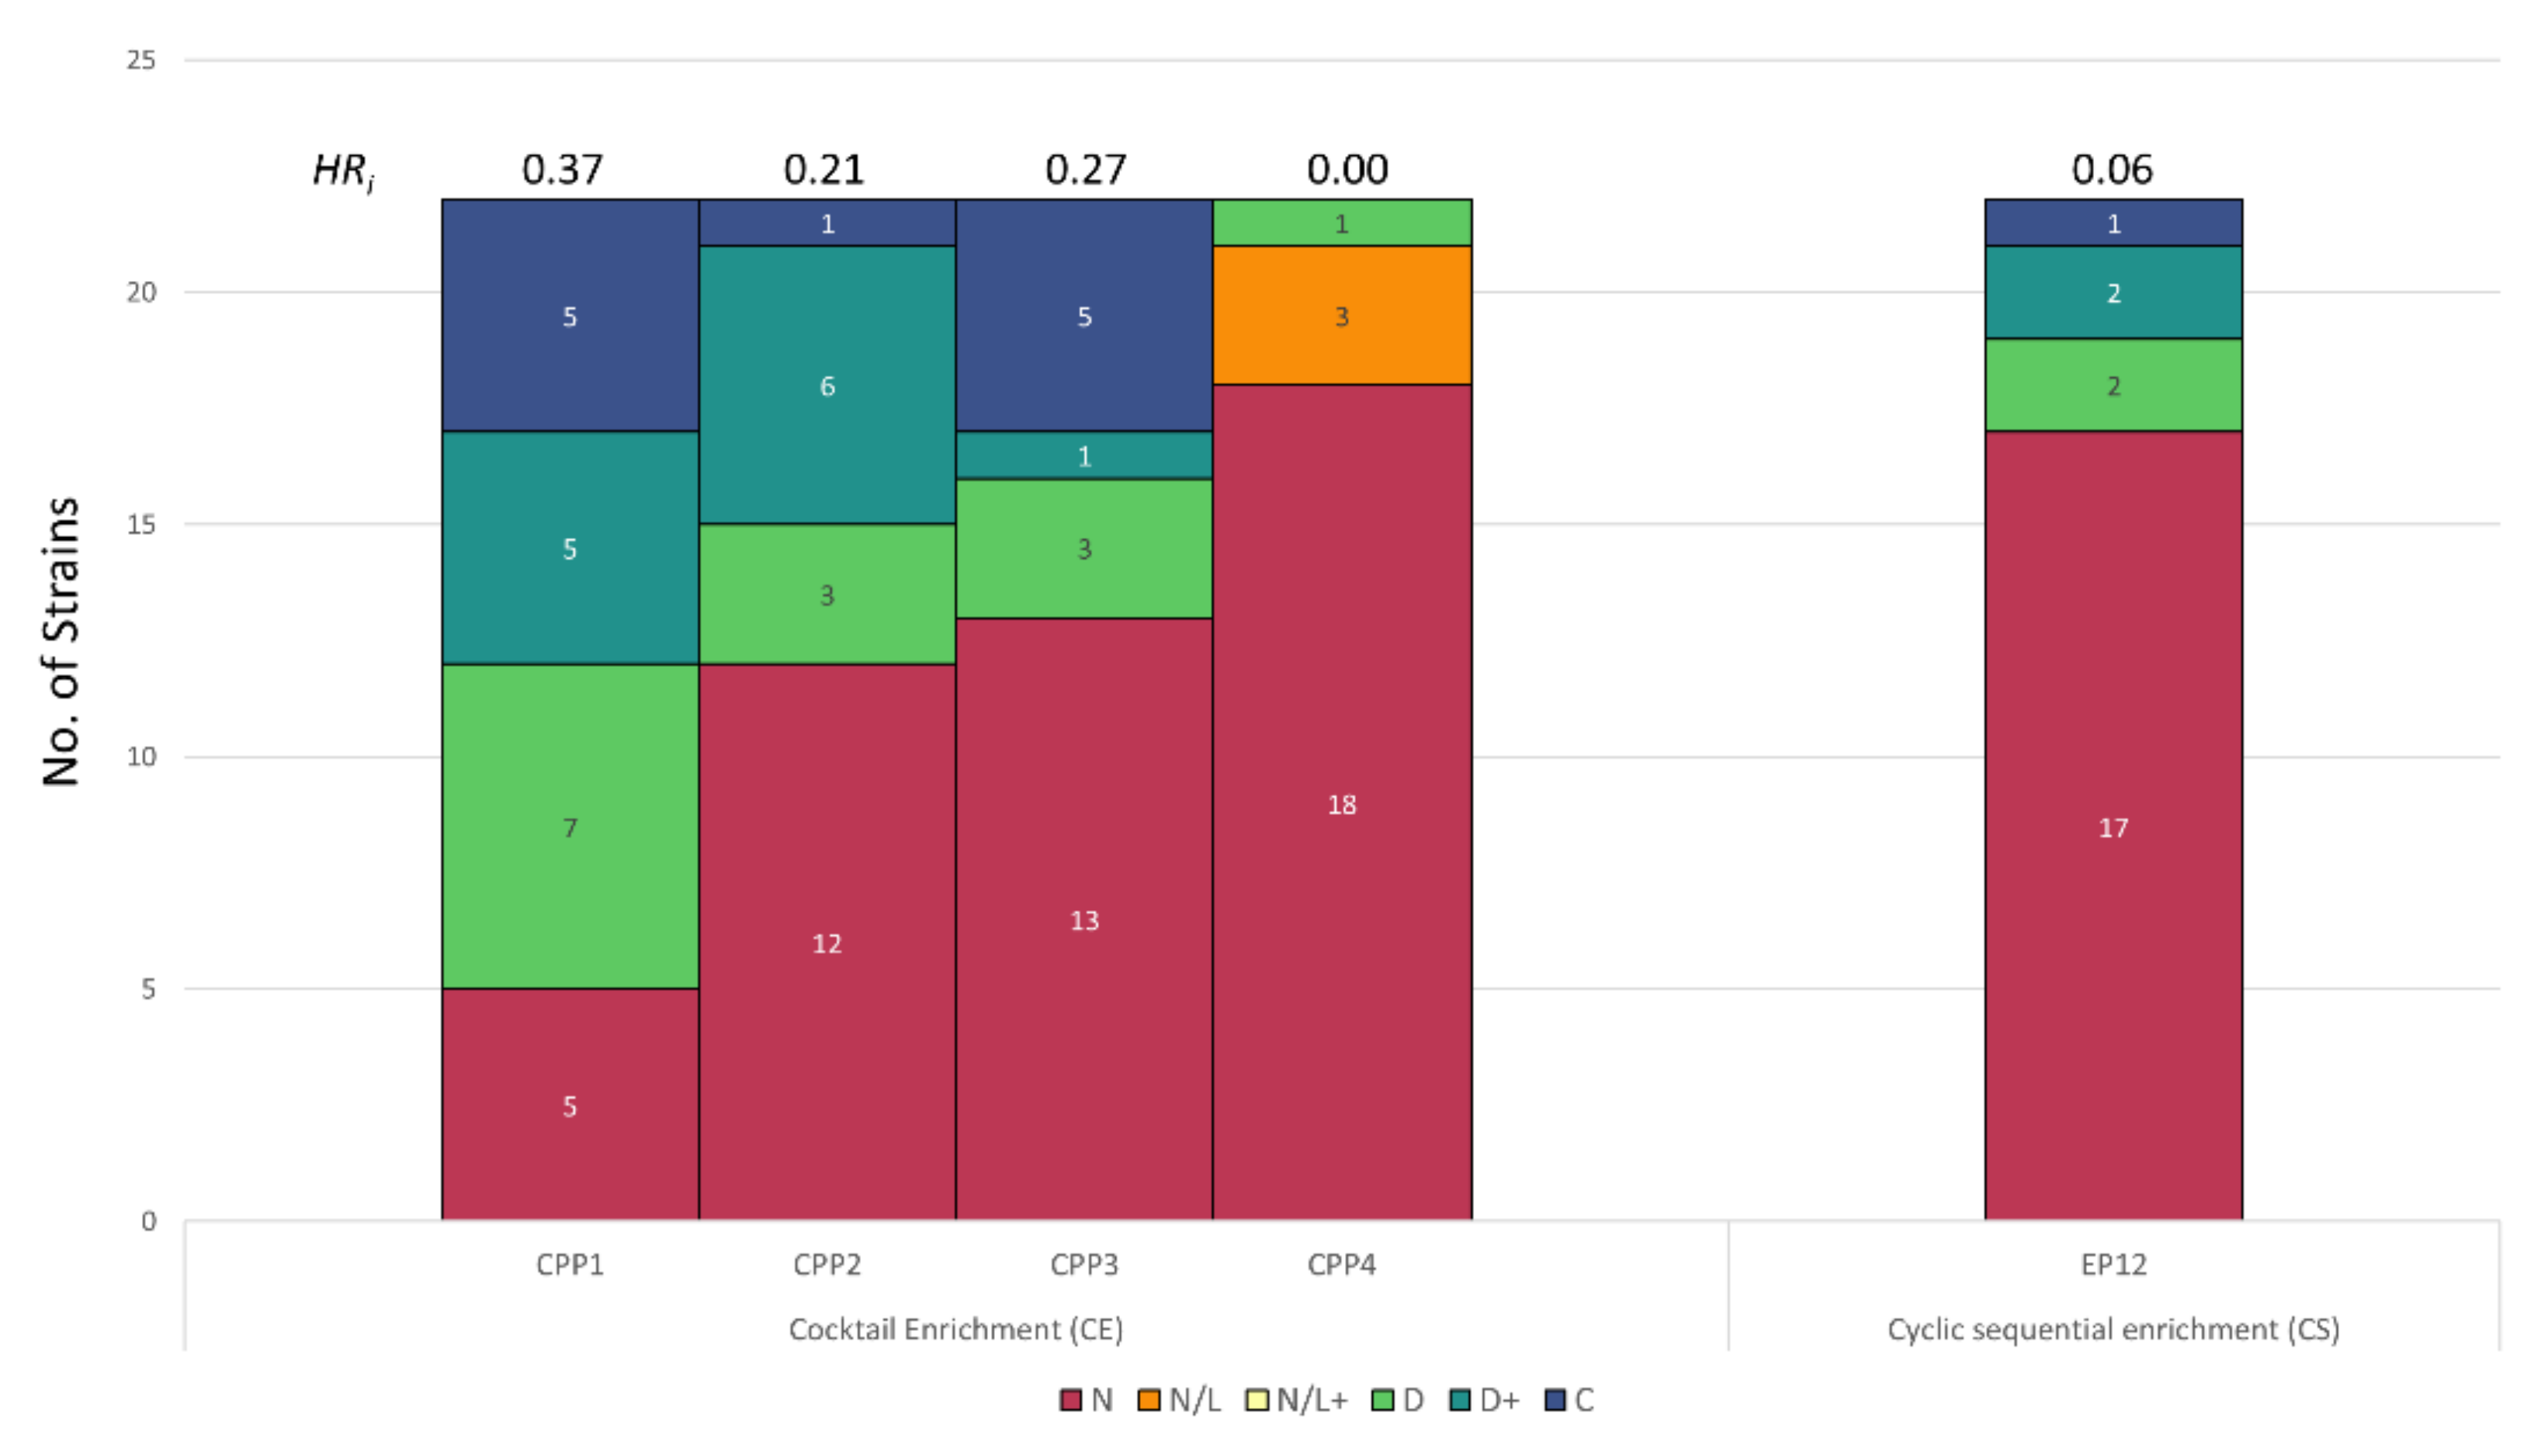
3.4. Host Range Pattern/Profile of the Isolated Pseudomonas spp. Phages

Two groups of environmental and clinical Pseudomonas spp. strains were used for enrichment and isolation of Pseudomonas phages from wastewater samples (Figure 6 and Figure 7). Phages infecting environmental isolates of Pseudomonas (EP) were isolated using CE and CS enrichment methods as depicted in Figure 1. Due to the complexity and difference in growth conditions between the Pseudomonas strains, CE was performed using two different cocktails described in Table S2. Phages infecting clinical isolates of Pseudomonas aeruginosa (CP), were isolated using the Liverpool epidemic strain-like (LES-like) isolates [36] (Table S2).
A total of 15 EP phages were isolated and characterized by host range against 21 Pseudomonas strains and one E. coli strain (Figure 6 and Table S5). Eleven phage isolates (EP1 to EP11) were isolated using the CE method. Phages EP1–3 and EP7–11 had unique host range profiles while EP4, EP5, and EP6 showed very similar host range profiles, suggesting re-isolations of the same phage. Phage EP1 showed a remarkably broad host range by inhibiting the growth of 95% of the tested strains including E. coli K-12. Conversely, phage EP11 showed a very narrow host range and did not inhibit the growth of any of the tested strains. Furthermore, four phages (EP12–15) were isolated using the CS enrichment method and had unique host range profiles (36, 50, 40, and 64%, respectively). Interestingly, re-isolations were not observed in the phage isolates isolated with this enrichment method. These phages inhibited the growth of 36 to 64% of the tested strains and EP12 phage had the broadest host range profile.
Contrary to the EP, only five phages were isolated using the CE and CS enrichment methods (Figure 7 and Table S6). Four phages (CP1, CP2, CP3, and CP4) with distinct host range profiles were isolated by the CE method. CE method resulted in the isolation of both broad (CP1, inhibiting 77% of the strains) and narrow (CP4, inhibiting 4% of the strains) host range phages. No re-isolated phages were detected for the clinical Pseudomonas isolates compared to the environmental. Interestingly, only one phage (CP5) was isolated using the CS method. This phage was able to infect 18% (4/22) of the strains tested.
HRi was calculated for EP and CP phages and is summarized in Figure 6 and Figure 7 and Tables S5 and S6. The HRi of EPs showed great variability ranging from 0.0011 to 0.67 when comparing all enrichment methods. Similar variability was observed in EP isolated with the same enrichment method ranging from 0.11–67.74 for CE, and 25.9–38.89 for CS. Among all EP phages, EP1 isolated with CE method showed the highest HRi of 67.74. Similarly, the HRi of CP ranged from 0.80 to 37.84 showing high variation. CP1 isolated with the CE method showed the highest HRi of 37.84.

4. Discussion

Phages are ubiquitous in the world with approximately 1031 particles [2]. The specificity of lytic phages to infect and kill bacteria has made them an appealing tool to combat pathogens [3,4,5,6,7]. There are numerous selection criteria for phages suitable for therapy and biocontrol application. Candidate phages should be obligately lytic, lack genes encoding toxins or antibiotic resistance mechanisms, have infection kinetics that favor efficient killing of their hosts, and be capable of killing a wide range of hosts [37]. In particular, the host range criterion is a crucial one to determine the proper application of the isolated phages. For instance, phages with broad spectrum against multiple strains or serotypes are desired for biocontrol applications [16,38,39]. Conversely, in other applications such as detection and diagnosis, phages with a narrow host range are more useful to distinguish between pathogenic and non-pathogenic serotypes or strains of bacteria [19,40].
In the literature, phages are often categorized as narrow and broad host range. These are subjective terms and mainly linked to the number and type of strains tested in every study. For example, Huang et al. [41] reported Salmonella phage LPSE1 as a broad host range infecting seven Salmonella strains (three different serovars) in a spot test assay. On the other hand, Islam et al. [16] reported Salmonella phage LPST4 as a broad host range infecting 38 Salmonella strains (13 different serovars) using the same approach, but they also included EOP results. It is reasonable to assume that phage LPST4 has a broader host range compared to LPSE1. However, it is difficult to make a direct comparison between these two phages since different experimental design was used for the host range experiment in both studies. This highlights the importance of having a consistent and quantitative approach to compare and report the host range of a given phage.
Although different enrichment methods for phage isolation have been described, there is still a knowledge gap regarding the relationship between phage host range and the enrichment method applied. Additionally, the lack of a consensus method to determine the host range complicates the comparison between studies [25]. The results obtained from the spot test and EOP can be subjective, especially when considering that different phage traits such as diffusivity, adsorption rate, latent period, burst size, and other factors such as incubation time and media composition can influence the morphology of the phage plaques [42,43,44].
In this study, three different enrichment methods were used for the isolation of lytic phages from various environmental samples against two Gram negative bacterial genera (Salmonella and Pseudomonas) and one Gram positive genus (Listeria). Then, a high throughput screening approach in liquid medium was implemented to determine and compare the host range profiles of the isolated phages with different enrichment methods. This approach can provide a tool for the rapid determination of the phage host range, since it allows to determine the growth kinetics of phage treated bacterial strains. Using the 384-well plate format, the assay can accommodate 22 bacterial strains and four phages in technical triplicates in a single experiment, including the proper controls (Figure 2). Although a straightforward experiment, several technical considerations must be taken when performing this assay. For instance, to avoid bacterial growth before phage application, it is recommended to perform the experiment in a continuous manner (2–3 h using multi-channel pipette) as well as preparing bacterial dilutions right before adding them to the plate. To prevent cross-contamination between wells, a slow agitation speed is recommended during incubation. Alternatively, the volume in the wells can be reduced by 10–20%, which does not affect the results (data not shown). Media evaporation can occur when incubating plates for long periods of time or temperatures above ambient; however, that was not observed in this study (incubation time of up to 40 h, 25 °C). This can vary depending on the equipment, plate, temperature, and incubation time. Should that be the case for other conditions, it is recommended to use sterile membranes to cover the plates (e.g., Breathe-Easy® sealing membranes) to avoid media evaporation. Additionally, temperature plays an important factor in both bacterial metabolism and phage infectivity [45]. For example, the broad host range Listeria phages that we have isolated in this study do not produce plaques when incubated at 37 °C. Here, a temperature of 25 °C was used to study the infection of all phages; however, various temperatures can be tested following the same protocol. It is important to highlight that phages selected with this method need to be tested at different temperatures depending on the application, for example, 4–15 °C for food products and 37 °C for therapy.
The obtained OD data were analyzed using a rapid and sensitive data analytic tool, PHIDA. PHIDA was designed and implemented in this study to improve the efficiency and the accuracy of detecting and comparing the host range patterns of phages infecting a wide range of bacterial strains. The tool consists of two spread sheets: the first builds a regression model per each replicate to identify the OD growth trend. This sheet is organized in a dynamic architecture that allows flexibility in adding more strains, phages, or extending the experiment time. Lookup functions combined with conditional functions were used to automatically detect the host range patterns. The second sheet tracks and uses the information, patterns, and values derived by the configurations and the formulas of the first sheet to aggregate and organize the values into a final report. Therefore, the host range determination approach used in this study could be applied as a rapid screening technique for discrimination of unique and re-isolated phages. This method could be a useful non-subjective tool to identify broad or narrow host range phages for different phage applications.
Lastly, the host range index (HRi) was calculated for all phages, which can be defined as a metric for quantitative analysis of the phage host range. Metric values have been useful to quantitatively describe other phage traits, e.g., the virulence index (VP) that quantifies the phage killing efficacy in liquid culture [30]. Compared to the VP, the HRi aims to compare the growth inhibition effect of multiple phages against a defined panel of strains. More recently, Moller, et al. [46] developed a high throughput and quantitative version of the spot test using a 96-well plate format and turbidimetric measurements. Using this approach, the authors designated the strains as sensitive, semi-sensitive, and resistant to the phage infection, and designated a numerical value to the host range based on the OD measurements of the turbidity in the semisolid agar medium. Although high throughput, this approach exhibits the same pitfalls as the classical spot assay, such as: not reflecting the phage–host interaction in liquid culture, overestimation of the host range, and not monitoring the bacterial growth over the time.
Phage isolation from environmental samples traditionally relies on the enrichment of phage particles by introducing the target strain(s). Other methods apply a sequential enrichment using multiple strains to increase the likelihood of isolating broad host range phages [23]. However, no relationship between the enrichment method and the host range breadth has been reported. Using these enrichment methods, a total of 9 Listeria, 14 Salmonella, 15 environmental Pseudomonas, and 5 clinical Pseudomonas infecting phages were isolated, and their host range was quantified and compared using PHIDA. High variability in HRi values was observed among phages isolated with different enrichment methods against all targeted bacteria. Because a significant proportion of published Listeria phages to date are temperate and have narrow host ranges [47], approaches that are biased towards isolation of lytic broad host range phages are desirable. One such approach is the sequential enrichment of environmental samples with strains belonging to distinct serotypes [23]. Listeria phages isolated in this study using the CS enrichment method completely inhibited the growth of most strains against which they were screened for the 40 h duration of the experiment (Figure 4, Table S3). On the other hand, SS enrichment yielded two Listeria phages: one with a broad and one with a narrow spectrum of activity. CKA13, isolated by SS enrichment, delayed the growth of the 1/2a serotype Lm11 but had no effect on the 4b serotype Lm37. In contrast, all of the broadly active Listeria phages tested completely inhibited the growth of these two strains belonging to distinct lineages [48].
Notably, the newly isolated broad host range Listeria phages also inhibited the growth of several non-pathogenic Listeria species, including L. innocua, L. seeligeri, L. welshemeri, and L. grayi (Table S3), which is consistent with the productive infection of these strains by the phages. Consistent with a previous report that Listex P100 does not infect L. grayi [47], the growth of Lg127 was not inhibited by this commercially available phage.
The four phages listed in Figure 4 that were isolated by the CE method are all broad host range. However, phage isolation by this technique is relatively labor intensive, because phage lysate has to be plated on lawns of all the strains used in the enrichment. This can result in frequent re-isolation of the same phage since a given phage can produce distinct plaque morphologies on different hosts. Moreover, narrow host range phages might also be isolated by cocktail enrichment [49], which is not optimal for biocontrol applications.
Broad host range Listeria phages, such as the ones isolated in this study, belong to the genus Pecentumvirus. In the case of phage A511, another member of this genus, the primary receptor for phage attachment was initially reported to be the peptidoglycan (PG) itself, specifically the N-acetylglucosamine in the PG [50]. However, a subsequent study identified rhamnose and N-acetylglucosamine in the WTA of 1/2a strains of L. monocytogens as essential to the infection and binding of A511 receptor-binding proteins to the host. We expect a similar aspect to be true for our broad host range Listeria phages, since they can inhibit growth of both 1/2a and 4b strains and since the latter characteristic is a particularity of members of the genus Pecentumvirus [51]. Resistance in L. monocytogenes to broad host range phages has been reported to be associated with loss of glycosylation of wall teichoic acids (WTAs), which also serve as receptors for phage attachment by serotype-specific phages [50]. In the case of a strain belonging to serovar 4b, the loss of galactose was observed in resistant mutants that were isolated against the pecentumvirus A511 [52]. For serotype 1/2 strains, such as the 1/2a strain L. monocytogenes ATCC19111 that was used as the propagation host for the broad host range Listeria phages used in this study, the loss of N-acetyl glucosamine and rhamnose in the WTA of mutants resistant to broad host range Listeria phages was observed [31].
A notable finding from our work is that none of the broadly lytic Listeria phages had any effect on the growth of Lm38 under the conditions tested (Table S3). This strain has previously been serotyped as 1/2b, the strains of which have identical somatic antigens as the serotype 1/2a strains of Listeria. The observation that a 1/2 serotype strain is resistant to infection by non-serotype-specific phages is consistent with a mechanism of resistance that comes after receptor binding. One possibility is that this strain contains a functional CRISPR-Cas system. Sequences typical of CRISPR systems have been identified in L. monocytogenes in a screen of 128 strains encompassing diverse serotypes [53].
Similarly, Salmonella phages isolated with the CS method showed an overall broader host range compared to those isolated with CE and SS. Interestingly, the CS method also led to the isolation of both narrow (SP11) and broad (SP8) host range phages. The presence of abortive infection and exclusion mechanisms in the hosts used for the enrichment step could have led to the isolation of narrow host range phages with the CS method, since phage particles could still be present and carried throughout the enrichment series [1,54]. In contrast, since Salmonella serovars belonging to different serogroups (O:9, O:4, O7, and O:8) were used for the CS and CE method and they possess different somatic antigen (O antigen) structures [55,56], it is possible that broad host range phages isolated with this enrichment method might use a conserved surface glycan as a primary receptor, thus allowing the infection of multiple serovars [57]. Broad host range Salmonella phages have been reported to use conserved surface structures as receptors, including N-acetylglucosamine (GlcNAc) residue of the LPS core [58], core saccharides of the LPS core [59], ferrichrome transporter (FhuA) [60], vitamin B transporter (BtuB) [57], and outer membrane protein C (OmpC) [61]. Conversely, narrow host range phages (e.g., SP11 and SP12) were only able to inhibit the growth of a limited number of serovars, implying the use of more unique surface receptor such as serovar-specific O antigen saccharides or flagellum, which are very diverse among the serovars tested in this study [56,57]. Phages isolated with the CE (SP1–4) method exhibited an almost identical host range; this could be an indication that these phages are re-isolates or closely related phages. In contrast to Listeria and EP phages which completely inhibited the bacterial growth of the tested strains (more “C” designations, higher Is and HRi), isolated Salmonella phages were predominantly able to only delay the bacterial growth of the tested serovars for a period less than the duration of the experiment (24 h). This might be expected since S. enterica subsp. enterica serovars possess a wide variety of phage resistance mechanisms, including receptor mutation [62], R-M type III systems [63,64], CRISPR-Cas [65], and prophage mediated repression [66].
The EP phages isolated in this study had a high variation in their host range, ranging from an HRi of 0.0011 to 0.67 (Figure 6, Table S5). In contrast to Listeria and Salmonella phages, the CE method yielded the phage with the broadest host range (EP1, HRi 0.67). There was also a high variability when comparing phages isolated against cocktail A (EP1, EP8–10) and cocktail B (EP2–7, and EP11). Cocktail A was comprised of three phylogenetically distant Pseudomonas species [67]: P. fluorescens, P. putida, and P. mendocina [68]. Overall, cocktail A led to the isolation of phages with a narrower host range compared to cocktail B. Species diversity in cocktail A maybe have contributed to the isolation of both broad (EP1) and narrow (EP8–10) phages. EP1 showed growth inhibition against all Pseudomonas species included in cocktail A, whereas EP8–10 only exhibited growth inhibition against P. aeruginosa species. On the other hand, cocktail B was comprised of P. aeruginosa environmental isolates and yielded phages with higher HRi compared to cocktail A. As expected, phages isolated with cocktail B inhibited the growth of mainly P aeruginosa species and showed a broader host range, since the Pseudomonas panel used in this study mainly comprised the P. aeruginosa species (17/22). Interestingly, delay in the bacterial growth was not observed in any of the strains infected with EP11, which was isolated with the CE method. A slight decrease in the ODmax of ~20% was observed in P. aeruginosa ATCC33348 when infected with EP11. This behavior is commonly associated with filamentous phages (Pf phages) such as P. aeruginosa phage Pf4 [69]. Pf phages are known to cause chronic infection in which viral progeny is released from the infected cells without lysis; this can be reflected as a slight growth inhibition (in this case, reduced ODmax) [70,71]. On the other hand, phages isolated with the CS method (EP12–15) showed comparable HRi with the EP14 phage exhibiting the highest HRi of 0.38. These phages were isolated using a series of isolates of P. aeruginosa, thus phage isolation was biased towards the enrichment of phages inhibiting the growth of this species.
Conversely, only five CP phages were isolated using both the CE and CS methods. Among these phages, CP1 showed the highest HRi of 0.37 and was isolated using the CE method. Similarly, the CE method led to the isolation of narrow (CP4) and broad (CP1) phages. Except CP4, all phages (CP1–CP3) were able to inhibit the growth of all the LES-like isolates present in the enrichment cocktail. LES isolates possess highly similar core genomes with a relatively low number of single nucleotide polymorphisms (SNPs), accessory elements, and prophages [36]. Therefore, phages capable of infecting these isolates might rely on core genes to complete the infection cycle and might be able to overcome prophage mediated repression and exclusion [36,72,73]. Additionally, these phages may utilize conserved structures as receptor such as Type IV pili (present in all P aeruginosa) or saccharides present in the core LPS [74,75]. Similarly, as EP11, CP4 showed a weak growth inhibition against LES-like isolates, suggesting that this phage may cause chronic infection [70,71]. Interestingly, the CS method led to the isolation of one narrow host range phage (CP5). CP5 exhibited growth inhibition against four of the tested strains including only two of the four strains used in the enrichment series.
Our results suggest that broad host range phages isolated in this study using the three enrichment methods may possess specialized receptor binding proteins (RBPs) that recognize one or more highly conserved receptors allowing them to infect multiple strains [76]. Additionally, these phages might have evolved to completely or partially overcome phage resistance mechanisms, including restriction–modification (R–M) and CRISPR-Cas systems, receptor masking, and repression by prophages [66,73,77,78].

5. Conclusions

In conclusion, the study did not find a direct correlation between the enrichment method used for phage isolation and the host range spectrum of the isolated phages in any of the three bacteria genera. Except for Listeria, all methods yielded phages with narrow and broad host range. In short, one enrichment approach cannot fit all target bacteria and cannot be recommended for isolating broad or narrow host range phages. Considerations such as labor intensity and time consumption must be taken when considering these enrichment methods for phage isolation. For example, single strain enrichment can be adequate when time and resources are a constraint, whereas including all SS, CS, and CE in the isolation pipeline can be used to maximize the likelihood of isolating broad host range phages. The high throughput method and the analytics tool developed in this study can be implemented to quantitatively determine the host range of any phage and provide a standard for selecting phages for different applications. Additionally, these tools can be used in the future to develop more sophisticated analysis software integrating artificial intelligence to predict host range profile and phage-host interactions.

Supplementary Materials

The following are available online at https://www.mdpi.com/article/10.3390/v13112120/s1, Figure S1: Plaque assay results of phage isolates against Listeria spp., Table S1. List of bacterial strains used in this study, Table S2: Enrichment method used for isolation of phages in this study. Table S3: Host range determination of Listeria phages isolated using different enrichment methods. Table S4: Host range determination of Salmonella phages isolated using different enrichment methods. Table S5: Host range determination of Pseudomonas spp. Environmental phages isolated using different enrichment methods. Table S6: Host range determination of Pseudomonas spp. Clinical phages isolated using different enrichment methods.

Author Contributions

Conceptualization, C.E.M.-S., C.M.K. and H.A.; Data curation, C.E.M.-S., S.C., J.T.L. and S.K.; Formal analysis, C.E.M.-S., S.C., J.T.L., S.K. and E.S.M.; Funding acquisition, C.M.K. and H.A.; Methodology, C.E.M.-S., S.C., J.T.L., S.K., E.S.M. and H.A.; Software, E.S.M.; Supervision, C.M.K. and H.A.; Validation, E.S.M. and H.A.; Visualization, C.E.M.-S.; Writing—original draft, C.E.M.-S.; Writing—review & editing, C.E.M.-S., S.C., J.T.L., S.K., E.S.M. and C.M.K. All authors have read and agreed to the published version of the manuscript.

Funding

This research was funded by Agriculture and Agri-Food Canada through an A-base research grant (PSS # PSS # J-002272, J-002078 and J-002037) and The Natural Sciences and Engineering Research Council of Canada (grant #371639) to C.M.K.

Institutional Review Board Statement

Not applicable.

Informed Consent Statement

Not applicable.

Data Availability Statement

Not applicable.

Conflicts of Interest

The authors declare no conflict of interest.

References

  1. Labrie, S.J.; Samson, J.E.; Moineau, S. Bacteriophage resistance mechanisms. Nat. Rev. Microbiol. 2010, 8, 317–327. [Google Scholar] [CrossRef]
  2. Mushegian, A.R. Are There 1031 Virus Particles on Earth, or More, or Fewer? J. Bacteriol. 2020, 202, e00052-20. [Google Scholar] [CrossRef] [PubMed]
  3. Gigante, A.; Atterbury, R.J. Veterinary use of bacteriophage therapy in intensively-reared livestock. Virol. J. 2019, 16, 155. [Google Scholar] [CrossRef] [PubMed] [Green Version]
  4. Lin, D.M.; Koskella, B.; Lin, H.C. Phage therapy: An alternative to antibiotics in the age of multi-drug resistance. World J. Gastrointest. Pharmacol. Ther. 2017. [Google Scholar] [CrossRef]
  5. Moye, Z.D.; Woolston, J.; Sulakvelidze, A. Bacteriophage applications for food production and processing. Viruses 2018, 10, 205. [Google Scholar] [CrossRef] [Green Version]
  6. Wei, S.; Chelliah, R.; Rubab, M.; Oh, D.H.; Uddin, M.J.; Ahn, J. Bacteriophages as potential tools for detection and control of salmonella spp. Food Syst. 2019, 7, 570. [Google Scholar] [CrossRef] [Green Version]
  7. Summer, N.S.; Summer, E.J.; Gill, J.; Young, R. Phage remediation of microbe-induced corrosion. In Proceedings of the 17th International Corrosion Congress: Corrosion Control in the Service of Society, Las Vegas, NV, USA, 6–10 October 2008. [Google Scholar]
  8. Ross, A.; Ward, S.; Hyman, P. More is better: Selecting for broad host range bacteriophages. Front. Microbiol. 2016. [Google Scholar] [CrossRef] [PubMed] [Green Version]
  9. Brovko, L.Y.; Anany, H.; Griffiths, M.W. Bacteriophages for Detection and Control of Bacterial Pathogens in Food and Food-Processing Environment. Adv. Food Nutr. Res. 2012, 67, 241–288. [Google Scholar]
  10. Adams, M.H. Bacteriophages; Interscience Publishers: New York, NY, USA, 1959. [Google Scholar]
  11. Hyman, P.; Abedon, S.T. Bacteriophage host range and bacterial resistance. Adv. Appl. Microbiol. 2010, 70, 217–248. [Google Scholar] [CrossRef]
  12. Díaz-Muñoz, S.L.; Koskella, B. Bacteria-phage interactions in natural environments. Adv. Appl. Microbiol. 2014, 89, 135–183. [Google Scholar] [CrossRef]
  13. Mapes, A.C.; Trautner, B.W.; Liao, K.S.; Ramig, R.F. Development of expanded host range phage active on biofilms of multi-drug resistant Pseudomonas aeruginosa. Bacteriophage 2016. [Google Scholar] [CrossRef] [Green Version]
  14. Nilsson, A.S. Phage therapy-constraints and possibilities. Upsala J. Med. Sci. 2014, 119, 192–198. [Google Scholar] [CrossRef]
  15. Young, R.; Gill, J.J. Phage therapy redux—What is to be done? Science 2015, 350, 1163–1164. [Google Scholar] [CrossRef] [PubMed]
  16. Islam, M.S.; Zhou, Y.; Liang, L.; Nime, I.; Liu, K.; Yan, T.; Wang, X.; Li, J. Application of a Phage Cocktail for Control of Salmonella in Foods and Reducing Biofilms. Viruses 2019, 11, 841. [Google Scholar] [CrossRef] [PubMed] [Green Version]
  17. Schofield, D.; Sharp, N.J.; Westwater, C. Phage-based platforms for the clinical detection of human bacterial pathogens. Bacteriophage 2012. [Google Scholar] [CrossRef] [PubMed] [Green Version]
  18. Bai, J.; Kim, Y.T.; Ryu, S.; Lee, J.H. Biocontrol and rapid detection of food-borne pathogens using bacteriophages and endolysins. Front. Microbiol. 2016. [Google Scholar] [CrossRef] [PubMed]
  19. Meile, S.; Sarbach, A.; Du, J.; Schuppler, M.; Saez, C.; Loessner, M.J.; Kilcher, S. Engineered Reporter Phages for Rapid Bioluminescence-Based Detection and Differentiation of Viable Listeria Cells. Appl. Environ. Microbiol. 2020, 86. [Google Scholar] [CrossRef] [Green Version]
  20. Kortright, K.E.; Chan, B.K.; Koff, J.T.L.; Turner, P.E. Phage Therapy: A Renewed Approach to Combat Antibiotic-Resistant Bacteria. Cell Host Microbe 2019. [Google Scholar] [CrossRef] [Green Version]
  21. Melo, L.D.R.; Sillankorva, S.; Ackermann, H.W.; Kropinski, A.M.; Azeredo, J.; Cerca, N. Isolation and characterization of a new Staphylococcus epidermidis broad-spectrum bacteriophage. J. Gen. Virol. 2014. [Google Scholar] [CrossRef]
  22. El-Dougdoug, N.K.; Cucic, S.; Abdelhamid, A.G.; Brovko, L.; Kropinski, A.M.; Griffiths, M.W.; Anany, H. Control of Salmonella Newport on cherry tomato using a cocktail of lytic bacteriophages. Int. J. Food Microbiol. 2019, 293, 60–71. [Google Scholar] [CrossRef]
  23. Yu, P.; Mathieu, J.; Li, M.; Dai, Z.; Alvarez, P.J.J. Isolation of polyvalent bacteriophages by sequential multiple-host approaches. Appl. Environ. Microbiol. 2016, 82, 808–815. [Google Scholar] [CrossRef] [Green Version]
  24. Montso, P.K.; Mlambo, V.; Ateba, C.N. Characterization of Lytic Bacteriophages Infecting Multidrug-Resistant Shiga Toxigenic Atypical Escherichia coli O177 Strains Isolated From Cattle Feces. Front. Public Health 2019, 7, 355. [Google Scholar] [CrossRef]
  25. Mirzaei, M.K.; Nilsson, A.S. Isolation of phages for phage therapy: A comparison of spot tests and efficiency of plating analyses for determination of host range and efficacy. PLoS ONE 2015, 10, e0118557. [Google Scholar] [CrossRef] [PubMed] [Green Version]
  26. Xie, Y.; Wahab, L.; Gill, J.J. Development and Validation of a Microtiter Plate-Based Assay for Determination of Bacteriophage Host Range and Virulence. Viruses 2018, 10, 189. [Google Scholar] [CrossRef] [Green Version]
  27. Viazis, S.; Akhtar, M.; Feirtag, J.; Brabban, A.; Diez-Gonzalez, F. Isolation and characterization of lytic bacteriophages against enterohaemorrhagic Escherichia coli. J. Appl. Microbiol. 2011, 110, 1323–1331. [Google Scholar] [CrossRef] [PubMed]
  28. Kutter, E. Phage host range and efficiency of plating. In Bacteriophages; Springer: Berlin/Heidelberg, Germany, 2009; pp. 141–149. [Google Scholar]
  29. Kropinski, A.M. Practical advice on the one-step growth curve. In Bacteriophages; Springer: Berlin/Heidelberg, Germany, 2018; pp. 41–47. [Google Scholar]
  30. Storms, Z.J.; Teel, M.R.; Mercurio, K.; Sauvageau, D. The virulence index: A metric for quantitative analysis of phage virulence. Phage 2020, 1, 27–36. [Google Scholar] [CrossRef] [Green Version]
  31. Trudelle, D.M.; Bryan, D.W.; Hudson, L.K.; Denes, T.G. Cross-resistance to phage infection in Listeria monocytogenes serotype 1/2a mutants. Food Microbiol. 2019, 84, 103239. [Google Scholar] [CrossRef]
  32. Danovaro, R.; Middelboe, M. Separation of free virus particles from sediments in aquatic systems. Man. Aquat. Viral Ecol. ASLO 2010, 74–81. [Google Scholar]
  33. Sambrook, J.; Fritsch, E.F.; Maniatis, T. Molecular Cloning: A Laboratory Manual; Cold Spring Harbor Laboratory Press: Long Island, NY, USA, 1989. [Google Scholar]
  34. Sambrook, J.; Russell, D.W. Purification of Bacteriophage λ Particles by Centrifugation through a Glycerol Step Gradient. CSH Protoc. 2006, 2006. [Google Scholar] [CrossRef] [PubMed]
  35. Kropinski, A.M.; Mazzocco, A.; Waddell, T.E.; Lingohr, E.; Johnson, R.P. Enumeration of bacteriophages by double agar overlay plaque assay. Methods Mol. Biol. 2009. [Google Scholar] [CrossRef]
  36. Jeukens, J.; Boyle, B.; Kukavica-Ibrulj, I.; Ouellet, M.M.; Aaron, S.D.; Charette, S.J.; Fothergill, J.T.L.; Tucker, N.P.; Winstanley, C.; Levesque, R.C. Comparative Genomics of Isolates of a Pseudomonas aeruginosa Epidemic Strain Associated with Chronic Lung Infections of Cystic Fibrosis Patients. PLoS ONE 2014, 9, e87611. [Google Scholar] [CrossRef] [PubMed] [Green Version]
  37. Hyman, P. Phages for Phage Therapy: Isolation, Characterization, and Host Range Breadth. Pharmaceuticals 2019, 12, 35. [Google Scholar] [CrossRef] [PubMed] [Green Version]
  38. Islam, M.S.; Zhou, Y.; Liang, L.; Nime, I.; Yan, T.; Willias, S.P.; Mia, M.Z.; Bei, W.; Connerton, I.F.; Fischetti, V.A.; et al. Application of a Broad Range Lytic Phage LPST94 for Biological Control of Salmonella in Foods. Microorganisms 2020, 8, 247. [Google Scholar] [CrossRef] [PubMed] [Green Version]
  39. Kim, J.-W.; Siletzky, R.M.; Kathariou, S. Host Ranges of Listeria Specific Bacteriophages from the Turkey Processing Plant Environment in the United States. Appl. Environ. Microbiol. 2008, 74, 6623–6630. [Google Scholar] [CrossRef] [Green Version]
  40. Oda, M.; Morita, M.; Unno, H.; Tanji, Y. Rapid detection of Escherichia coli O157:H7 by using green fluorescent protein-labeled PP01 bacteriophage. Appl. Environ. Microbiol. 2004, 70, 527–534. [Google Scholar] [CrossRef] [Green Version]
  41. Huang, C.; Virk, S.M.; Shi, J.; Zhou, Y.; Willias, S.P.; Morsy, M.K.; Abdelnabby, H.E.; Liu, J.; Wang, X.; Li, J. Isolation, Characterization, and Application of Bacteriophage LPSE1 Against Salmonella enterica in Ready to Eat (RTE) Foods. Front. Microbiol. 2018, 9, 1046. [Google Scholar] [CrossRef]
  42. Ramesh, N.; Archana, L.; Madurantakam Royam, M.; Manohar, P.; Eniyan, K. Effect of various bacteriological media on the plaque morphology of Staphylococcus and Vibrio phages. Access Microbiol. 2019, 1, e000036. [Google Scholar] [CrossRef]
  43. Abedon, S.T.; Yin, J. Bacteriophage plaques: Theory and analysis. Methods Mol. Biol. 2009, 501, 161–174. [Google Scholar] [CrossRef]
  44. Gallet, R.; Kannoly, S.; Wang, I.-N. Effects of bacteriophage traits on plaque formation. BMC Microbiol. 2011, 11, 181. [Google Scholar] [CrossRef] [Green Version]
  45. Tokman, J.I.; Kent, D.J.; Wiedmann, M.; Denes, T. Temperature Significantly Affects the Plaquing and Adsorption Efficiencies of Listeria Phages. Front. Microbiol. 2016, 7, 631. [Google Scholar] [CrossRef]
  46. Moller, A.G.; Winston, K.; Ji, S.; Wang, J.; Davis, M.N.H.; Solís-Lemus, C.R.; Read, T.D.; Dunman, P. Genes Influencing Phage Host Range in Staphylococcus aureus on a Species-Wide Scale. Msphere 2021, 6, e01263-20. [Google Scholar] [CrossRef]
  47. Klumpp, J.; Loessner, M.J. Listeria phages: Genomes, evolution, and application. Bacteriophage 2013, 3, e26861. [Google Scholar] [CrossRef] [Green Version]
  48. Gray, M.J.; Zadoks, R.N.; Fortes, E.D.; Dogan, B.; Cai, S.; Chen, Y.; Scott, V.N.; Gombas, D.E.; Boor, K.J.; Wiedmann, M. Listeria monocytogenes isolates from foods and humans form distinct but overlapping populations. Appl. Environ. Microbiol. 2004, 70, 5833–5841. [Google Scholar] [CrossRef] [Green Version]
  49. Anany, H.E.-S.M. Biocontrol of Foodborne Bacterial Pathogens Using Immobilized Bacteriophages. Ph.D. Dissertation, University of Guelph, Guelph, ON, Canada, 2010. [Google Scholar]
  50. Wendlinger, G.; Loessner, M.J.; Scherer, S. Bacteriophage receptors on Listeria monocytogenes cells are the N-acetylglucosamine and rhamnose substituents of teichoic acids or the peptidoglycan itself. Microbiology 1996, 142 Pt 4, 985–992. [Google Scholar] [CrossRef] [PubMed] [Green Version]
  51. Habann, M.; Leiman, P.G.; Vandersteegen, K.; Van den Bossche, A.; Lavigne, R.; Shneider, M.M.; Bielmann, R.; Eugster, M.R.; Loessner, M.J.; Klumpp, J. Listeria phage A511, a model for the contractile tail machineries of SPO1-related bacteriophages. Mol. Microbiol. 2014, 92, 84–99. [Google Scholar] [CrossRef] [Green Version]
  52. Sumrall, E.T.; Shen, Y.; Keller, A.P.; Rismondo, J.; Pavlou, M.; Eugster, M.R.; Boulos, S.; Disson, O.; Thouvenot, P.; Kilcher, S. Phage resistance at the cost of virulence: Listeria monocytogenes serovar 4b requires galactosylated teichoic acids for InlB-mediated invasion. PLoS Pathog. 2019, 15, e1008032. [Google Scholar] [CrossRef] [Green Version]
  53. Di, H.; Ye, L.; Yan, H.; Meng, H.; Yamasak, S.; Shi, L. Comparative analysis of CRISPR loci in different Listeria monocytogenes lineages. Biochem. Biophys. Res. Commun. 2014, 454, 399–403. [Google Scholar] [CrossRef] [PubMed]
  54. Susskind, M.M.; Wright, A.; Botstein, D. Superinfection exclusion by P22 prophage in lysogens of Salmonella typhimurium: IV. Genetics and physiology of sieB exclusion. Virology 1974, 62, 367–384. [Google Scholar] [CrossRef]
  55. Liu, B.; Knirel, Y.A.; Feng, L.; Perepelov, A.V.; Senchenkova, S.N.; Reeves, P.R.; Wang, L. Structural diversity in Salmonella O antigens and its genetic basis. FEMS Microbiol. Rev. 2014, 38, 56–89. [Google Scholar] [CrossRef] [PubMed] [Green Version]
  56. Weill, P.A.D.G.F.-X. Antigenic Formulae of the Salmonella Serovars; WHO Collaborating Centre for Reference and Research on Salmonella: Paris, France, 2007; p. 167. [Google Scholar]
  57. Shin, H.; Lee, J.-H.; Kim, H.; Choi, Y.; Heu, S.; Ryu, S. Receptor diversity and host interaction of bacteriophages infecting Salmonella enterica serovar Typhimurium. PLoS ONE 2012, 7, e43392. [Google Scholar] [CrossRef] [PubMed]
  58. Hudson, H.P.; Lindberg, A.A.; Stocker, B.A.D. Lipopolysaccharide Core Defects in Salmonella typhimurium Mutants Which Are Resistant to Felix O Phage but Retain Smooth Character. Microbiology 1978, 109, 97–112. [Google Scholar] [CrossRef] [Green Version]
  59. Santos, S.B.; Kropinski, A.M.; Ceyssens, P.J.; Ackermann, H.W.; Villegas, A.; Lavigne, R.; Krylov, V.N.; Carvalho, C.M.; Ferreira, E.C.; Azeredo, J. Genomic and proteomic characterization of the broad-host-range Salmonella phage PVP-SE1: Creation of a new phage genus. J. Virol. 2011, 85, 11265–11273. [Google Scholar] [CrossRef] [Green Version]
  60. Casjens, S.R.; Gilcrease, E.B.; Winn-Stapley, D.A.; Schicklmaier, P.; Schmieger, H.; Pedulla, M.L.; Ford, M.E.; Houtz, J.M.; Hatfull, G.F.; Hendrix, R.W. The Generalized Transducing Salmonella Bacteriophage ES18: Complete Genome Sequence and DNA Packaging Strategy. J. Bacteriol. 2005, 187, 1091–1104. [Google Scholar] [CrossRef] [PubMed] [Green Version]
  61. Marti, R.; Zurfluh, K.; Hagens, S.; Pianezzi, J.; Klumpp, J.; Loessner, M.J. Long tail fibres of the novel broad-host-range T-even bacteriophage S16 specifically recognize Salmonella OmpC. Mol. Microbiol. 2013, 87, 818–834. [Google Scholar] [CrossRef] [PubMed]
  62. Wang, C.; Nie, T.; Lin, F.; Connerton, I.F.; Lu, Z.; Zhou, S.; Hang, H. Resistance mechanisms adopted by a Salmonella Typhimurium mutant against bacteriophage. Virus Res. 2019, 273, 197759. [Google Scholar] [CrossRef] [PubMed]
  63. Fox, K.L.; Srikhanta, Y.N.; Jennings, M.P. Phase variable type III restriction-modification systems of host-adapted bacterial pathogens. Mol. Microbiol. 2007, 65, 1375–1379. [Google Scholar] [CrossRef]
  64. Santander, J.; Robeson, J. Phage-resistance of Salmonella enterica serovar Enteritidis and pathogenesis in Caenorhabditis elegans is mediated by the lipopolysaccharide. Electron. J. Biotechnol. 2007, 10. [Google Scholar] [CrossRef] [Green Version]
  65. Shariat, N.; Timme, R.E.; Pettengill, J.B.; Barrangou, R.; Dudley, E.G. Characterization and evolution of Salmonella CRISPR-Cas systems. Microbiology 2015, 161, 374–386. [Google Scholar] [CrossRef]
  66. Wahl, A.; Battesti, A.; Ansaldi, M. Prophages in Salmonella enterica: A driving force in reshaping the genome and physiology of their bacterial host? Mol. Microbiol. 2019, 111, 303–316. [Google Scholar] [CrossRef] [Green Version]
  67. Garrido-Sanz, D.; Meier-Kolthoff, J.P.; Göker, M.; Martín, M.; Rivilla, R.; Redondo-Nieto, M. Genomic and Genetic Diversity within the Pseudomonas fluorescens Complex. PLoS ONE 2016, 11, e0150183. [Google Scholar] [CrossRef] [Green Version]
  68. Anzai, Y.; Kim, H.; Park, J.Y.; Wakabayashi, H.; Oyaizu, H. Phylogenetic affiliation of the pseudomonads based on 16S rRNA sequence. Int. J. Syst. Evol. Microbiol. 2000, 50 Pt 4, 1563–1589. [Google Scholar] [CrossRef] [Green Version]
  69. Webb, J.S.; Lau, M.; Kjelleberg, S. Bacteriophage and phenotypic variation in Pseudomonas aeruginosa biofilm development. J. Bacteriol. 2004, 186, 8066–8073. [Google Scholar] [CrossRef] [Green Version]
  70. Li, Y.; Liu, X.; Tang, K.; Wang, P.; Zeng, Z.; Guo, Y.; Wang, X. Excisionase in Pf filamentous prophage controls lysis-lysogeny decision-making in Pseudomonas aeruginosa. Mol. Microbiol. 2019, 111, 495–513. [Google Scholar] [CrossRef] [Green Version]
  71. Secor, P.R.; Burgener, E.B.; Kinnersley, M.; Jennings, L.K.; Roman-Cruz, V.; Popescu, M.; Van Belleghem, J.D.; Haddock, N.; Copeland, C.; Michaels, L.A.; et al. Pf Bacteriophage and Their Impact on Pseudomonas Virulence, Mammalian Immunity, and Chronic Infections. Front. Immunol. 2020, 11, 244. [Google Scholar] [CrossRef] [Green Version]
  72. James, C.E.; Fothergill, J.T.L.; Kalwij, H.; Hall, A.J.; Cottell, J.; Brockhurst, M.A.; Winstanley, C. Differential infection properties of three inducible prophages from an epidemic strain of Pseudomonas aeruginosa. BMC Microbiol. 2012, 12, 216. [Google Scholar] [CrossRef] [Green Version]
  73. Samson, J.E.; Magadán, A.H.; Sabri, M.; Moineau, S. Revenge of the phages: Defeating bacterial defences. Nat. Rev. Microbiol. 2013, 11, 675–687. [Google Scholar] [CrossRef] [PubMed]
  74. Trend, S.; Chang, B.J.; O’Dea, M.; Stick, S.M.; Kicic, A.; WAERP; AusREC; AREST CF. Use of a Primary Epithelial Cell Screening Tool to Investigate Phage Therapy in Cystic Fibrosis. Front. Pharmacol. 2018, 9. [Google Scholar] [CrossRef] [Green Version]
  75. Meadow, P.; Wells, P.J.M. Receptor Sites for R-type Pyocins and Bacteriophage E79 in the Core Part of the Lipopolysaccharide of Pseudomonas aeruginosaPAC1. Microbiology 1978, 108, 339–343. [Google Scholar]
  76. Schwarzer, D.; Buettner, F.F.; Browning, C.; Nazarov, S.; Rabsch, W.; Bethe, A.; Oberbeck, A.; Bowman, V.D.; Stummeyer, K.; Mühlenhoff, M.; et al. A multivalent adsorption apparatus explains the broad host range of phage phi92: A comprehensive genomic and structural analysis. J. Virol. 2012, 86, 10384–10398. [Google Scholar] [CrossRef] [Green Version]
  77. Krüger, D.H.; Bickle, T.A. Bacteriophage survival: Multiple mechanisms for avoiding the deoxyribonucleic acid restriction systems of their hosts. Microbiol. Rev. 1983, 47, 345–360. [Google Scholar] [CrossRef] [PubMed]
  78. Touchon, M.; Rocha, E.P.C. The Small, Slow and Specialized CRISPR and Anti-CRISPR of Escherichia and Salmonella. PLoS ONE 2010, 5, e11126. [Google Scholar] [CrossRef] [PubMed] [Green Version]
Figure 1. Methods for bacteriophage enrichment and isolation evaluated in this study. (1) Single strain (SS): processed sample is enriched with an overnight monoculture and incubated overnight. Mixture is then centrifuged, filtered, and presence of phage is verified by plaque assay on the same host used for enrichment. Plaques are purified and propagated for host range determination using high throughput turbidimetric assay. (2) Cocktail enrichment (CE): processed sample is enriched with equal ratios of overnight monocultures (cocktail) and incubated overnight. The mixture is then centrifuged, filtered, and presence of phage is verified by plaque assay on every host used for the enrichment. Plaques from individual hosts are purified and propagated for host range determination using high throughput turbidimetric assay. (3) Cyclic sequential (CS) was performed as previously described [31] with some modifications; processed sample is enriched with an overnight monoculture of the first host in the series and incubated overnight. Mixture is then centrifuged, filtered, and presence of phage is verified by plaque assay on the first host. All plaques are pooled and for propagation in the second host of the series. Presence of phage is verified by plaque assay on the second host. The same process is repeated with all the hosts in the series. Plaques recovered from last enrichment are purified and propagated for host range determination using high throughput turbidimetric assay. Created with BioRender.com.
Viruses 13 02120 g001
Figure 2. The 384-well plate layout for the high throughput turbidimetric host range determination assay. Columns indicate the number of bacterial strains, and rows, the treatments. Phages 1–4 indicate different phages tested in technical triplicates (50 µL of bacteria dilution + 50 µL of phage dilution). Untreated control (50 µL of bacteria dilution + 50 µL of CM buffer). Sterility control (50 µL of 2 x media + 50 µL of phage dilution). Blank (50 µL of 2 x media + 50 µL of CM buffer). Created with BioRender.com.
Viruses 13 02120 g002
Figure 3. Growth inhibition designations for host range characterization. (A) Complete inhibition of the bacterial growth; C: sample never reaches detection threshold for the duration of the experiment. (B) More than 5 h delay in bacterial growth compared to control; D+: time difference to reach detection threshold between sample and control is ≥5 h and <“experiment duration time–detection time of the control”. Less than 5 h delay in bacterial growth compared to control D: time difference to reach detection threshold between sample and control is ≥1 and <5 h). (C) Time difference to reach detection threshold between sample and control is <1 h. Small effect on bacterial growth endpoint; N/L: ODmax is 70–85% of control. Moderate effect on bacterial growth endpoint; N/L+: ODmax is 40–70% of control. Large effect on bacterial growth endpoint N/L++: ODmax is ≤40% of control. Created with BioRender.com.
Viruses 13 02120 g003
Figure 4. Stacked bar plot showing the host range of Listeria phages isolated using different enrichment methods. Designation: C, complete inhibition, D+, >5 h delay to reach exponential phase; D, <5 h delay to reach exponential phase; N, no effect; HRi, host range index.
Viruses 13 02120 g004
Figure 5. Stacked bar plot showing the host range of Salmonella phages isolated using different enrichment methods. Designation: C, complete inhibition, D+, >5 h delay to reach exponential phase; D, <5 h delay to reach exponential phase; N, no effect; HRi, host range index.
Viruses 13 02120 g005
Figure 6. Stacked bar plot showing the host range of phages infecting Pseudomonas clinical strains isolated using different enrichment methods. Designation: C, complete inhibition, D+, >5 h delay to reach exponential phase; D, <5 h delay to reach exponential phase; N, no effect; HRi, host range index.
Viruses 13 02120 g006
Figure 7. Stacked bar plot showing the host range of phages infecting Pseudomonas environmental strains isolated using different enrichment methods. Designation: C, complete inhibition, D+, >5 h delay to reach exponential phase; D, <5 h delay to reach exponential phase; N, no effect; HRi, host range index.
Viruses 13 02120 g007
Publisher’s Note: MDPI stays neutral with regard to jurisdictional claims in published maps and institutional affiliations.

