Comparative Seasonal Respiratory Virus Epidemic Timing in Utah
Abstract
1. Introduction
2. Materials and Methods
2.1. GermWatch® Data
2.2. Analysis
2.2.1. Descriptive Analysis
2.2.2. Wavelet Analysis
3. Results
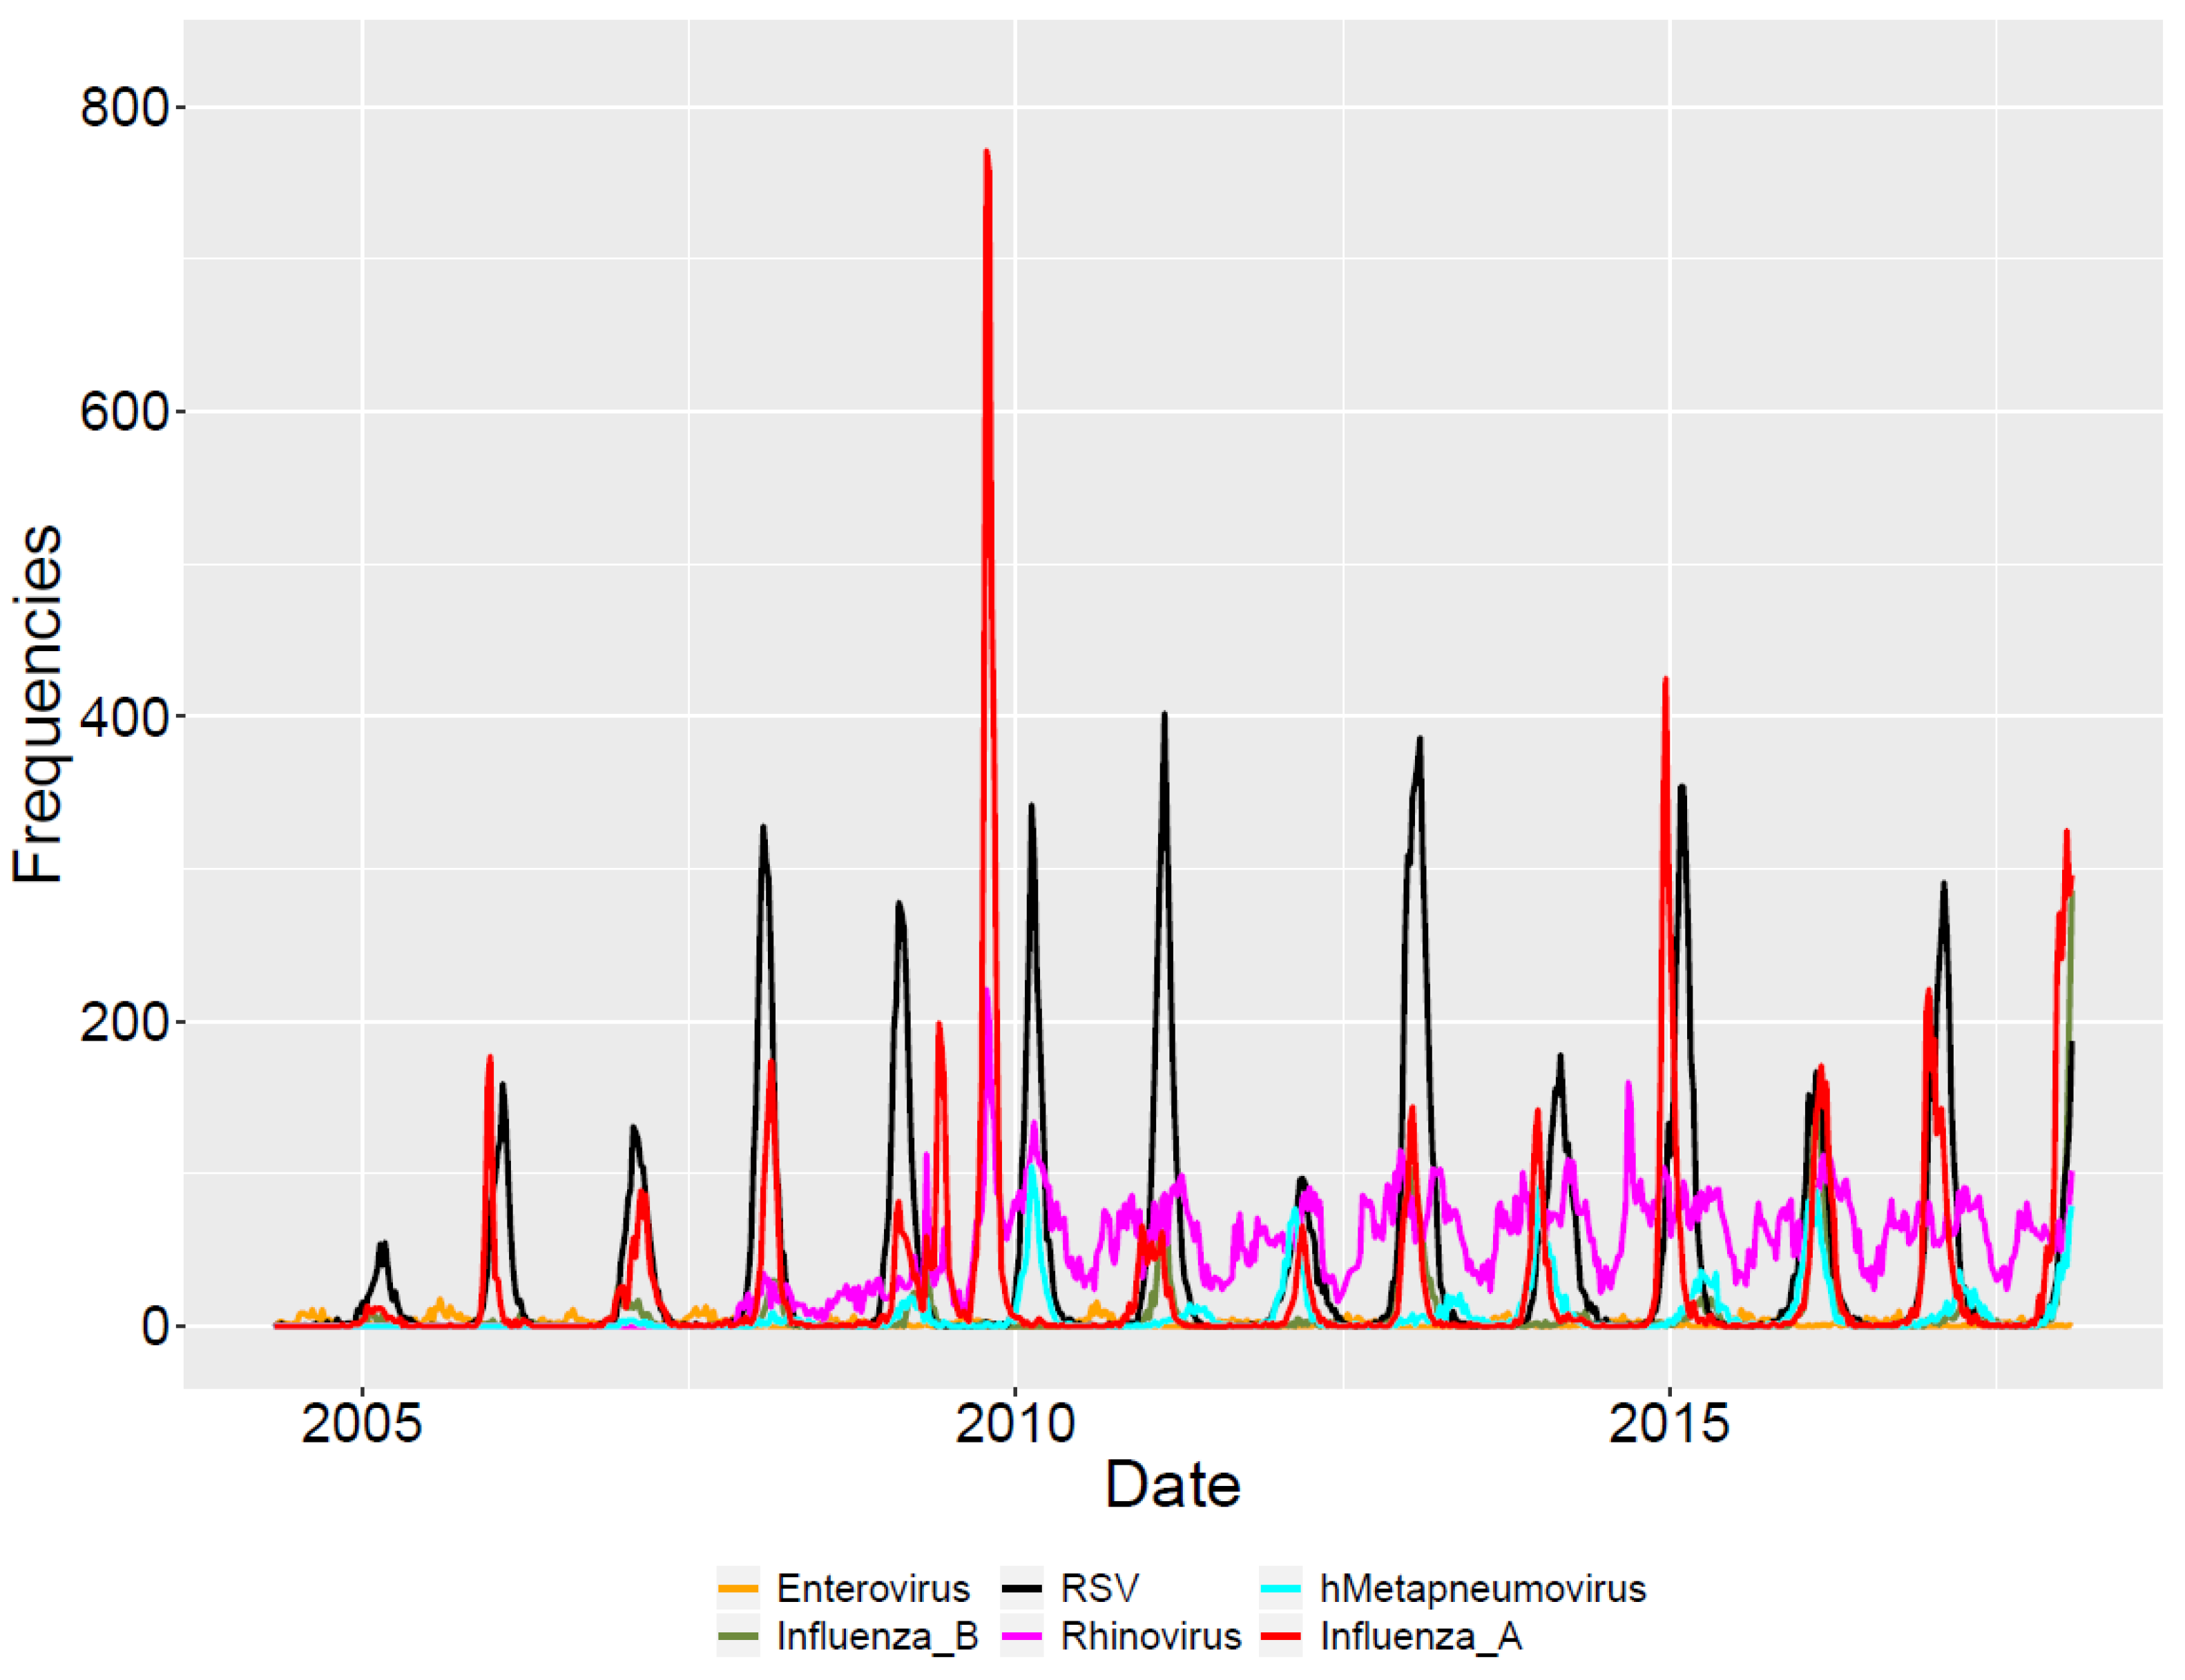
3.1. Descriptive Analysis
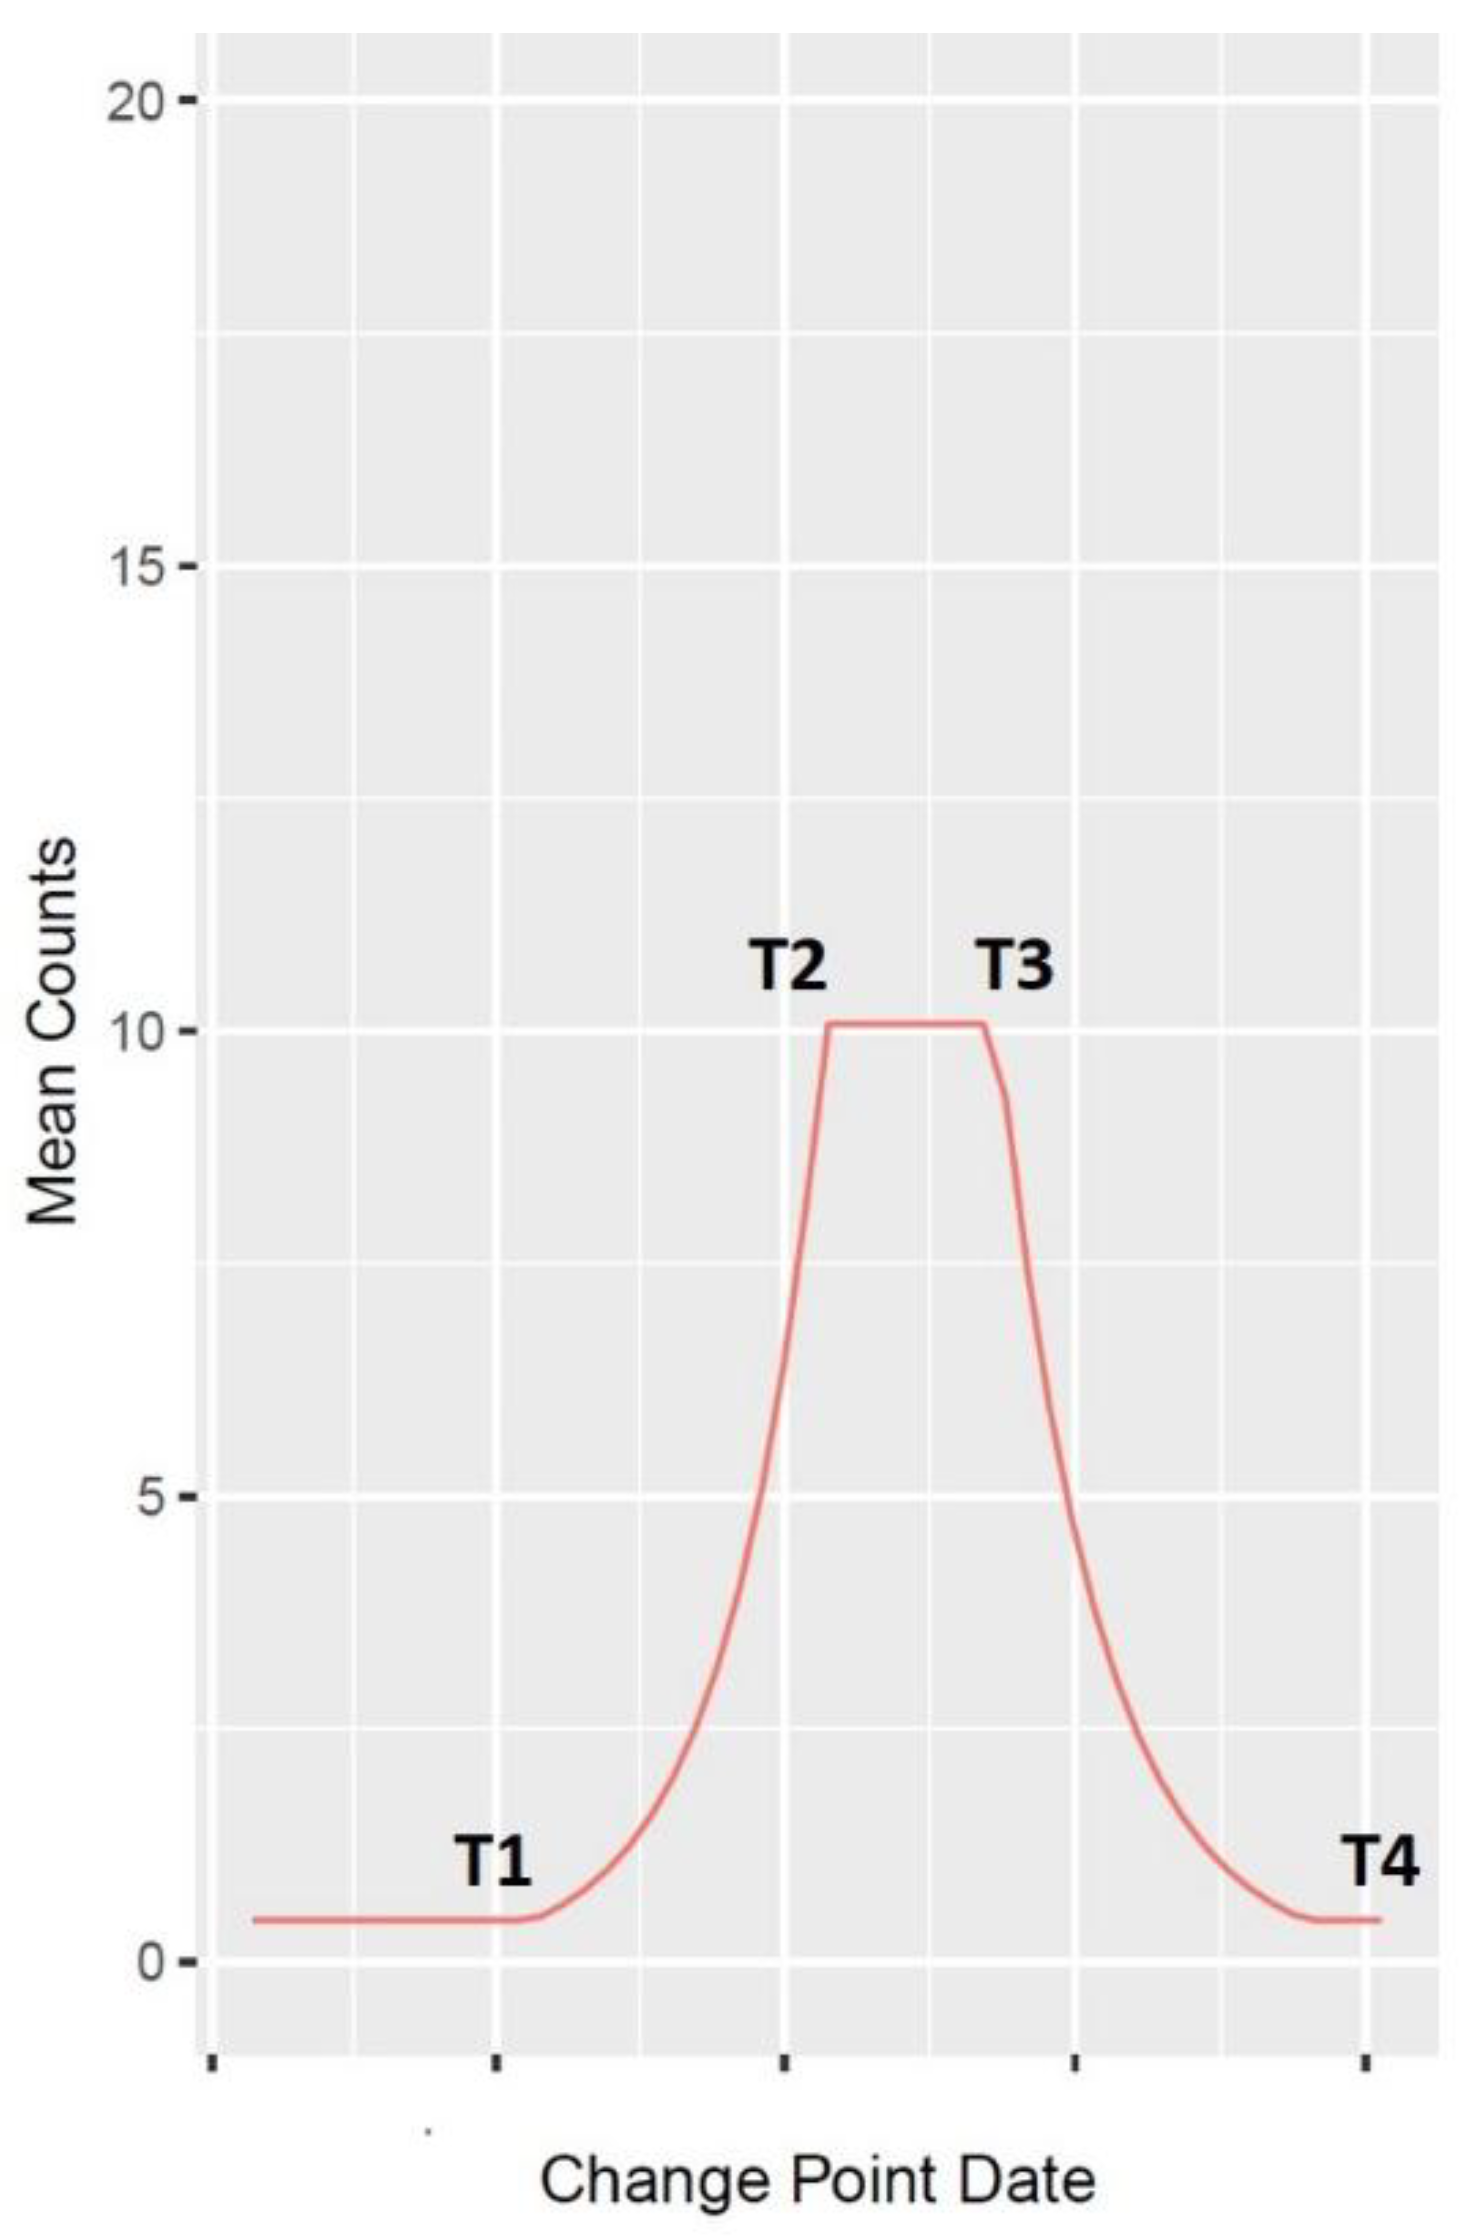
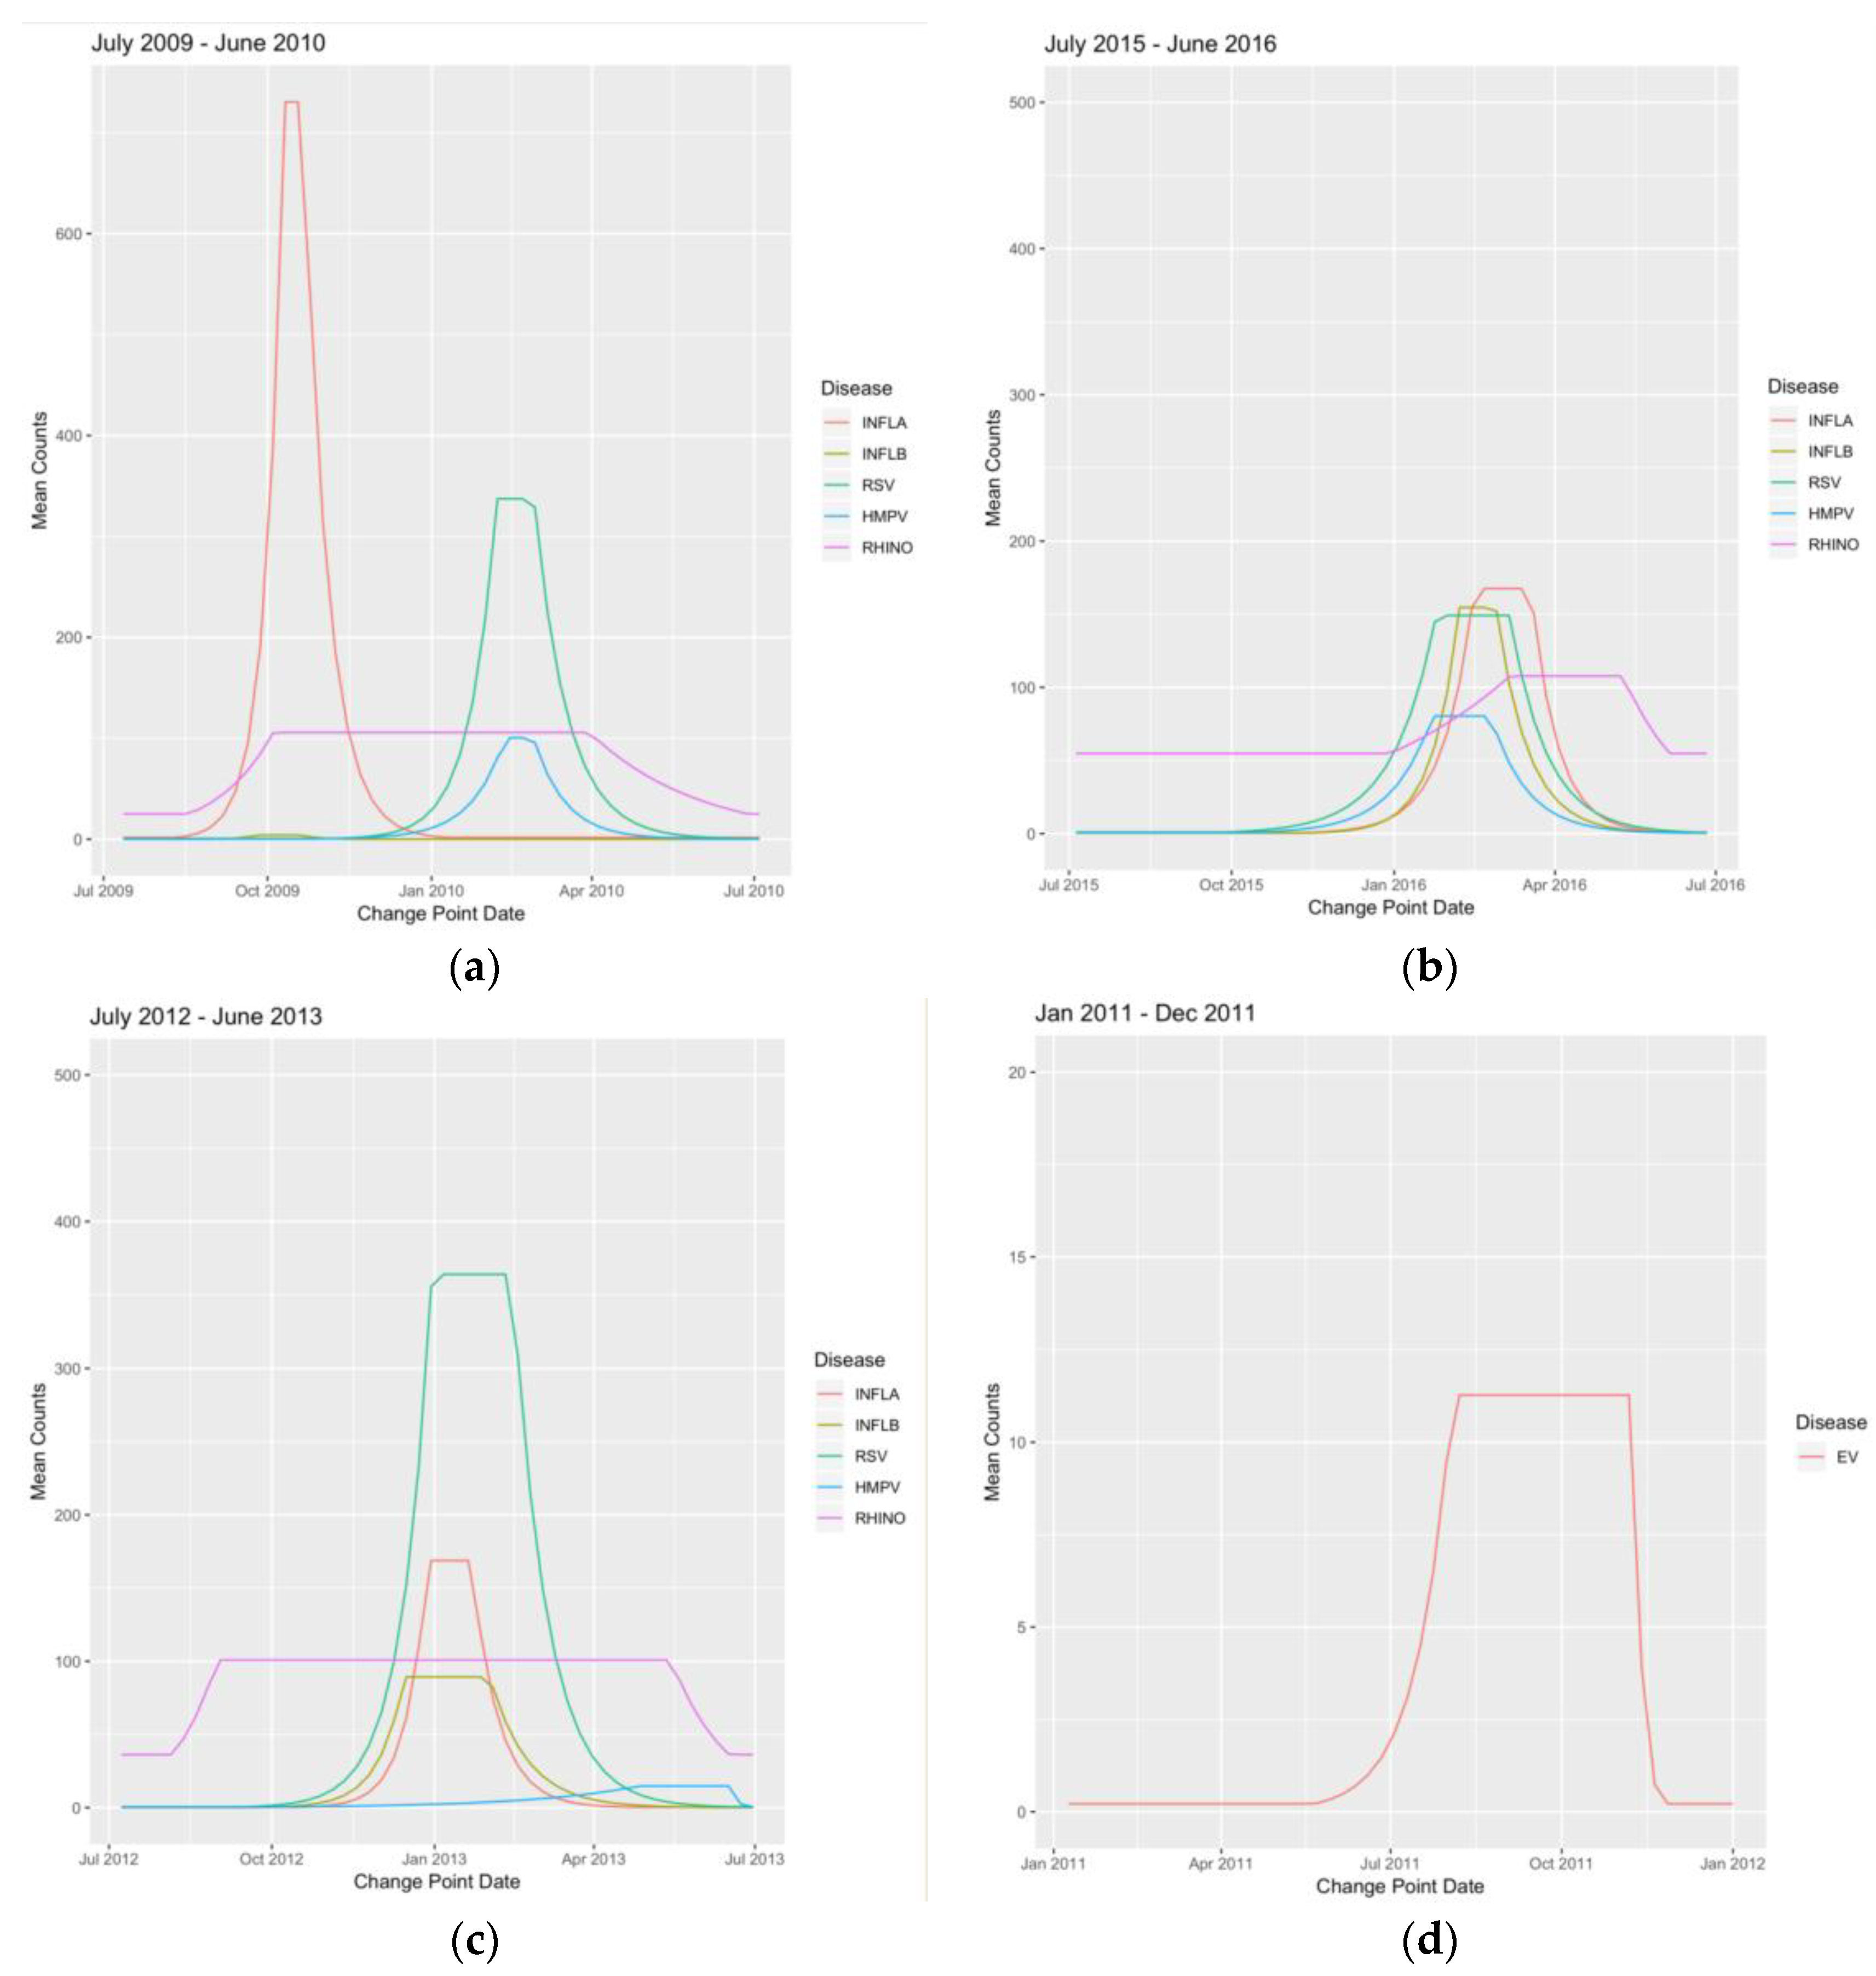
3.2. Wavelet Analysis
4. Discussion
Author Contributions
Funding
Acknowledgments
Conflicts of Interest
Appendix A. Tables
| Seasonal Year | Influenza A | Influenza B | RSV | HMPV | Rhinovirus | Enterovirus | Year Sums |
|---|---|---|---|---|---|---|---|
| 2004 | 0 | 0 | 5 | 0 | 0 | 13 | 18 |
| 2005 | 132 | 67 | 506 | 0 | 0 | 124 | 829 |
| 2006 | 648 | 50 | 1181 | 0 | 0 | 184 | 2063 |
| 2007 | 803 | 219 | 1284 | 35 | 0 | 109 | 2450 |
| 2008 | 1045 | 212 | 2611 | 81 | 547 | 135 | 4631 |
| 2009 | 1581 | 240 | 2339 | 210 | 1419 | 70 | 5859 |
| 2010 | 3693 | 9 | 2359 | 723 | 3878 | 70 | 10,732 |
| 2011 | 717 | 476 | 2975 | 159 | 3172 | 125 | 7624 |
| 2012 | 391 | 43 | 1133 | 629 | 2665 | 64 | 4925 |
| 2013 | 924 | 1042 | 4002 | 250 | 3691 | 65 | 9974 |
| 2014 | 869 | 96 | 1983 | 821 | 3403 | 78 | 7250 |
| 2015 | 2177 | 218 | 3001 | 444 | 3962 | 89 | 9891 |
| 2016 | 1425 | 1052 | 1833 | 836 | 3486 | 107 | 8739 |
| 2017 | 1804 | 191 | 2701 | 378 | 3299 | 76 | 8449 |
| 2018 | 2242 | 852 | 758 | 379 | 1759 | 38 | 6028 |
| Virus Sums | 18,451 | 4767 | 28,671 | 4945 | 31,281 | 1347 | 89,462 |
| Month | Influenza A | Influenza B | RSV | HMPV | Rhinovirus | Enterovirus | Month Sums |
|---|---|---|---|---|---|---|---|
| January | 4315 | 1482 | 8241 | 1190 | 2859 | 20 | 18,107 |
| February | 2599 | 1225 | 10,259 | 1258 | 2695 | 15 | 18,051 |
| March | 1615 | 736 | 5235 | 865 | 3363 | 11 | 11,825 |
| April | 499 | 333 | 1332 | 474 | 3096 | 27 | 5761 |
| May | 498 | 179 | 364 | 317 | 2672 | 70 | 4100 |
| June | 488 | 31 | 91 | 138 | 1585 | 86 | 2419 |
| July | 82 | 8 | 32 | 40 | 1276 | 274 | 1712 |
| August | 56 | 1 | 13 | 22 | 1748 | 330 | 2170 |
| September | 360 | 12 | 28 | 9 | 2907 | 231 | 3547 |
| October | 2500 | 25 | 88 | 22 | 3023 | 153 | 5811 |
| November | 1182 | 98 | 338 | 116 | 3065 | 88 | 4887 |
| December | 4257 | 637 | 2650 | 494 | 2992 | 42 | 11,072 |
| Disease | Value T1 | Date T1 | Value T2 | Date T2 | Value T3 | Date T3 | Value T4 | Date T4 |
|---|---|---|---|---|---|---|---|---|
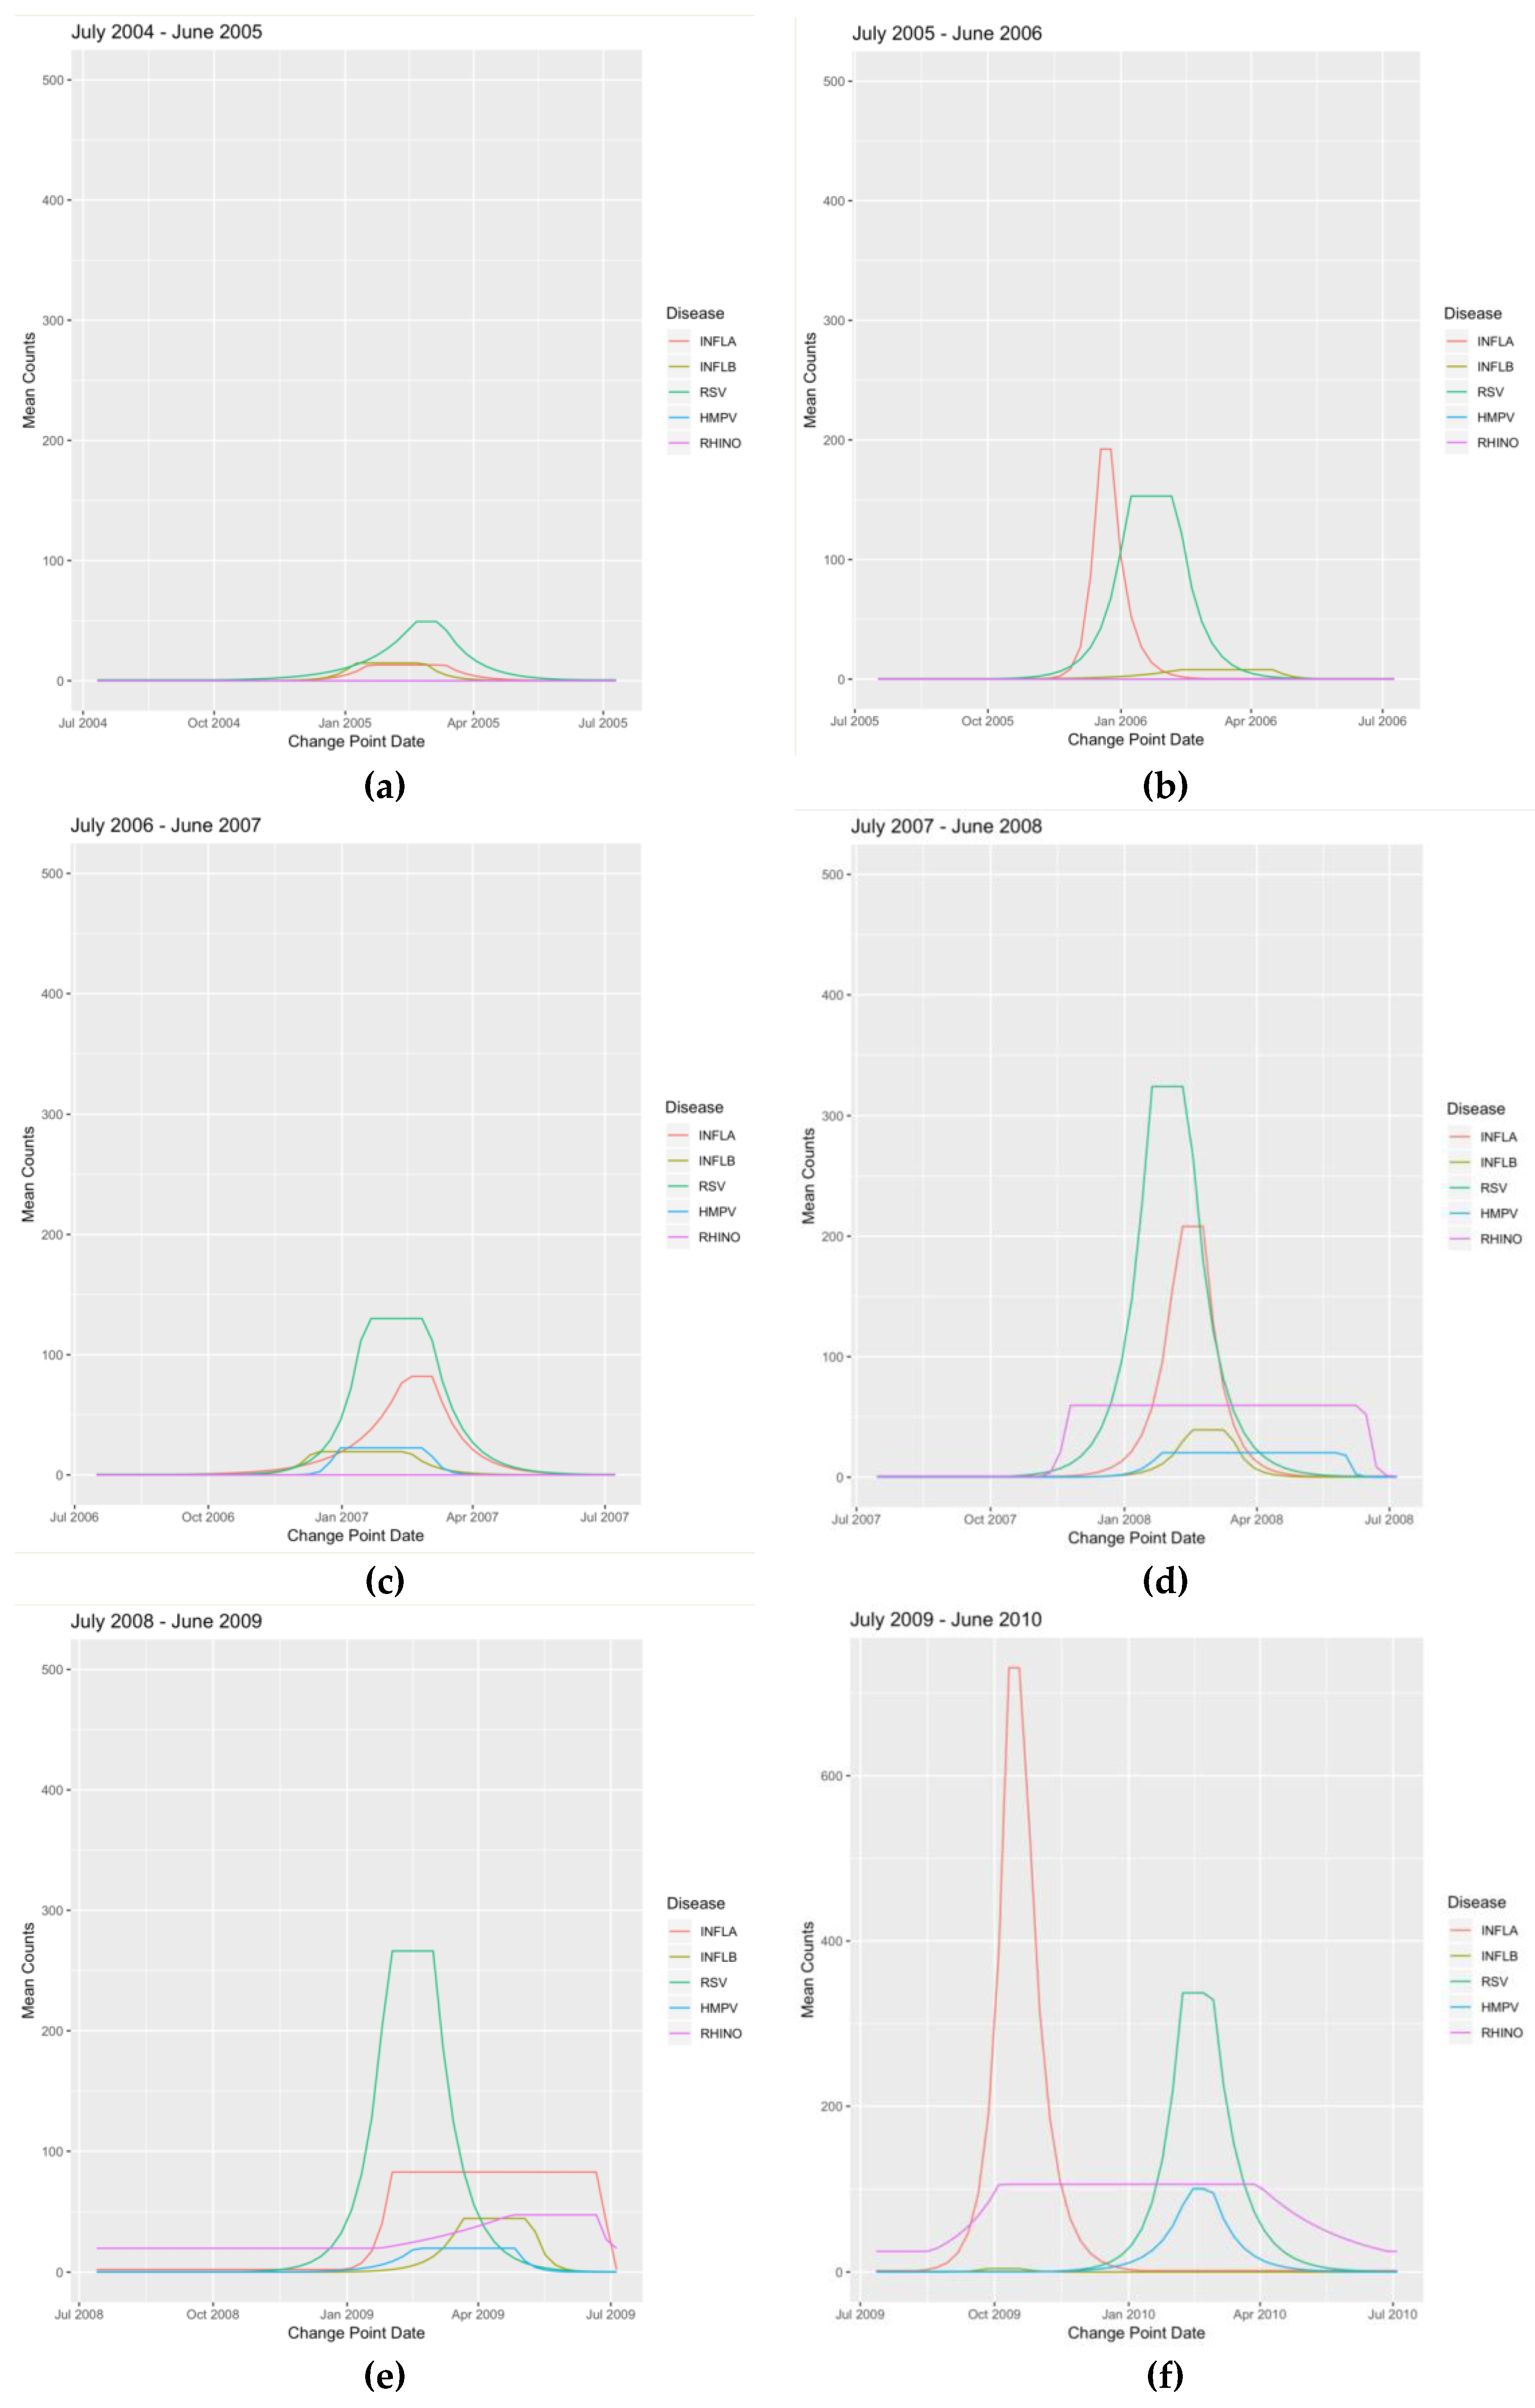
| INFLA | 0.13 | 7-Nov-2004 | 12.37 | 16-Jan-2005 | 12.6 | 13-Mar-2005 | 0.11 | 5-Jun-2005 |
| INFLB | 0.05 | 31-Oct-2004 | 14.95 | 9-Jan-2005 | 13.54 | 27-Feb-2005 | 0.06 | 8-May-2005 |
| RSV | 0.64 | 3-Oct-2004 | 49.42 | 20-Feb-2005 | 49.42 | 6-Mar-2005 | 0.69 | 19-Jun-2005 |
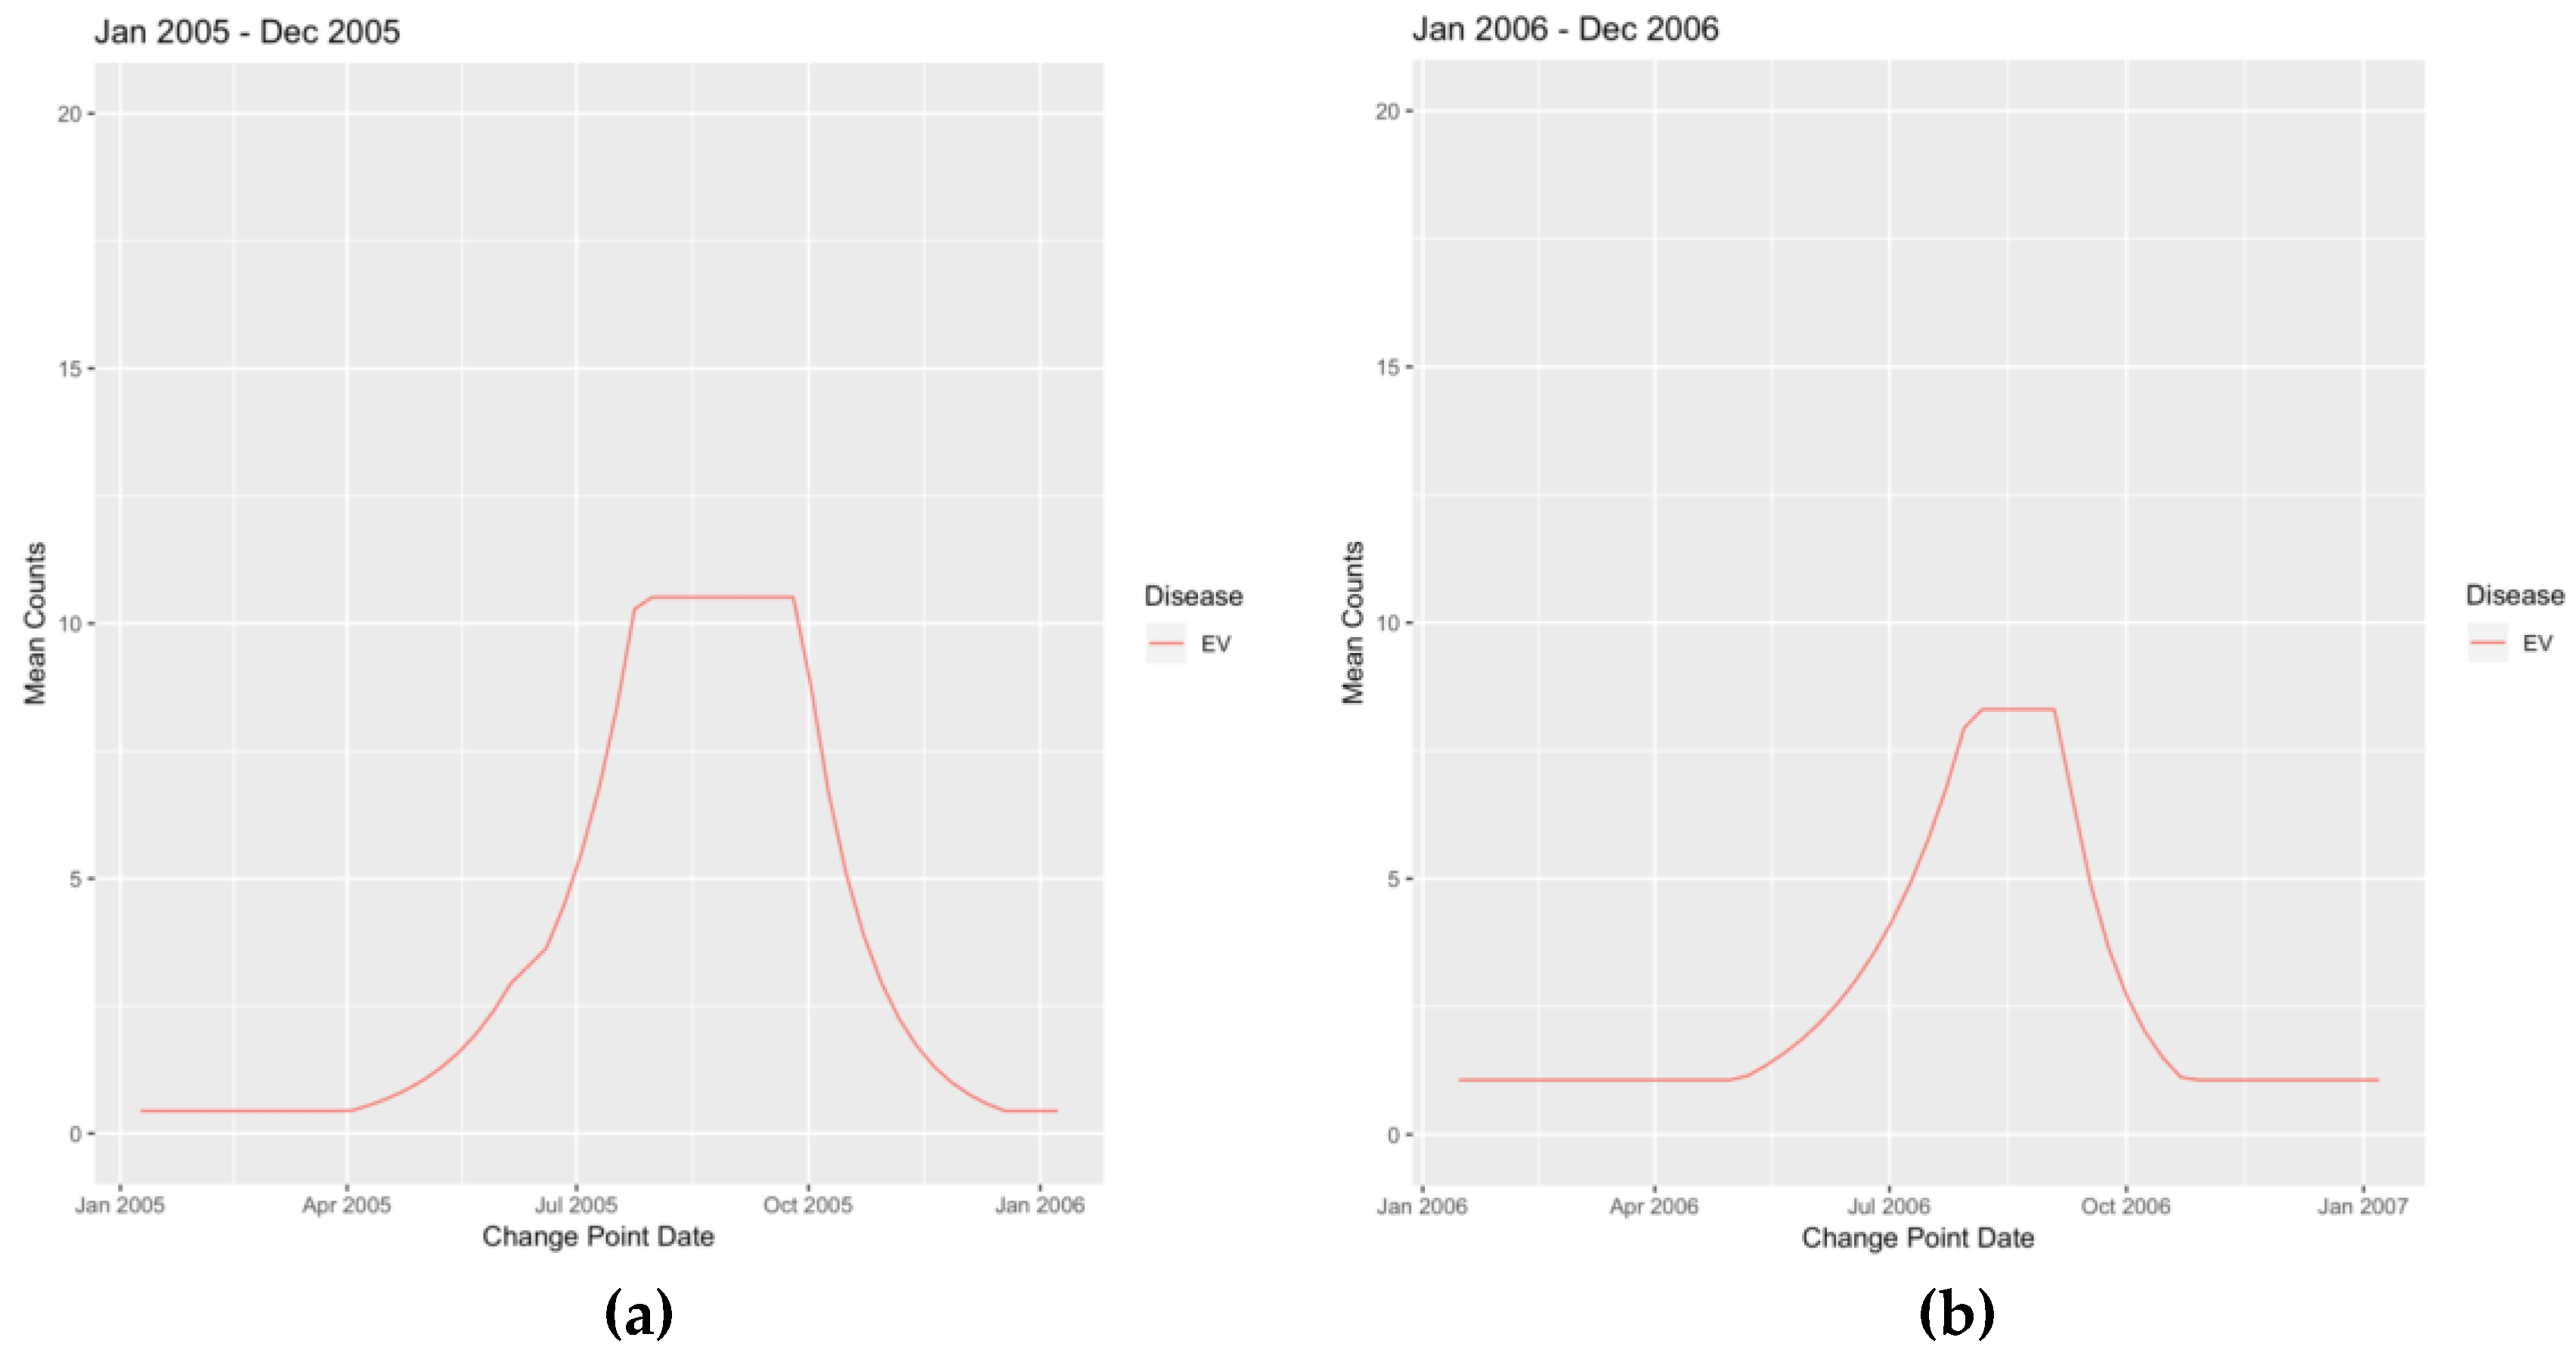
| EV | 0.49 | 8-Aug-2004 | 11.13 | 14-Nov-2004 | 11.13 | 16-Jan-2005 | 0.44 | 10-Apr-2005 |
| HMPV | NA | NA | NA | NA | NA | NA | NA | NA |
| RHINO | NA | NA | NA | NA | NA | NA | NA | NA |
| INFLA | 0.39 | 6-Nov-2005 | 189.32 | 18-Dec-2005 | 189.32 | 25-Dec-2005 | 0.52 | 26-Feb-2006 |
| INFLB | 0.12 | 2-Oct-2005 | 7.38 | 5-Feb-2006 | 7.47 | 16-Apr-2006 | 0.12 | 28-May-2006 |
| RSV | 0.23 | 2-Oct-2005 | 147.08 | 8-Jan-2006 | 117.85 | 12-Feb-2006 | 0.28 | 14-May-2006 |
| EV | 1.08 | 21-Aug-2005 | 7.5 | 4-Dec-2005 | 7.38 | 1-Jan-2006 | 1.1 | 19-Feb-2006 |
| HMPV | NA | NA | NA | NA | NA | NA | NA | NA |
| RHINO | NA | NA | NA | NA | NA | NA | NA | NA |
| INFLA | 0.36 | 3-Sep-2006 | 76.25 | 11-Feb-2007 | 81.69 | 4-Mar-2007 | 0.36 | 24-Jun-2007 |
| INFLB | 0.12 | 15-Oct-2006 | 16.36 | 10-Dec-2006 | 17.15 | 18-Feb-2007 | 0.12 | 13-May-2007 |
| RSV | 0.39 | 15-Oct-2006 | 110.52 | 14-Jan-2007 | 115.63 | 4-Mar-2007 | 0.37 | 24-Jun-2007 |
| EV | 0.49 | 13-Aug-2006 | 10.08 | 12-Nov-2006 | 9.28 | 7-Jan-2007 | 0.45 | 15-Apr-2007 |
| HMPV | 0.05 | 26-Nov-2006 | 18.53 | 31-Dec-2006 | 13.65 | 4-Mar-2007 | 0.04 | 15-Apr-2007 |
| RHINO | NA | NA | NA | NA | NA | NA | NA | NA |
| INFLA | 0.76 | 18-Nov-2007 | 178.58 | 10-Feb-2008 | 178.58 | 24-Feb-2008 | 0.97 | 4-May-2008 |
| INFLB | 0.17 | 2-Dec-2007 | 28.62 | 10-Feb-2008 | 27.92 | 16-Mar-2008 | 0.17 | 11-May-2008 |
| RSV | 0.48 | 7-Oct-2007 | 326.24 | 20-Jan-2008 | 268.18 | 17-Feb-2008 | 0.49 | 8-Jun-2008 |
| EV | 0.36 | 26-Aug-2007 | 3.94 | 18-Nov-2007 | 4.24 | 24-Feb-2008 | 0.44 | 23-Mar-2008 |
| HMPV | 0.1 | 25-Nov-2007 | 78.52 | 27-Jan-2008 | 70.01 | 1-Jun-2008 | 0.07 | 22-Jun-2008 |
| RHINO | 0.72 | 4-Nov-2007 | 65.33 | 25-Nov-2007 | 45.06 | 15-Jun-2008 | 1.3 | 29-Jun-2008 |
| INFLA | 2.8 | 28-Dec-2008 | 112.59 | 1-Feb-2009 | 53.08 | 28-Jun-2009 | 53.08 | 28-Jun-2009 |
| INFLB | 0.19 | 21-Dec-2008 | 62.63 | 22-Mar-2009 | 46.99 | 10-May-2009 | 0.2 | 21-Jun-2009 |
| RSV | 0.38 | 19-Oct-2008 | 263.44 | 1-Feb-2009 | 263.44 | 1-Mar-2009 | 0.38 | 28-Jun-2009 |
| EV | 0.37 | 7-Sep-2008 | 8.01 | 7-Dec-2008 | 7.63 | 11-Jan-2009 | 0.41 | 8-Mar-2009 |
| HMPV | 0.28 | 30-Nov-2008 | 22.05 | 15-Feb-2009 | 22.05 | 26-Apr-2009 | 0.35 | 31-May-2009 |
| RHINO | 20.27 | 25-Jan-2009 | 47.89 | 26-Apr-2009 | 27.22 | 28-Jun-2009 | 27.22 | 28-Jun-2009 |
| INFLA | 2.52 | 9-Aug-2009 | 803.25 | 11-Oct-2009 | 917.61 | 18-Oct-2009 | 2.52 | 3-Jan-2010 |
| INFLB | 0.03 | 23-Aug-2009 | 3.65 | 27-Sep-2009 | 3.65 | 18-Oct-2009 | 0.04 | 29-Nov-2009 |
| RSV | 0.77 | 8-Nov-2009 | 337.97 | 7-Feb-2010 | 336.19 | 28-Feb-2010 | 0.76 | 20-Jun-2010 |
| EV | 0.39 | 16-Aug-2009 | 11.33 | 6-Dec-2009 | 10.92 | 10-Jan-2010 | 0.39 | 4-Apr-2010 |
| HMPV | 0.28 | 25-Oct-2009 | 100.25 | 14-Feb-2010 | 95.22 | 28-Feb-2010 | 0.28 | 13-Jun-2010 |
| RHINO | 24.82 | 16-Aug-2009 | 106.66 | 4-Oct-2009 | 106.66 | 28-Mar-2010 | 25.04 | 27-Jun-2010 |
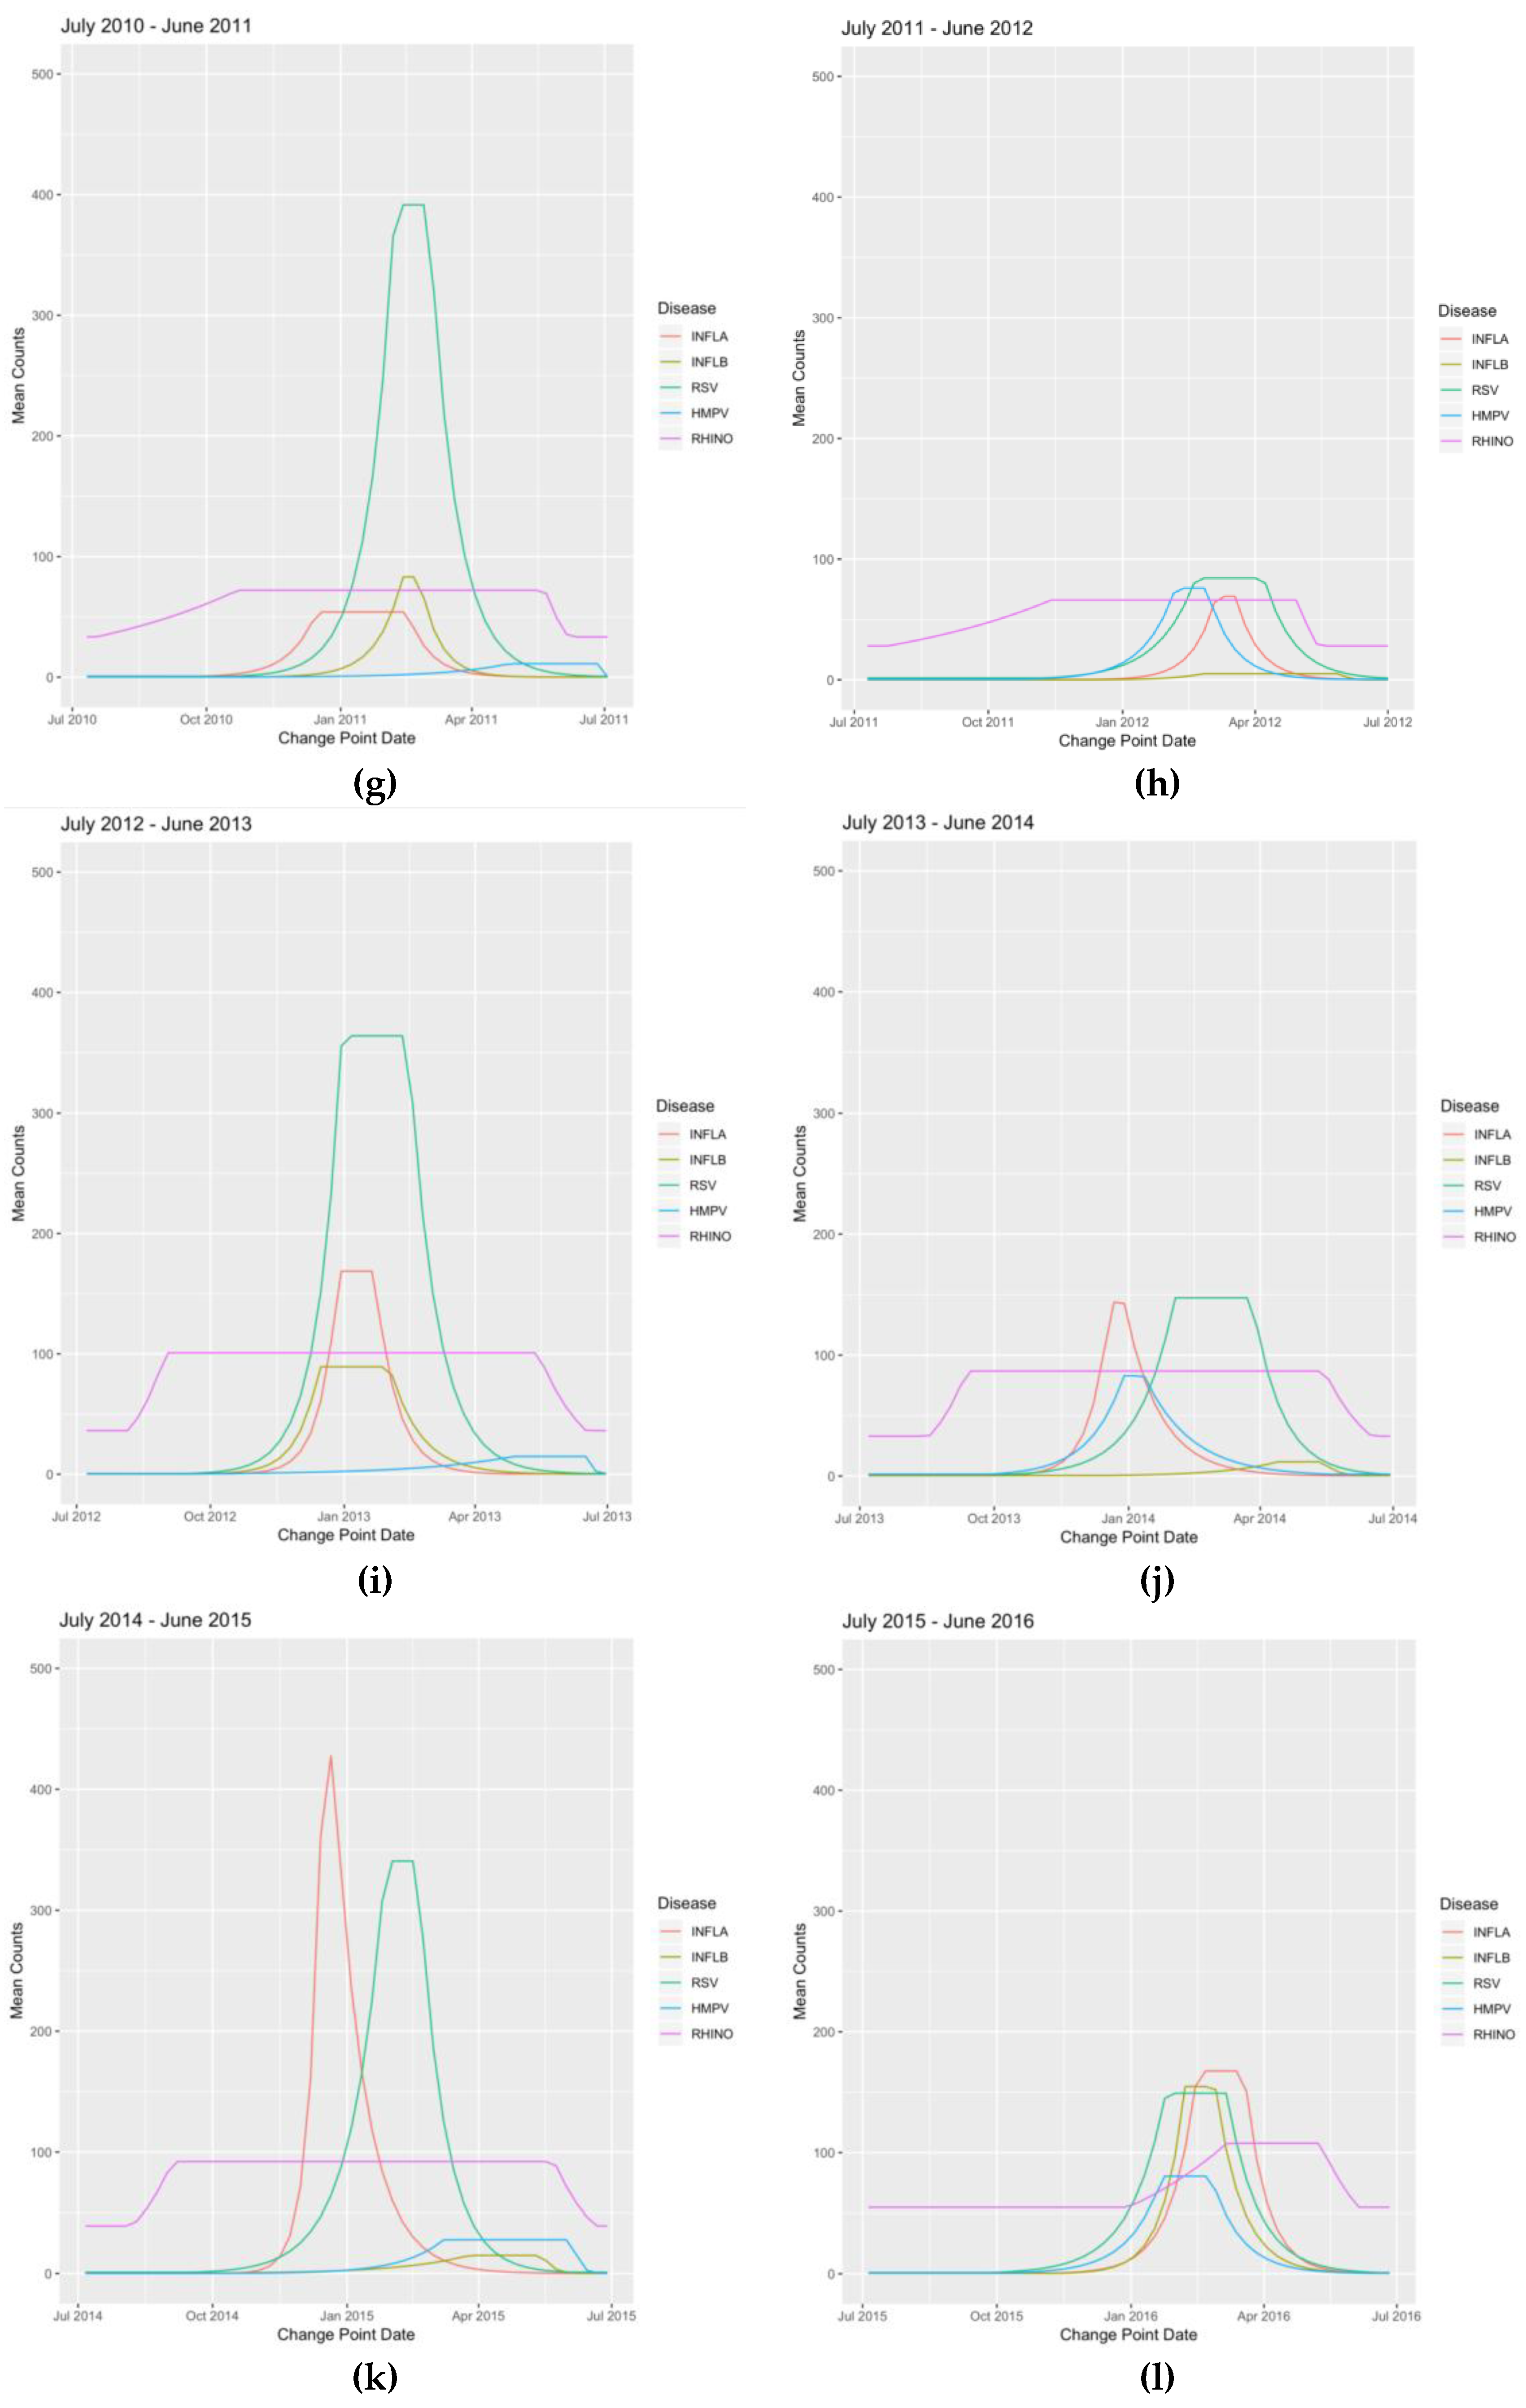
| INFLA | 0.16 | 29-Aug-2010 | 54.28 | 19-Dec-2010 | 54.28 | 13-Feb-2011 | 0.19 | 15-May-2011 |
| INFLB | 0.13 | 24-Oct-2010 | 82.83 | 13-Feb-2011 | 65.51 | 27-Feb-2011 | 0.12 | 22-May-2011 |
| RSV | 0.81 | 24-Oct-2010 | 359.79 | 6-Feb-2011 | 298.5 | 6-Mar-2011 | 0.74 | 26-Jun-2011 |
| EV | 0.2 | 26-Sep-2010 | 17.22 | 28-Nov-2010 | 9.02 | 13-Mar-2011 | 0.2 | 27-Mar-2011 |
| HMPV | 0.25 | 14-Nov-2010 | 10.47 | 24-Apr-2011 | 11.18 | 26-Jun-2011 | 11.18 | 26-Jun-2011 |
| RHINO | 34.28 | 18-Jul-2010 | 71.96 | 31-Oct-2010 | 68.09 | 22-May-2011 | 35.56 | 5-Jun-2011 |
| INFLA | 0.27 | 11-Dec-2011 | 64.15 | 4-Mar-2012 | 68.63 | 18-Mar-2012 | 0.33 | 10-Jun-2012 |
| INFLB | 0.11 | 11-Dec-2011 | 4.32 | 26-Feb-2012 | 1.87 | 3-Jun-2012 | 0.11 | 17-Jun-2012 |
| RSV | 1.59 | 6-Nov-2011 | 77.52 | 19-Feb-2012 | 80.14 | 8-Apr-2012 | 1.59 | 1-Jul-2012 |
| EV | 0.14 | 24-Jul-2011 | 6.02 | 30-Oct-2011 | 6.09 | 22-Jan-2012 | 0.18 | 4-Mar-2012 |
| HMPV | 0.53 | 23-Oct-2011 | 71.79 | 5-Feb-2012 | 75.82 | 26-Feb-2012 | 0.5 | 27-May-2012 |
| RHINO | 28.29 | 24-Jul-2011 | 65.47 | 13-Nov-2011 | 65.94 | 29-Apr-2012 | 30.5 | 13-May-2012 |
| INFLA | 0.44 | 14-Oct-2012 | 188.14 | 30-Dec-2012 | 188.14 | 20-Jan-2013 | 0.39 | 21-Apr-2013 |
| INFLB | 0.19 | 16-Sep-2012 | 89.48 | 16-Dec-2012 | 82.1 | 3-Feb-2013 | 0.2 | 9-Jun-2013 |
| RSV | 0.58 | 16-Sep-2012 | 361.83 | 30-Dec-2012 | 307.44 | 17-Feb-2013 | 0.66 | 16-Jun-2013 |
| EV | 0.17 | 29-Jul-2012 | 4.79 | 23-Dec-2012 | 4.81 | 24-Feb-2013 | 0.18 | 31-Mar-2013 |
| HMPV | 0.51 | 23-Sep-2012 | 14.82 | 28-Apr-2013 | 2.43 | 23-Jun-2013 | 2.43 | 23-Jun-2013 |
| RHINO | 37.46 | 5-Aug-2012 | 111.59 | 2-Sep-2012 | 111.59 | 12-May-2013 | 36.56 | 16-Jun-2013 |
| INFLA | 0.47 | 6-Oct-2013 | 139.96 | 22-Dec-2013 | 139.66 | 29-Dec-2013 | 0.41 | 18-May-2014 |
| INFLB | 0.5 | 15-Dec-2013 | 9.83 | 13-Apr-2014 | 10.06 | 11-May-2014 | 0.55 | 8-Jun-2014 |
| RSV | 1.51 | 13-Oct-2013 | 147.94 | 2-Feb-2014 | 147.94 | 23-Mar-2014 | 1.75 | 22-Jun-2014 |
| EV | 0.51 | 1-Sep-2013 | 5.12 | 24-Nov-2013 | 5.45 | 2-Mar-2014 | 0.53 | 30-Mar-2014 |
| HMPV | 1.71 | 29-Sep-2013 | 83.57 | 29-Dec-2013 | 82.58 | 12-Jan-2014 | 1.55 | 18-May-2014 |
| RHINO | 32.91 | 18-Aug-2013 | 77.13 | 8-Sep-2013 | 80.62 | 18-May-2014 | 34.15 | 15-Jun-2014 |
| INFLA | 0.24 | 12-Oct-2014 | 359.06 | 14-Dec-2014 | 425.62 | 21-Dec-2014 | 0.21 | 31-May-2015 |
| INFLB | 0.22 | 7-Sep-2014 | 14.18 | 22-Mar-2015 | 10.81 | 17-May-2015 | 0.35 | 7-Jun-2015 |
| RSV | 1.05 | 21-Sep-2014 | 318.54 | 25-Jan-2015 | 343.49 | 15-Feb-2015 | 1.12 | 31-May-2015 |
| EV | 0.7 | 31-Aug-2014 | 6.91 | 2-Nov-2014 | 6.36 | 8-Feb-2015 | 0.65 | 29-Mar-2015 |
| HMPV | 0.28 | 26-Oct-2014 | 27.03 | 8-Mar-2015 | 14.98 | 7-Jun-2015 | 0.46 | 21-Jun-2015 |
| RHINO | 42.48 | 10-Aug-2014 | 82.43 | 31-Aug-2014 | 91.02 | 24-May-2015 | 39.21 | 21-Jun-2015 |
| INFLA | 0.51 | 1-Nov-2015 | 157.73 | 14-Feb-2016 | 159.17 | 20-Mar-2016 | 0.52 | 12-Jun-2016 |
| INFLB | 0.53 | 15-Nov-2015 | 152.9 | 7-Feb-2016 | 150.72 | 28-Feb-2016 | 0.44 | 12-Jun-2016 |
| RSV | 1.07 | 27-Sep-2015 | 143.45 | 24-Jan-2016 | 149.23 | 6-Mar-2016 | 0.98 | 19-Jun-2016 |
| EV | 0.56 | 5-Jul-2015 | 4.16 | 20-Dec-2015 | 3.85 | 7-Feb-2016 | 0.67 | 28-Feb-2016 |
| HMPV | 0.81 | 11-Oct-2015 | 80.3 | 24-Jan-2016 | 68.35 | 28-Feb-2016 | 0.81 | 29-May-2016 |
| RHINO | 55.46 | 27-Dec-2015 | 97.15 | 6-Mar-2016 | 99.8 | 8-May-2016 | 54.9 | 5-Jun-2016 |
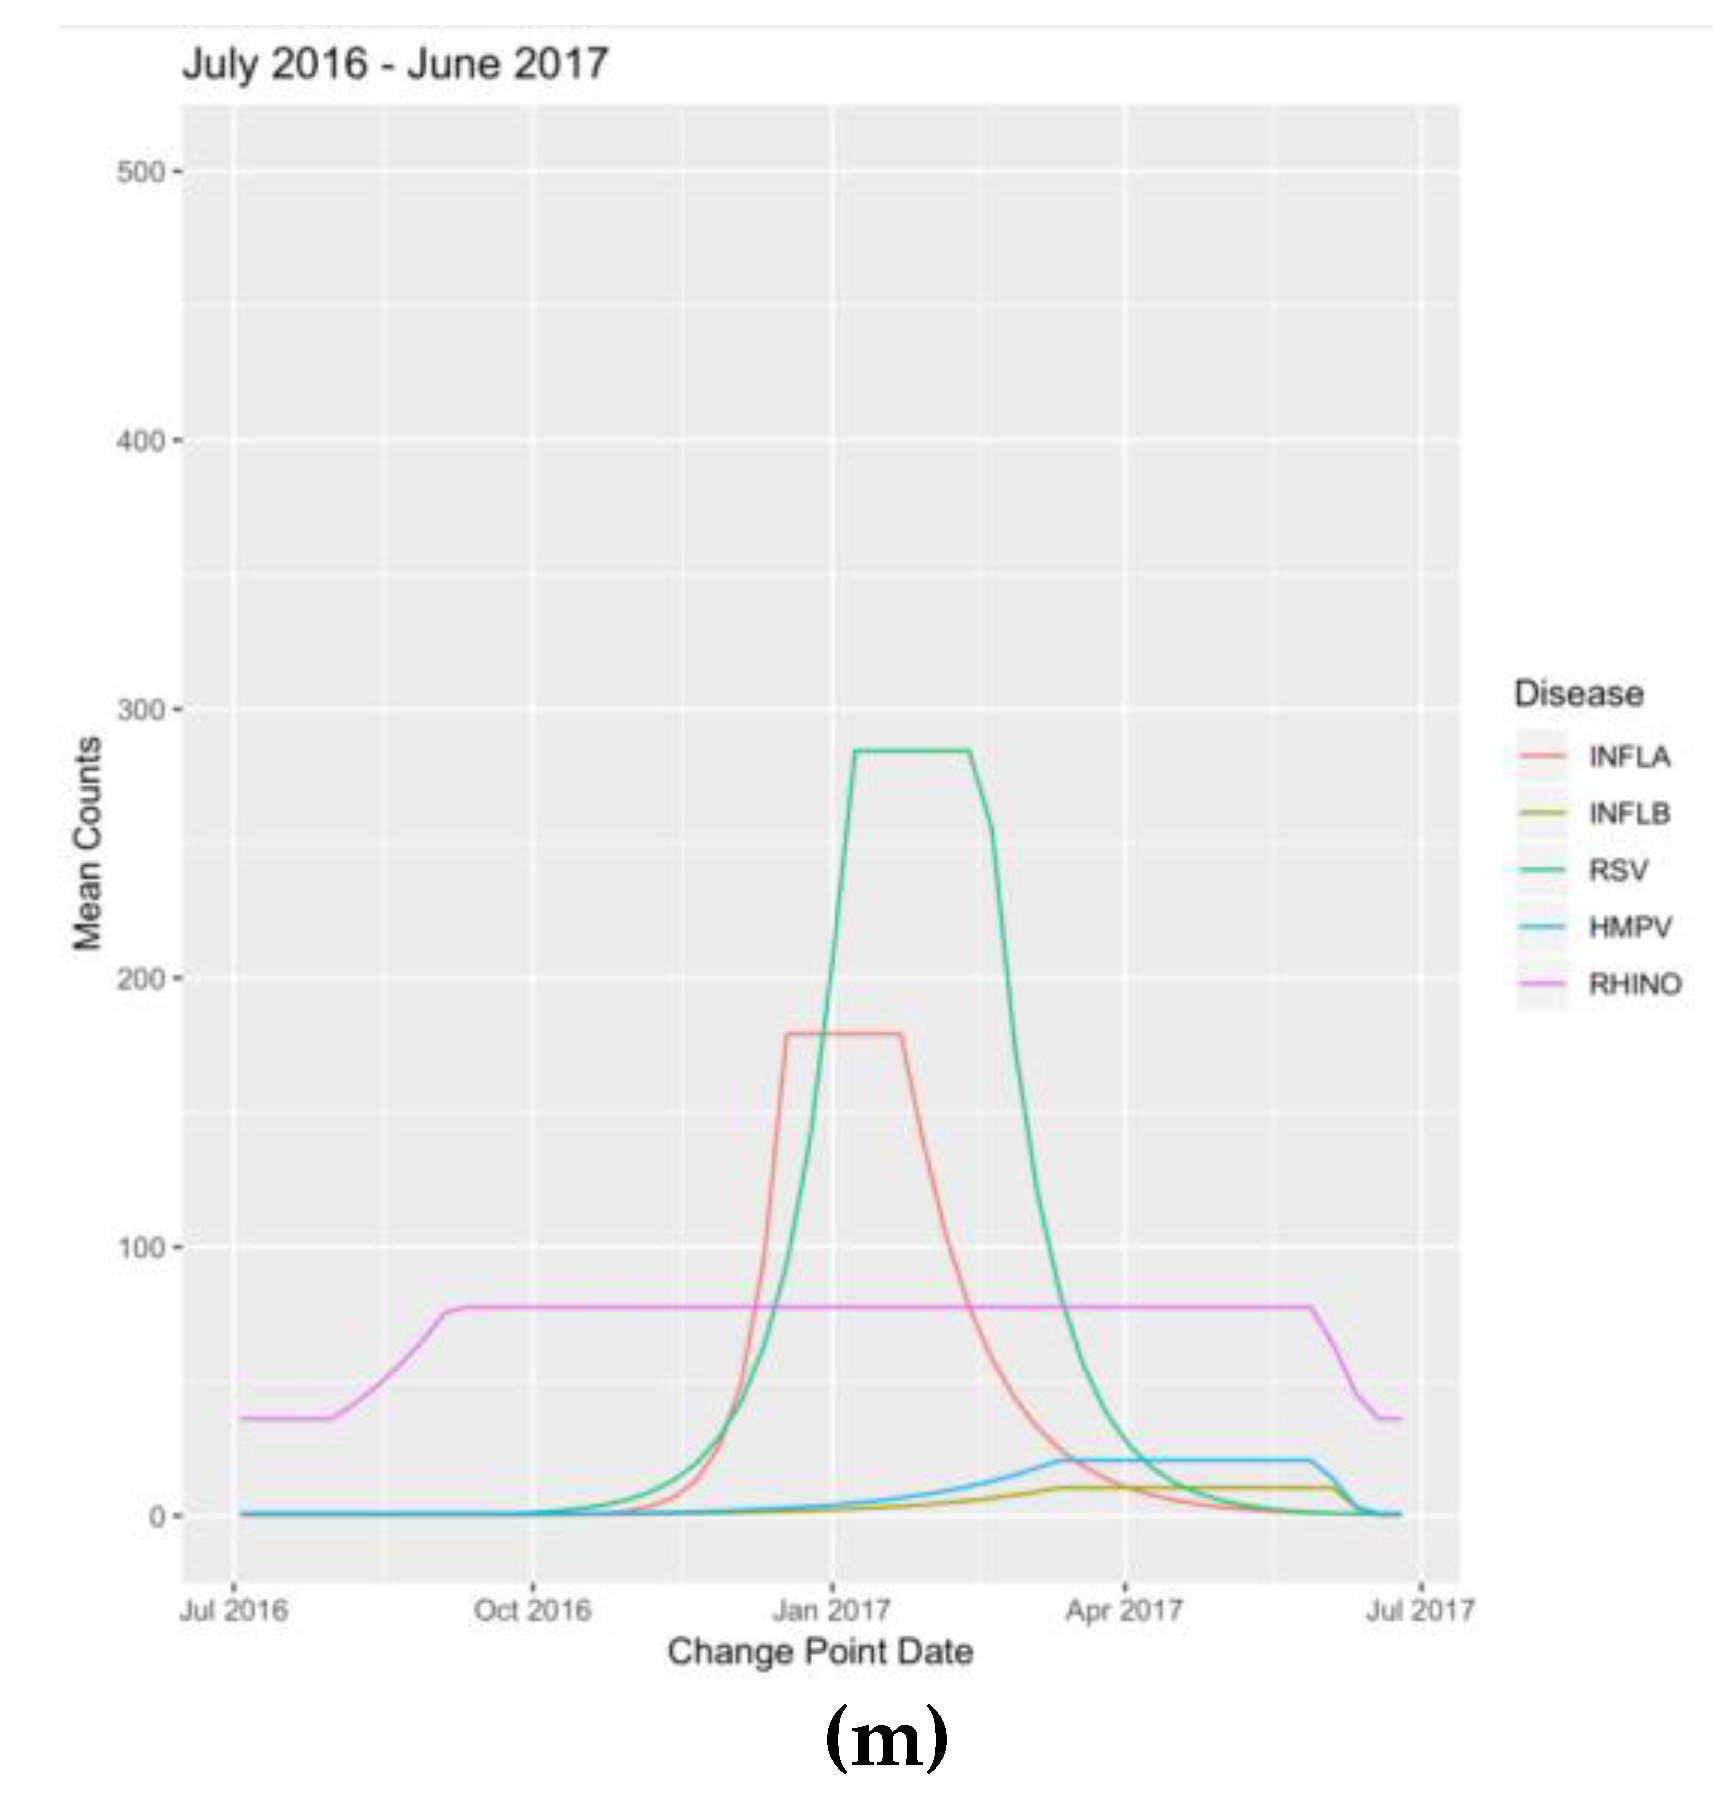
| INFLA | 0.91 | 23-Oct-2016 | 179.9 | 18-Dec-2016 | 179.9 | 22-Jan-2017 | 1.03 | 28-May-2017 |
| INFLB | 0.23 | 25-Sep-2016 | 10.18 | 5-Mar-2017 | 3.34 | 11-Jun-2017 | 0.24 | 18-Jun-2017 |
| RSV | 0.74 | 18-Sep-2016 | 262.02 | 8-Jan-2017 | 234.19 | 19-Feb-2017 | 0.62 | 11-Jun-2017 |
| EV | 0.26 | 17-Jul-2016 | 3.36 | 4-Dec-2016 | 3.32 | 15-Jan-2017 | 0.31 | 12-Feb-2017 |
| HMPV | 0.46 | 25-Sep-2016 | 19.91 | 12-Mar-2017 | 13.04 | 4-Jun-2017 | 0.8 | 18-Jun-2017 |
| RHINO | 37.25 | 31-Jul-2016 | 69.49 | 4-Sep-2016 | 72.69 | 28-May-2017 | 35.87 | 18-Jun-2017 |
| Seasonal Year | Duration (Weeks) | Influenza A | Influenza B | RSV | HMPV | Rhinovirus | Enterovirus |
|---|---|---|---|---|---|---|---|
| 2004–2005 | Peak | 8 | 7 | 2 | 9 | NA | NA |
| Epidemic | 30 | 27 | 37 | 35 | NA | NA | |
| 2005–2006 | Peak | 1 | 10 | 5 | 4 | NA | NA |
| Epidemic | 16 | 34 | 32 | 26 | NA | NA | |
| 2006–2007 | Peak | 3 | 10 | 7 | 8 | 9 | NA |
| Epidemic | 42 | 30 | 36 | 35 | 20 | NA | |
| 2007–2008 | Peak | 2 | 5 | 4 | 14 | 18 | 29 |
| Epidemic | 24 | 23 | 35 | 30 | 30 | 34 | |
| 2008–2009 | Peak | 21 | 7 | 4 | 5 | 10 | 9 |
| Epidemic | 26 | 26 | 36 | 26 | 26 | 22 | |
| 2009–2010 | Peak | 1 | 3 | 3 | 5 | 2 | 25 |
| Epidemic | 21 | 14 | 32 | 33 | 33 | 45 | |
| 2010–2011 | Peak | 8 | 2 | 4 | 15 | 9 | 29 |
| Epidemic | 37 | 30 | 35 | 26 | 32 | 46 | |
| 2011–2012 | Peak | 2 | 14 | 7 | 12 | 3 | 24 |
| Epidemic | 26 | 27 | 34 | 32 | 31 | 42 | |
| 2012–2013 | Peak | 3 | 7 | 7 | 9 | 8 | 36 |
| Epidemic | 27 | 38 | 39 | 35 | 39 | 45 | |
| 2013–2014 | Peak | 1 | 4 | 7 | 14 | 2 | 36 |
| Epidemic | 32 | 25 | 36 | 30 | 33 | 43 | |
| 2014–2015 | Peak | 1 | 8 | 3 | 14 | 13 | 38 |
| Epidemic | 33 | 39 | 36 | 30 | 34 | 45 | |
| 2015–2016 | Peak | 5 | 3 | 6 | 7 | 5 | 9 |
| Epidemic | 32 | 30 | 38 | 34 | 33 | 23 | |
| 2016–2017 | Peak | 5 | 14 | 6 | 6 | 12 | 38 |
| Epidemic | 31 | 38 | 38 | 30 | 38 | 46 |
Appendix B. Figures
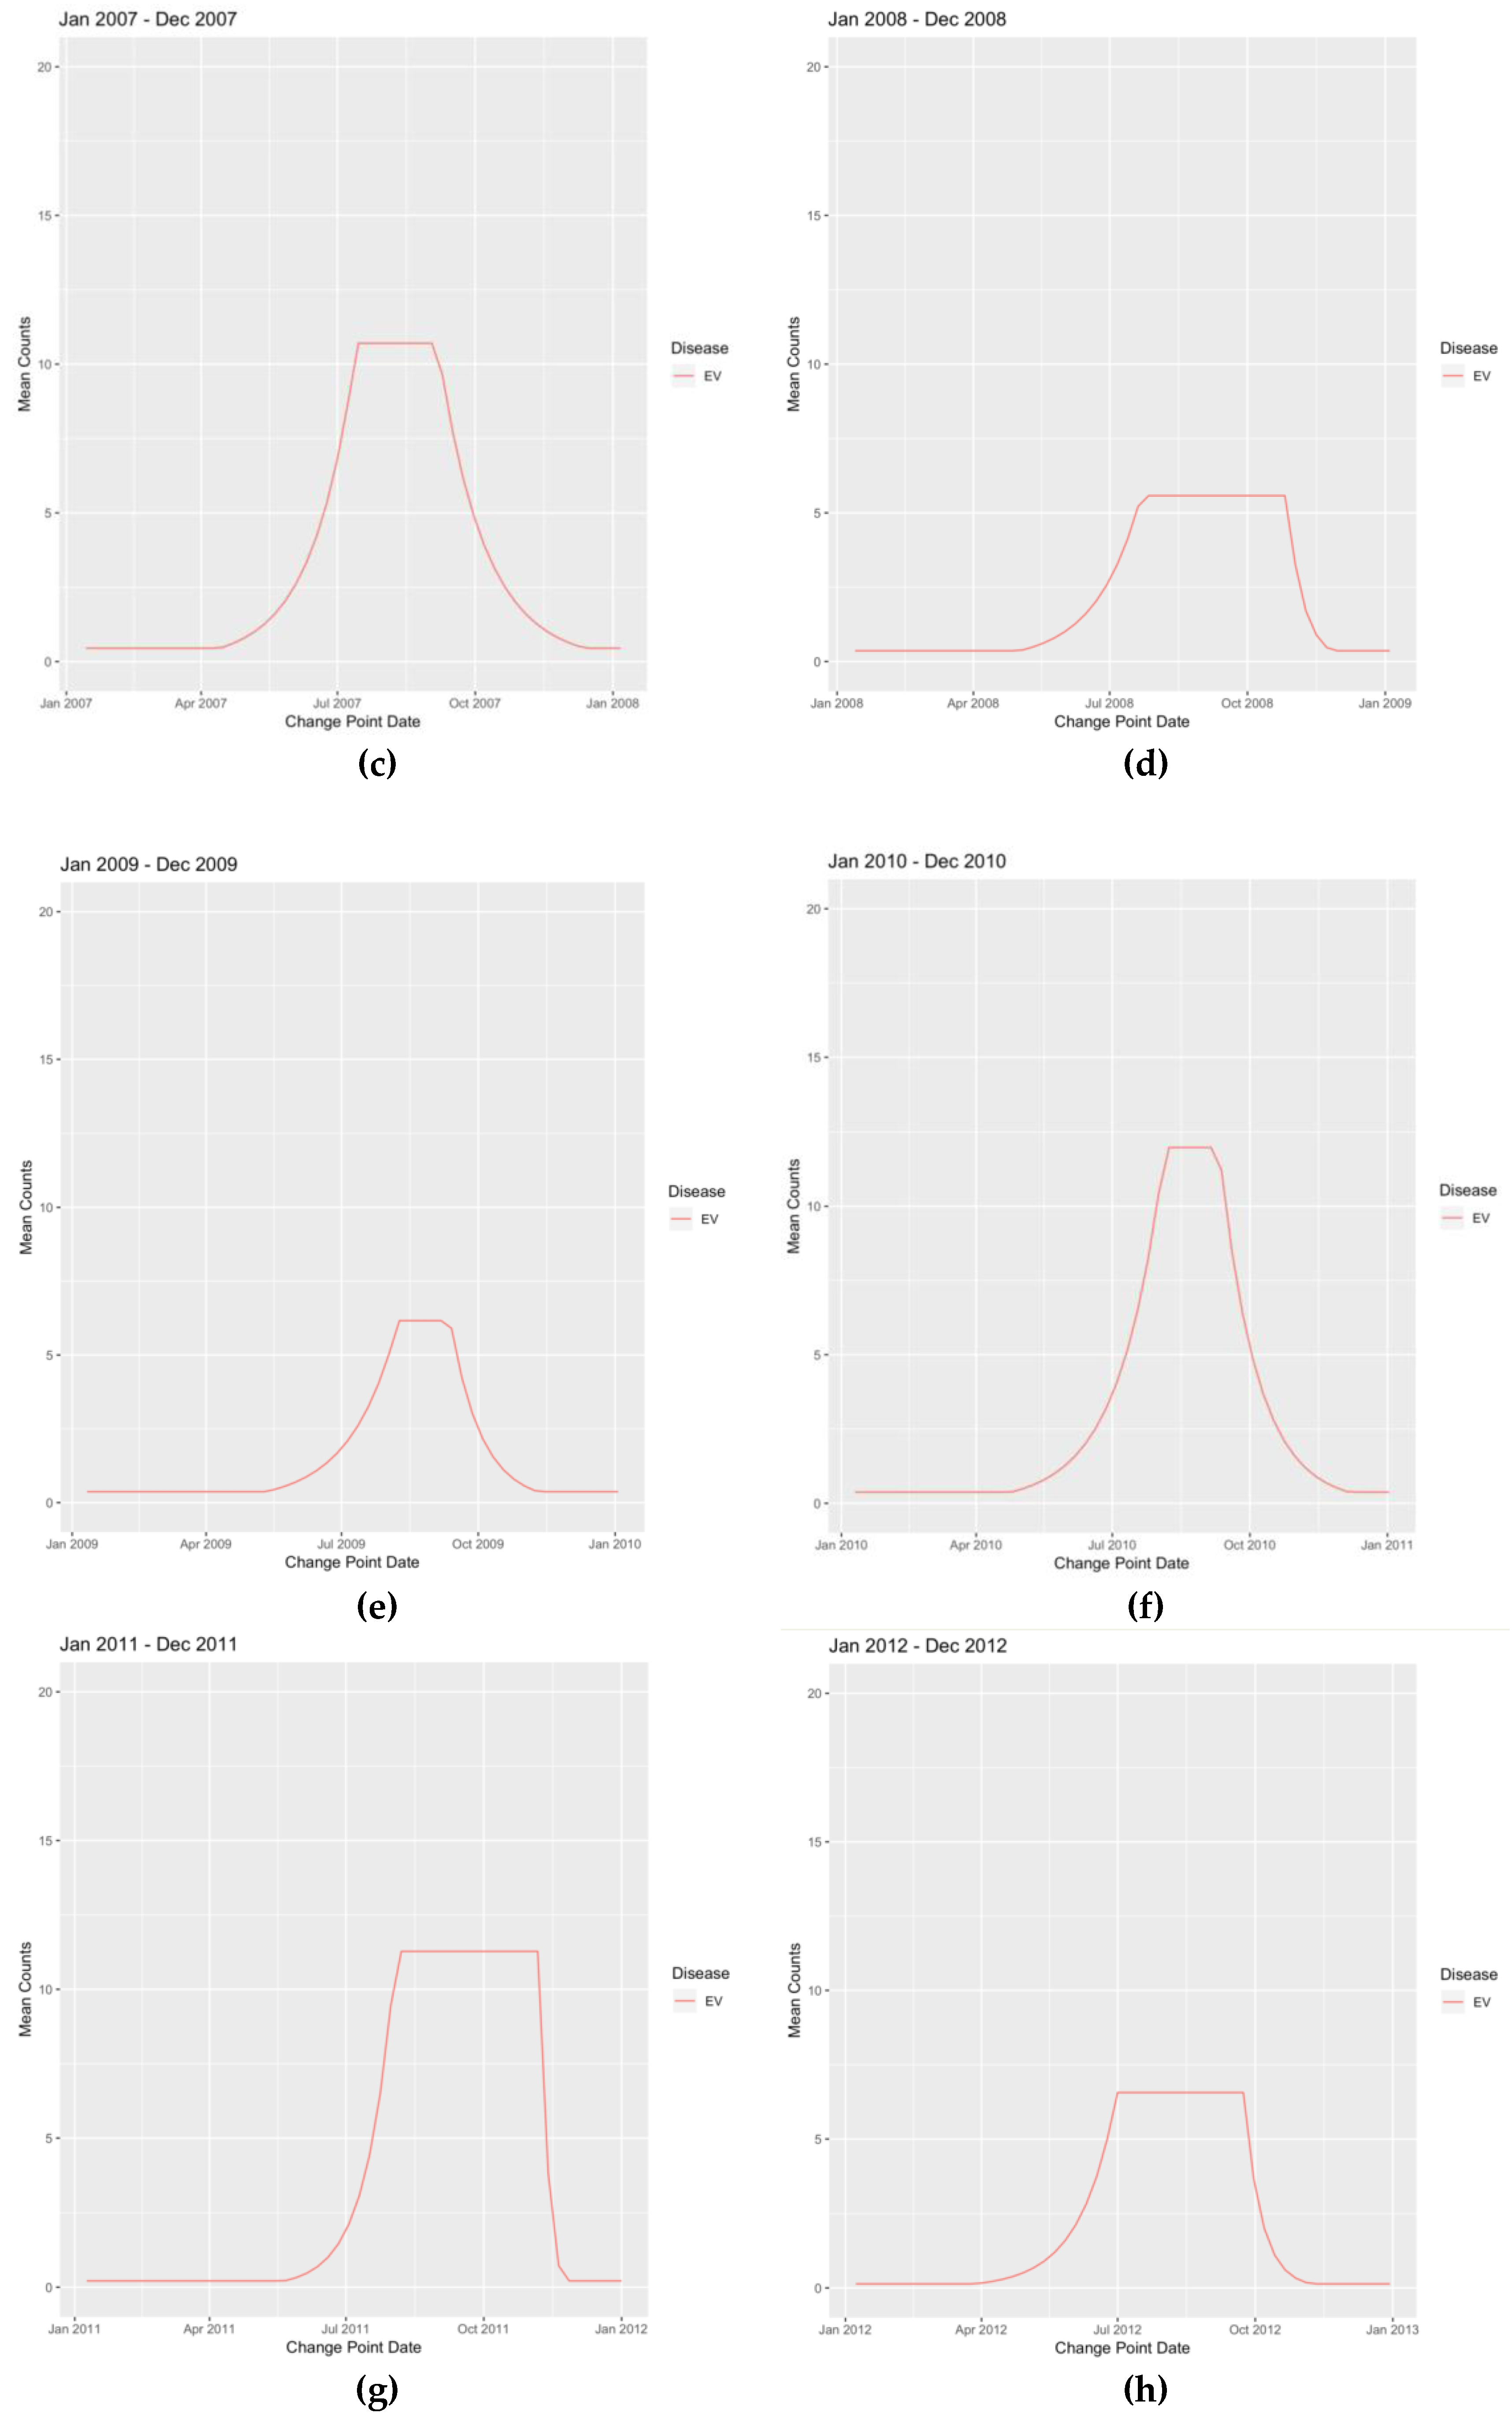
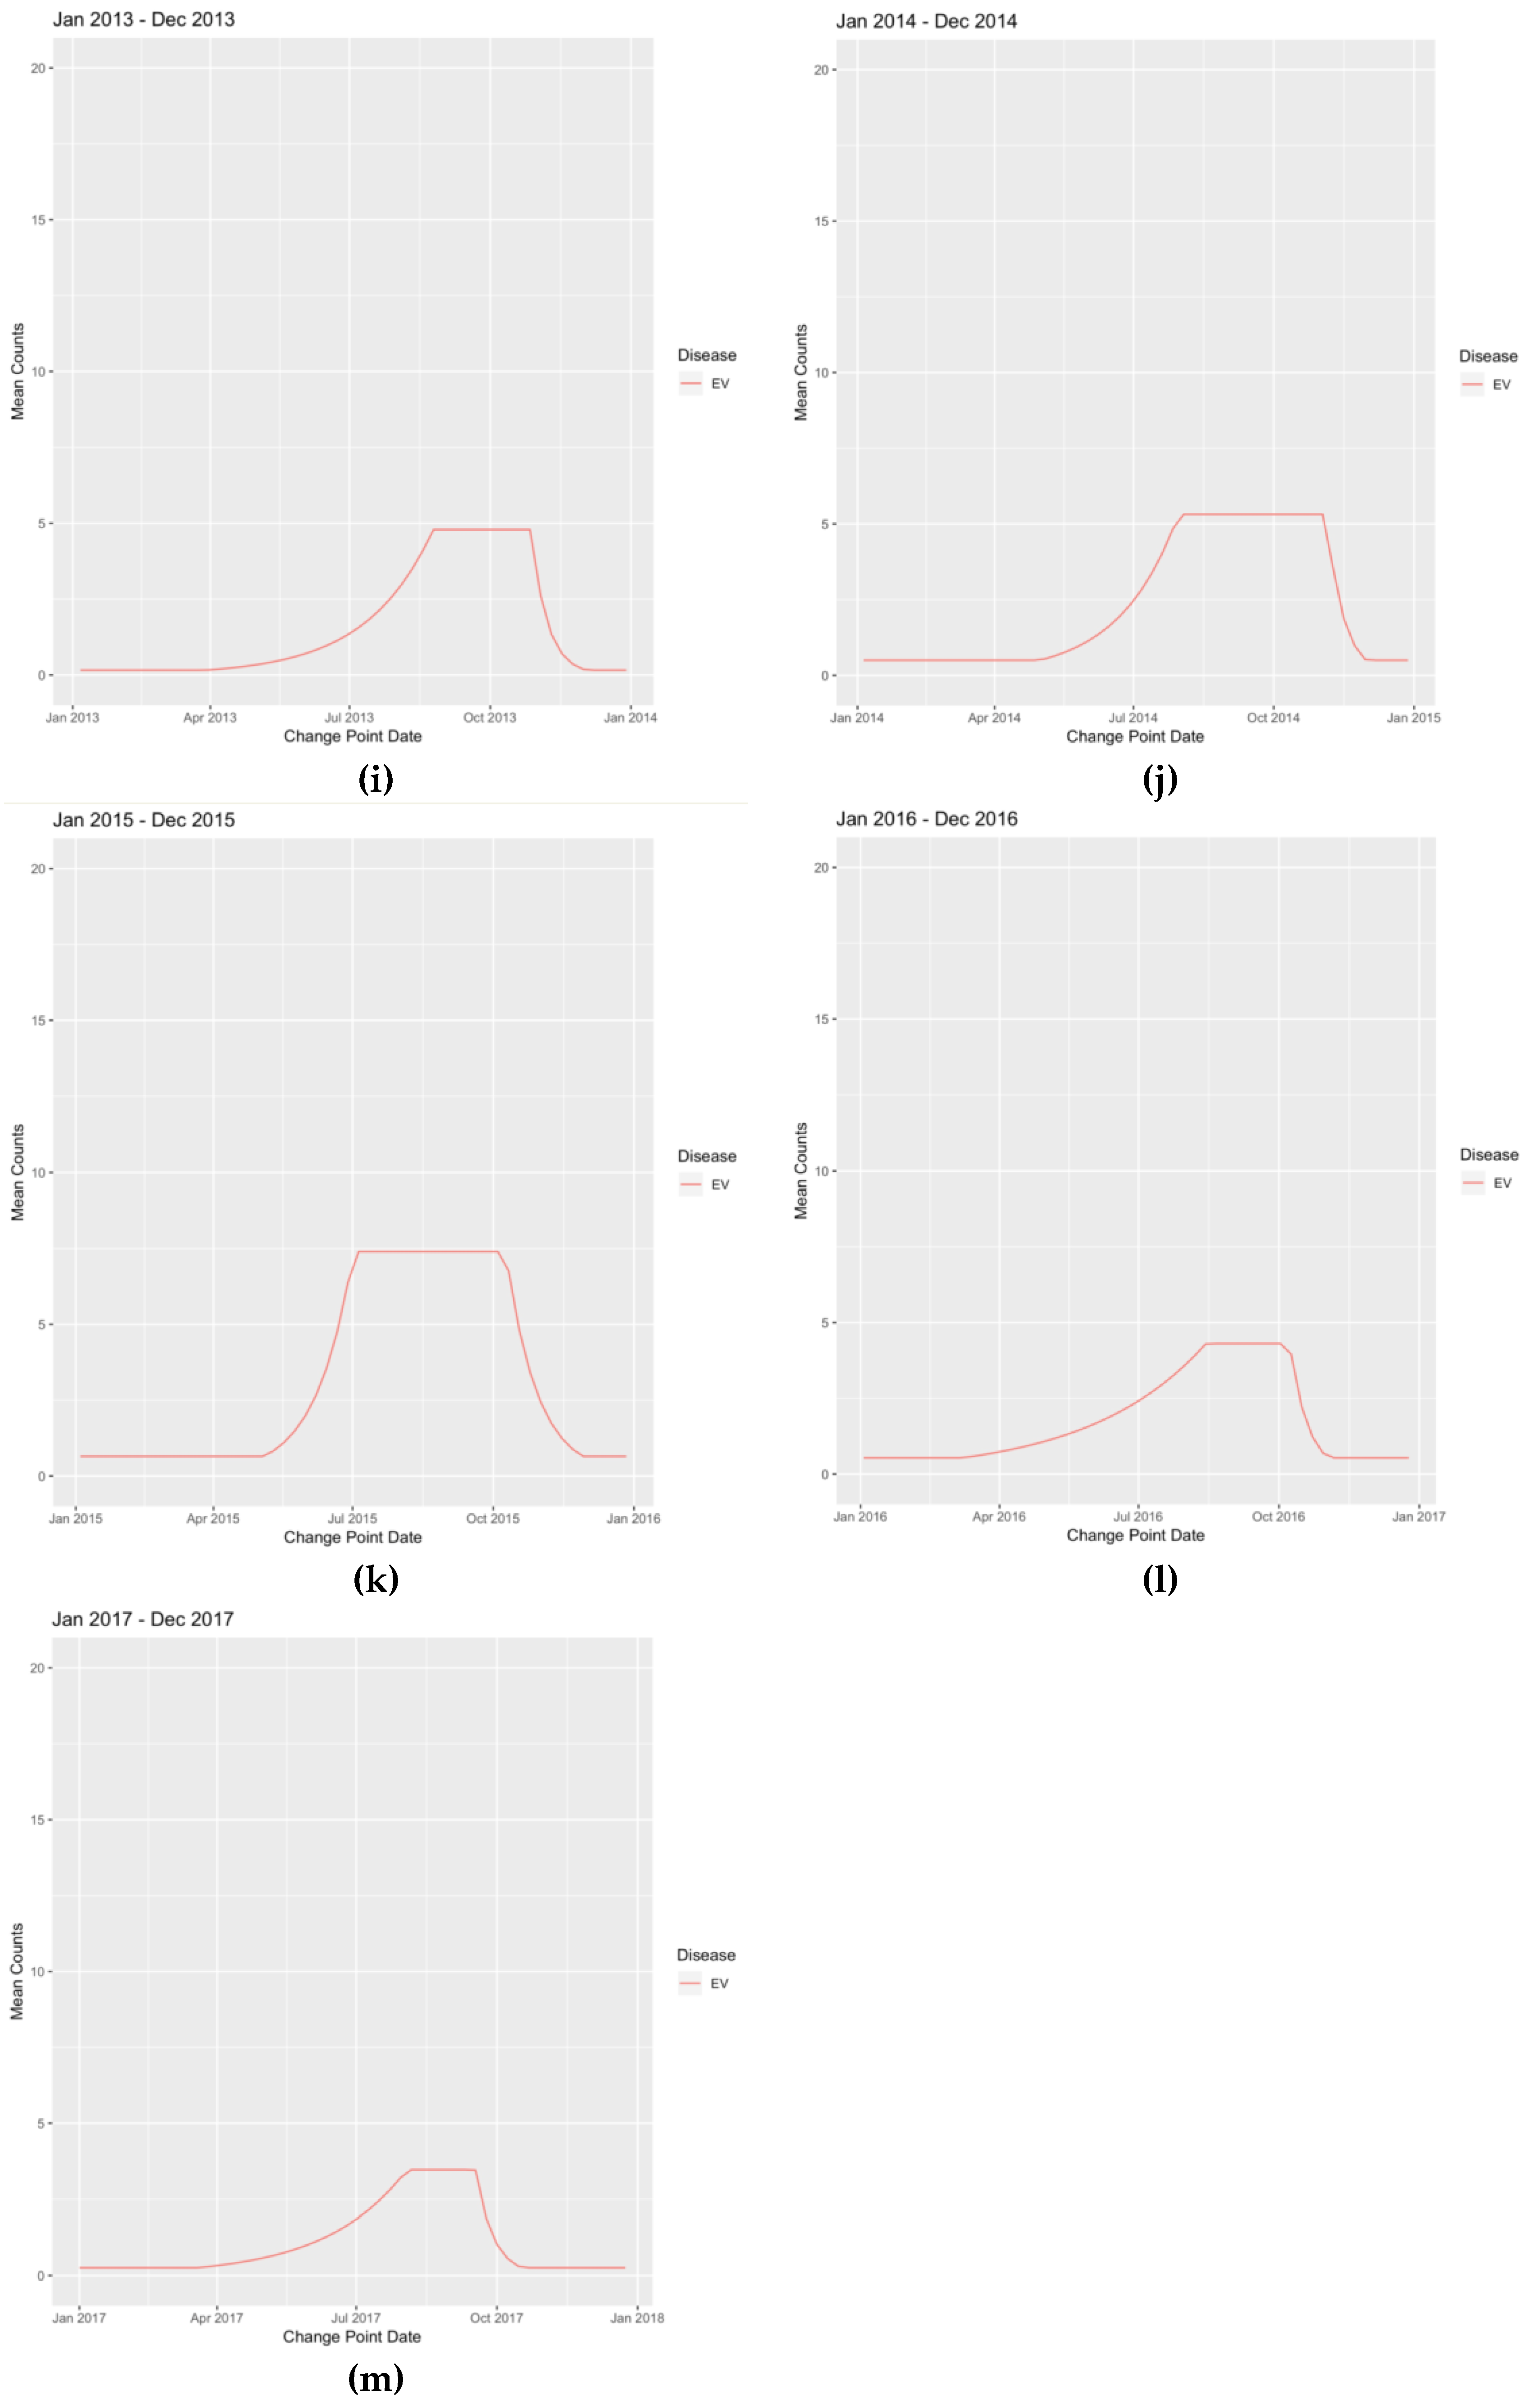
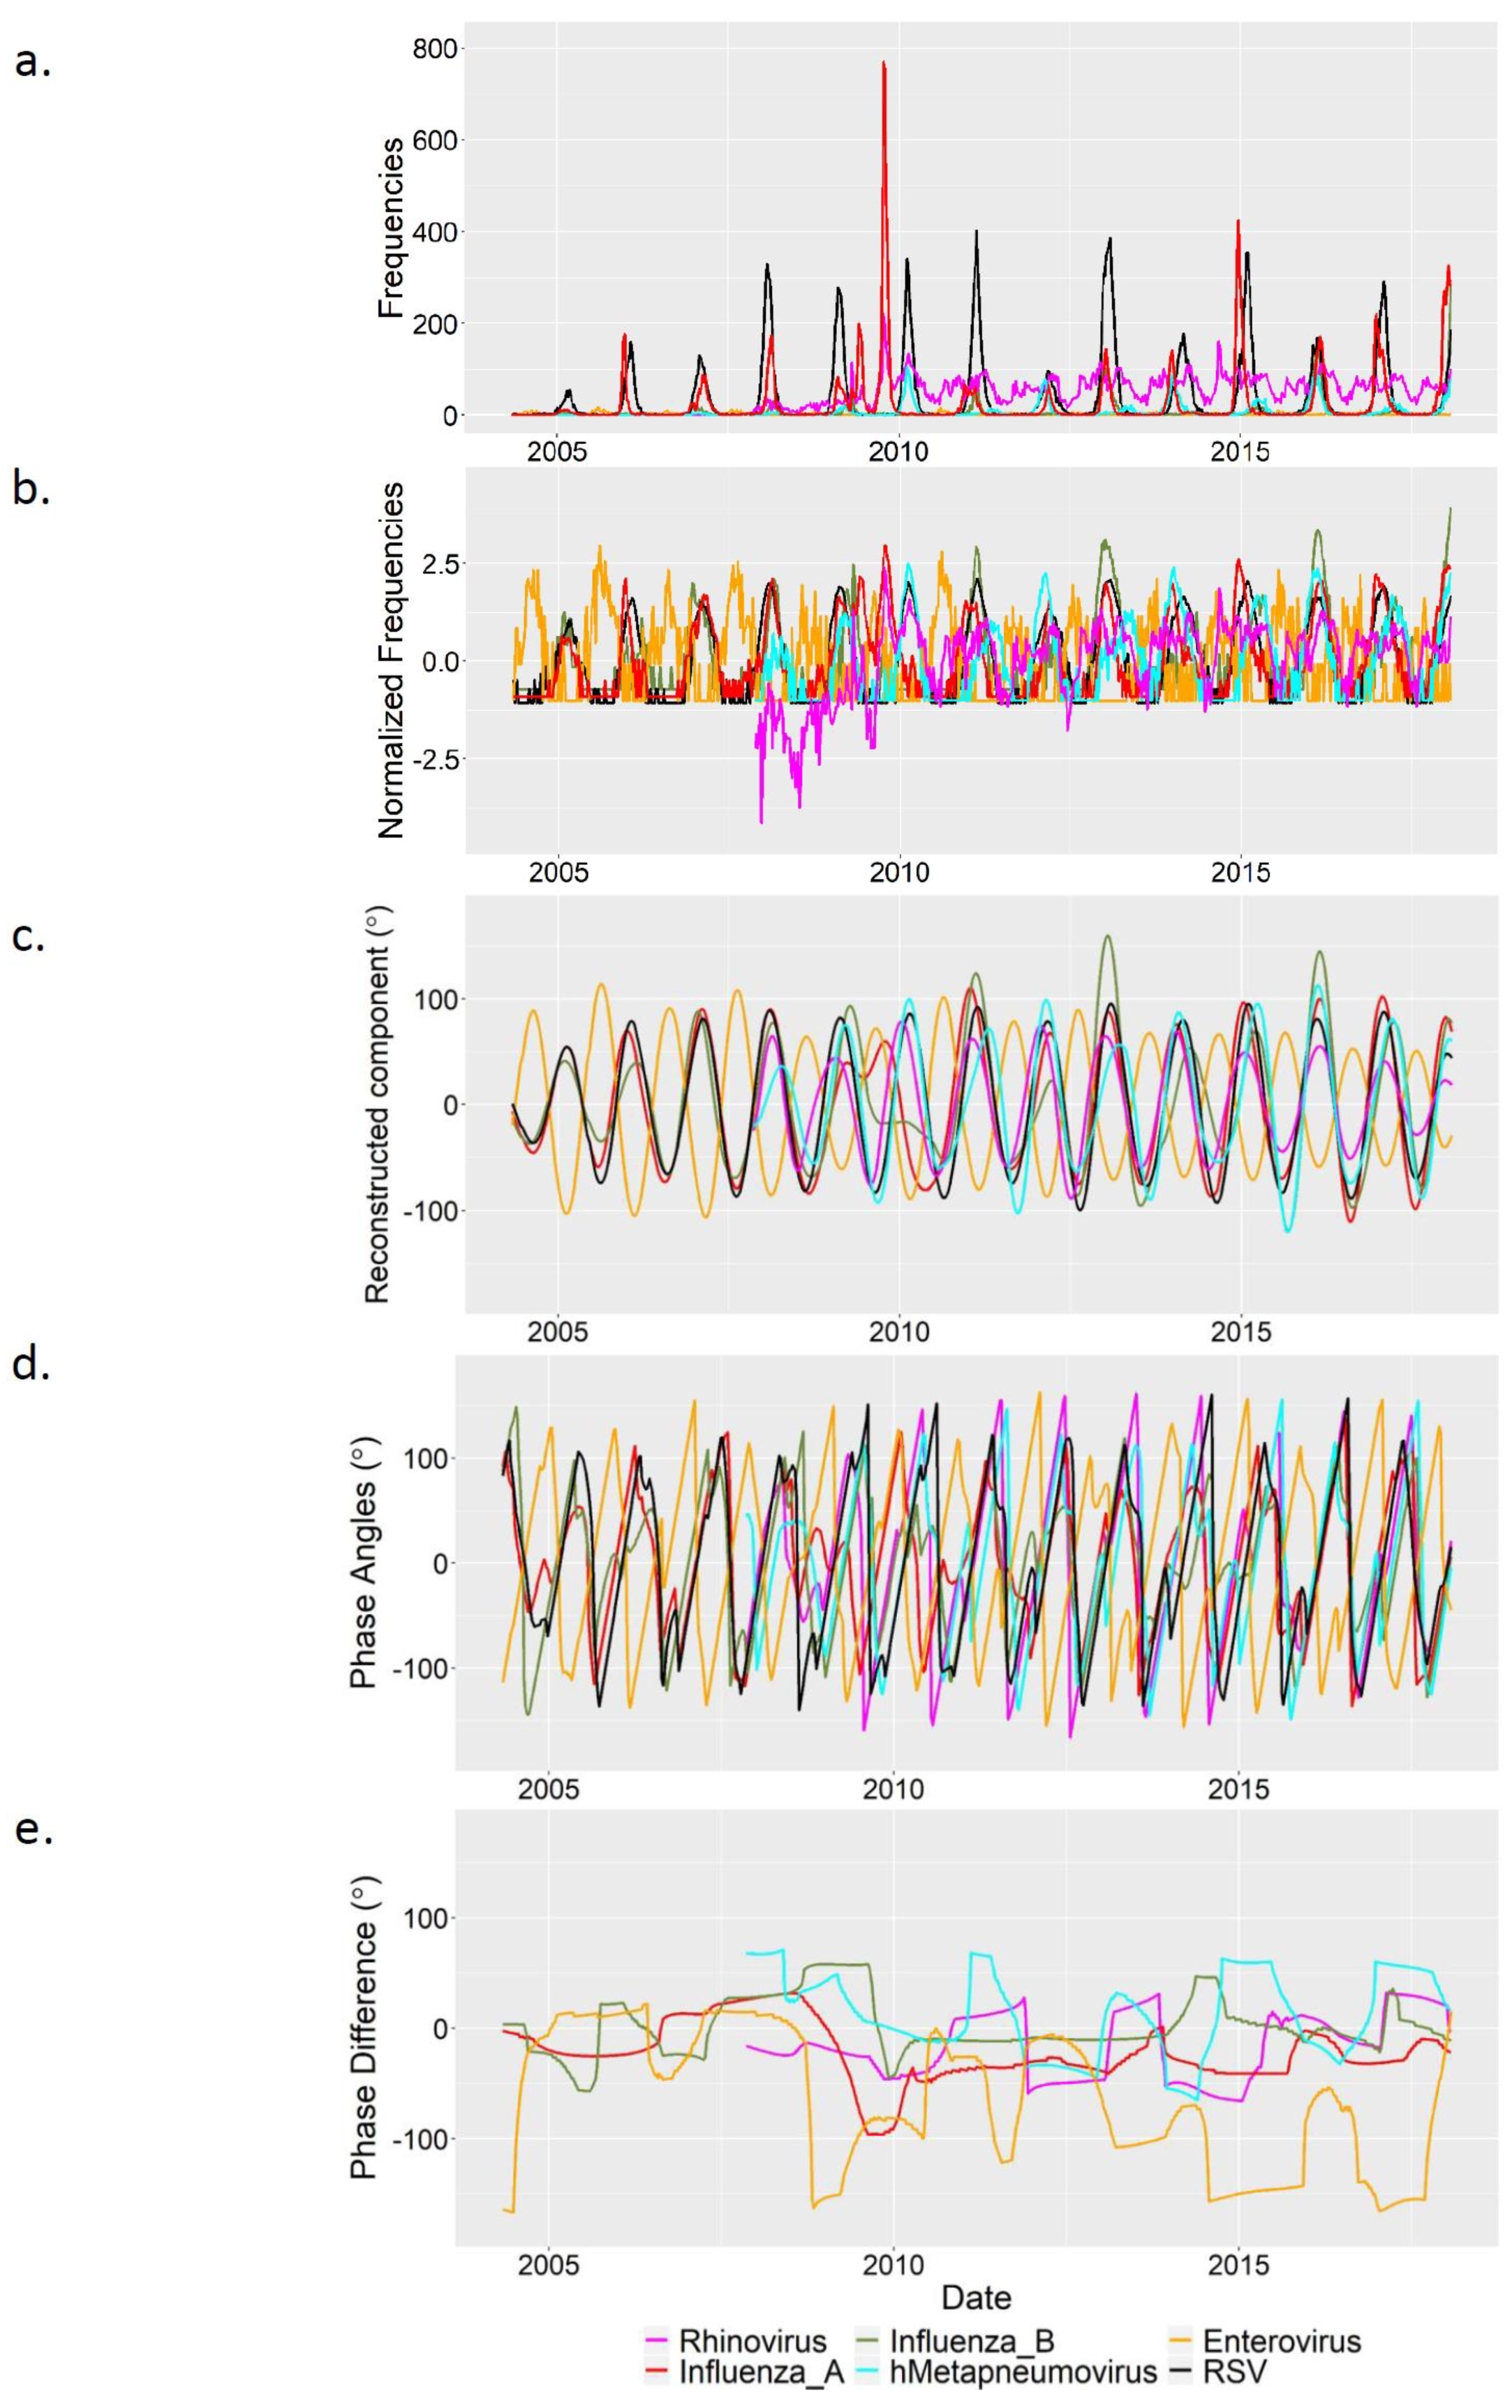
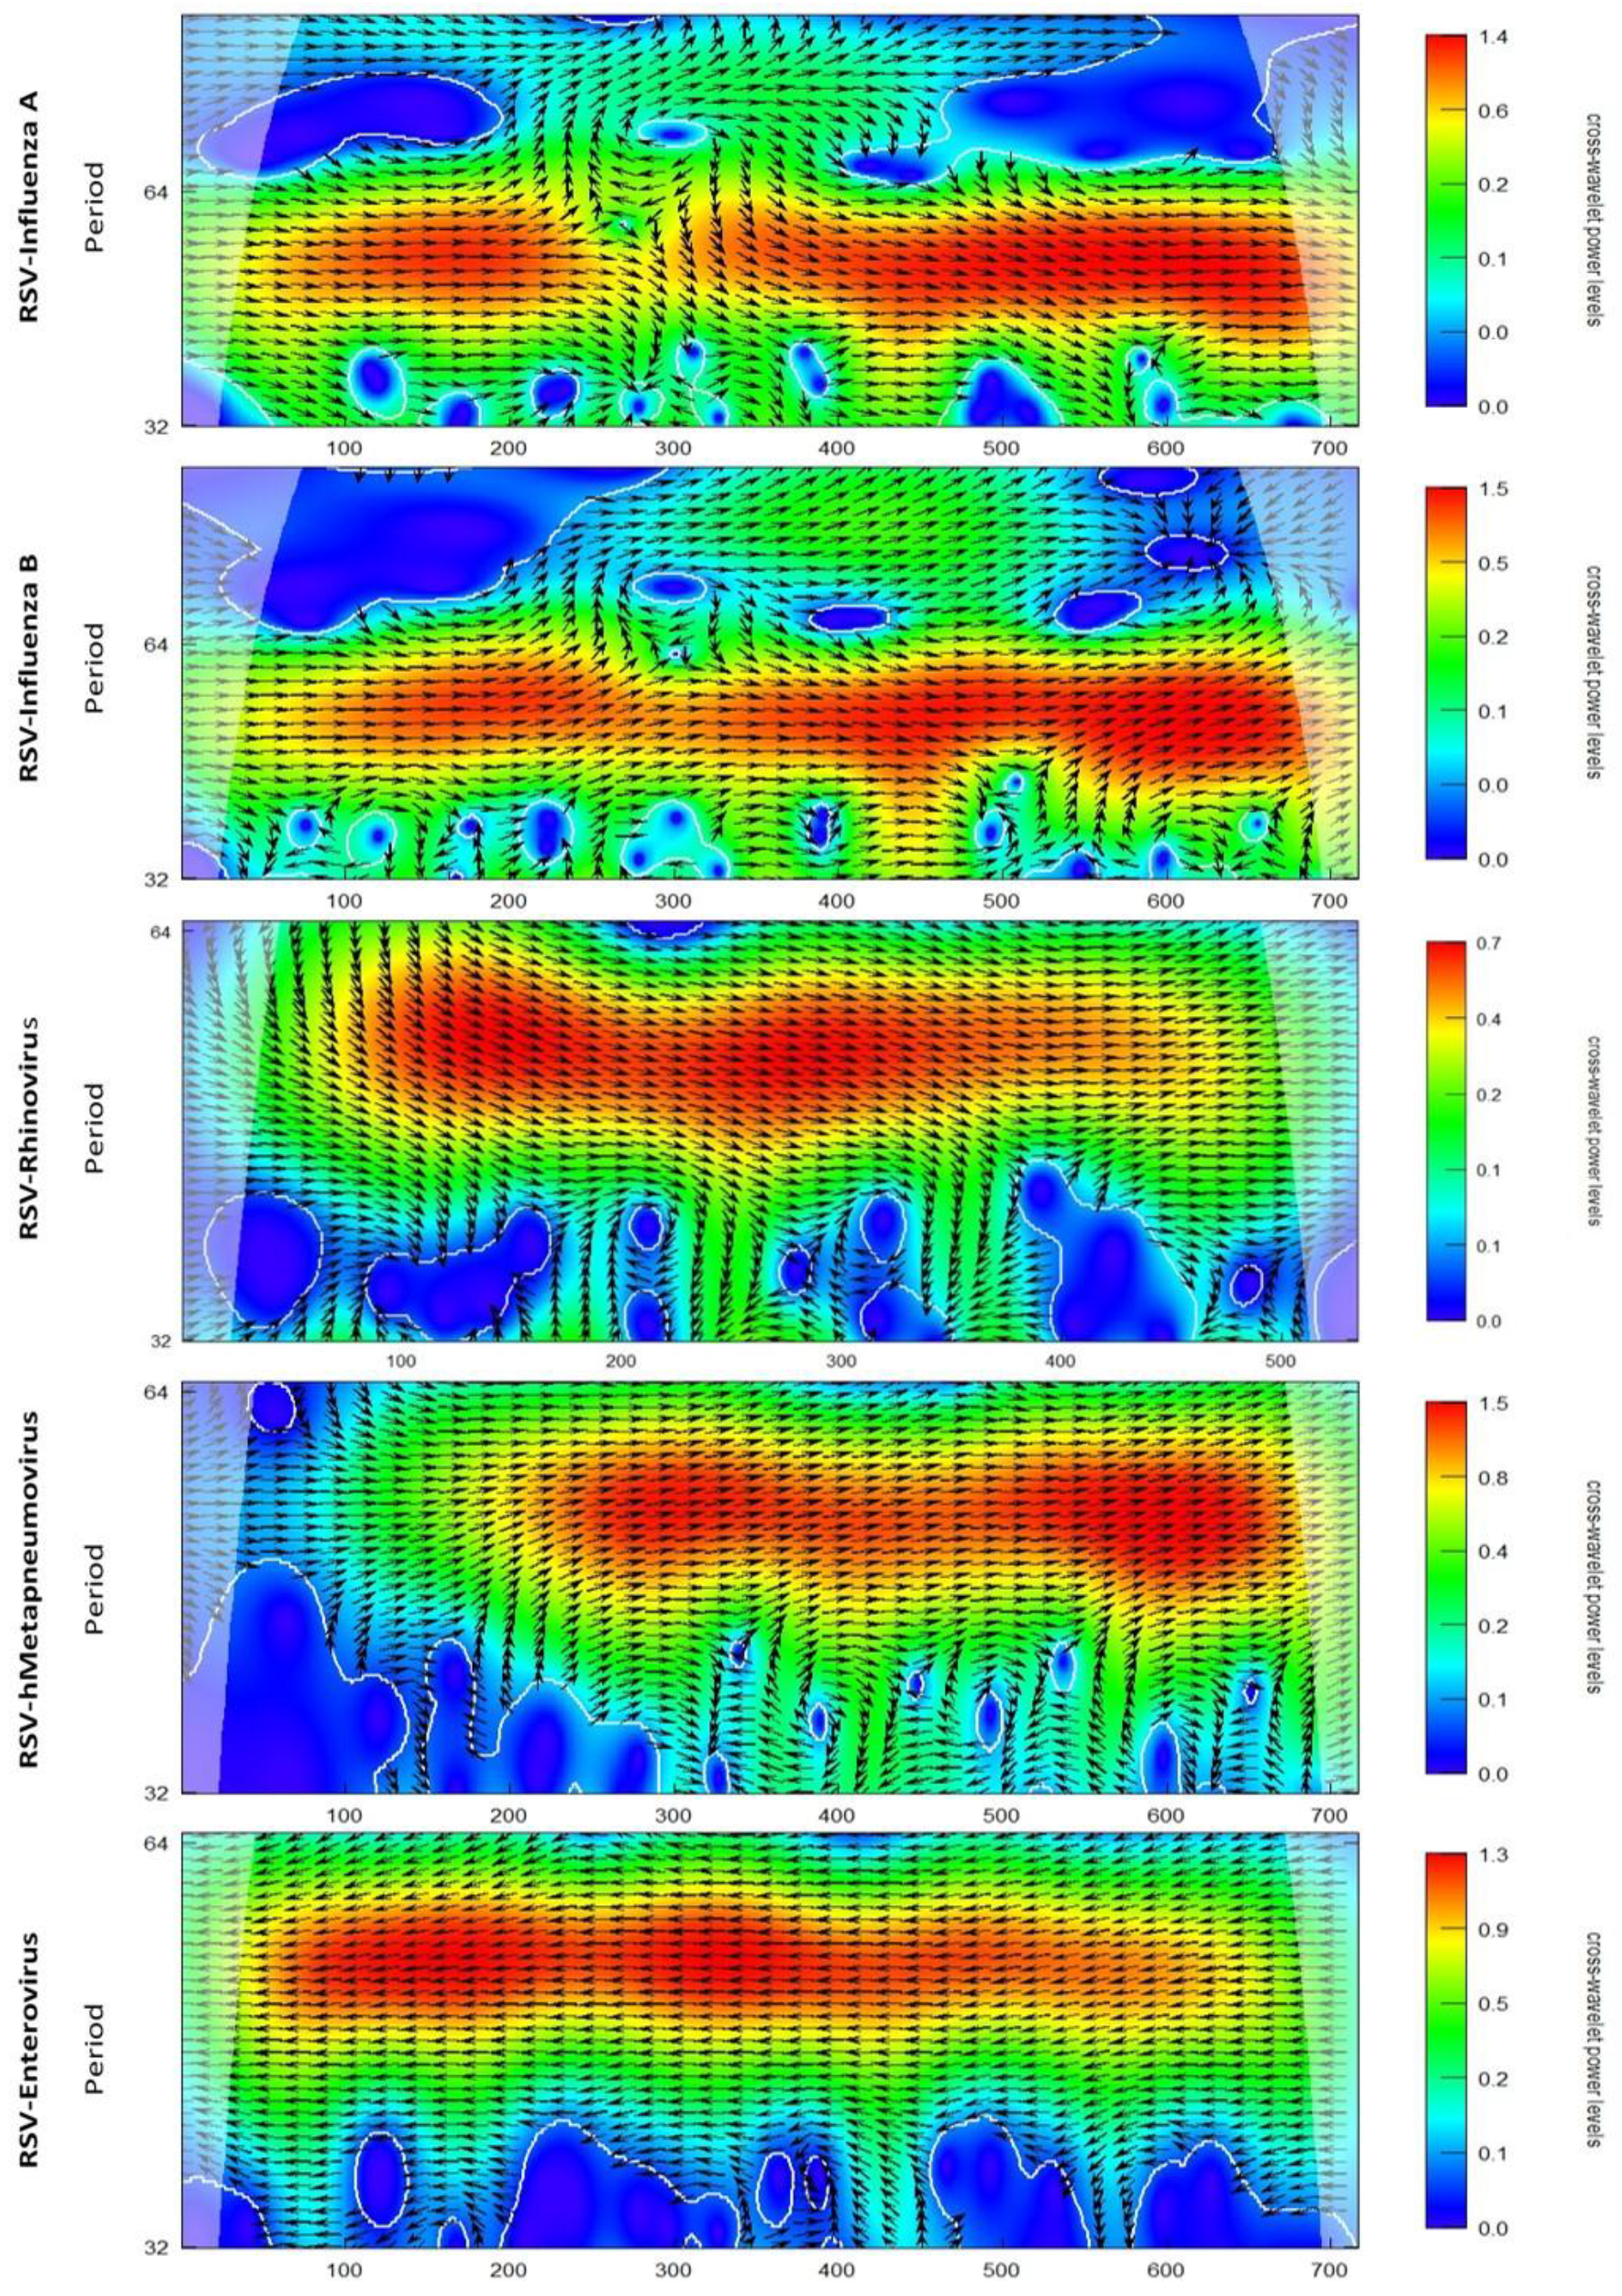
References
- Nair, H.; Nokes, D.J.; Gessner, B.D.; Dherani, M.; Madhi, S.A.; Singleton, R.J.; O’Brien, K.L.; Roca, A.; Wright, P.F.; Bruce, N.; et al. Global burden of acute lower respiratory infections due to respiratory syncytial virus in young children: A systematic review and meta-analysis. Lancet 2010, 375, 1545–1555. [Google Scholar] [CrossRef]
- Dawood, F.S.; Iuliano, A.D.; Reed, C.; Meltzer, M.I.; Shay, D.K.; Cheng, P.-Y.; Bandaranayake, D.; Breiman, R.F.; Brooks, W.A.; Buchy, P.; et al. Estimated global mortality associated with the first 12 months of 2009 pandemic influenza A H1N1 virus circulation: A modelling study. Lancet Infect. Dis. 2012, 12, 687–695. [Google Scholar] [CrossRef]
- Rose, E.B.; Wheatley, A.; Langley, G.; Gerber, S.; Haynes, A. Respiratory Syncytial Virus Seasonality-United States, 2014–2017. Mmwr. Morb. Mortal. Wkly. Rep. 2018, 67, 71–76. [Google Scholar] [CrossRef]
- Centers for Disease Control and Prevention. Overview of Influenza Surveillance in the United States. Available online: https://www.cdc.gov/flu/weekly/overview.htm (accessed on 1 January 2019).
- Centers for Disease Control and Prevention. Respiratory Syncytial Virus Infection (RSV): Trends and Surveillance. 2018. Available online: https://www.cdc.gov/rsv/research/us-surveillance.html (accessed on 27 May 2019).
- Esper, F.P.; Spahlinger, T.; Zhou, L. Rate and influence of respiratory virus co-infection on pandemic (H1N1) influenza disease. J. Infect. 2011, 63, 260–266. [Google Scholar] [CrossRef]
- Debiaggi, M.; Canducci, F.; Ceresola, E.R.; Clementi, M. The role of infections and coinfections with newly identified and emerging respiratory viruses in children. Virol. J. 2012, 9, 247. [Google Scholar] [CrossRef]
- Lam, T.T.; Tang, J.W.; Lai, F.Y.; Zaraket, H.; Dbaibo, G.; Bialasiewicz, S.; Tozer, S.; Heraud, J.M.; Drews, S.J.; Hachette, T.; et al. Comparative global epidemiology of influenza, respiratory syncytial and parainfluenza viruses, 2010–2015. J. Infect. 2019, 79, 373–382. [Google Scholar] [CrossRef]
- Pinky, L.; Dobrovolny, H.M. Coinfections of the Respiratory Tract: Viral Competition for Resources. PLoS ONE 2016, 11, e0155589. [Google Scholar] [CrossRef]
- Laurie, K.L.; Guarnaccia, T.A.; Carolan, L.A.; Yan, A.W.C.; Aban, M.; Petrie, S.; Cao, P.; Heffernan, J.M.; McVernon, J.; Mosse, J.; et al. Interval Between Infections and Viral Hierarchy Are Determinants of Viral Interference Following Influenza Virus Infection in a Ferret Model. J. Infect. Dis. 2015, 212, 1701–1710. [Google Scholar] [CrossRef] [PubMed]
- Van Asten, L.; Bijkerk, P.; Fanoy, E.; van Ginkel, A.; Suijkerbuijk, A.; van der Hoek, W.; Meijer, A.; Vennema, H. Early occurrence of influenza A epidemics coincided with changes in occurrence of other respiratory virus infections. Influenza Other Respir. Viruses 2016, 10, 14–26. [Google Scholar] [CrossRef] [PubMed]
- Karppinen, S.; Toivonen, L.; Schuez-Havupalo, L.; Waris, M.; Peltola, V. Interference between respiratory syncytial virus and rhinovirus in respiratory tract infections in children. Clin. Microbiol. Infect. 2016, 22, 208.e201–208.e206. [Google Scholar] [CrossRef] [PubMed]
- Viboud, C.; Bjørnstad, O.N.; Smith, D.L.; Simonsen, L.; Miller, M.A.; Grenfell, B.T. Synchrony, Waves, and Spatial Hierarchies in the Spread of Influenza. Science 2006, 312, 447. [Google Scholar] [CrossRef] [PubMed]
- Grenfell, B.T.; Bjørnstad, O.N.; Kappey, J. Travelling waves and spatial hierarchies in measles epidemics. Nature 2001, 414, 716. [Google Scholar] [CrossRef] [PubMed]
- R Core Team. R: A Language and Environment for Statistical Computing; R Foundation for Statistical Computing: Vienna, Austria, 2018. [Google Scholar]
- Pugh, S.; Heaton, M.J.; Hartman, B.; Berrett, C.; Sloan, C.; Evans, A.M.; Gebretsadik, T.; Wu, P.; Hartert, T.V.; Lee, R.L. Estimating seasonal onsets and peaks of bronchiolitis with spatially and temporally uncertain data. Stat. Med. 2019, 38. [Google Scholar] [CrossRef] [PubMed]
- Centers for Disease Control and Prevention. The National Respiratory and Enteric Virus Surveillance System (NREVSS): RSV Surveillance Reports. 2019. Available online: https://www.cdc.gov/surveillance/nrevss/rsv/reports.html (accessed on 29 January 2019).
- Roesch, A.; Schmidbauer, H. WaveletComp: Computational Wavelet Analysis; R package version 1.1; 2018. Available online: https://www.researchgate.net/publication/323836523 (accessed on 29 January 2019).
- Almeida, A.; Codeço, C.; Luz, P.M. Seasonal dynamics of influenza in Brazil: The latitude effect. BMC Infect. Dis. 2018, 18, 695. [Google Scholar] [CrossRef] [PubMed]
- Lowen, A.C.; Steel, J. Roles of humidity and temperature in shaping influenza seasonality. J. Virol. 2014, 88, 7692–7695. [Google Scholar] [CrossRef] [PubMed]
- Lowen, A.C.; Steel, J.; Mubareka, S.; Palese, P. High temperature (30 C) blocks aerosol but not contact transmission of influenza virus. J. Virol. 2008, 82, 5650–5652. [Google Scholar] [CrossRef]
- Yunus, A.S.; Jackson, T.P.; Crisafi, K.; Burimski, I.; Kilgore, N.R.; Zoumplis, D.; Allaway, G.P.; Wild, C.T.; Salzwedel, K. Elevated temperature triggers human respiratory syncytial virus F protein six-helix bundle formation. Virology 2010, 396, 226–237. [Google Scholar] [CrossRef]
- Sloan, C.; Chandrasekhar, R.; Mitchel, E.; Schaffner, W.; Lindegren, M.L. Socioeconomic Disparities and Influenza Hospitalizations, Tennessee, USA. Emerg. Infect. Dis. 2015, 21, 1602–1610. [Google Scholar] [CrossRef]
- Yang, L.; Hung Chan, K.; Suen, L.K.P.; Pan Chan, K.; Wang, X.; Cao, P.; He, D.; Malik Peiris, J.S.; Ming Wong, C. Age-specific epidemic waves of influenza and respiratory syncytial virus in a subtropical city. Sci. Rep. 2015, 5. [Google Scholar] [CrossRef]
- Sloan, C.; Moore, M.L.; Hartert, T. Impact of Pollution, Climate, and Sociodemographic Factors on Spatiotemporal Dynamics of Seasonal Respiratory Viruses. Clin. Transl. Sci. 2011, 4, 48–54. [Google Scholar] [CrossRef]
- Axelsen, J.B.; Yaari, R.; Grenfell, B.T.; Stone, L. Multiannual forecasting of seasonal influenza dynamics reveals climatic and evolutionary drivers. Proc. Natl. Acad. Sci. USA 2014, 111, 9538–9542. [Google Scholar] [CrossRef] [PubMed]
- Monto, A.S. The seasonality of rhinovirus infections and its implications for clinical recognition. Clin. Ther. 2002, 24, 1987–1997. [Google Scholar] [CrossRef]
- Casalegno, J.S.; Ottmann, M.; Bouscambert Duchamp, M.; Escuret, V.; Billaud, G.; Frobert, E.; Morfin, F.; Lina, B. Rhinoviruses delayed the circulation of the pandemic influenza A (H1N1) 2009 virus in France. Clin. Microbiol. Infect. 2010, 16, 326–329. [Google Scholar] [CrossRef] [PubMed]
© 2020 by the authors. Licensee MDPI, Basel, Switzerland. This article is an open access article distributed under the terms and conditions of the Creative Commons Attribution (CC BY) license (http://creativecommons.org/licenses/by/4.0/).
Share and Cite
Callahan, Z.Y.; Smith, T.K.; Ingersoll, C.; Gardner, R.; Korgenski, E.K.; Sloan, C.D. Comparative Seasonal Respiratory Virus Epidemic Timing in Utah. Viruses 2020, 12, 275. https://doi.org/10.3390/v12030275
Callahan ZY, Smith TK, Ingersoll C, Gardner R, Korgenski EK, Sloan CD. Comparative Seasonal Respiratory Virus Epidemic Timing in Utah. Viruses. 2020; 12(3):275. https://doi.org/10.3390/v12030275
Chicago/Turabian StyleCallahan, Zayne Y., Trevor K. Smith, Celeste Ingersoll, Rebecca Gardner, E. Kent Korgenski, and Chantel D. Sloan. 2020. "Comparative Seasonal Respiratory Virus Epidemic Timing in Utah" Viruses 12, no. 3: 275. https://doi.org/10.3390/v12030275
APA StyleCallahan, Z. Y., Smith, T. K., Ingersoll, C., Gardner, R., Korgenski, E. K., & Sloan, C. D. (2020). Comparative Seasonal Respiratory Virus Epidemic Timing in Utah. Viruses, 12(3), 275. https://doi.org/10.3390/v12030275


