Porcine Circovirus Type 2 Rep Enhances IL-10 Production in Macrophages via Activation of p38-MAPK Pathway


Abstract
1. Introduction
2. Materials and Methods
2.1. Cells and Viruses
- F-PCVSAC: GAACCGCGGGCTGGCTGAACTTTTGAAAGT;
- R-PCVSAC: GCACCGCGGAAATTTCTGACAAACGTTACA;
- Rep1A-F: GCATGCTCCCGGCCGCCATGGCCGCGGAACCAGGGGAAG;
- Rep1A-R: ACAACCACTTCTTCACCATGGATGAATAATAAAAACCATTACGAAGTGA;
- Rep1B-F: AAATTTCCGCGGATCACTAGTAGCTGAAAACGAAAGAAGTGCG;
- Rep1B-R: GGCGGCCGCGAATTCACTAGTCCGCGGAGCTCCACACTC;
- Rep2A-F: GCATGCTCCCGGCCGCCATGGCCGCGGGCTGGCTGAACT;
- Rep2A-R: GAATTCCCGCGGCCGCCATGGAAACCATTACGATGTGATAACAAAAAA;
- Rep2B-F: GGAGCTCCGCGGATCACTAGTATGCCCAGCAAGAAGAATGG;
- Rep2B-R: GGCGGCCGCGAATTCACTAGTCCGCGGAAATTTCTGACAAA.
2.2. Construction of Recombinant Adenoviruses
2.3. Enzyme Linked Immunosorbent Assay (ELISA)
2.4. Western Blotting
2.5. Quantitative Polymerase Chain Reaction (Q-PCR)
2.6. Luciferase Reporter Assay
2.7. Transfection of siRNAs
2.8. Chromatin Immunoprecipitation (ChIP)
2.9. Statistical Analysis
3. Results
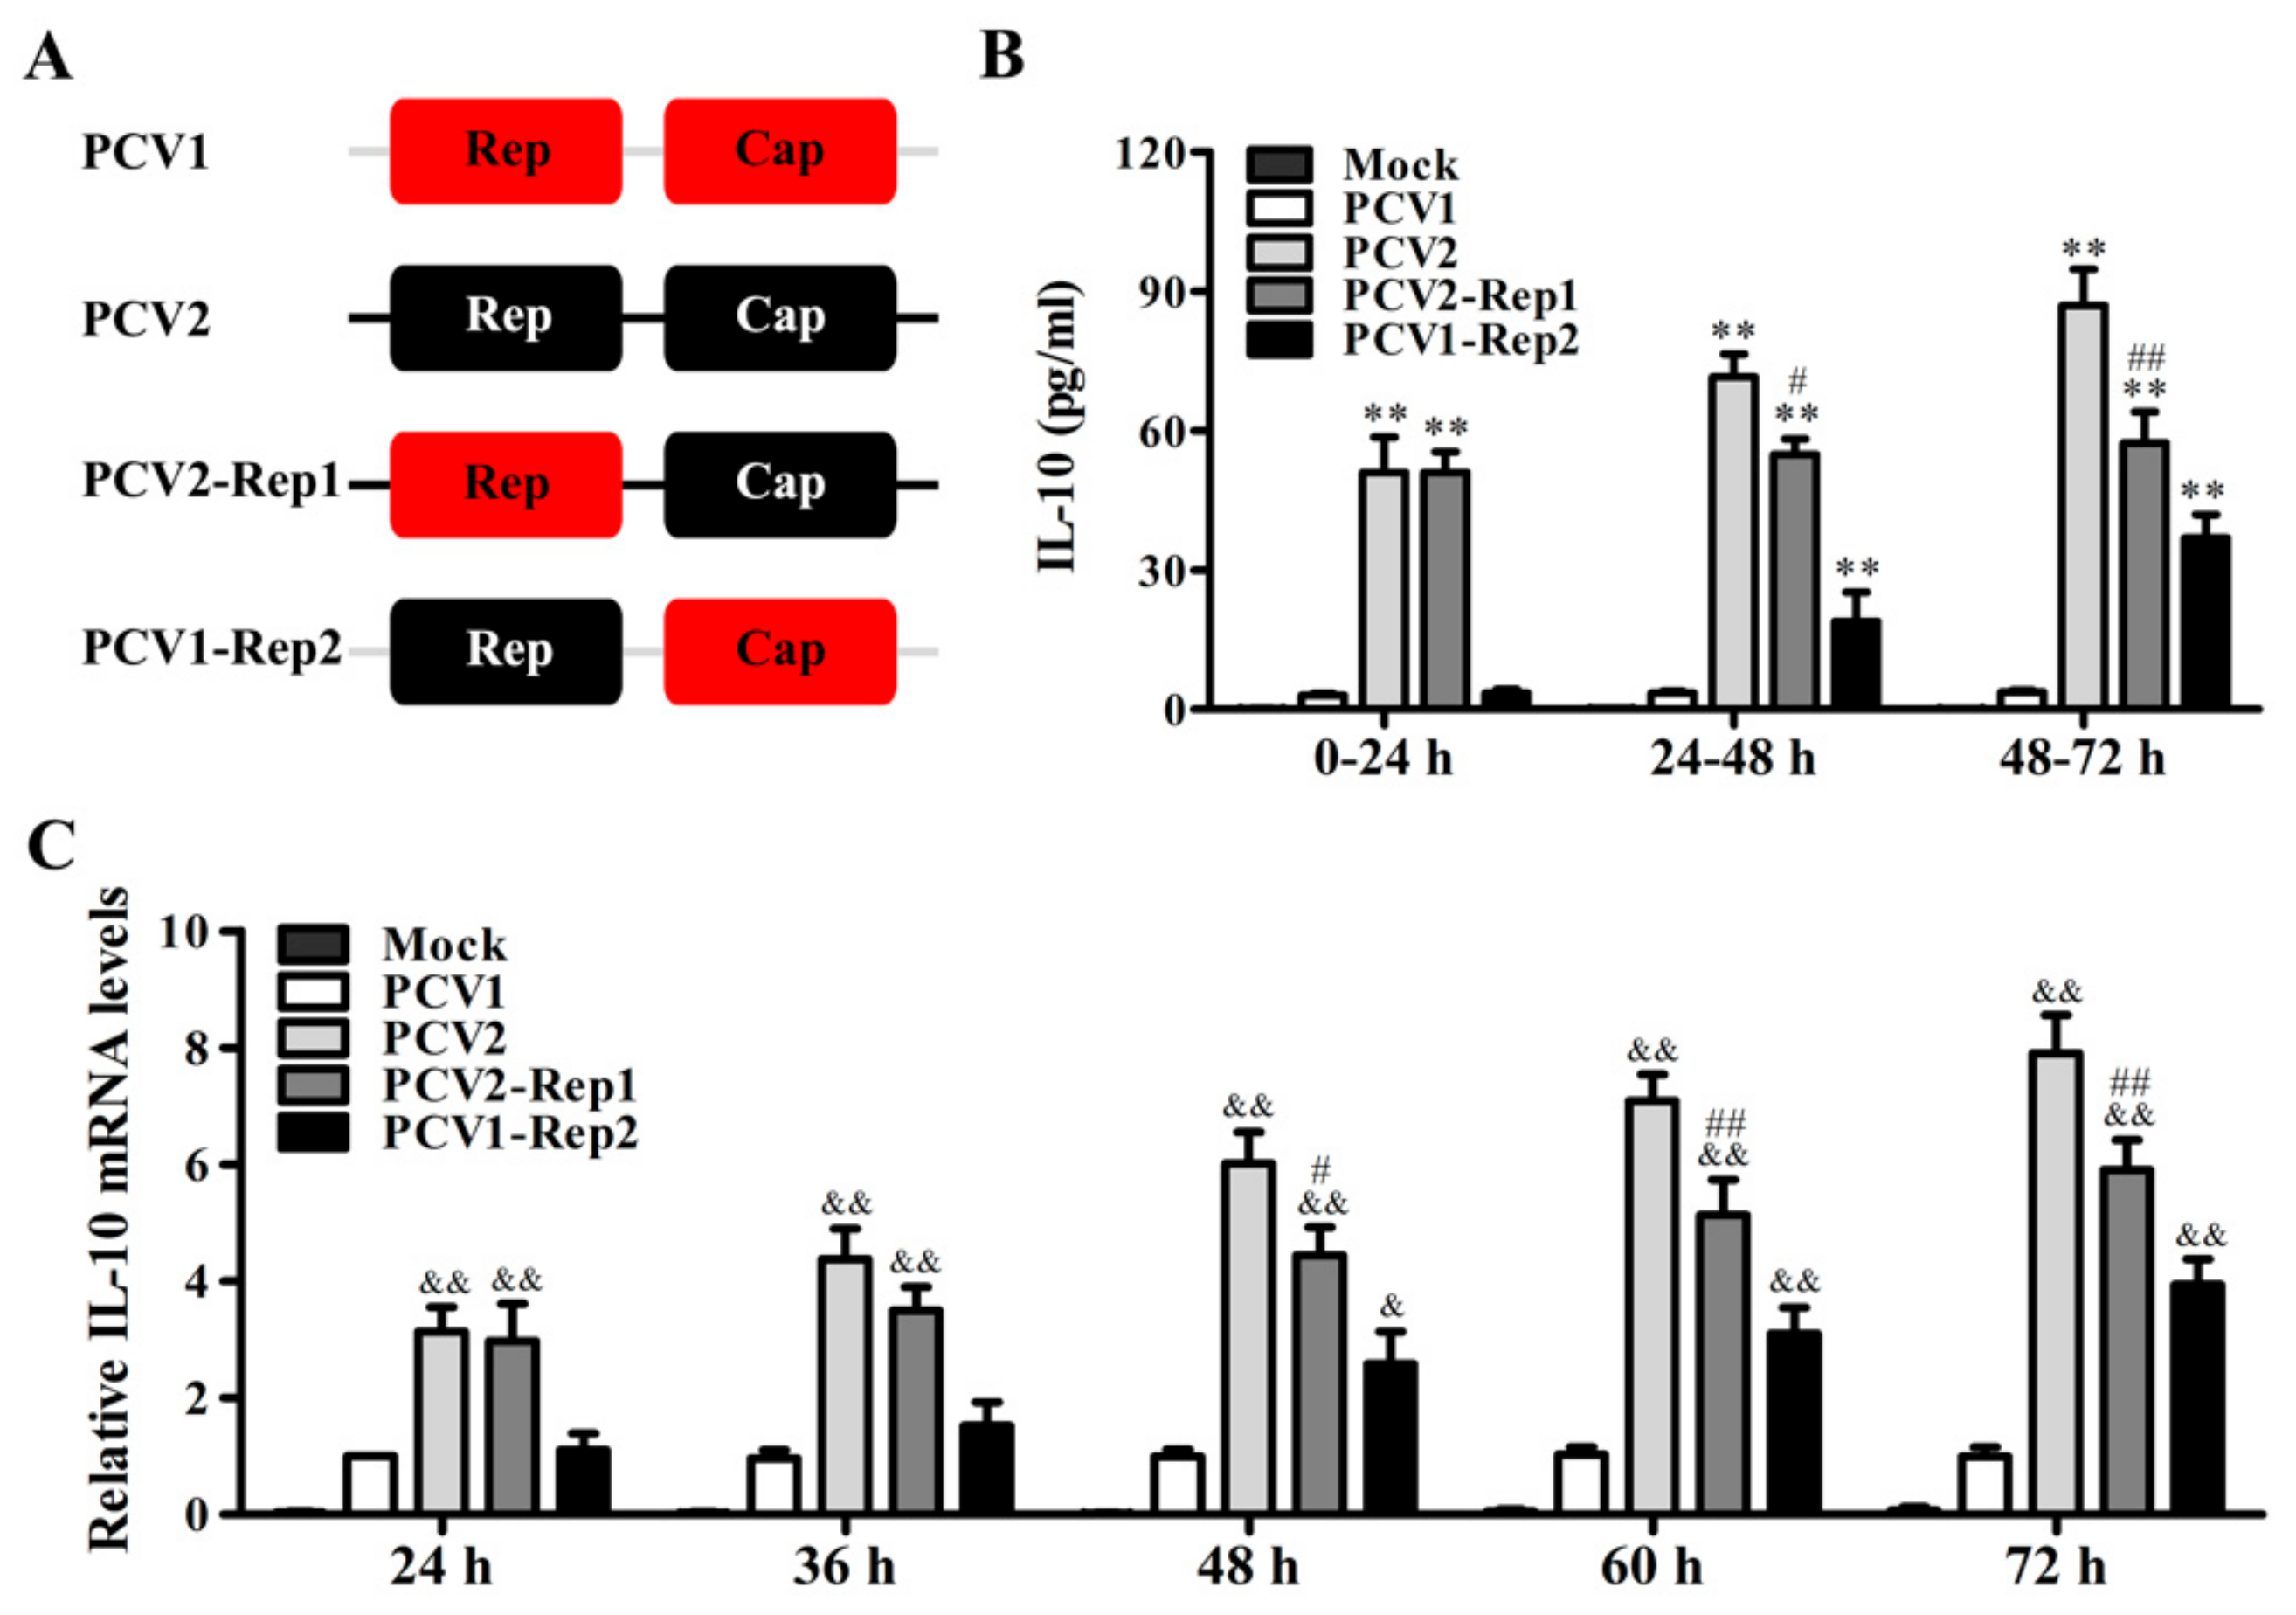
3.1. PCV2 Rep Enhances the Production of IL-10 in PAMs Porcine Alveolar Macrophages
3.2. PCV2 Rep Rather Than PCV1 Rep Directly Promotes IL-10 Production in PAMs
3.3. PCV2 Rep Specifically Enhances the Activity of p38-MAPK Signaling Pathway to Promote IL-10 Expression in PAMs
3.4. PCV2 Rep Activates p38-MAPK Signaling to Promote NF-κB p50 and Sp1 Binding to il10 Promoter
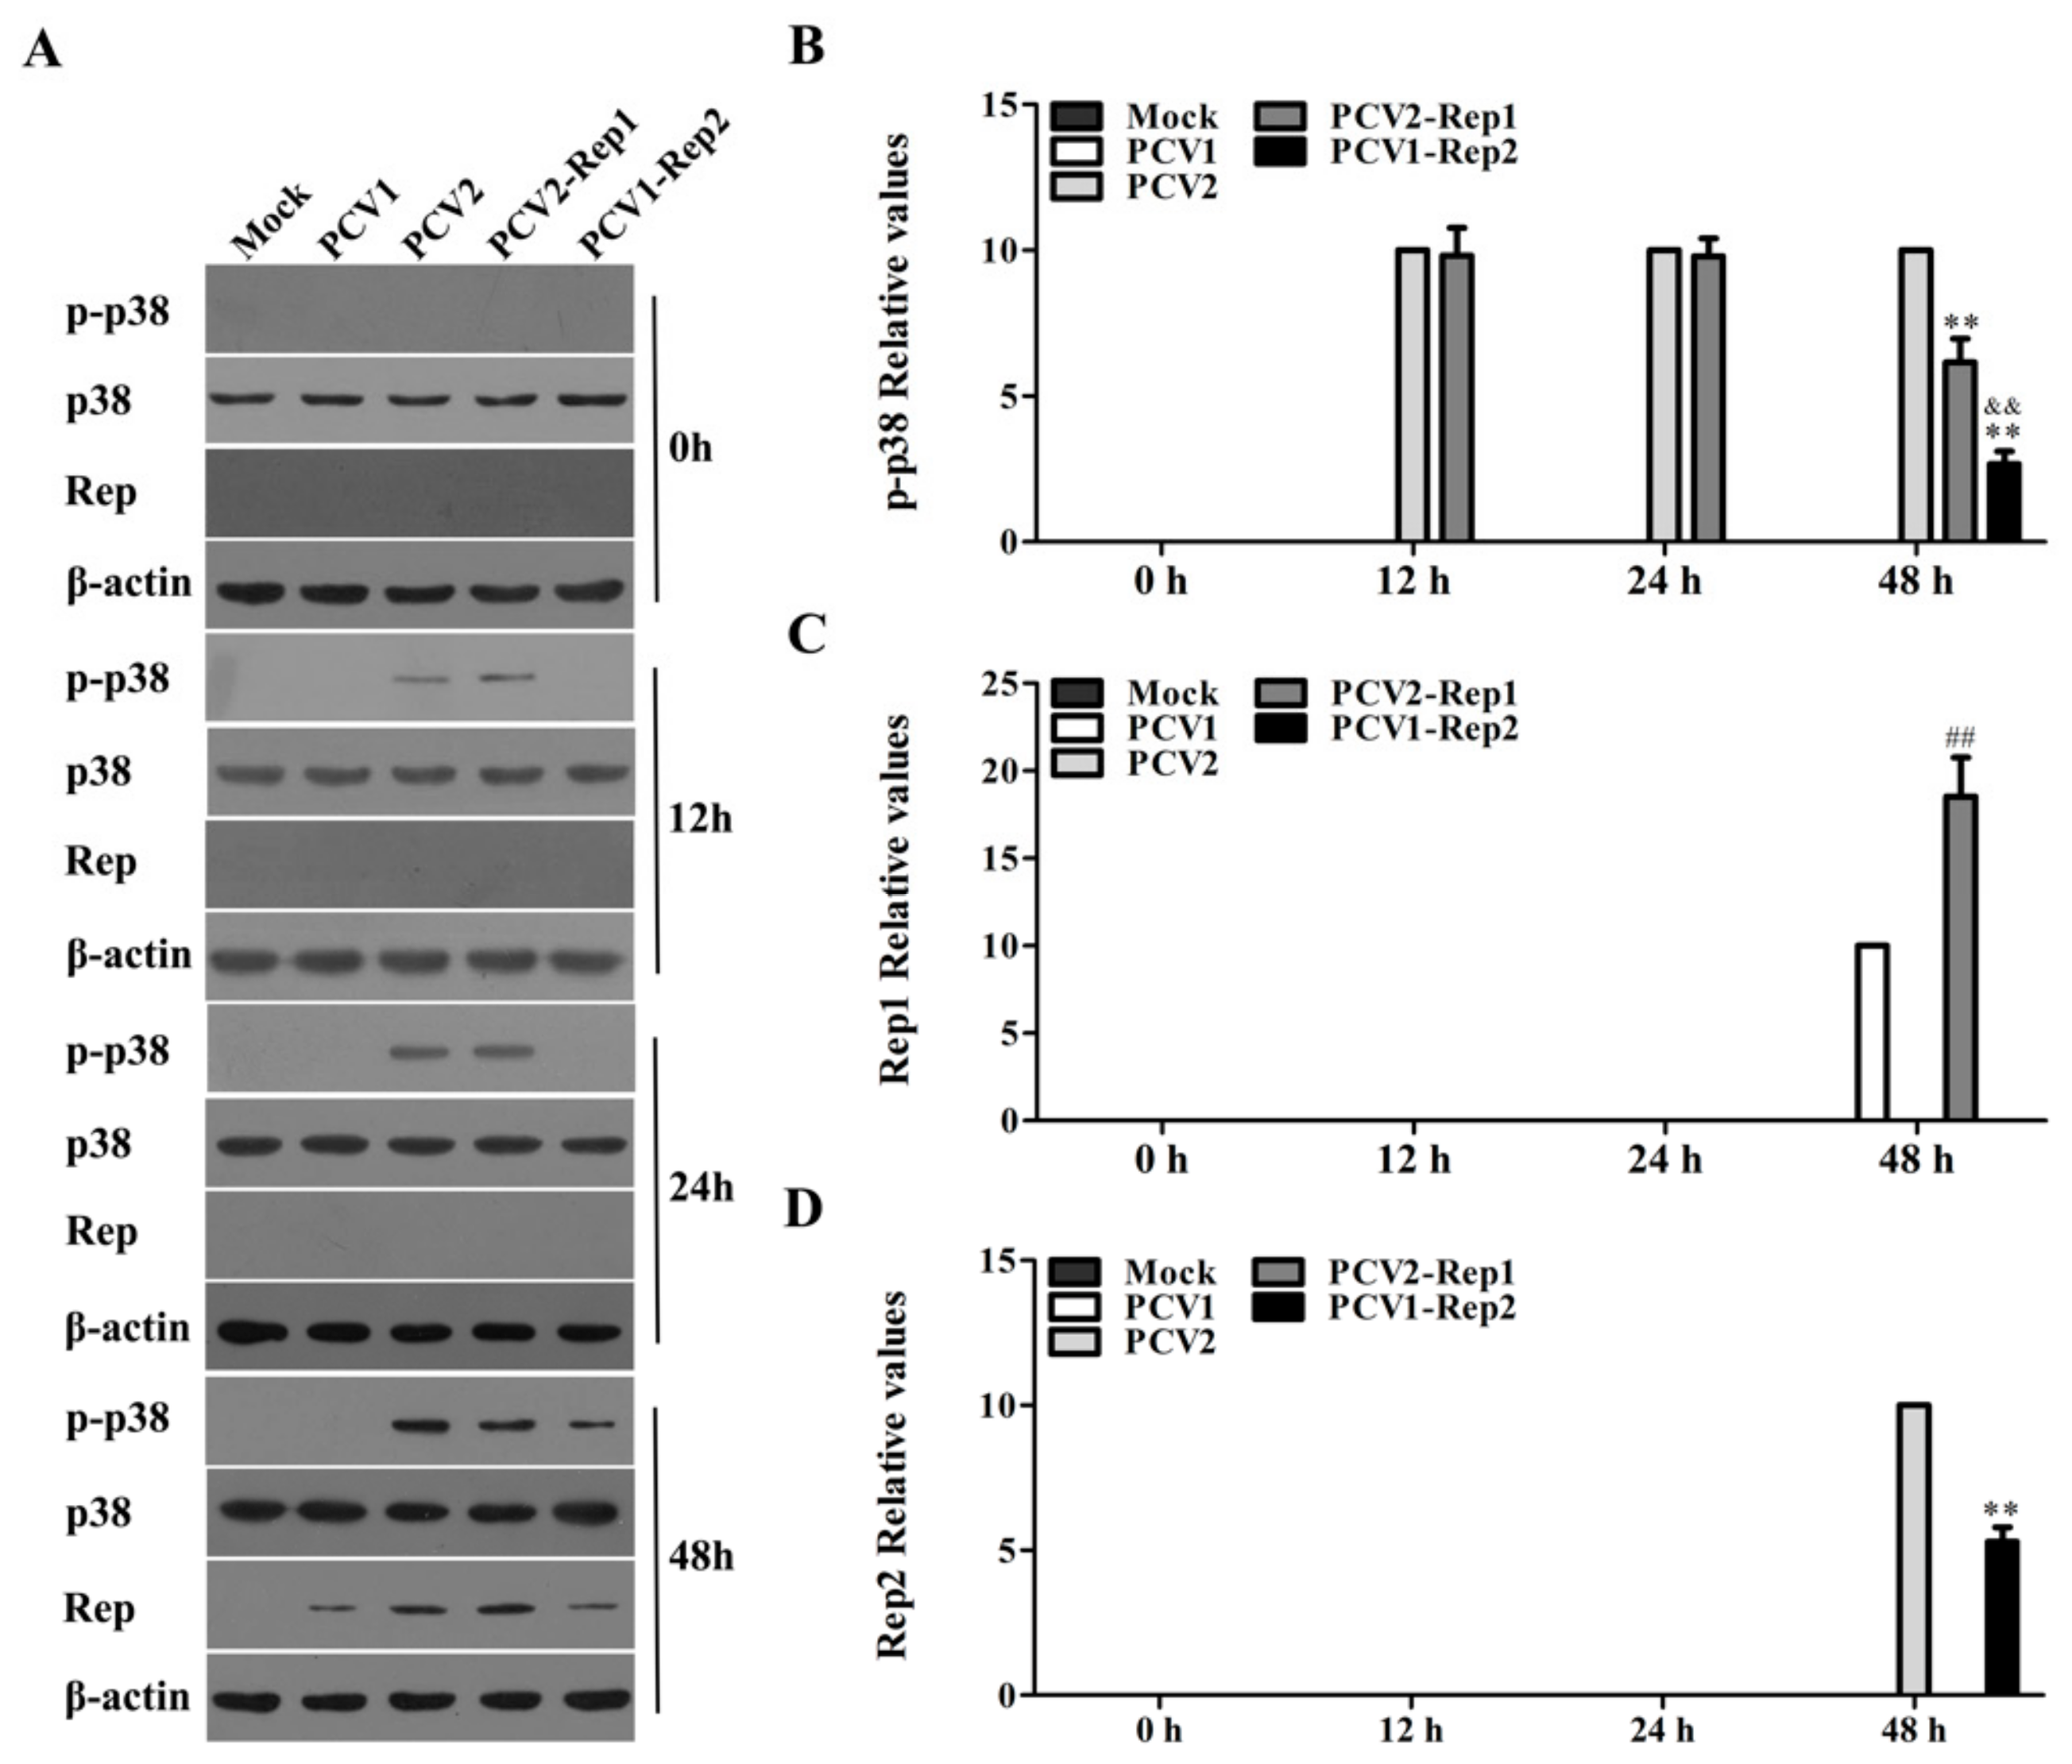
3.5. Rep Protein Activates p38-MAPK at the Later Phase of PCV2 Infection
3.6. Rep Protein Enhances the Binding Activities of p50 and Sp1 with il10 Promoter via p38-MAPK at the Later Phase of PCV2 Infection
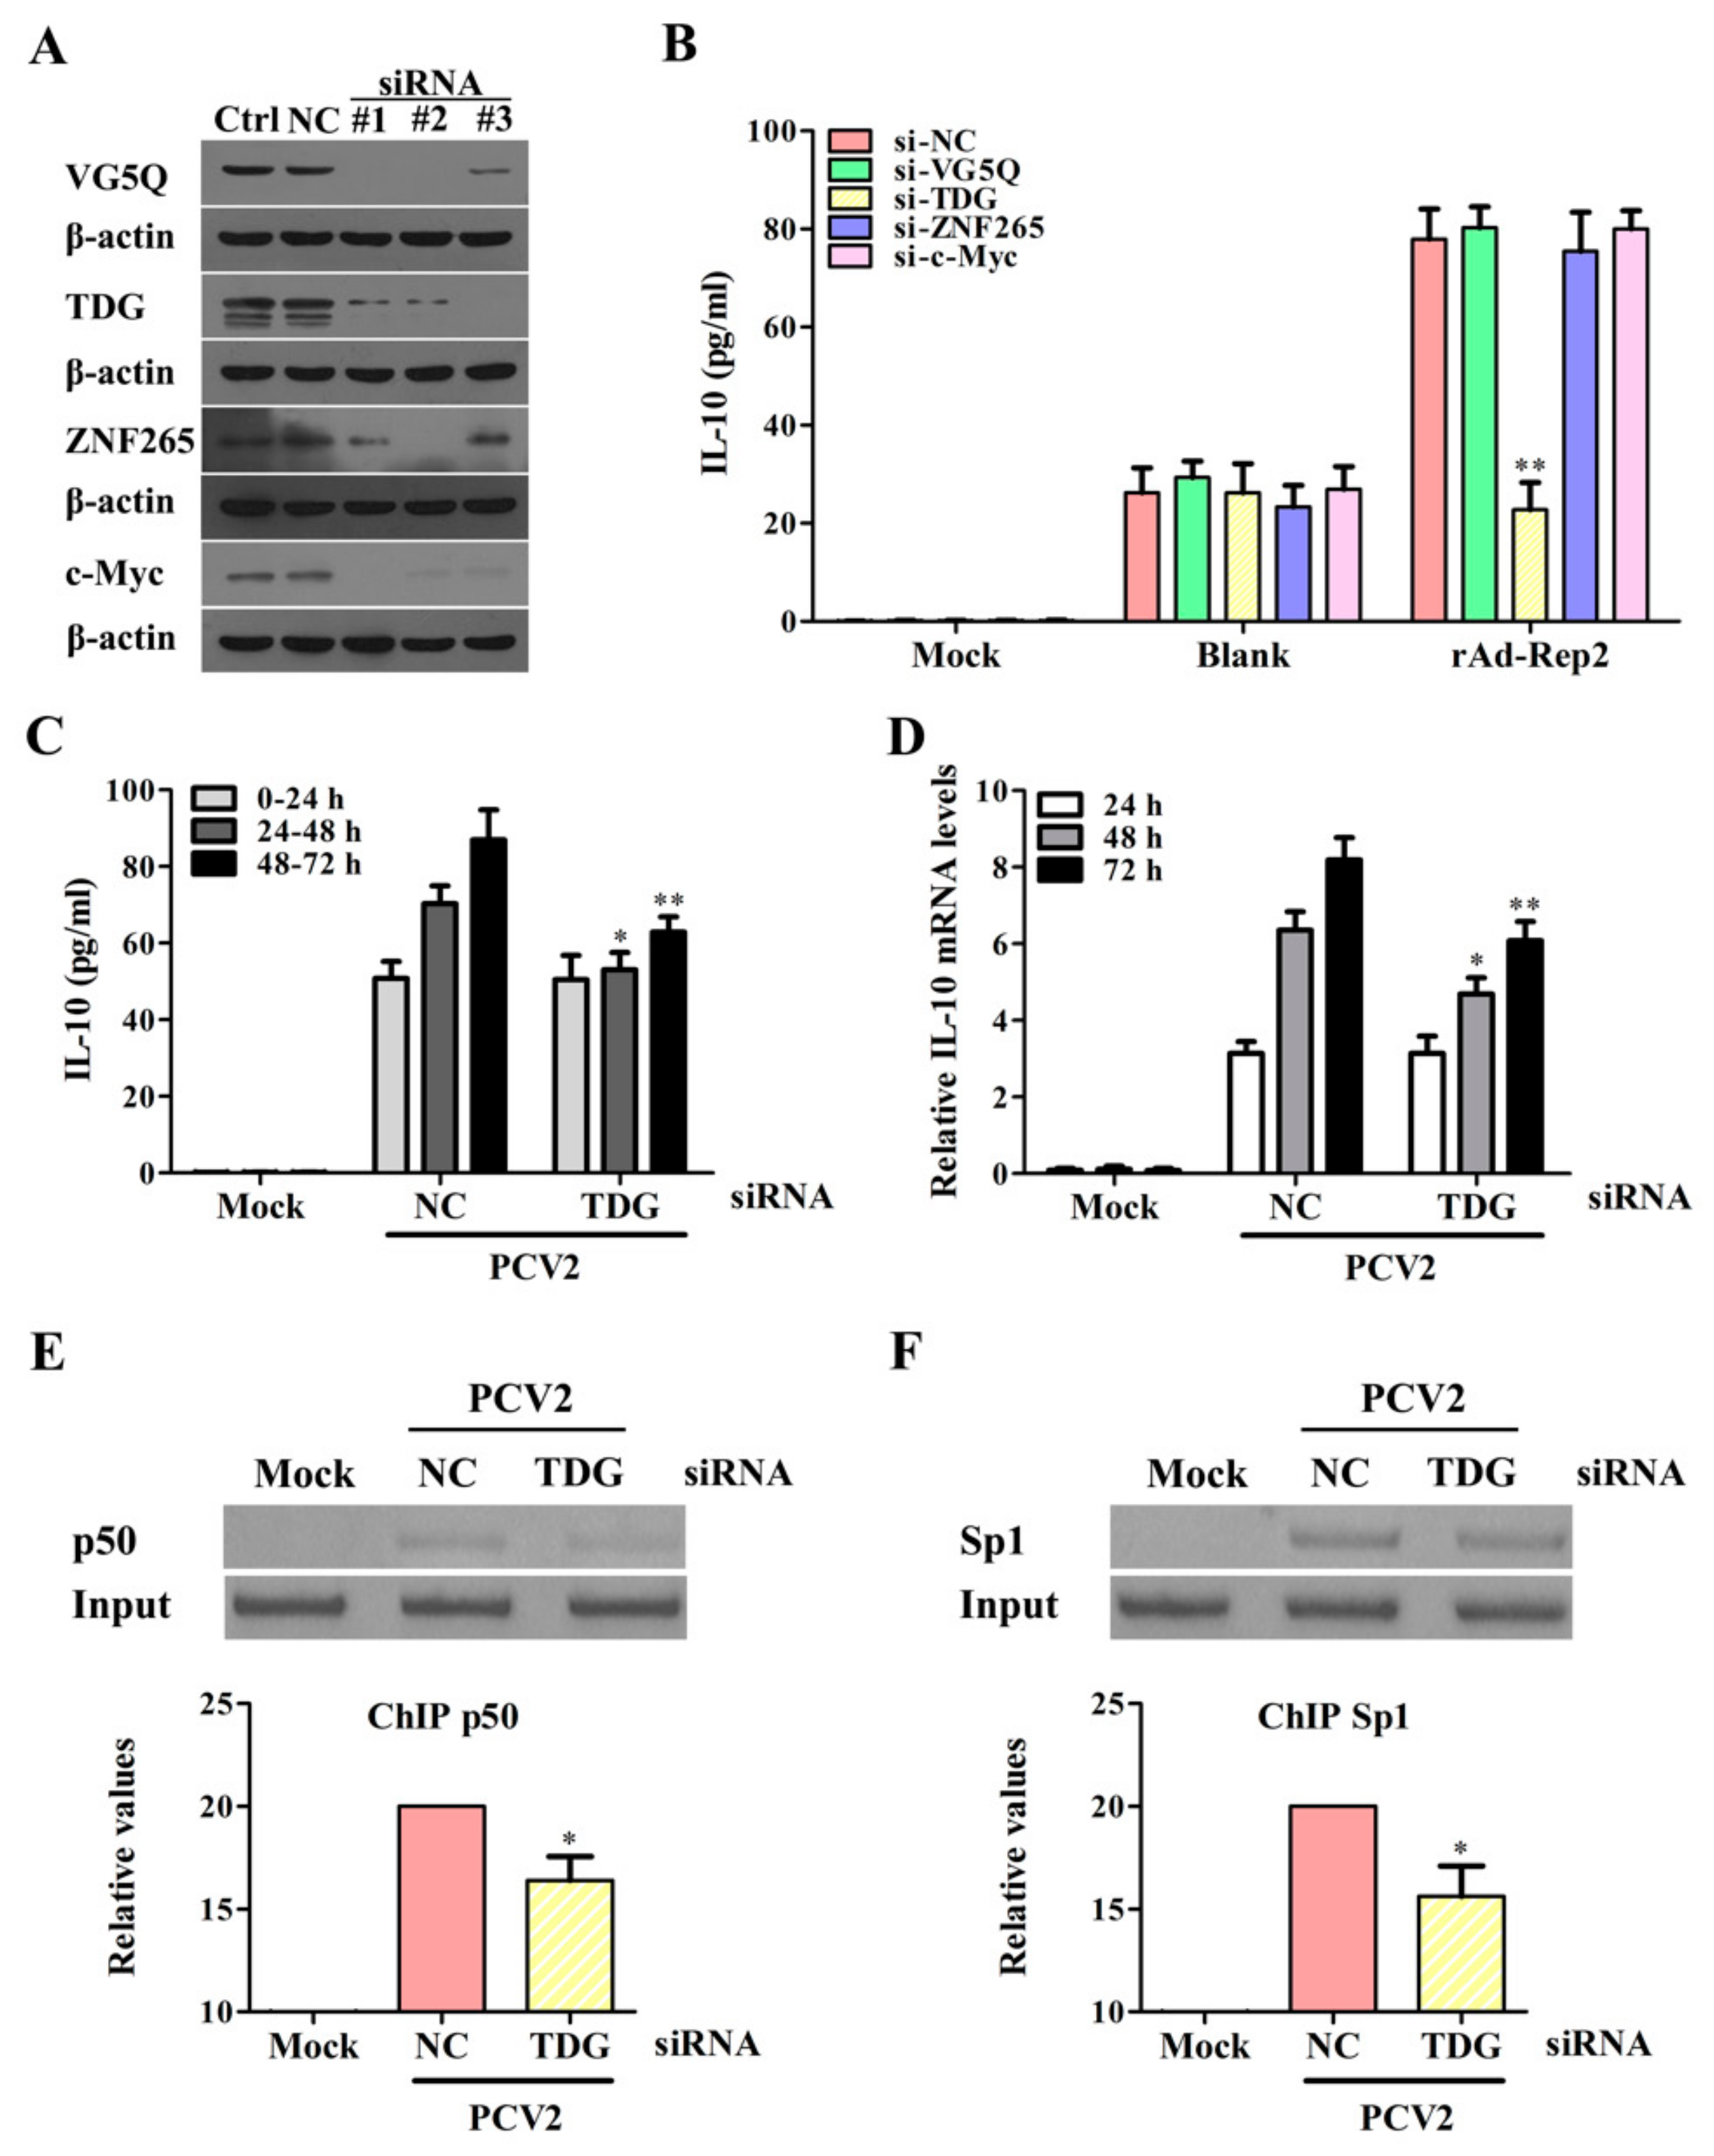
3.7. Rep Protein Interacting with TDG Enhances the Binding Activities of Sp1 and NF-κB p50 with the il10 Promoter to Promote IL-10 Production at the Later Phase of PCV2 Infection
4. Discussion
5. Conclusions
Author Contributions
Funding
Acknowledgments
Conflicts of Interest
References
- Huang, Y.L.; Pang, V.F.; Deng, M.C.; Chang, C.Y.; Jeng, C.R. Porcine circovirus type 2 decreases the infection and replication of attenuated classical swine fever virus in porcine alveolar macrophages. Res. Vet. Sci. 2014, 96, 187–195. [Google Scholar] [CrossRef] [PubMed]
- Li, W.; Wang, X.; Ma, T.; Feng, Z.; Li, Y.; Jiang, P. Genetic analysis of porcine circovirus type 2 (PCV2) strains isolated between 2001 and 2009: Genotype PCV2b predominate in postweaning multisystemic wasting syndrome occurrences in eastern China. Virus Genes 2010, 40, 244–251. [Google Scholar] [CrossRef] [PubMed]
- Gillespie, J.; Opriessnig, T.; Meng, X.J.; Pelzer, K.; Buechner-Maxwell, V. Porcine circovirus type 2 and porcine circovirus-associated disease. J. Vet. Intern. Med. 2009, 23, 1151–1163. [Google Scholar] [CrossRef] [PubMed]
- Zhang, D.; He, K.; Wen, L.; Fan, H. Genetic and phylogenetic analysis of a new porcine circovirus type 2 (PCV2) strain in China. Arch. Virol. 2015, 160, 3149–3151. [Google Scholar] [CrossRef] [PubMed]
- Cheung, A.K. Specific functions of the Rep and Rep proteins of porcine circovirus during copy-release and rolling-circle DNA replication. Virology 2015, 481, 43–50. [Google Scholar] [CrossRef]
- Lv, Q.Z.; Guo, K.K.; Zhang, Y.M. Current understanding of genomic DNA of porcine circovirus type 2. Virus genes 2014, 49, 1–10. [Google Scholar] [CrossRef]
- Gao, X.; Zhao, L.; Wang, S.; Yang, J.; Yang, X. Enhanced inducible costimulator ligand (ICOS-L) expression on dendritic cells in interleukin-10 deficiency and its impact on T-cell subsets in respiratory tract infection. Mol. Med. 2013, 19, 346–356. [Google Scholar] [CrossRef]
- Koya, T.; Matsuda, H.; Takeda, K.; Matsubara, S.; Miyahara, N.; Balhorn, A.; Dakhama, A.; Gelfand, E.W. IL-10-treated dendritic cells decrease airway hyperresponsiveness and airway inflammation in mice. The J. Allergy. Clin. Immunol. 2007, 119, 1241–1250. [Google Scholar] [CrossRef]
- Lykken, J.M.; DiLillo, D.J.; Weimer, E.T.; Roser-Page, S.; Heise, M.T.; Grayson, J.M.; Weitzmann, M.N.; Tedder, T.F. Acute and chronic B cell depletion disrupts CD4+ and CD8+ T cell homeostasis and expansion during acute viral infection in mice. J. Immunol. 2014, 193, 746–756. [Google Scholar] [CrossRef]
- Eberhardt, M.K.; Deshpande, A.; Fike, J.; Short, R.; Schmidt, K.A.; Blozis, S.A.; Walter, M.R.; Barry, P.A. Exploitation of Interleukin-10 (IL-10) Signaling Pathways: Alternate Roles of Viral and Cellular IL-10 in Rhesus Cytomegalovirus Infection. J. Virol. 2016, 90, 9920–9930. [Google Scholar] [CrossRef]
- Redford, P.S.; Murray, P.J.; O’Garra, A. The role of IL-10 in immune regulation during M. tuberculosis infection. Mucosal. Immunol. 2011, 4, 261–270. [Google Scholar] [CrossRef] [PubMed]
- Brooks, D.G.; Trifilo, M.J.; Edelmann, K.H.; Teyton, L.; McGavern, D.B.; Oldstone, M.B. Interleukin-10 determines viral clearance or persistence in vivo. Nat. Med. 2006, 12, 1301–1309. [Google Scholar] [CrossRef] [PubMed]
- Du, Q.; Huang, Y.; Wang, T.; Zhang, X.; Chen, Y.; Cui, B.; Li, D.; Zhao, X.; Zhang, W.; Chang, L.; et al. Porcine circovirus type 2 activates PI3K/Akt and p38 MAPK pathways to promote interleukin-10 production in macrophages via Cap interaction of gC1qR. Oncotarget 2016, 7, 17492–17507. [Google Scholar] [CrossRef] [PubMed]
- Wang, T.; Du, Q.; Niu, Y.; Zhang, X.; Wang, Z.; Wu, X.; Yang, X.; Zhao, X.; Liu, S.L.; Tong, D.; et al. Cellular p32 Is a Critical Regulator of Porcine Circovirus Type 2 Nuclear Egress. J. Virol. 2019, 93, e00979-19. [Google Scholar] [CrossRef] [PubMed]
- Fenaux, M.; Halbur, P.G.; Haqshenas, G.; Royer, R.; Thomas, P.; Nawagitgul, P.; Gill, M.; Toth, T.E.; Meng, X.J. Cloned genomic DNA of type 2 porcine circovirus is infectious when injected directly into the liver and lymph nodes of pigs: Characterization of clinical disease, virus distribution, and pathologic lesions. J. Virol. 2002, 76, 541–551. [Google Scholar] [CrossRef]
- Fenaux, M.; Opriessnig, T.; Halbur, P.G.; Meng, X.J. Immunogenicity and pathogenicity of chimeric infectious DNA clones of pathogenic porcine circovirus type 2 (PCV2) and nonpathogenic PCV1 in weanling pigs. J. Virol. 2003, 77, 11232–11243. [Google Scholar] [CrossRef]
- Zhou, J.Y.; Chen, Q.X.; Ye, J.X.; Shen, H.G.; Chen, T.F.; Shang, S.B. Serological investigation and genomic characterization of PCV2 isolates from different geographic regions of Zhejiang province in China. Vet. Res. Commun 2006, 30, 205–220. [Google Scholar] [CrossRef]
- Wang, T.; Du, Q.; Wu, X.; Niu, Y.; Guan, L.; Wang, Z.; Zhao, X.; Liu, S.L.; Tong, D.; Huang, Y. Porcine MKRN1 Modulates the Replication and Pathogenesis of Porcine Circovirus Type 2 by Inducing Capsid Protein Ubiquitination and Degradation. J. Virol. 2018, 92, e00100-18. [Google Scholar] [CrossRef]
- Livak, K.J.; Schmittgen, T.D. Analysis of relative gene expression data using real-time quantitative PCR and the 2(-Delta Delta C(T)) Method. Methods 2001, 25, 402–408. [Google Scholar] [CrossRef]
- Banday, M.Z.; Balkhi, H.M.; Hamid, Z.; Sameer, A.S.; Chowdri, N.A.; Haq, E. Tumor necrosis factor-alpha (TNF-alpha)-308G/A promoter polymorphism in colorectal cancer in ethnic Kashmiri population - A case control study in a detailed perspective. Meta. gene 2016, 9, 128–136. [Google Scholar] [CrossRef]
- Doster, A.R.; Subramaniam, S.; Yhee, J.Y.; Kwon, B.J.; Yu, C.H.; Kwon, S.Y.; Osorio, F.A.; Sur, J.H. Distribution and characterization of IL-10-secreting cells in lymphoid tissues of PCV2-infected pigs. J. Vet. Sci. 2010, 11, 177–183. [Google Scholar] [CrossRef] [PubMed]
- Saraiva, M.; O’Garra, A. The regulation of IL-10 production by immune cells. Nat. Rev. Immunol. 2010, 10, 170–181. [Google Scholar] [CrossRef] [PubMed]
- Finsterbusch, T.; Steinfeldt, T.; Doberstein, K.; Rodner, C.; Mankertz, A. Interaction of the replication proteins and the capsid protein of porcine circovirus type 1 and 2 with host proteins. Virology 2009, 386, 122–131. [Google Scholar] [CrossRef] [PubMed]
- VanderWaal, K.; Deen, J. Global trends in infectious diseases of swine. Proc. Natl. Acad. Sci. USA 2018, 115, 11495–11500. [Google Scholar] [CrossRef]
- Avdic, S.; McSharry, B.P.; Steain, M.; Poole, E.; Sinclair, J.; Abendroth, A.; Slobedman, B. Human Cytomegalovirus-Encoded Human Interleukin-10 (IL-10) Homolog Amplifies Its Immunomodulatory Potential by Upregulating Human IL-10 in Monocytes. J. Virol. 2016, 90, 3819–3827. [Google Scholar] [CrossRef]
- Shen, P.; Fillatreau, S. Suppressive functions of B cells in infectious diseases. Int. Immunol. 2015, 27, 513–519. [Google Scholar] [CrossRef]
- Borghetti, P.; Morganti, M.; Saleri, R.; Ferrari, L.; De Angelis, E.; Cavalli, V.; Cacchioli, A.; Corradi, A.; Martelli, P. Innate pro-inflammatory and adaptive immune cytokines in PBMC of vaccinated and unvaccinated pigs naturally exposed to porcine circovirus type 2 (PCV2) infection vary with the occurrence of the disease and the viral burden. Vet. Microbiol. 2013, 163, 42–53. [Google Scholar] [CrossRef]
- Richmond, O.; Cecere, T.E.; Erdogan, E.; Meng, X.J.; Pineyro, P.; Subramaniam, S.; Todd, S.M.; LeRoith, T. The PD-L1/CD86 ratio is increased in dendritic cells co-infected with porcine circovirus type 2 and porcine reproductive and respiratory syndrome virus, and the PD-L1/PD-1 axis is associated with anergy, apoptosis, and the induction of regulatory T-cells in porcine lymphocytes. Vet. Microbiol. 2015, 180, 223–229. [Google Scholar] [CrossRef]
- Chen, E.; Liu, G.; Zhou, X.; Zhang, W.; Wang, C.; Hu, D.; Xue, D.; Pan, Z. Concentration-dependent, dual roles of IL-10 in the osteogenesis of human BMSCs via P38/MAPK and NF-kappaB signaling pathways. FASEB J. 2018, 32, 4917–4929. [Google Scholar] [CrossRef]
- Xu, L.; Yin, W.; Sun, R.; Wei, H.; Tian, Z. Kupffer cell-derived IL-10 plays a key role in maintaining humoral immune tolerance in hepatitis B virus-persistent mice. Hepatology 2014, 59, 443–452. [Google Scholar] [CrossRef]
- Yu, J.; Liu, Y.; Zhang, Y.; Zhu, X.; Ren, S.; Guo, L.; Liu, X.; Sun, W.; Chen, Z.; Cong, X.; et al. The integrity of PRRSV nucleocapsid protein is necessary for up-regulation of optimal interleukin-10 through NF-kappaB and p38 MAPK pathways in porcine alveolar macrophages. Microb. Pathog. 2017, 109, 319–324. [Google Scholar] [CrossRef] [PubMed]
- Liu, D.; Xu, J.; Qian, G.; Hamid, M.; Gan, F.; Chen, X.; Huang, K. Selenizing astragalus polysaccharide attenuates PCV2 replication promotion caused by oxidative stress through autophagy inhibition via PI3K/AKT activation. Int. J. Biol. Macromol. 2018, 108, 350–359. [Google Scholar] [CrossRef] [PubMed]
- Wei, L.; Zhu, S.; Wang, J.; Liu, J. Activation of the phosphatidylinositol 3-kinase/Akt signaling pathway during porcine circovirus type 2 infection facilitates cell survival and viral replication. J. Virol. 2012, 86, 13589–13597. [Google Scholar] [CrossRef] [PubMed]
- Franks, H.A.; Wang, Q.; Lax, S.J.; Collins, M.K.; Escors, D.; Patel, P.M.; Jackson, A.M. Novel function for the p38-MK2 signaling pathway in circulating CD1c+ (BDCA-1+) myeloid dendritic cells from healthy donors and advanced cancer patients; inhibition of p38 enhances IL-12 whilst suppressing IL-10. Int. J. Cancer. 2014, 134, 575–586. [Google Scholar] [CrossRef] [PubMed][Green Version]
- Garaud, S.; Taher, T.E.; Debant, M.; Burgos, M.; Melayah, S.; Berthou, C.; Parikh, K.; Pers, J.O.; Luque-Paz, D.; Chiocchia, G.; et al. CD5 expression promotes IL-10 production through activation of the MAPK/Erk pathway and upregulation of TRPC1 channels in B lymphocytes. Cell Mol. Immunol. 2018, 15, 158–170. [Google Scholar] [CrossRef]
- Wang, Z.; Yi, T.; Long, M.; Gao, Y.; Cao, C.; Huang, C.; Wang, Q.; Yin, N.; Chen, Z. Electro-Acupuncture at Zusanli Acupoint (ST36) Suppresses Inflammation in Allergic Contact Dermatitis Via Triggering Local IL-10 Production and Inhibiting p38 MAPK Activation. Inflammation 2017, 40, 1351–1364. [Google Scholar] [CrossRef]
- Du, Q.; Wu, X.; Wang, T.; Yang, X.; Wang, Z.; Niu, Y.; Zhao, X.; Liu, S.L.; Tong, D.; Huang, Y. Porcine Circovirus Type 2 Suppresses IL-12p40 Induction via Capsid/gC1qR-Mediated MicroRNAs and Signalings. J. Immunol. 2018, 201, 533–547. [Google Scholar] [CrossRef]
- Wei, L.; Zhu, Z.; Wang, J.; Liu, J. JNK and p38 mitogen-activated protein kinase pathways contribute to porcine circovirus type 2 infection. J. Virol. 2009, 83, 6039–6047. [Google Scholar] [CrossRef][Green Version]
- Wei, L.; Liu, J. Porcine circovirus type 2 replication is impaired by inhibition of the extracellular signal-regulated kinase (ERK) signaling pathway. Virology 2009, 386, 203–209. [Google Scholar] [CrossRef]
- Karuppannan, A.K.; Jong, M.H.; Lee, S.H.; Zhu, Y.; Selvaraj, M.; Lau, J.; Jia, Q.; Kwang, J. Attenuation of porcine circovirus 2 in SPF piglets by abrogation of ORF3 function. Virology 2009, 383, 338–347. [Google Scholar] [CrossRef]
- Cheung, A.K. Comparative analysis of the transcriptional patterns of pathogenic and nonpathogenic porcine circoviruses. Virology 2003, 310, 41–49. [Google Scholar] [CrossRef]
- Sun, M.; Liu, X.; Cao, S.; He, Q.; Zhou, R.; Ye, J.; Li, Y.; Chen, H. Inhibition of porcine circovirus type 1 and type 2 production in PK-15 cells by small interfering RNAs targeting the Rep gene. Vet. Microbiol. 2007, 123, 203–209. [Google Scholar] [CrossRef] [PubMed]
- Timmusk, S.; Fossum, C.; Berg, M. Porcine circovirus type 2 replicase binds the capsid protein and an intermediate filament-like protein. J. Gen. Virol. 2006, 87, 3215–3223. [Google Scholar] [CrossRef] [PubMed]


| Target Gene | Accession Number | Sequences |
|---|---|---|
| Akt | NM_001159776.1 | AACGAGGCGAGUACAUCAAGATT |
| p38 | XM_001929490.5 | AAGCUAUCCAGACCAUUUCAATT |
| ERK | NM_001198922.1 | AAGCACCAUUCAAGUUUGACATT |
| p50 | KC316024.1 | AAGGAGGAGAAUUACAGGUUCTT |
| VG5Q | XM_003123715.5 | 1# GCAAGACCCAUACAAGCAATT |
| 2# CCGUAUUUGUUCCAUGUAATT | ||
| 3# GCAGGUAACUGCCAGAUAATT | ||
| TDG | XM_021092634.1 | 1# GCAUAAACCUAGAUGCACUTT |
| 2# GGUAGAAGCGUAGUGGCCUTT | ||
| 3# GCCAGAGACUAUAGAAGACTT | ||
| ZNF265 | NM_001044582.1 | 1# CCAGAAGAUCAGAGUGUAATT |
| 2# CCUAUAUUAAGGGUGCCUUTT | ||
| 3# GCCUAACGGUUCAUCUCUUTT | ||
| c-Myc | NM_001005154.1 | 1# CCAUGAAUUCACACUUGUUTT |
| 2# GCAUGAUCCAGUGCAACCUTT | ||
| 3# GCAAACUUUCCUCUGUAAATT |
© 2019 by the authors. Licensee MDPI, Basel, Switzerland. This article is an open access article distributed under the terms and conditions of the Creative Commons Attribution (CC BY) license (http://creativecommons.org/licenses/by/4.0/).
Share and Cite
Wu, X.; Wang, X.; Shi, T.; Luo, L.; Qiao, D.; Wang, Z.; Han, C.; Du, Q.; Tong, D.; Huang, Y. Porcine Circovirus Type 2 Rep Enhances IL-10 Production in Macrophages via Activation of p38-MAPK Pathway. Viruses 2019, 11, 1141. https://doi.org/10.3390/v11121141
Wu X, Wang X, Shi T, Luo L, Qiao D, Wang Z, Han C, Du Q, Tong D, Huang Y. Porcine Circovirus Type 2 Rep Enhances IL-10 Production in Macrophages via Activation of p38-MAPK Pathway. Viruses. 2019; 11(12):1141. https://doi.org/10.3390/v11121141
Chicago/Turabian StyleWu, Xingchen, Xiaoya Wang, Tengfei Shi, Le Luo, Dan Qiao, Zhenyu Wang, Cong Han, Qian Du, Dewen Tong, and Yong Huang. 2019. "Porcine Circovirus Type 2 Rep Enhances IL-10 Production in Macrophages via Activation of p38-MAPK Pathway" Viruses 11, no. 12: 1141. https://doi.org/10.3390/v11121141
APA StyleWu, X., Wang, X., Shi, T., Luo, L., Qiao, D., Wang, Z., Han, C., Du, Q., Tong, D., & Huang, Y. (2019). Porcine Circovirus Type 2 Rep Enhances IL-10 Production in Macrophages via Activation of p38-MAPK Pathway. Viruses, 11(12), 1141. https://doi.org/10.3390/v11121141