Article

Seasonal Dynamics of Algae-Infecting Viruses and Their Inferred Interactions with Protists

by
Sandra Gran-Stadniczeñko
1,*,
Anders K. Krabberød
1,
Ruth-Anne Sandaa
2,
Sheree Yau
3,
Elianne Egge
1,† and
Bente Edvardsen
1
1
Department of Biosciences, University of Oslo, P.O. Box 1066 Blindern, 0316 Oslo, Norway
2
Department of Biological Sciences, University of Bergen, 5020 Bergen, Norway
3
Department of Marine Biology and Oceanography, Institute of Marine Sciences (CSIC), 08003 Barcelona, Spain
*
Author to whom correspondence should be addressed.
Present address: Department of Biodiversity, University of Duisburg-Essen, Biology, 45141 Essen, Germany.
Viruses 2019, 11(11), 1043; https://doi.org/10.3390/v11111043
Submission received: 4 October 2019 / Revised: 6 November 2019 / Accepted: 8 November 2019 / Published: 9 November 2019
(This article belongs to the Section Viruses of Plants, Fungi and Protozoa)

Abstract

:
Viruses are a highly abundant, dynamic, and diverse component of planktonic communities that have key roles in marine ecosystems. We aimed to reveal the diversity and dynamics of marine large dsDNA viruses infecting algae in the Northern Skagerrak, South Norway through the year by metabarcoding, targeting the major capsid protein (MCP) and its correlation to protist diversity and dynamics. Metabarcoding results demonstrated a high diversity of algal viruses compared to previous metabarcoding surveys in Norwegian coastal waters. We obtained 313 putative algal virus operational taxonomic units (vOTUs), all classified by phylogenetic analyses to either the Phycodnaviridae or Mimiviridae families, most of them in clades without any cultured or environmental reference sequences. The viral community showed a clear temporal variation, with some vOTUs persisting for several months. The results indicate co-occurrences between abundant viruses and potential hosts during long periods. This study gives new insights into the virus-algal host dynamics and provides a baseline for future studies of algal virus diversity and temporal dynamics.

1. Introduction

Virus-like particles (VLPs) are widely spread throughout the world’s oceans and are considered to be highly abundant (approximately 1 × 10⁷ viruses mL−1), genetically diverse, and dynamic components of the planktonic community [1]. As viruses follow host abundance, total viral abundance is highest in productive coastal waters (~108 viruses mL−1) decreasing offshore and deeper in the water column [2,3,4].
Viruses play a major role in marine ecosystems. They are substantial agents of mortality in marine microbial communities, influencing species distribution and abundance and maintain the coexistence of competing species [5,6]. Consequently, viruses are involved in the transformation of organic matter between microbial biomass and the dissolved organic carbon pool [7,8]. The release of organic matter through the viral shunt has been estimated to be 150 billion tons of organic carbon per year [3]. A strong correlation between viral activity and carbon export by sinking particulate matter has recently been observed [9,10,11,12], indicating that viruses significantly contribute not only to the structuring of host communities, nutrient release, and ecosystem productivity, but also to the downward vertical transport of particulate carbon that comprises the biological carbon pump [2].
Most described viruses infecting algae are large double-stranded DNA (dsDNA), often referred to as giant viruses due to their large genome size (>200 kb) and icosahedral virion structure. They belong to two families: the Phycodnaviridae [13,14] and the Mimiviridae [15]. These two families, together with the Asfarviridae, Iridoviridae, and Poxiviridae make up a monophyletic group [16] referred to as Nucleo-Cytoplasmic Large DNA Viruses (NCLDV [17]). All viruses within the Phycodnaviridae infect algae, while members of the Mimiviridae infect both photosynthetic and non-photosynthetic protists. Viruses infecting photosynthetic protists all fall within one subcluster within the Mimiviridae family, e.g., viruses infecting the haptophytes Phaeocystis pouchetii, Prymnesium kappa, and Haptolina ericina [18,19], while those members infecting heterotrophic protists are polyphyletic [15,20]. Even though the taxon richness of protist-infecting viruses may exceed that of prokaryotes and archaea in the ocean [21], very few genetically characterized taxa with a known host of these two families are available to date.
Studies of algal viruses suggest that they may be species-specific or strain-specific to their host, but many different viruses can infect the same species [19,22,23]. Algal viruses infecting different species have, however, also been described [19]. One approach for measuring these interactions is by correlating viral diversity and abundance with host diversity and abundance to better understand the underlying mechanisms driving the dynamics. Unfortunately, there is no universal marker gene, like the 16S or 18S, common to all viruses [24]. Nevertheless, certain marker genes can be used that capture specific groups of viruses, like the major capsid protein (MCP) of dsDNA algal viruses [25,26,27,28]. By targeting this group of viruses both acute boom-bust infections, where a specific virus can lyse a dense bloom of host cells within hours, and more persistent infections where viruses and hosts can coexist, have been described [26,29]. The latter can be explained by viral resistance, immunity, and/or strain specificity, or by the virus becoming less virulent [30,31,32,33].
In order to expand our knowledge of marine algal virus ecology we have conducted a one-year metabarcoding study of algal viral diversity and dynamics in the Northern Skagerrak, South Norway. We addressed the following questions: 1) Which algal viral OTUs (Operational Taxonomic Units) are dominating the Outer Oslofjorden and can they be linked to characterized algal viruses? 2) How is the algal virus community composition and relative abundance changing over the year? 3) How do the algal viruses co-occur with various co-existing protists? 4) Can co-occurrence analyses give new information about potential virus-algal host relationships?

2. Materials and Methods

2.1. Sampling

Sea-water samples from the Outer Oslofjorden were collected monthly at the OF2 monitoring station (59.17 N, 10.69 E) between March 2010 and June 2011 except for July 2010, when sampling was not performed. The samplings were performed at the same time of the day each month. Niskin bottles (4 × 5 L) attached to a CTD (conductivity, temperature, depth) rosette were used to collect water samples from a depth of 1 m (subsurface) for virus and protist collection (20 L). The water for virus samples were first filtered through a 200 µm mesh sieve to remove zooplankton and then through a 0.45 µm pore-size, low-protein binding, Durapore membrane filters of 142 mm in diameter (Millipore) mounted in a steel tripod (Millipore, Billerica, USA) by peristaltic pumping (Masterflex, Cole-Parmer, IL, USA). Further, samples were concentrated (~10 psig, high speed) to a final volume of 50 mL using the QuixStand benchtop system with hollow 100,000 pore size fiber cartridges (NMWC) and stored in sterile falcon tubes. Then, 10 × 250 µL of the virus concentrate were transferred into sterile cryo-tubes, flash-frozen in liquid nitrogen, and stored at −80 °C until further processing. Water for protist samples were filtered as described previously [34].

2.2. High-Throughput Sequencing

Viral DNA extraction, purification, and PCR amplifications of a part of the MCP gene were done as described in detail in [26], with the exception for PCR re-amplification, where a 2.5 µL template was used. The targeted fragment length of the MCP gene from known viruses ranged ca 347–518 bp [35]. A total of 4 replicates from each sample were then pooled and purified with an AMPure XP bead purification kit (Beckman Coulter, Brea, USA). A pooled sample of 75 µL with a concentration of 22.5 ng µL−1 of DNA, quantified by Nanodrop, was sent for sequencing. Library preparation and Lib-A unidirectional amplicon sequencing was performed on 20 µL of the DNA sample (11 ng µL−1) in a Roche 454 GS-FLX Titanium (Microsynth AG, Balgach, Switzerland). A total of 203,229 viral reads were obtained.
For the protist samples, nucleotide extraction was performed as described in Gran-Stadniczeñko et al. [34]. Shortly, RNA was extracted and amplified using RNA NucleoSpin II (Macherey-Nagel, Düren, Germany). RNA was then reverse-transcribed to cDNA with the High-Fidelity first Strand cDNA Synthesis Kit (Agilent, Santa Clara, CA) with random primers. A PCR of cDNA was performed using the eukaryote specific primers by Stoeck and co-workers TAReuk454FWD1 and TAReuk-REV3 (see [34]). Amplicon library was generated as specified by Roche (Basel, Switzerland) and sequenced with the 454 GS-FLX Titanium platform at the Norwegian Sequencing Centre (NSC), University of Oslo.

2.3. Bioinformatic Pipeline

Viral and protist 454 reads were processed through the QIIME v.1.9.1 pipeline [36]. AmpliconNoise v.1.6.1 and Perseus [37] were used to correct errors of the 454 reads and removed putative chimeras. Clustering of reads into vOTUs (viral OTUs) and pOTUs (protist OTUs) was performed using UCLUST v1.2.22 [38] with a 97% sequence similarity for viruses and 98% for protists.
A total of 582 vOTUs were obtained based on 127,348 reads. Putative spurious data (single singletons, non-algal virus OTUs, and vOTUs that could not be aligned, possibly non-MCP genes), were removed leaving a total of 313 vOTUs. Subsampling was then performed to the minimum read number of 1696 with the “rarefy” option in the Vegan package in R [39]. A complete description of the pOTUs can be found in Gran-Stadniczeñko et al. [34].

2.4. Taxonomic Classification and Phylogenetic Analyses

A first taxonomic assignation of the vOTU nucleotide sequences was done with BLASTn against the Viral GenBank database in ViroBLAST with default parameters [40]. In addition, a phylogenetic placement of vOTUs was performed, based on the amino acid (aa) sequence of the vOTUs. Representative nucleotide sequences from the vOTUs were translated into aa with GeneMark [41,42,43]. When the aa sequence predicted by GeneMark was shorter than the expected length based on the nucleotide sequence (i.e., the aa sequence was less than one third the length of the nucleotide sequence) they were manually inspected. The manual inspection consisted of aligning the nucleotide sequence to the closest hit in GenBank and checking for mutations, insertions, and deletions leading to premature stop codons or frameshifts in the predicted aa sequences. These differences in the nucleotide sequence are most likely due to sequencing errors. Sequences that had wrongly inserted stop codons or frameshifts were manually corrected and translated into an aa sequence. The resulting aa sequences were aligned against a previously published reference alignment [26] of 15 Mimiviridae and 16 Phycodnaviridae viruses, the closest hits in ViroBLAST, and the top hits from the NCBI non-redundant protein database [44]. The top hits from the non-redundant protein database was determined using blastp in Geneious version 10.2.3 [45].
Alignment construction started with sequences longer than 200 aa using MAFFT L-ins-i [46,47]. The shorter fragments were then added to the reference alignment using the addfragment algorithm which takes shorter sequences and adds it to an alignment, keeping the gaps, and the relative position of the characters in the original alignment [48]. Ambiguously aligned positions were removed with trimAl using the gappyout setting [49]. This alignment consisted of 403 virus sequences. A second alignment consisting of only the 22 most abundant vOTUs and the sequences of 15 Mimiviridae and 16 Phycodnaviridae from [26] was constructed with the same approach as the larger dataset. Phylogenetic trees were constructed for both alignments with FastTree2 [50], implemented in Geneious 10.2.3 [45], and visualized in FigTree v1.4.3 [51].

2.5. Network Construction

Association networks were constructed to analyze the co-occurrence of algae and viruses. The dataset was prepared for network construction after first filtering OTUs not present in at least 2 of the samples. The dataset consisted of 342 pOTUs recently described in [34], and 42 vOTUs. Co-occurrence networks were constructed using SparCC [52] as implemented in the R package SpiecEasi [53]. SparCC was run with default settings and with 500 bootstraps. Two-sided pseudo p-values were calculated for both datasets independently and edges with a p-value of >0.05 and a correlation score of <|0.5| were deleted. Protist-protist associations were also deleted, since we were primarily interested in the associations between viruses and protists. The visualization of the networks was done with Cytoscape v3.6.1 [54].

3. Results

We assessed the Phycodnaviridae and Mimiviridae taxonomic composition, vOTU richness, and relative abundance through the year by high-throughput amplicon sequencing (metabarcoding) of 15 samples taken monthly from the Outer Oslofjorden, Skagerrak, Southern Norway. The conserved MCP gene was amplified from all samples and resulted in 126,775 reads of 200–400 bp in length, representing 313 putative algae-infecting vOTUs after filtration, with a 97% similarity clustering, the removal of singletons, and translation into amino acids (aa). The vOTUs were named according to decreasing relative abundance before subsampling. After subsampling to the lowest number of reads per sample (1696 reads), to be able to compare samples, 243 vOTUs remained. None of the rarefaction curves for the 15 samples reached a plateau, indicating that the sequencing depth was not sufficient to capture the full diversity at Outer Oslofjorden (Figure S1). The most abundant vOTU (vOTU 1) contained 53% of all reads. A total of 22 vOTUs had more than 50 reads (0.2% of total reads per vOTU) representing 95% of the total reads and were considered the most abundant vOTUs, whereas 208 vOTUs had each less than 0.1% of the reads (Table S1).

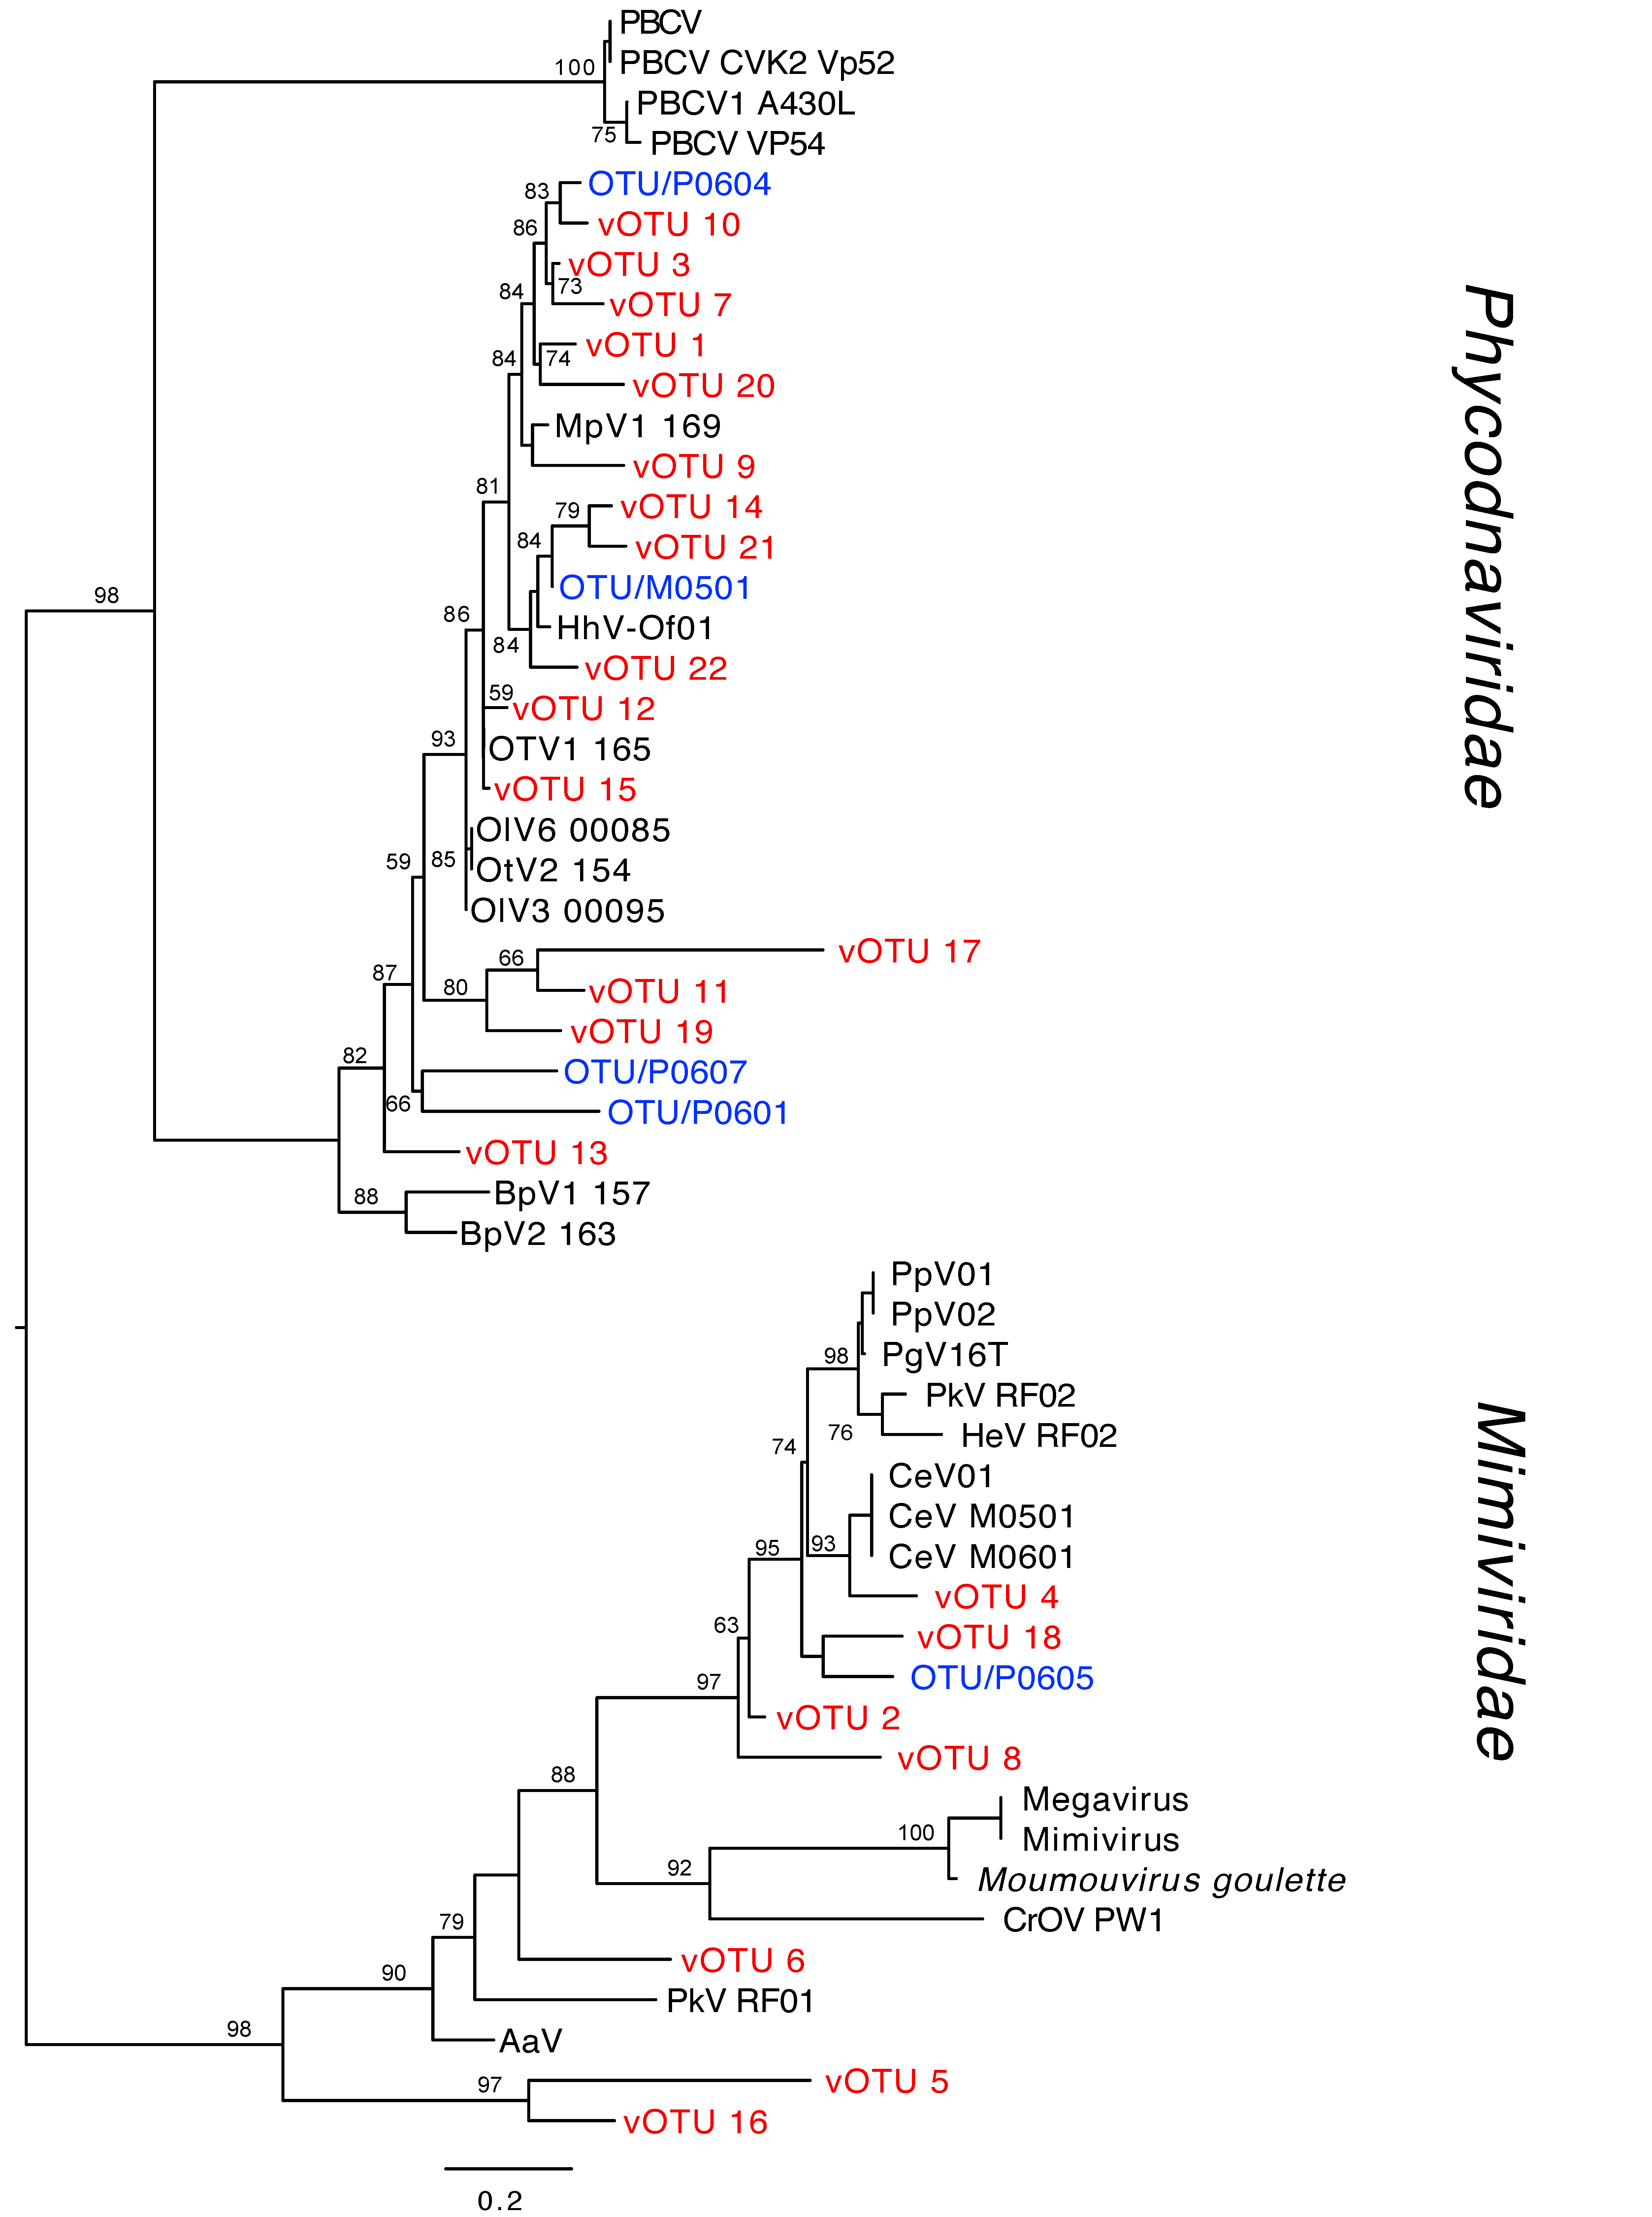
3.1. Virus Diversity

Of the 313 vOTUs, 95 had a similarity ≥90% to reference sequences obtained by BLASTn against Viral Genbank on the ViroBLAST platform (Table S1). Of these, 36 had the best matches to cultured viral sequences. The putative hosts were two haptophytes (Haptolina ericina and Haptolina. hirta) and four prasinophytes (Micromonas pusilla, Micromonas sp. strain RCC1109, Ostreococcus lucimarinus, and O. mediterraneus). A total of 59 vOTUs best matched uncultured environmental MCP viral sequences. The rest had a lower similarity to cultured or uncultured reference sequences, meaning they had not been found elsewhere by metabarcoding.
Phycodnaviridae and Mimiviridae phylogenetic trees based on MCP amino acid vOTU sequences were constructed including all 313 vOTUs (Figure S2, File S1), and 22 of the most abundant vOTUs (>50 reads per vOTU, Figure 1, File S2). The table with accession numbers of reference sequences is presented in Table S2. A total of 54 vOTUs were taxonomically placed within the Mimiviridae and 259 within the Phycodnaviridae families. Several clades in both families did not cluster with any reference sequence and some vOTUs only clustered with uncultured environmental MCP sequences (Figure S2, File S1). Several uncultured environmental reference sequences that originally were classified as Phycodnaviridae were placed in the Mimiviridae clade. Fifteen of the 22 most abundant vOTUs were placed in the Phycodnaviridae family and seven in Mimiviridae (Figure 1). The two most abundant Phycodnaviridae, vOTU 1, and vOTU 3 clustered together with vOTU 7, vOTU 10, and vOTU 20, close to an environmental vOTU from Puddefjorden (Western Norway, OTU/P0604 [35]). They were also placed in the same major clade as vOTU 9 and the sequence of a virus infecting the picoplankton chlorophyte Micromonas pusilla (MpV1) with a bootstrap value of 84%. Three vOTUs (vOTU 14, 21, and 22) clustered with the environmental OTU/M0501 from Raunefjorden (Western Norway [35]) and a virus infecting Haptolina hirta (HhV-Of01) with high bootstrap values (>80%). Furthermore, vOTU 12 and 15 clustered with sequences from a virus infecting Ostreococcus tauri (OtV1 165). The most abundant Mimiviridae vOTUs were vOTU 2 and 4. The vOTU 4 clustered with Chrysochromulina ericina virus (CeV, infecting Haptolina ericina) with a high bootstrap support (95%), whereas vOTU 2 did not cluster with any known viral reference sequence. Furthermore, a new branch consisting of two vOTUs (vOTU 5 and 16) was obtained as a sister to the Mimiviridae family (Figure 1).

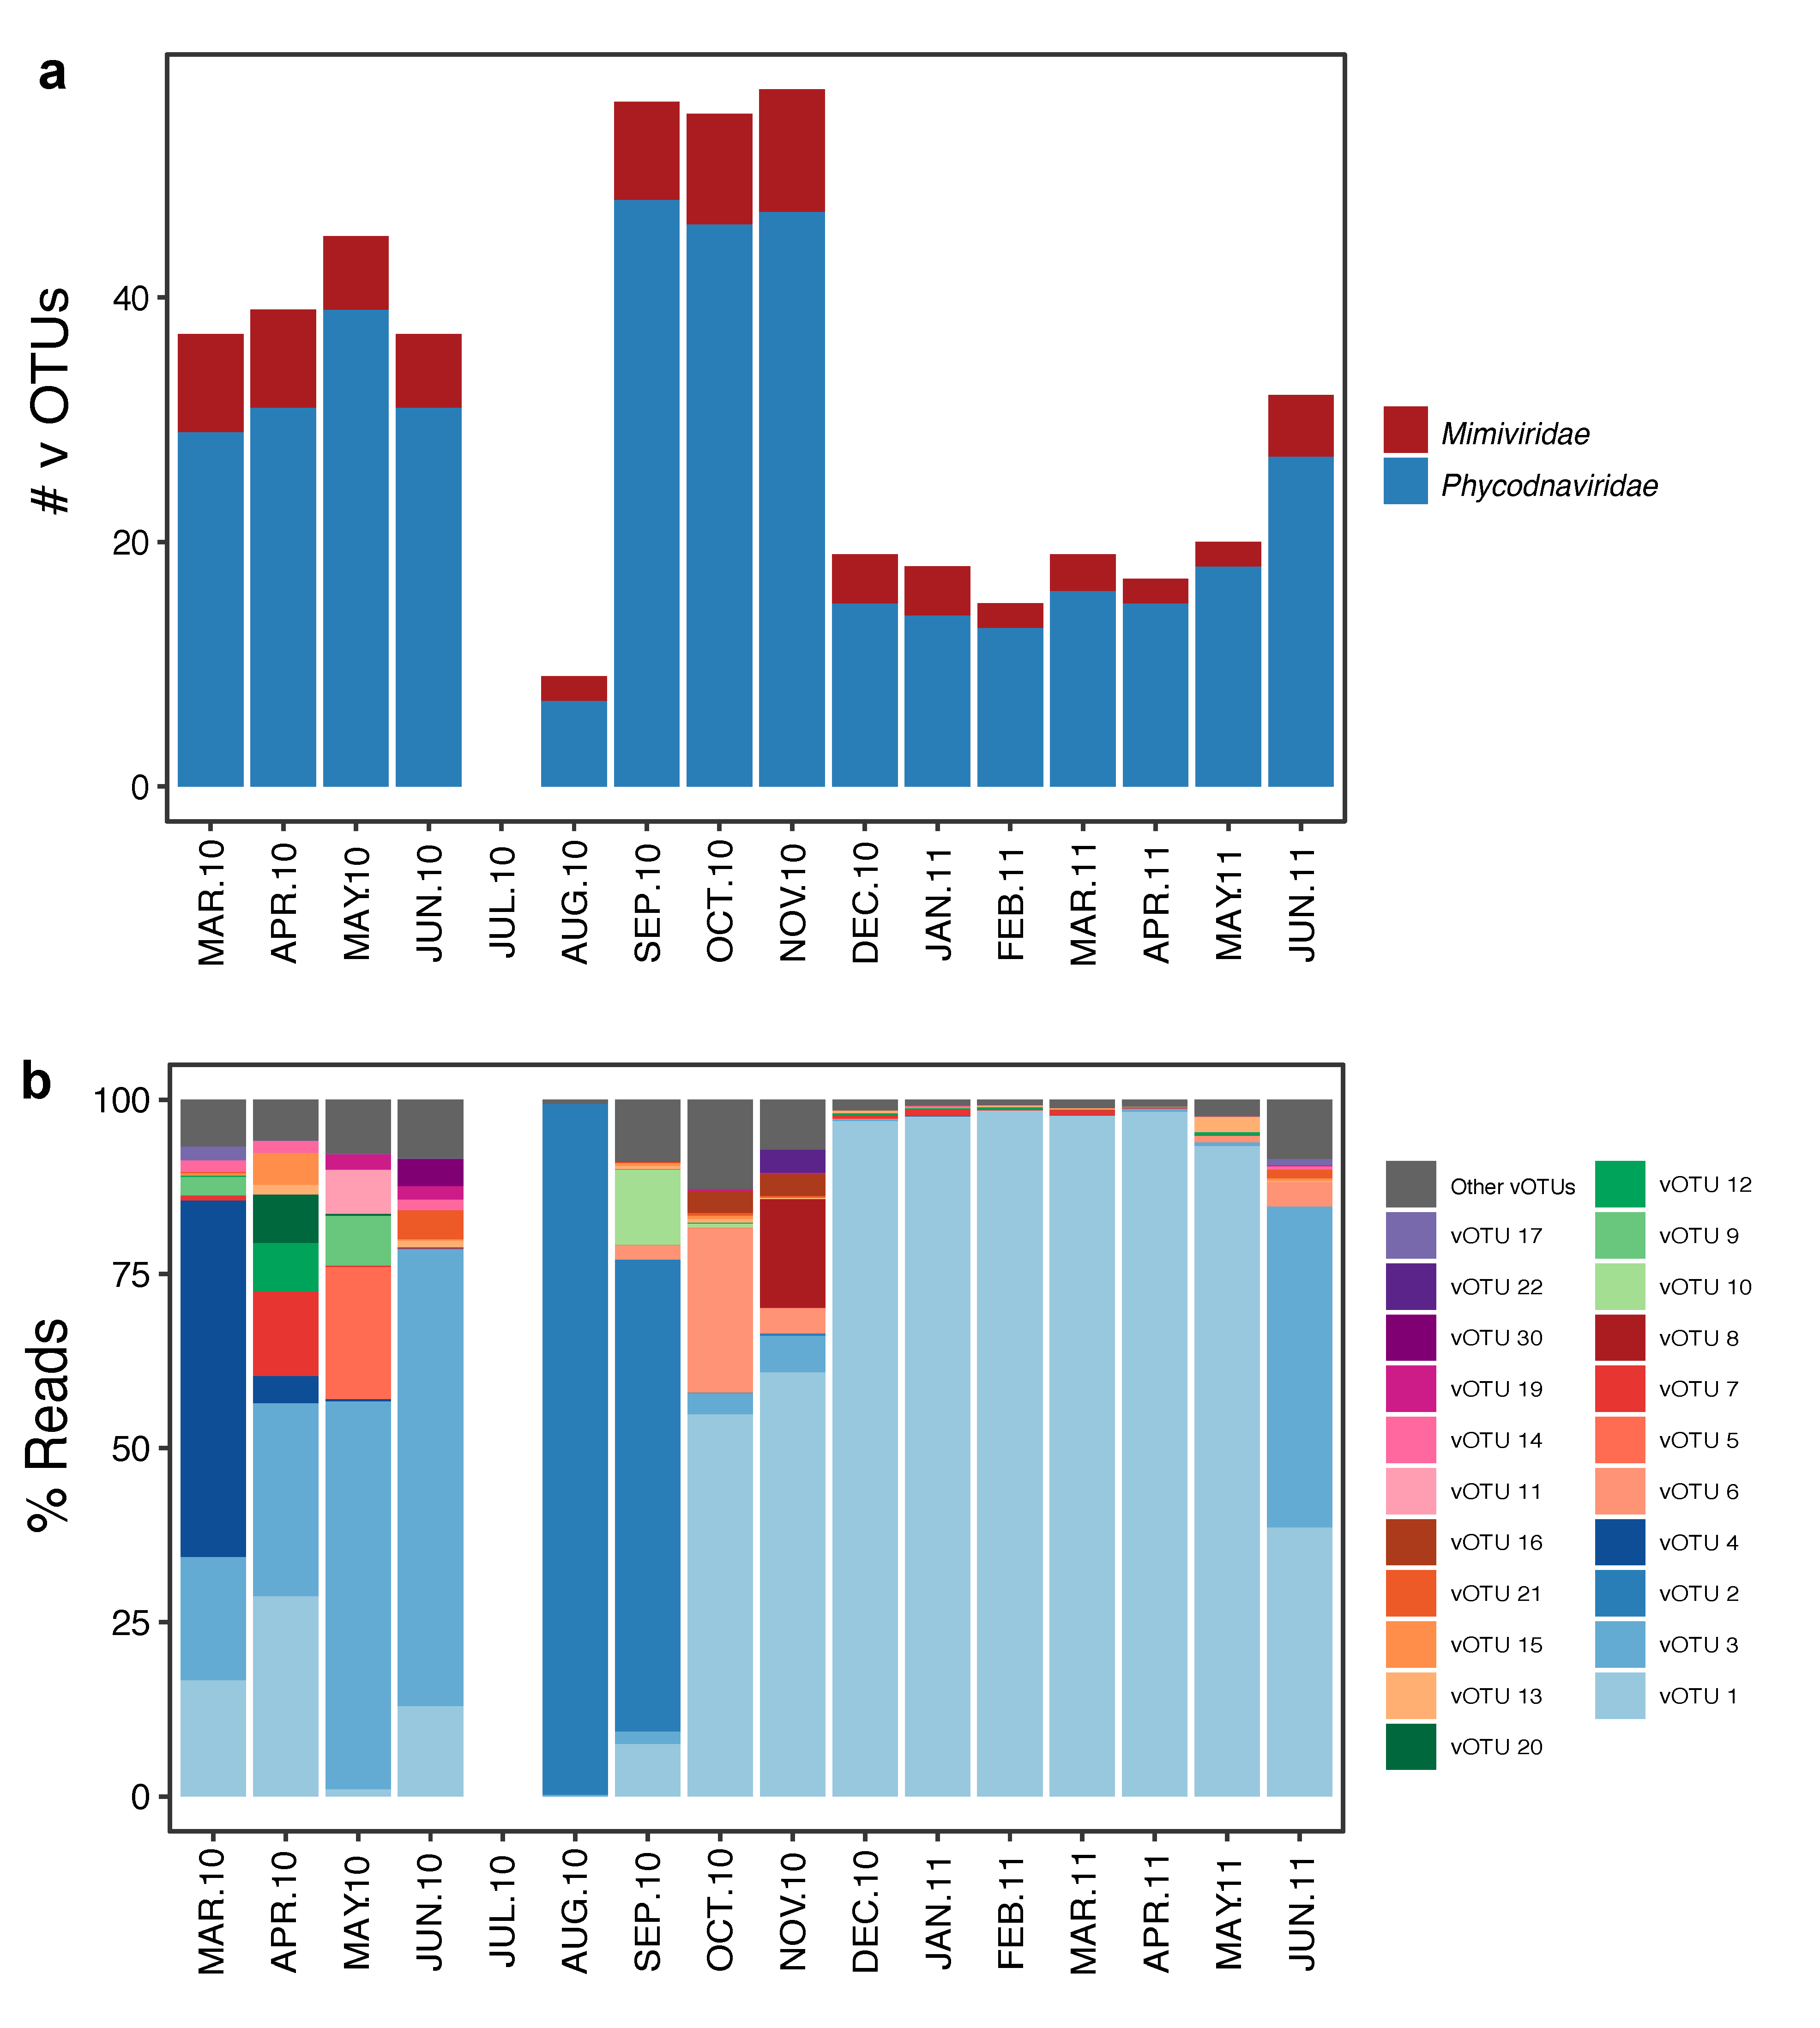
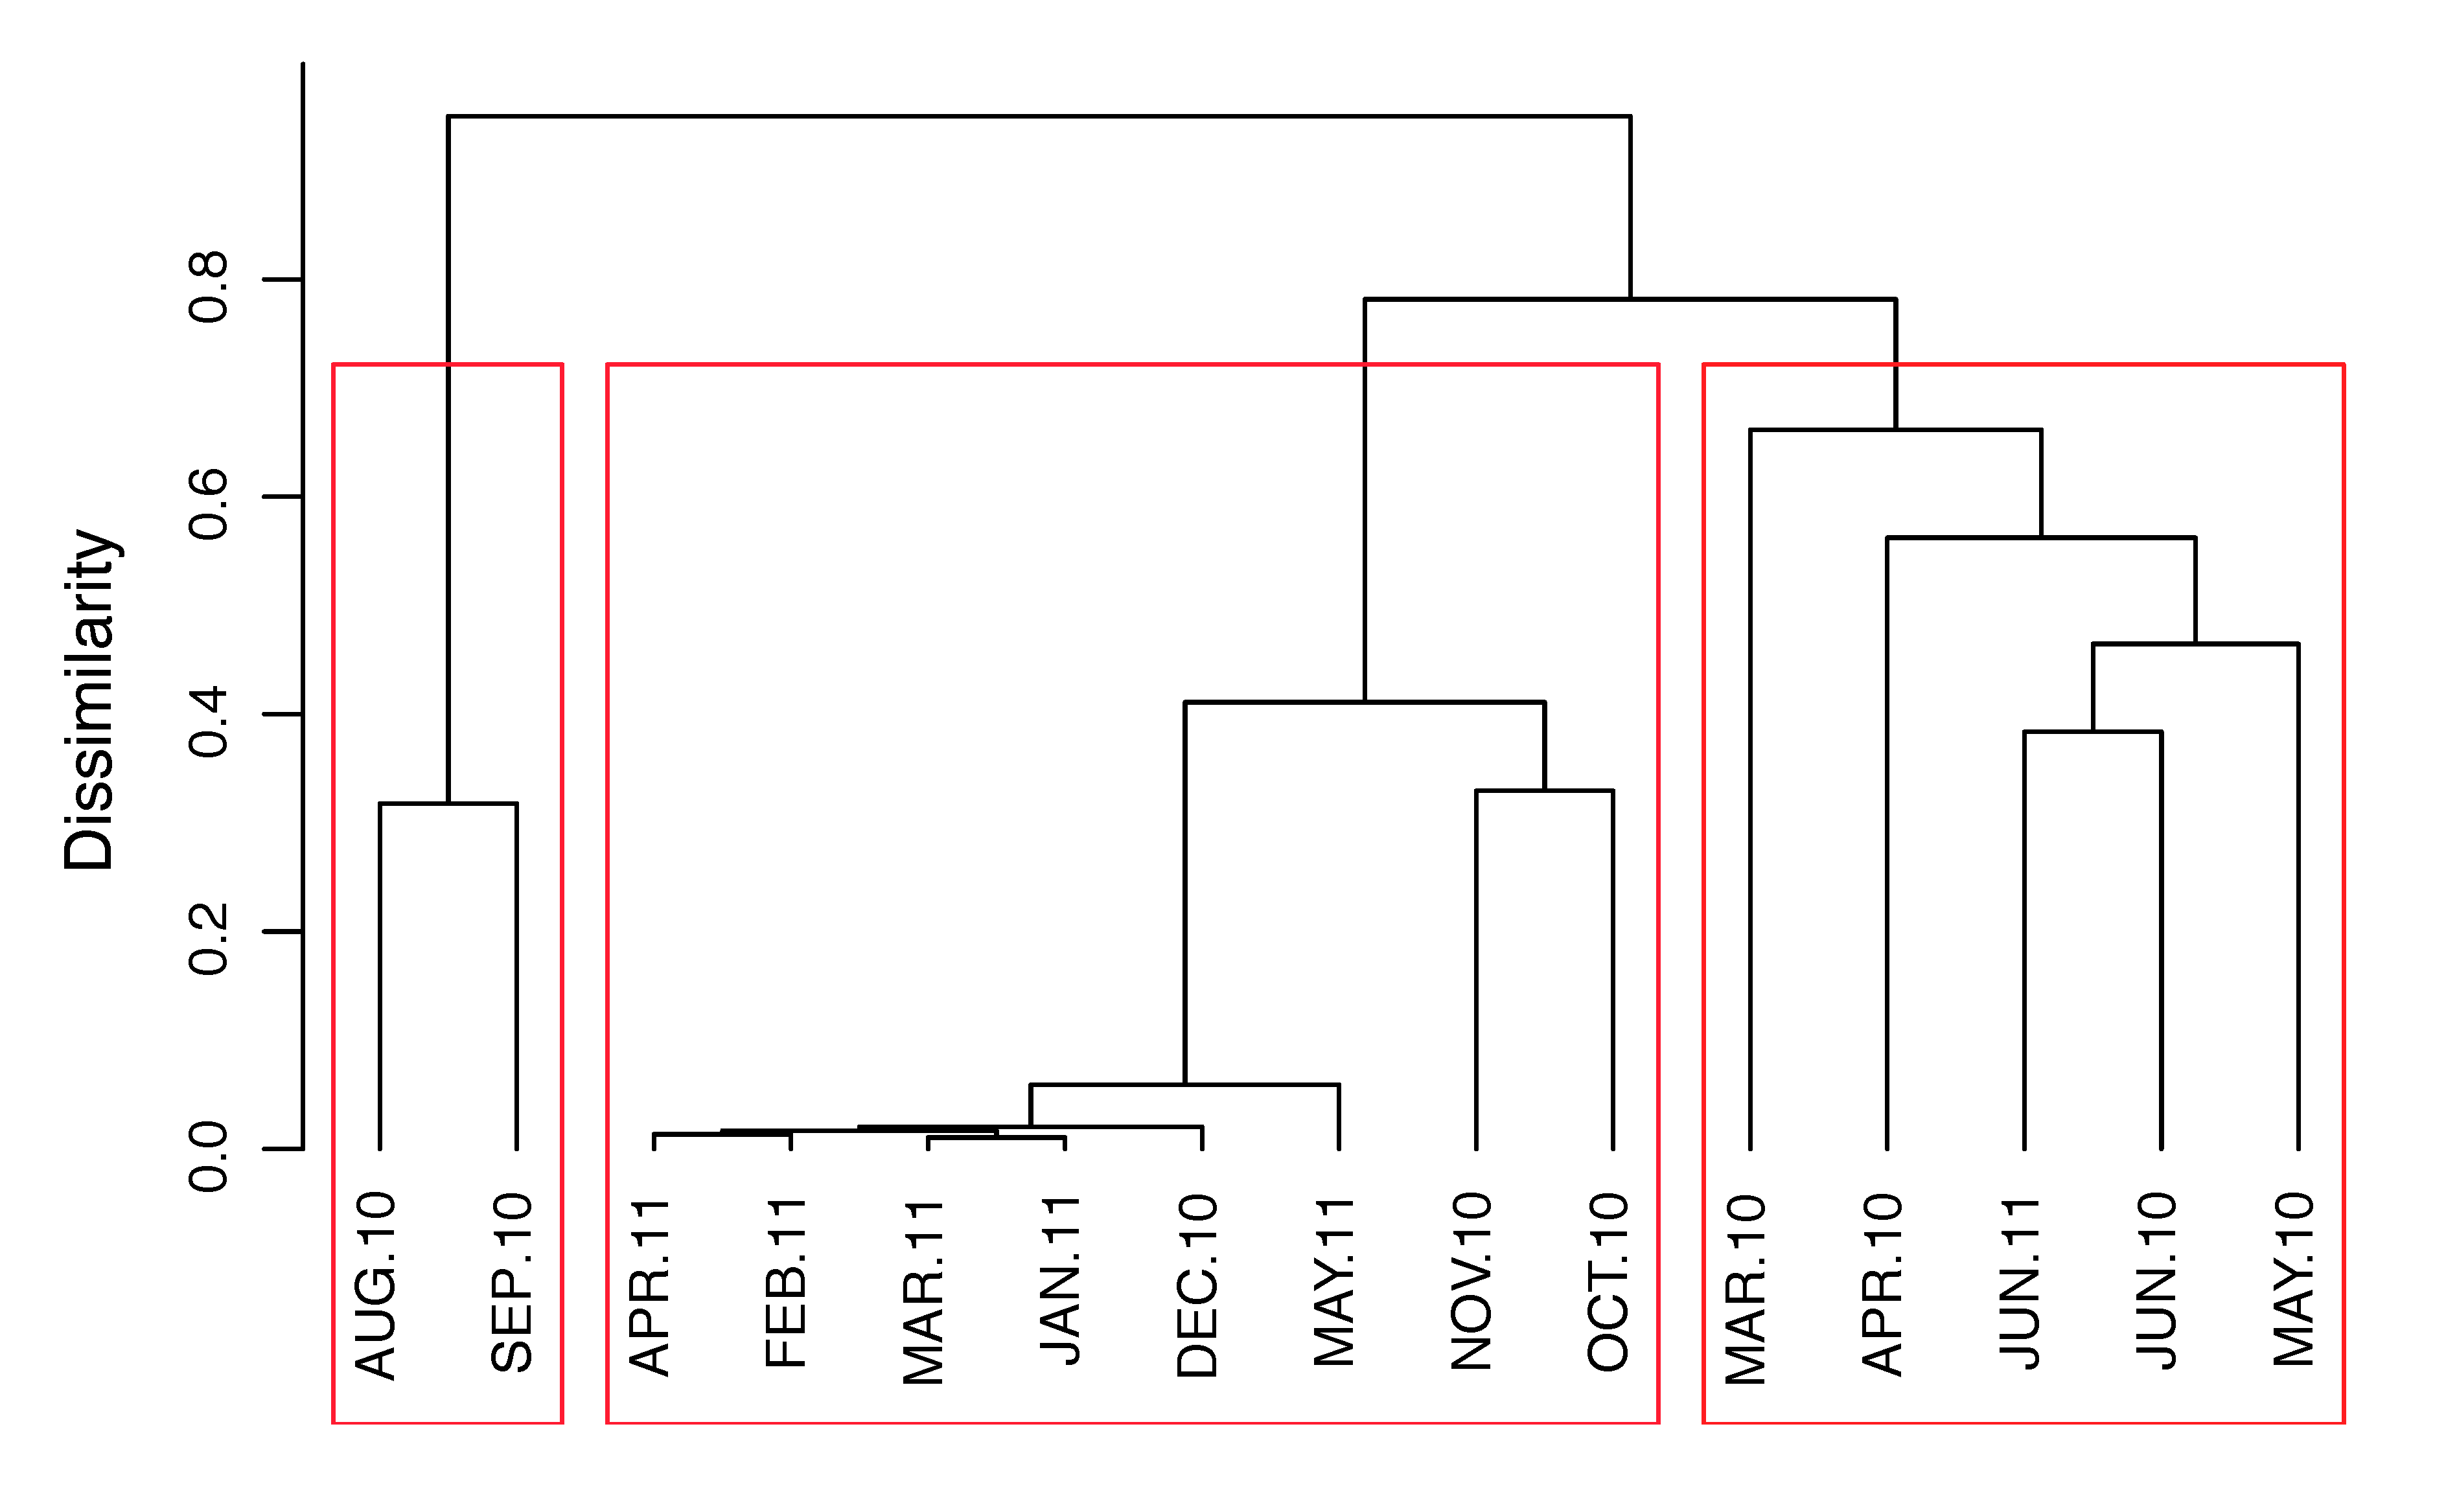
3.2. Temporal Variation

Virus richness was highest from September to November 2010 and lowest in August 2010 (~55 and 9 vOTUs respectively, Figure 2a and Figure S3) whereas the Shannon diversity index was highest in April 2010 and lowest in August 2010 (2.06 and 0.07, respectively, Figure S3). The Phycodnaviridae family was more diverse than the Mimiviridae in all samples (Figure 2a), but Mimiviridae dominated in abundance in March, August, and September 2010, and was negligible from April 2010 to June 2010 and from December 2010 to April 2011 (Figure S4). Among the 22 most abundant vOTUs, six were highly frequent, present in ten or more samples (vOTU 1, 3, 7, 12, 13, and 15), whereas four were only present in one sample (vOTU 8, 11, 22, and 30, Table S1, Figure 2b). The Phycodnaviridae vOTU 1, which clustered close to MpV1, dominated for eight months from October 2010 to May 2011 (Figure 2b). The Phycodnaviridae vOTU 3, also clustering close to MpV1, dominated in May and June 2010 and in the June 2011 samples. The Mimiviridae vOTUs 2 and 4 dominated in the March, August, and September 2010 samples and were rare or absent in other samples.
Hierarchical clustering of samples based on Bray–Curtis dissimilarities showed three well-distinguished clusters. The August and September 2010 samples significantly differed from the other 13 (Figure 3). All samples between December 2010 and May 2011 formed a cluster with highly similar samples that may be explained by the strong dominance of vOTU 1 in these samples (Figure 2b).

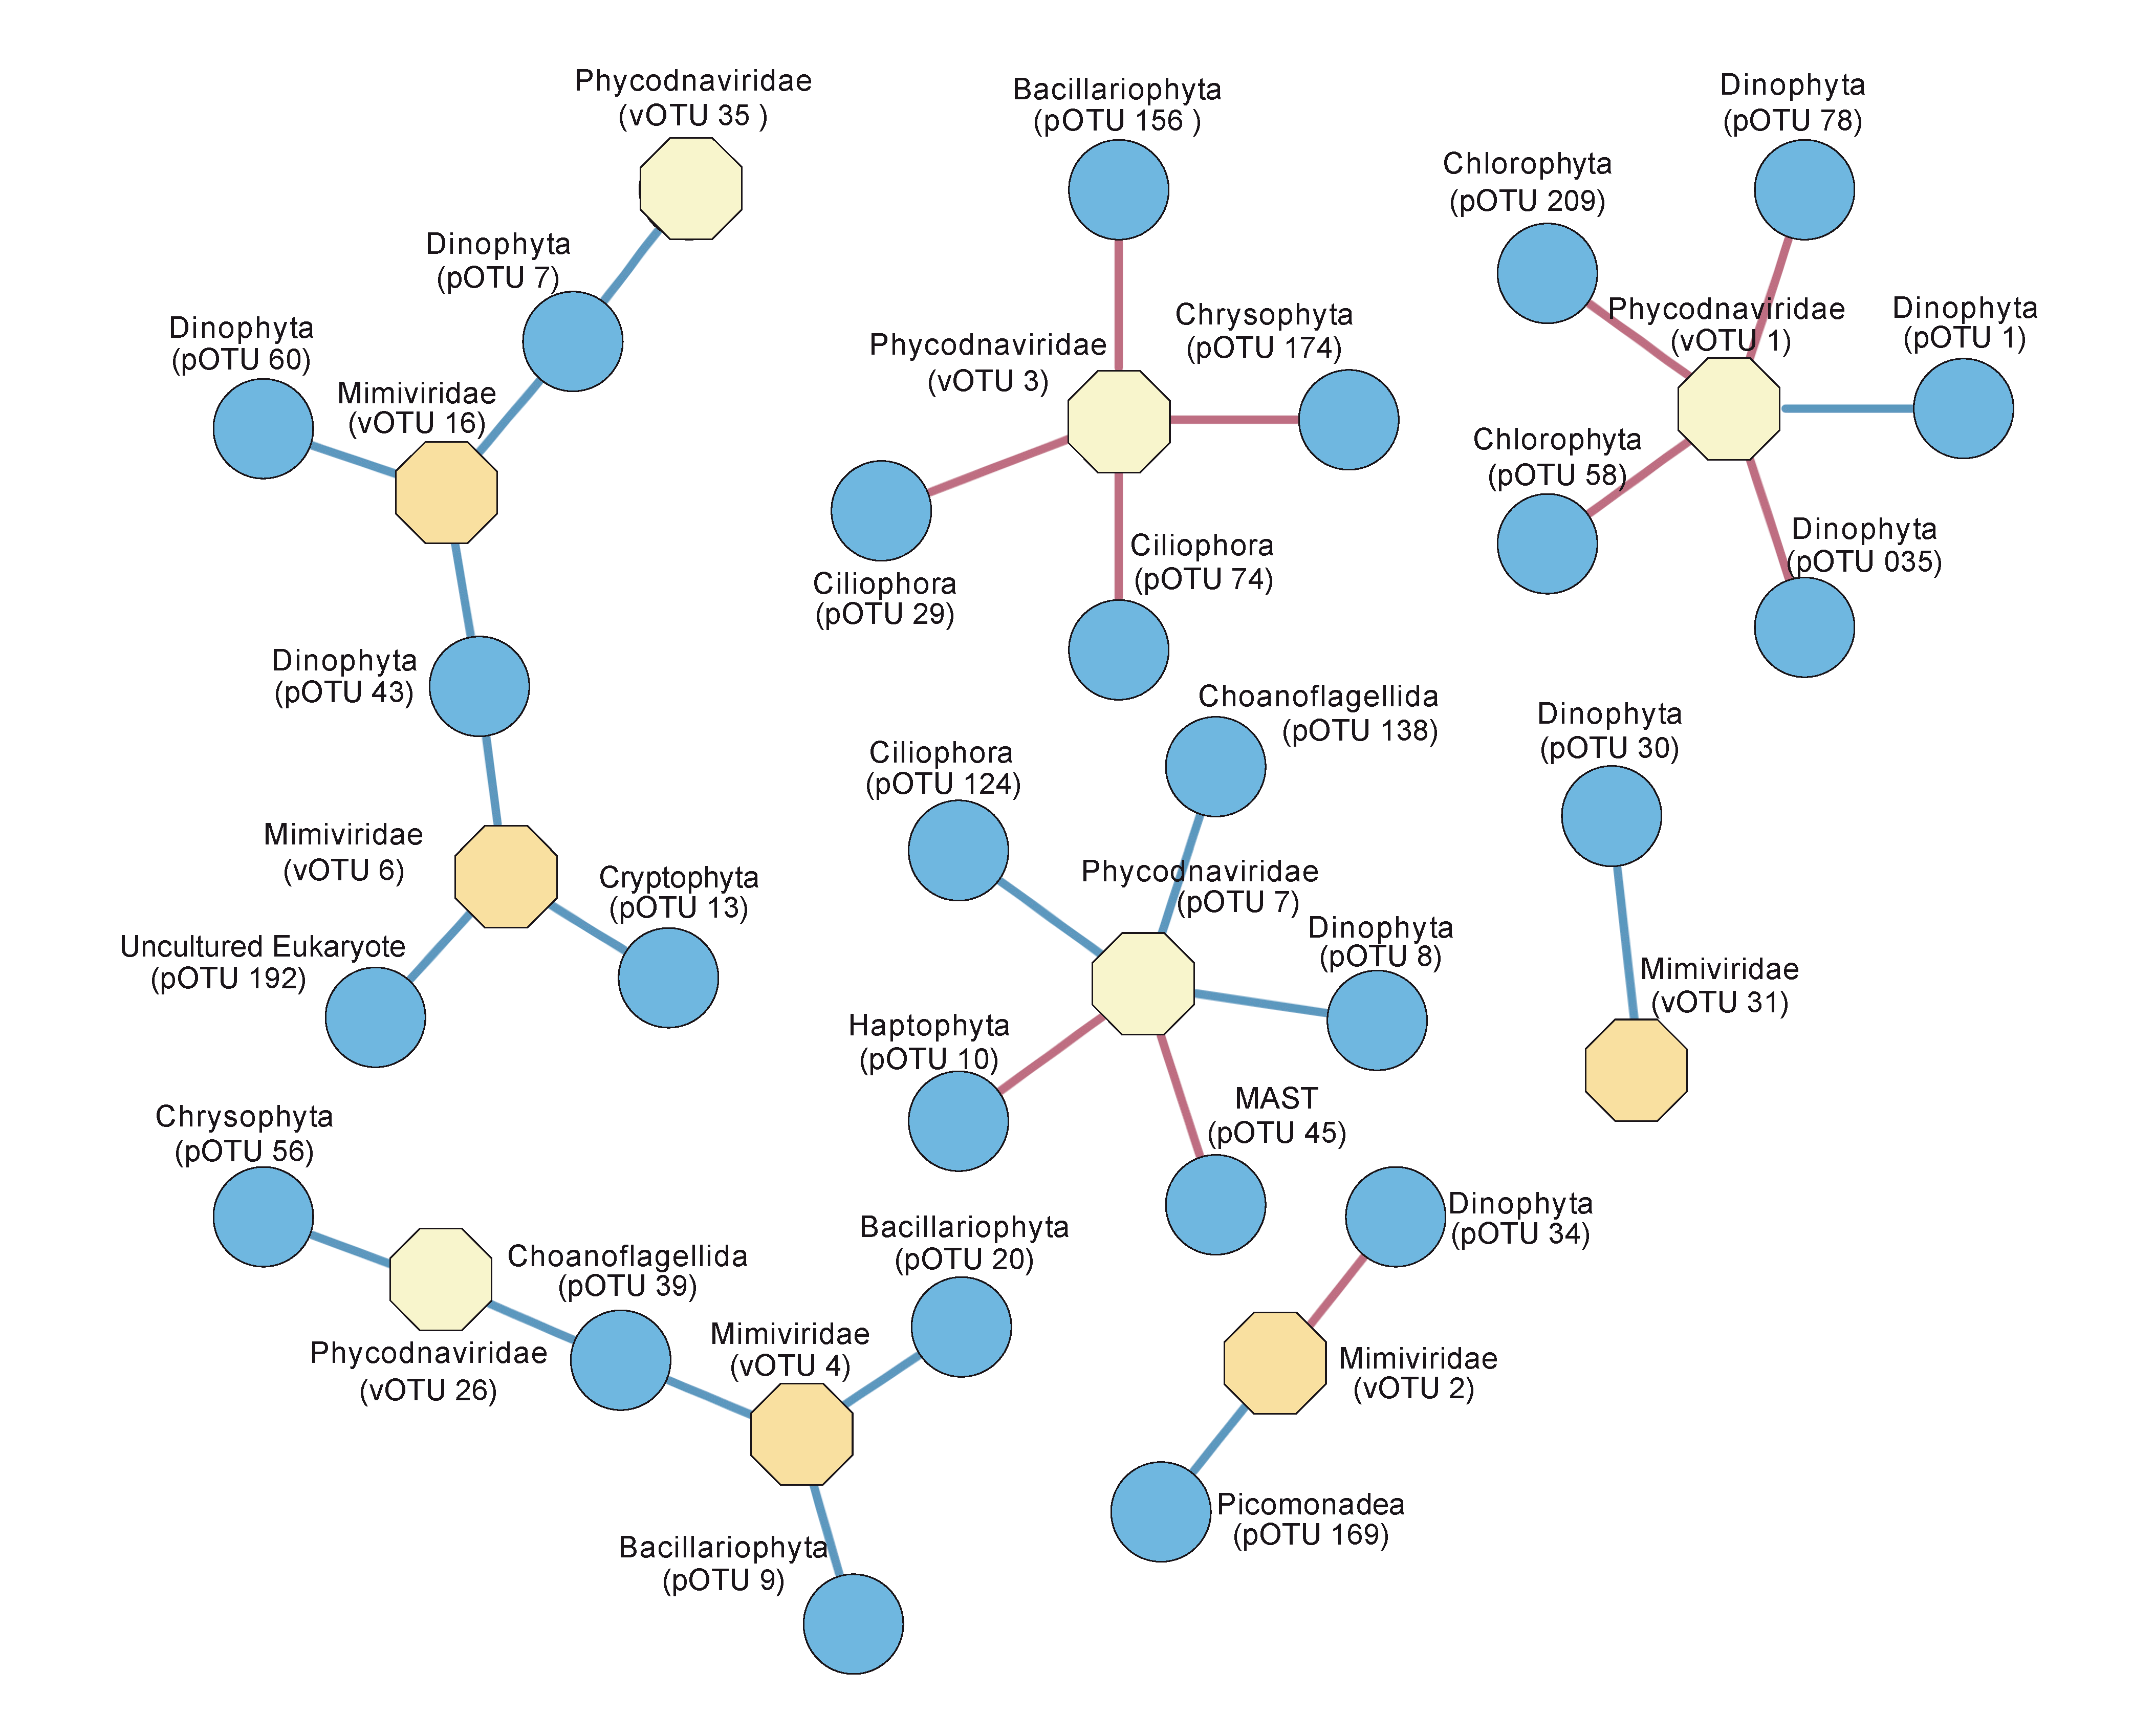
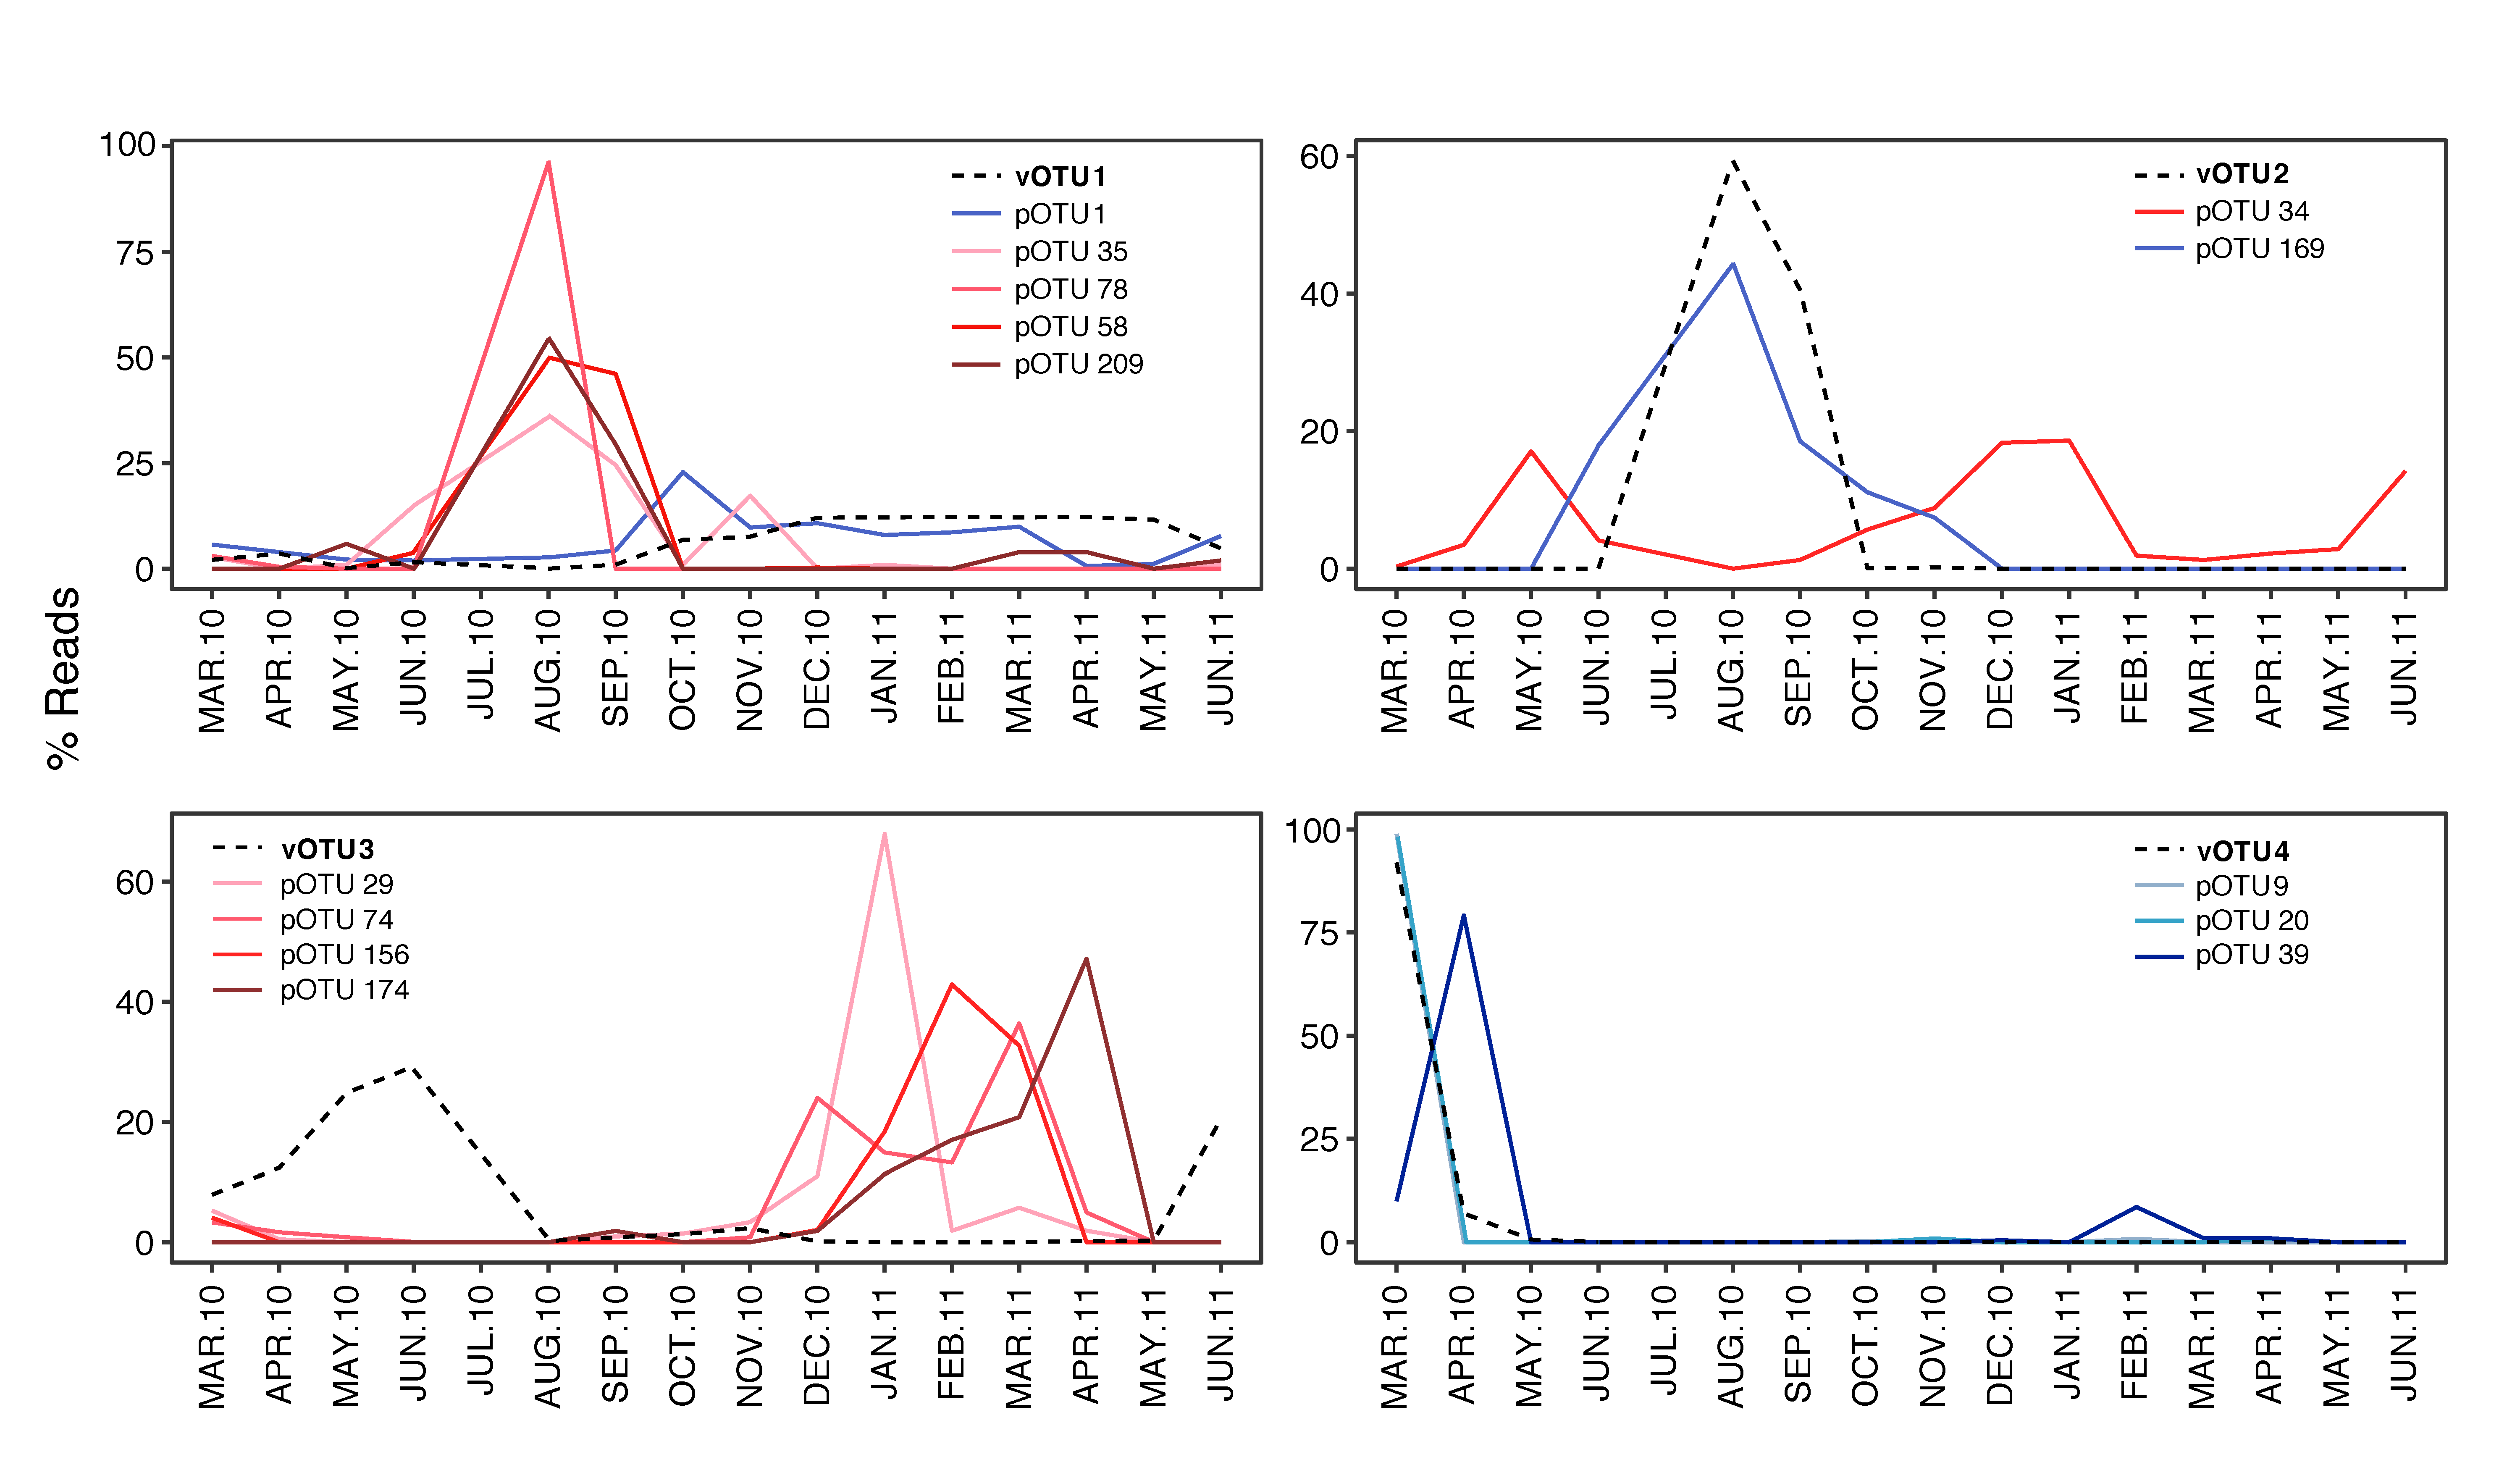
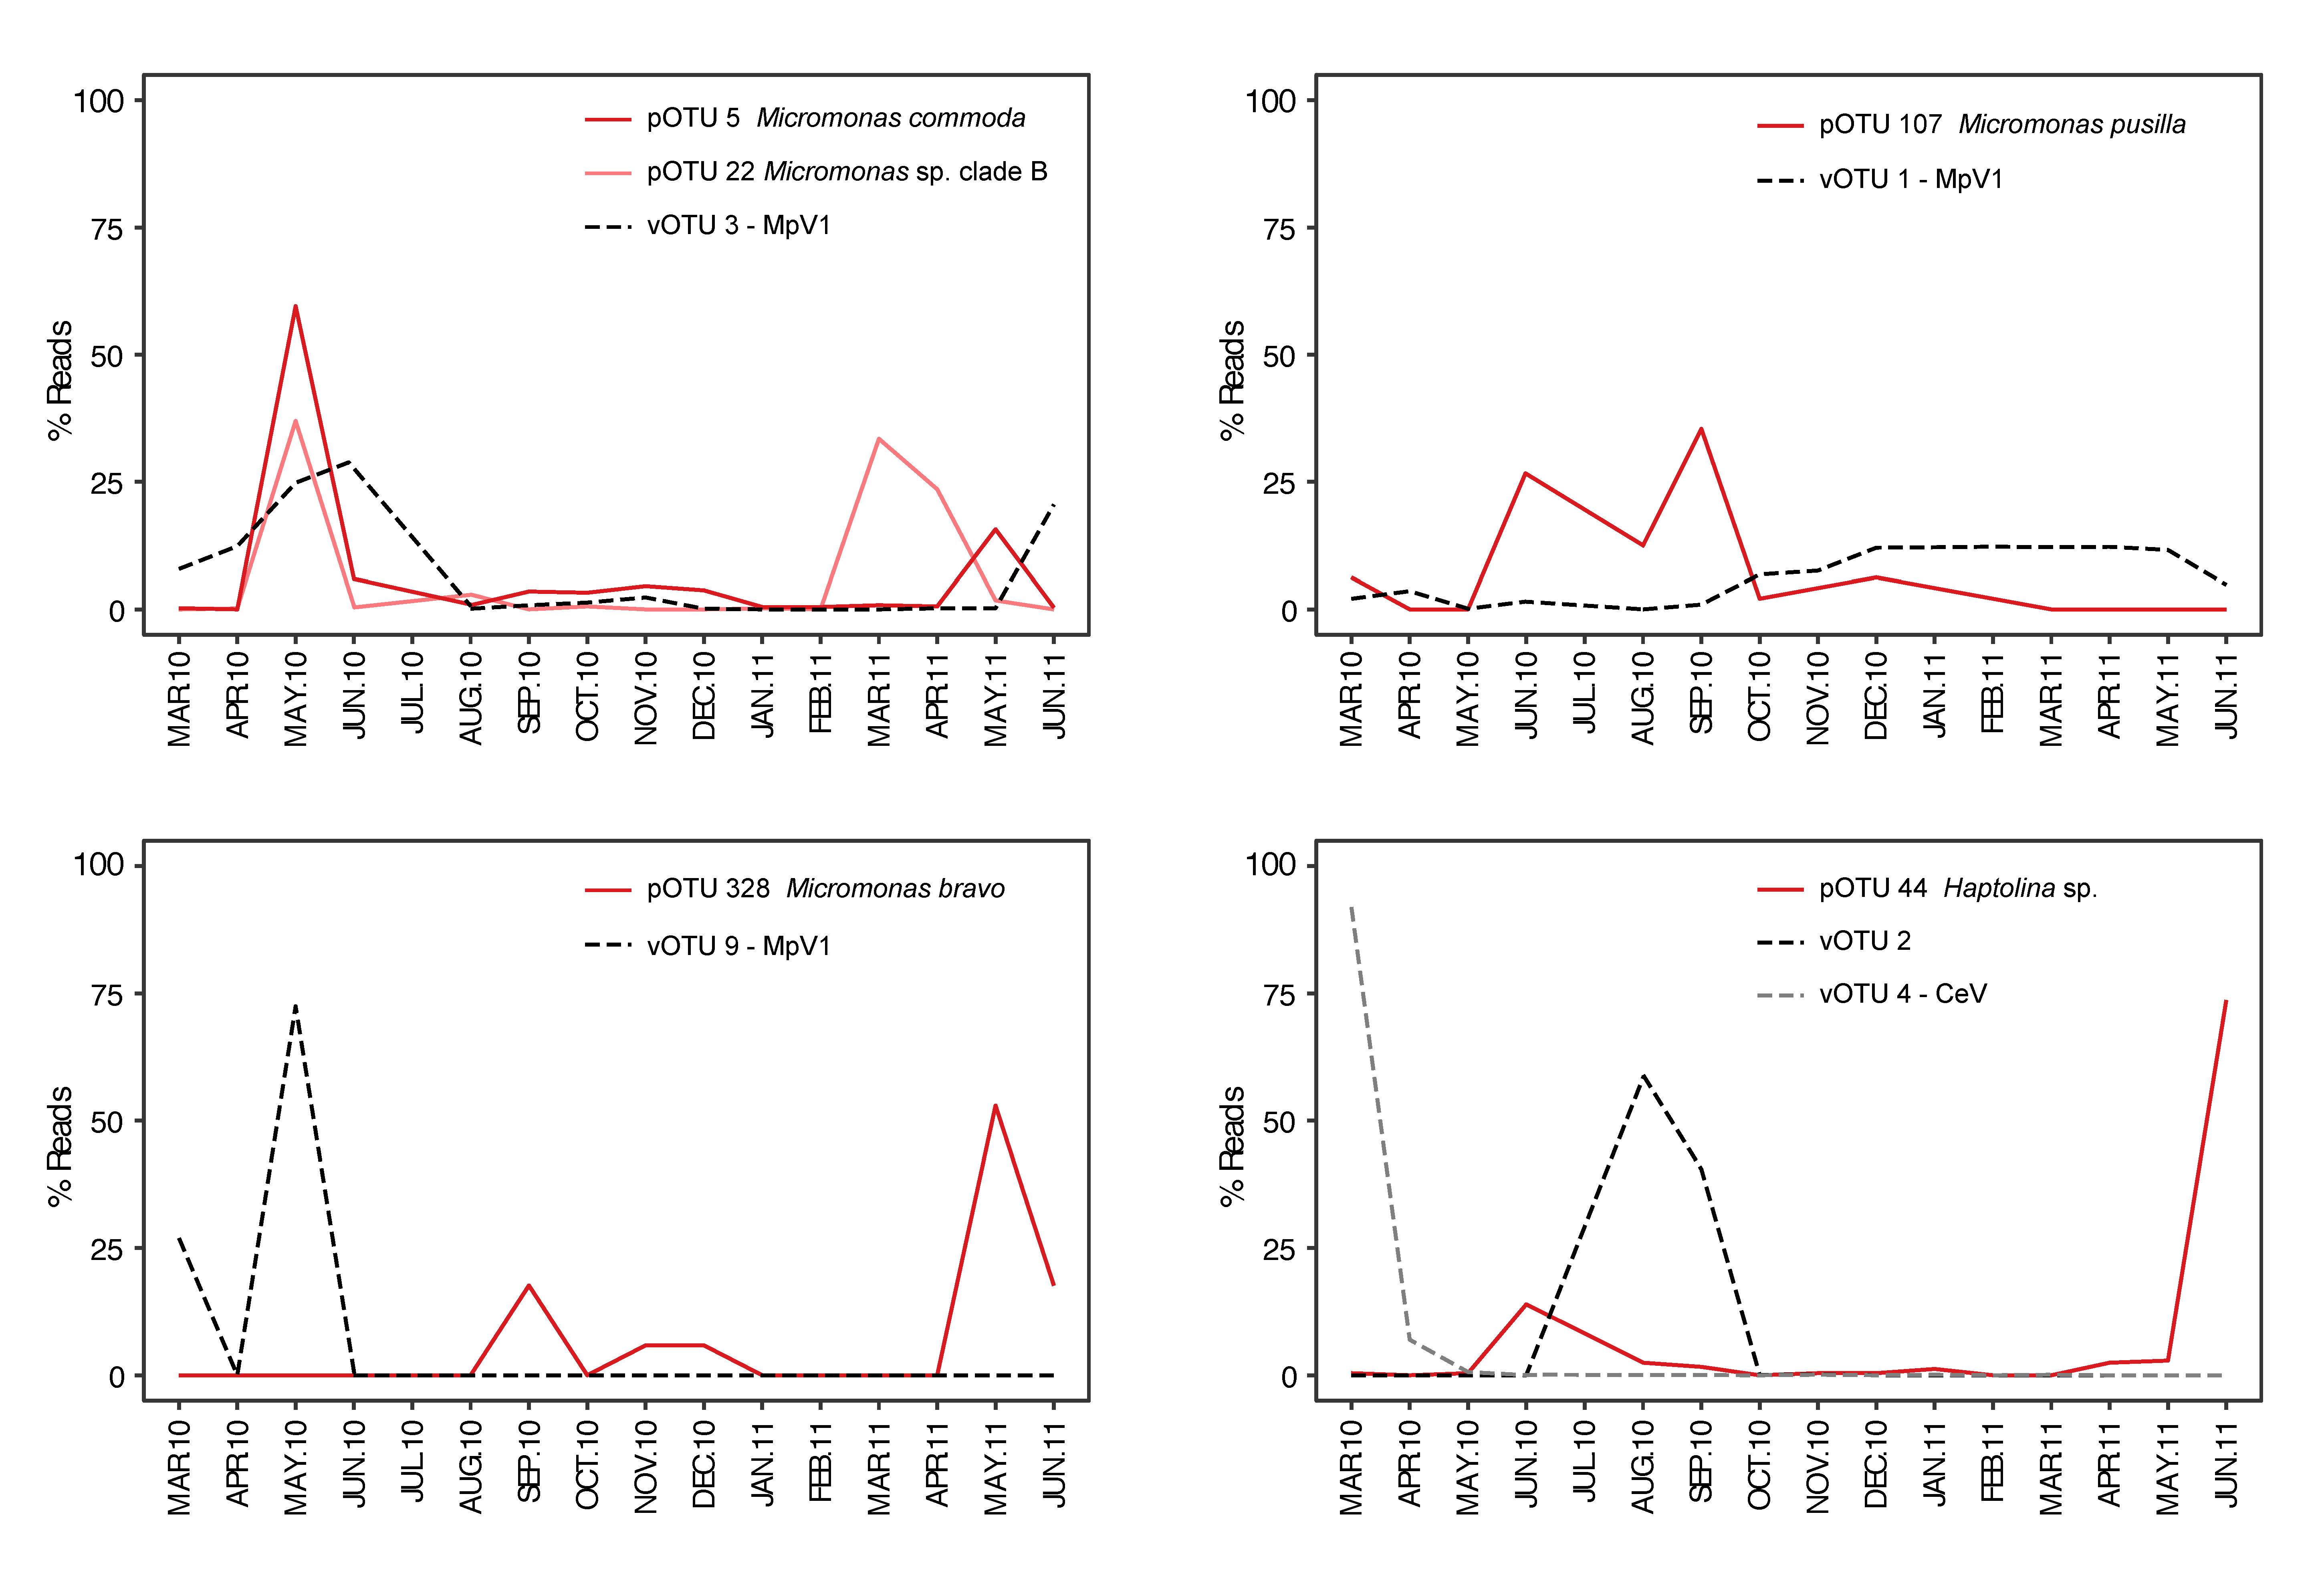
3.3. Temporal Variation of Viruses and their Potential Hosts

Co-occurrence network analyses were done to detect positive and negative protists-virus correlations between our protist [34] and virus datasets (Figure 4) from Outer Oslofjorden. A positive correlation between two OTUs means they show the same pattern of sequence abundance between samples, thus they co-occur. A negative correlation means that they have an opposite pattern of sequence abundance across samples. Networks with a correlation score >|0.5| and p < 0.05 showed no clear positive or negative patterns for Phycodnaviridae and Mimiviridae with pOTUs. The Phycodnaviridae vOTU 1, which clustered with a virus infecting the chlorophyte Micromonas pusilla (MpV1), had negative correlations with two chlorophyte pOTUs that had a best match to Pycnoccocus provasolii. (pOTU 58) and Pyramimonas sp. (pOTU 209), together with two dinoflagellate pOTUs (Figure 4, Table 1), as well as a positive correlation with the most abundant protist, Karenia papillonaceae (pOTU 1). The Mimiviridae vOTU 2, which did not cluster with a known reference sequence, had a positive correlation with a picobilizoan (heterotrophic picoplankton) and a negative correlation with an uncultured dinoflagellate. The Phycodnaviridae vOTU 3 only presented negative correlations with two ciliates, one diatom, and one chrysophyte. vOTU 4, which clustered close to the Chrysocromulina ericina virus CeV, did not show any significant correlation with a haptophyte pOTU, but showed positive co-occurrences with two diatoms and a choanoflagellate (heterotrophic opisthokont protist). Furthermore, the Phycodnaviridae vOTU 7, showed negative correlations with a MAST (uncultured heterotrophic stramenopile), and the haptophyte Emiliania huxleyi, as well as positive correlations to two uncultured alveolates and a choanoflagellate. The remaining Phycodnaviridae and Mimiviridae vOTUs did not show significant correlations with potential protist hosts.
The seasonal dynamics of protists at the Outer Oslofjorden OF2 sampling campaigns have been described in [34]. Figure 5 shows the temporal pattern between the most abundant viruses and their co-occurring protist from Figure 4. Protist and viruses with positive correlations showed similar temporal distributions, whereas protist and viruses with negative correlations showed opposite temporal patterns. The protist with negative correlations with vOTU 1 showed a similar temporal pattern, with its highest abundances in July and August.
Combining the distribution pattern of the most abundant vOTUs assigned to a cultured virus with a known host, with that of their putative protist host ([34], Figure 6) shows a temporal variation for all vOTUs and pOTUs. For M. commoda, M. sp. clade-B-subarctic, M. pusilla, and Haptolina sp., the vOTUs occurrence occasionally overlapped with that of the hosts’ and peaked after a drop of the hosts’ abundances, whereas no overlap between abundances of Micromonas bravo and MpV1 was observed.

4. Discussion

4.1. Viral diversity

This is the first metabarcoding study on algal viruses from the Skagerrak and Oslofjorden. Here we have studied viruses in seawater passing a 0.45 µm pore-size filter, which include both free, non-cellular viruses and those within host cells that might have been disrupted during filtration. Using MCP gene metabarcoding we revealed a relatively high diversity of algal viruses compared to previous studies in Norwegian coastal waters [26]. In the previous study, however, a clustering level of 95% was used, which might mask some of the diversity by including more variation in the same vOTU. The MCP gene is a commonly used marker for algal viruses, but the primers are known to not amplify the totality of dsDNA MCP diversity, such as EhV and phaeovirus [35]. Based on the MCP gene, we obtained 313 vOTUs, all classified by phylogenetic analyses to either the Phycodnaviridae or Mimiviridae families with high bootstrap support (>60%). A total 12% (36 vOTUs) had a best match with BLASTp to a cultured algal virus, whereas 70% (218 vOTUs) had 89% or a lower similarity to any available virus sequences. Furthermore, by phylogenetic placement, the majority of the vOTUs formed clades without any reference sequence. This is in accordance with previous studies, e.g., by Clerissi et al. [55], pinpointing the lack of characterized algae-infecting viruses and the need for more cultured and characterized reference strains. Several of the uncultured vOTUs have been classified as Phycodnaviridae but were in our study placed in the Mimiviridae clade: ABU23699, ABU23704 [35], AHN92263, AHN92262, AHN92288, AHN92249 [56], and AGI16567 [57]. Originally, all dsDNA icosahedral viruses infecting photosynthetic protists were first classified as Phycodnaviridae. Recent phylogeny based on Nuclear Cytoplasmic Large DNA Viruses (NCLDV) orthologous genes, however, showed that many of the large dsDNA algal viruses belong to the Mimiviridae (references in [15]). The taxonomy of algal viruses is at present under revision by the ICTV. A revision of the taxonomy of algal virus reference sequences in gene databases will therefore be needed once a new approved classification is available.
Of the 22 most abundant vOTUs, seven were assigned (by phylogeny and BLAST, ≥90% similarity) to cultured marine viruses infecting different protist taxa such as Micromonas pusilla virus (MpV1), Haptolina hirta virus (HhV-Of01), Ostreococcus spp. viruses (OtV, OlV, and OmV viruses), and Chrysochromulina ericina viruses (CeV, Haptolina ericina was previously named Chrysochromulina ericina). Members of the genera Micromonas and Haptolina are common phytoplankton species in the Oslofjorden [26,34,58]. Micromonas pusilla was until recently the only described species of this genus, but was divided into several species by Simon et al. [59]. Micromonas commoda was the most abundant Micromonas species in Outer Oslofjorden OF2 station, but M. pusilla, M. bravo, and M. sp. clade-B-subarctic were also detected [34]. We found several vOTUs assigned to MpV1, which may turn out to have different Micromonas species as their hosts. The picoplanktonic prasinophyte genus Ostreococcus has a wide distribution in temperate to tropical marine waters, but was not recorded by metabarcoding north of 60°N by Tragin and Vaulot [60]. The vOTUs 12 and 15 were in our phylogenetic analysis clustering with the cultured and genome characterized strain OtV-165, isolated from the English Channel and infecting Ostreococcus tauri, strain OTH95 [61]. With BLAST, however, vOTUs 12 and 15 had a best match to the OmV1 virus, infecting Ostreococcus mediterraneus. Due to this incongruence, we classified vOTU 12 and 15 as Ostreococcus sp. virus (Table S1). Both O. tauri and O. mediterraneus were recorded for the first time from Outer Oslofjorden station OF2 by Gran-Stadniczeñko et al. [34], and are thus potential hosts of these viruses, despite previously having been found mostly in warmer waters [60].

4.2. Succession of Viral OTUs and Potential Hosts

The viral community at Oslofjorden showed a clear temporal variation, but not a recurring seasonal pattern as has been demonstrated in other studies (e.g., [62]). The lack of seasonality could be due to methodological limitations such as primer pairs targeting only a small fraction of the algal virus population or PCR biases towards the amplification of certain genotypes. A too low sampling frequency should also be considered as viral communities change fast (e.g., due to high virus decay rates), and thus boom-bust episodes may be overlooked. A boom-bust episode here refers to a cycle predicted in host and virus population dynamics when host and virus abundances oscillate such that there is a peak in host abundance, followed by a decline that corresponds to a peak in virus abundance. Furthermore, the fact that some pOTUs were not observed in two consecutive samples could be due to different abiotic or biotic factors (e.g., grazing or nutrient availability), and not to viral lysis. Therefore, we may need closer sampling intervals (e.g., weekly or even daily) to catch a direct link between host and virus [63]. Another explanation may be the interannual variation of the host community structure. Algal viruses may require a certain density of the host for infection, which may vary from year to year (see review by Short [64]).
The newly described species Micromonas commoda, recently separated from Micromonas pusilla [59], showed the highest relative abundance during May 2010 and then decreased abruptly in the following months [34]. Our temporal comparisons with potential hosts showed that the vOTU 1 (clustering with MpV1) had an opposite pattern compared to M. pusilla, which decreased in abundance from September to October 2010, at the same time as the vOTU 1 was gradually increasing in abundance. The MpV1-like vOTU 1 was the most abundant vOTU and dominated for eight months. Furthermore, vOTU 3 had an affinity to MpV1 and was among the most abundant vOTUs from March to June 2010 and increased in abundance when the potential host M. commoda decreased. In a previous study of the Micromonas pusilla virus (MpV) in the Skagerrak-Kattegat area, Sahlsten [65] similarly found the highest abundance during spring and lasting for several months. Zingone et al. [66] found likewise the Micromonas infecting virus MpV to persist in the water for a long period. Additionally, Zingone et el. [67] found that some strains of Micromonas were resistant to viral infection. A coexistence between virus and host during long periods is the most observed pattern in our study, as most of our vOTUs are present at several timepoints (see Figure 2b, Figure 5, and Figure 6) and has also been seen in several other studies [26,27,28]. A persistent relationship is in agreement with the evolution theory on parasite prey interactions (see Opinion by Sandaa and Bratbak [29]) as any ecologically successful parasite will ensure host survival rather than mortality. Viruses may hence be expected to evolve from causing acute infections with high mortality towards less virulent and more persistent infections. Assuming that this theory is correct, most virus-host interactions in nature should be persistent since they have evolved over a long period [68,69]. Another explanation would be that these viruses might infect several similar or even different hosts, allowing them to proliferate on different host species [19].
In contrast, the most abundant Mimiviridae vOTU 2 and 4 appeared to dominate during shorter periods or specific time-points. This pattern is generally described for lytic viruses and suggests that these Mimiviridae viruses have a boom-bust relationship with their host, causing acute infections and killing nearly all host cells. This viral-host interaction can be observed once or twice during the study period. Johannessen et al. [26] found a similar temporal distribution pattern with some algal virus OTUs highly abundant only at specific time-points, although most viral OTUs were persistent. Most studies of algal viruses and their hosts have focused on the boom-bust system, probably as these are easier to detect.
Finally, the temporal variation in abundance of co-occurring viruses and protists (Figure 5) explains our network results. vOTU 1 (MpV1), for instance, had a positive relationship with pOTU 1 assigned to Karenia papillonaceae in addition to four negative correlations to photosynthetic taxa (two chlorophytes and two dinoflagellates) that varied similarly through the year. These positive/negative correlations do not necessarily imply that the viruses are able to infect such diverse hosts, but that they may influence one host group which in turn affect the growth conditions for others. Alternatively, the protist groups show similar or opposite responses to other environmental factors than viruses.

5. Conclusions

All vOTUs could be classified to either Phycodnaviridae or Mimiviridae based on their major capsid protein amino acid sequence. Phycodnaviridae showed both the highest richness and relative abundance. We obtained 313 vOTUs and a majority did not match with any cultured or environmental sequences available in gene databases (70% at a ≥90% similarity). A total of 12% of the vOTUs had an affiliation to a known cultured virus with either a putative prasinophyte or haptophyte algal host. These hosts have all been found in the Outer Oslofjorden. The viral dynamics show a clear temporal variation with some vOTUs persisting for several months, suggesting they co-exist with their hosts, whereas others were present at specific time points, suggesting a possible boom and bust relationship with their hosts. The co-occurrence analysis could not with any certainty reveal new host relationships, but suggests some relationships to be examined in future studies. The comparison between the relative abundance of viruses and of their potential hosts can give new insight into the virus-algal host dynamics and the ecological role of algal viruses. This study also provides a baseline for future studies of algal virus diversity and temporal dynamics. With more cultured and genetically characterized viruses, more of the viruses reported here may be connected to a host and contribute to a better understanding of the ecological importance of algal viruses and their distribution in space and time.

Supplementary Materials

The following are available online at https://www.mdpi.com/1999-4915/11/11/1043/s1, Figure S1: Rarefaction curves for the MCP reads at the different samples obtained at Outer Oslofjorden. Figure S2: Phylogenetic tree based on available Phycodnaviridae and Mimiviridae MCP reference sequences (black), vOTUs found in a previous study in Raunefjorden (blue, [35]) and all algal vOTUs obtained from Outer Oslofjorden (red), available at: https://figshare.com/s/7ff5a7e14308dea9394f. Figure S3: Virus OTU Richness and Diversity over time at the OF2 station. Figure S4: Proportional abundances of Phycodnaviridae and Mimiviridae over time at Outer Oslofjorden. Table S1: MCP vOTUs recorded at station OF2 during the sampling period March 2010 to June 2011 with number of reads in each sample and taxonomic placement. OTUs marked in red were removed after subsampling, available at: https://figshare.com/s/7ff5a7e14308dea9394f. Table S2: Isolated members of the Phycodnaviridae and Mimiviridae families used in Figure 1 study with GenBank accession numbers for the MCP, File S1: Fasta file with MCP AA alignment used for the complete phylogenetic tree presented in Figure S2, available at: https://figshare.com/s/7ff5a7e14308dea9394f. File S2: Fasta file with MCP AA alignment used for the phylogenetic tree with the most abundant vOTUs presented in Figure 1. Available at: https://figshare.com/s/7ff5a7e14308dea9394f.

Author Contributions

Conceptualization, S.G.-S. and B.E.; methodology, all authors; software, S.G.-S., A.K.K., and S.Y.; validation, S.G.-S., A.K.K., and B.E.; formal analysis, S.G.-S., A.K.K., S.Y., and B.E.; investigation, S.G.-S., E.E., and B.E.; resources, S.G.-S., R.-A.S., E.E., and B.E.; data curation, S.G.-S., A.K.K., and B.E.; writing—original draft preparation, S.G.-S., A.K.K., and B.E.; writing—review and editing, S.G.-S., A.K.K., R.-A.S., S.Y., and B.E.; visualization, S.G.-S. and A.K.K.; supervision, B.E.; project administration, S.G.-S. and B.E.; funding acquisition, B.E.

Funding

This research was funded by the University of Oslo, Faculty of Mathematics and Natural Sciences to SGS and BE, by the Research Council of Norway through grant 190307 HAPTODIV to B.E., E.E., and W.E., by grant 225956/E10 MicroPolar to E.E. and B.E. and through grant 294363 VirVar to R.-A.S. and B.E.

Acknowledgments

We thank Sissel Brubak and Torill V. Johannessen for their molecular technical assistance and captain Sindre Holm and the crew onboard R/V Trygve Braarud for their assistance. High-throughput sequencing was performed by Microsynth AG, Balgach, Switzerland.

Conflicts of Interest

The authors declare no conflict of interest.

References

  1. Bergh, Ø.; Børsheim, K.Y.; Bratbak, G.; Heldal, M. High abundance of viruses found in aquatic environments. Nature 1989, 340, 467–468. [Google Scholar] [CrossRef] [PubMed]
  2. Suttle, C.A. Viruses in the sea. Nature 2005, 437, 356–361. [Google Scholar] [CrossRef] [PubMed]
  3. Suttle, C.A. Marine viruses—Major players in the global ecosystem. Nat. Rev. Microbiol. 2007, 5, 801–812. [Google Scholar] [CrossRef] [PubMed]
  4. Boxshall, G.A. La vida en suspensión: El plancton. In La Exploración de la Biodiversidad Marina: Desafíos Científicos y Tecnológicos; Duarte, C.M., Ed.; Fundación BBVA: Bilbao, Spain, 2006; pp. 93–115. ISBN 84-96515-26-5. [Google Scholar]
  5. Thingstad, T.; Lignell, R. Theoretical models for the control of bacterial growth rate, abundance, diversity and carbon demand. Aquat. Microb. Ecol. 1997, 13, 19–27. [Google Scholar] [CrossRef] [Green Version]
  6. Thingstad, T.F. Elements of a theory for the mechanisms controlling abundance, diversity, and biogeochemical role of lytic bacterial viruses in aquatic systems. Limnol. Oceanogr. 2000, 45, 1320–1328. [Google Scholar] [CrossRef]
  7. Bratbak, G.; Thingstad, F.; Heldal, M. Viruses and the microbial loop. Microb. Ecol. 1994, 28, 209–221. [Google Scholar] [CrossRef] [Green Version]
  8. Wilhelm, S.W.; Suttle, C.A. Viruses and nutrient cycles in the sea. BioScience 1999, 49, 781–788. [Google Scholar] [CrossRef]
  9. Guidi, L.; Bittner, L.; Eveillard, D.; Larhlimi, A.; Roux, S.; Darzi, Y.; Audic, S.; Berline, L.; Brum, J.R.; Coelho, L.P.; et al. Plankton networks driving carbon export in the oligotrophic ocean. Nature 2016, 532, 465–470. [Google Scholar] [CrossRef] [Green Version]
  10. Nissimov, J.I.; Vandzura, R.; Johns, C.T.; Natale, F.; Haramaty, L.; Bidle, K.D. Dynamics of transparent exopolymer particle production and aggregation during viral infection of the coccolithophore, Emiliania huxleyi: Dynamics of TEP production and aggregation. Environ. Microbiol. 2018, 20, 2880–2897. [Google Scholar] [CrossRef]
  11. Laber, C.P.; Hunter, J.E.; Carvalho, F.; Collins, J.R.; Hunter, E.J.; Schieler, B.M.; Boss, E.; More, K.; Frada, M.; Thamatrakoln, K.; et al. Coccolithovirus facilitation of carbon export in the North Atlantic. Nat. Microbiol. 2018, 3, 537–547. [Google Scholar] [CrossRef]
  12. Yamada, Y.; Tomaru, Y.; Fukuda, H.; Nagata, T. Aggregate formation during the viral lysis of a marine diatom. Front. Mar. Sci. 2018, 5, 167. [Google Scholar] [CrossRef]
  13. Dunigan, D.D.; Fitzgerald, L.A.; Van Etten, J.L. Phycodnaviruses: A peek at genetic diversity. Virus Res. 2006, 117, 119–132. [Google Scholar] [CrossRef] [PubMed] [Green Version]
  14. Brussaard, C.P.D.; Martinez-Martinez, J. Algal bloom viruses. Plant Viruses 2008, 1, 1–13. [Google Scholar]
  15. Claverie, J.M.; Abergel, C. Mimiviridae: An expanding family of highly diverse large dsDNA viruses infecting a wide phylogenetic range of aquatic eukaryotes. Viruses 2018, 10, 506. [Google Scholar] [CrossRef]
  16. Boyer, M.; Madoui, M.A.; Gimenez, G.; La Scola, B.; Raoult, D. Phylogenetic and phyletic studies of informational genes in genomes highlight existence of a 4th domain of life including giant viruses. PLoS ONE 2010, 5, e15530. [Google Scholar] [CrossRef]
  17. Iyer, L.M.; Aravind, L.; Koonin, E.V. Common origin of four diverse families of large eukaryotic DNA viruses. J. Virol. 2001, 75, 11720–11734. [Google Scholar] [CrossRef]
  18. Gallot-Lavallée, L.; Pagarete, A.; Legendre, M.; Santini, S.; Sandaa, R.A.; Himmelbauer, H.; Ogata, H.; Bratbak, G.; Claverie, J.M. The 474-kilobase-pair complete genome sequence of CeV-01B, a virus infecting Haptolina (Chrysochromulina) ericina (Prymnesiophyceae). Genome Announc. 2015, 3, e01413–e01415. [Google Scholar] [CrossRef]
  19. Johannessen, T.V.; Bratbak, G.; Larsen, A.; Ogata, H.; Egge, E.S.; Edvardsen, B.; Eikrem, W.; Sandaa, R.A. Characterisation of three novel giant viruses reveals huge diversity among viruses infecting Prymnesiales (Haptophyta). Virology 2015, 476, 180–188. [Google Scholar] [CrossRef] [Green Version]
  20. Fischer, M.G.; Allen, M.J.; Wilson, W.H.; Suttle, C.A. Giant virus with a remarkable complement of genes infects marine zooplankton. Proc. Natl. Acad. Sci. USA 2010, 107, 19508–19513. [Google Scholar] [CrossRef] [Green Version]
  21. Mihara, T.; Koyano, H.; Hingamp, P.; Grimsley, N.; Goto, S.; Ogata, H. Taxon richness of “Megaviridae” exceeds those of bacteria and archaea in the ocean. Microbes Environ. 2018, 33, 162–171. [Google Scholar] [CrossRef]
  22. Brussaard, C.P.D. Viral control of phytoplankton populations—A review. J. Eukaryot. Microbiol. 2004, 51, 125–138. [Google Scholar] [CrossRef] [PubMed]
  23. Baudoux, A.C. The Role of Viruses in Marine Phytoplankton Mortality. Ph.D. Thesis, Royal Netherlands Institute for Sea Research (NIOZ), Texel, The Netherland, 2007. [Google Scholar]
  24. Sandaa, R.A. Burden or benefit? Virus–host interactions in the marine environment. Res. Microbiol. 2008, 159, 374–381. [Google Scholar] [CrossRef] [PubMed]
  25. Clerissi, C.; Grimsley, N.; Ogata, H.; Hingamp, P.; Poulain, J.; Desdevises, Y. Unveiling of the diversity of prasinoviruses (Phycodnaviridae) in marine samples by using high-throughput sequencing analyses of PCR-amplified DNA polymerase and major capsid protein genes. Appl. Environ. Microbiol. 2014, 80, 3150–3160. [Google Scholar] [CrossRef] [PubMed]
  26. Johannessen, T.; Larsen, A.; Bratbak, G.; Pagarete, A.; Edvardsen, B.; Egge, E.; Sandaa, R.A. Seasonal dynamics of haptophytes and dsDNA algal viruses suggest complex virus-host relationship. Viruses 2017, 9, 84. [Google Scholar] [CrossRef]
  27. Moniruzzaman, M.; Wurch, L.L.; Alexander, H.; Dyhrman, S.T.; Gobler, C.J.; Wilhelm, S.W. Virus-host relationships of marine single-celled eukaryotes resolved from metatranscriptomics. Nat. Commun. 2017, 8, 16054. [Google Scholar] [CrossRef] [PubMed]
  28. Sandaa, R.A.E.; Storesund, J.; Olesin, E.; Lund Paulsen, M.; Larsen, A.; Bratbak, G.; Ray, J. Seasonality drives microbial community structure, shaping both eukaryotic and prokaryotic host–viral relationships in an arctic marine ecosystem. Viruses 2018, 10, 715. [Google Scholar] [CrossRef]
  29. Sandaa, R.A.; Bratbak, G. Is the virus important? And some other questions. Viruses 2018, 10, 442. [Google Scholar] [CrossRef]
  30. Suttle, C.A.; Chan, A.M. Dynamics and distribution of cyanophages and their effect on marine Synechococcus spp. Appl. Environ. Microbiol. 1994, 60, 3167–3174. [Google Scholar]
  31. Tarutani, K.; Nagasaki, K.; Itakura, S.; Yamaguchi, M. Isolation of a virus infecting the novel shellfish-killing dinoflagellate Heterocapsa circularisquama. Aquat. Microb. Ecol. 2001, 23, 103–111. [Google Scholar] [CrossRef]
  32. Thyrhaug, R.; Larsen, A.; Thingstad, T.F.; Bratbak, G. Stable coexistence in marine algal host-virus systems. Mar. Ecol. Prog. Ser. 2003, 254, 27–35. [Google Scholar] [CrossRef]
  33. Dimmock, N.J.; Easton, A.J.; Leppard, K.N. Introduction to Modern Virology, 7th ed.; John Wiley & Sons: West Sussex, UK, 2016; ISBN 978-1-119-97810-7. [Google Scholar]
  34. Gran-Stadniczeñko, S.; Dunthorn Egge, E.; Hostyeva, V.; Logares, R.; Eikrem, W.; Edvardsen, B. Protist diversity and seasonal dynamics in Skagerrak plankton communities as revealed by metabarcoding and microscopy. J. Eukaryot. Microbiol. 2019, 66, 494–513. [Google Scholar] [CrossRef] [PubMed]
  35. Larsen, J.B.; Larsen, A.; Bratbak, G.; Sandaa, R.A. Phylogenetic analysis of members of the Phycodnaviridae virus family, using amplified fragments of the major capsid protein gene. Appl. Environ. Microbiol. 2008, 74, 3048–3057. [Google Scholar] [CrossRef] [PubMed]
  36. Caporaso, J.G.; Kuczynski, J.; Stombaugh, J.; Bittinger, K.; Bushman, F.D.; Costello, E.K.; Fierer, N.; Gonzalez Peña, A.; Goodrich, J.K.; Gordon, J.I.; et al. QIIME allows analysis of high-throughput community sequencing data. Nat. Methods 2010, 7, 335–336. [Google Scholar] [CrossRef] [PubMed] [Green Version]
  37. Quince, C.; Lanzen, A.; Davenport, R.J.; Turnbaugh, P.J. Removing noise from pyrosequenced amplicons. BMC Bioinform. 2011, 12, 38. [Google Scholar] [CrossRef] [PubMed]
  38. Edgar, R.C. Search and clustering orders of magnitude faster than BLAST. Bioinformatics 2010, 26, 2460–2461. [Google Scholar] [CrossRef] [PubMed] [Green Version]
  39. Oksanen, J.; Blanchet, F.G.; Kindt, R.; Legendre, P.; O’Hara, R.B.; Simpson, G.L.; Solymos, P.; Stevens, M.H.H.; Wagner, H. Vegan: Community Ecology Package, R package version 1.17-2; R Foundation for Statistical Computing: Vienna, Austria, 2011. [Google Scholar]
  40. Deng, W.; Nickle, D.C.; Learn, G.H.; Maust, B.; Mullins, J.I. ViroBLAST: A stand-alone BLAST web server for flexible queries of multiple databases and user’s datasets. Bioinformatics 2007, 23, 2334–2336. [Google Scholar] [CrossRef]
  41. Besemer, J.; Borodovsky, M. Heuristic approach to deriving models for gene finding. Nucleic Acids Res. 1999, 27, 3911–3920. [Google Scholar] [CrossRef] [Green Version]
  42. Besemer, J.; Borodovsky, M. GeneMark: Web software for gene finding in prokaryotes, eukaryotes and viruses. Nucleic Acids Res. 2005, 33, W451–W454. [Google Scholar] [CrossRef]
  43. Zhu, W.; Lomsadze, A.; Borodovsky, M. Ab initio gene identification in metagenomic sequences. Nucleic Acids Res. 2010, 38, e132. [Google Scholar] [CrossRef]
  44. O’Leary, N.A.; Wright, M.W.; Brister, J.R.; Ciufo, S.; Haddad, D.; McVeigh, R.; Rajput, B.; Robbertse, B.; Smith-White, B.; Ako-Adjei, D.; et al. Reference sequence (RefSeq) database at NCBI: Current status, taxonomic expansion, and functional annotation. Nucleic Acids Res. 2016, 44, D733–D745. [Google Scholar] [CrossRef]
  45. Kearse, M.; Moir, R.; Wilson, A.; Stones-Havas, S.; Cheung, M.; Sturrock, S.; Buxton, S.; Cooper, A.; Markowitz, S.; Duran, C.; et al. Geneious Basic: An integrated and extendable desktop software platform for the organization and analysis of sequence data. Bioinformatics 2012, 28, 1647–1649. [Google Scholar] [CrossRef] [PubMed]
  46. Katoh, K.; Standley, D.M. MAFFT multiple sequence alignment software version 7: Improvements in performance and usability. Mol. Biol. Evolut. 2013, 30, 772–780. [Google Scholar] [CrossRef] [PubMed]
  47. Katoh, K.; Standley, D.M. A simple method to control over-alignment in the MAFFT multiple sequence alignment program. Bioinformatics 2016, 32, 1933–1942. [Google Scholar] [CrossRef] [PubMed]
  48. Katoh, K.; Frith, M.C. Adding unaligned sequences into an existing alignment using MAFFT and LAST. Bioinformatics 2012, 28, 3144–3146. [Google Scholar] [CrossRef] [PubMed]
  49. Capella-Gutierrez, S.; Silla-Martinez, J.M.; Gabaldon, T. trimAl: A tool for automated alignment trimming in large-scale phylogenetic analyses. Bioinformatics 2009, 25, 1972–1973. [Google Scholar] [CrossRef] [PubMed]
  50. Price, M.N.; Dehal, P.S.; Arkin, A.P. FastTree 2—approximately maximum-likelihood Ttees for large alignments. PLoS ONE 2010, 5, e9490. [Google Scholar] [CrossRef] [PubMed]
  51. Rambaut, A.; Drummond, A.J. FigTree v1.4.3. 2016. Available online: http://tree.bio.ed.ac.uk/software/figtree/ (accessed on 9 November 2019).
  52. Friedman, J.; Alm, E.J. Inferring correlation networks from genomic survey data. PLoS Comput. Biol. 2012, 8, e1002687. [Google Scholar] [CrossRef]
  53. Kurtz, Z.D.; Müller, C.L.; Miraldi, E.R.; Littman, D.R.; Blaser, M.J.; Bonneau, R.A. Sparse and compositionally robust inference of microbial ecological networks. PLOS Comput. Biol. 2015, 11, e1004226. [Google Scholar] [CrossRef]
  54. Su, G.; Morris, J.H.; Demchak, B.; Bader, G.D. Biological network exploration with Cytoscape 3. Curr. Protoc. Bioinform. 2014, 47, 8–13. [Google Scholar] [CrossRef]
  55. Clerissi, C.; Desdevises, Y.; Romac, S.; Audic, S.; de Vargas, C.; Acinas, S.G.; Casotti, R.; Poulain, J.; Wincker, P.; Hingamp, P.; et al. Deep sequencing of amplified Prasinovirus and host green algal genes from an Indian Ocean transect reveals interacting trophic dependencies and new genotypes: Marine algae and their viruses in the Indian Ocean. Environ. Microbiol. Rep. 2015, 7, 979–989. [Google Scholar] [CrossRef]
  56. Rozon, R.M.; Short, S.M. Complex seasonality observed amongst diverse phytoplankton viruses in the Bay of Quinte, an embayment of Lake Ontario. Freshw. Biol. 2013, 58, 2648–2663. [Google Scholar] [CrossRef]
  57. Zhong, X.; Jacquet, S. Contrasting diversity of phycodnavirus signature genes in two large and deep western European lakes. Environ. Microbiol. 2014, 16, 759–773. [Google Scholar] [CrossRef] [PubMed]
  58. Throndsen, J.; Hasle, G.R.; Tangen, K. Phytoplankton of Norwegian Coastal Waters; Almater Forlag AS: Oslo, Norway, 2007. [Google Scholar]
  59. Simon, N.; Foulon, E.; Grulois, D.; Six, C.; Desdevises, Y.; Latimier, M.; Le Gall, F.; Tragin, M.; Houdan, A.; Derelle, E.; et al. Revision of the genus Micromonas Manton et Parke (Chlorophyta, Mamiellophyceae), of the type species M. pusilla (Butcher) Manton & Parke and of the species M. commoda van Baren, Bachy and Worden and description of two new species based on the genetic and phenotypic characterization of cultured isolates. Protist 2017, 168, 612–635. [Google Scholar] [PubMed]
  60. Tragin, M.; Vaulot, D. Novel diversity within marine Mamiellophyceae (Chlorophyta) unveiled by metabarcoding. Sci. Rep. 2018, 9, 5190. [Google Scholar] [CrossRef]
  61. Weynberg, K.D.; Allen, M.J.; Ashelford, K.; Scanlan, D.J.; Wilson, W.H. From small hosts come big viruses: The complete genome of a second Ostreococcus tauri virus, OtV-1. Environ. Microbiol. 2009, 11, 2821–2839. [Google Scholar] [CrossRef]
  62. Pagarete, A.; Chow, C.E.T.; Johannessen, T.; Fuhrman, J.A.; Thingstad, T.F.; Sandaa, R.A. Strong seasonality and interannual recurrence in marine myovirus communities. Appl. Environ. Microbiol. 2013, 20, 6253–6259. [Google Scholar] [CrossRef]
  63. Needham, D.M.; Chow, C.E.T.; Cram, J.A.; Sachdeva, R.; Parada, A.; Fuhrman, J.A. Short-term observations of marine bacterial and viral communities: Patterns, connections and resilience. ISME J. 2013, 7, 1274–1285. [Google Scholar] [CrossRef]
  64. Short, S.M. The ecology of viruses that infect eukaryotic algae. Environ. Microbiol. 2012, 14, 2253–2271. [Google Scholar] [CrossRef]
  65. Sahlsten, E. Seasonal abundance in Skagerrak-Kattegat coastal waters and host specificity of viruses infecting the marine photosynthetic flagellate Micromonas pusilla. Aquat. Microb. Ecol. 1998, 16, 103–108. [Google Scholar] [CrossRef]
  66. Zingone, A.; Sarno, D.; Forlani, G. Seasonal dynamics in the abundance of Micromonas pusilla (Prasinophyceae) and its viruses in the Gulf of Naples (Mediterranean Sea). J. Plankton Res. 1999, 21, 2143–2159. [Google Scholar] [CrossRef]
  67. Zingone, A.; Natale, F.; Biffali, E.; Borra, M.; Forlani, G.; Sarno, D. Diversity in morphology, infectivity, molecular characteristics and induced host resistance between two viruses infecting Micromonas pusilla. Aquat. Microb. Ecol. 2006, 45, 1–14. [Google Scholar] [CrossRef]
  68. Goic, B.; Saleh, M.C. Living with the enemy: Viral persistent infections from a friendly viewpoint. Curr. Opin. Microbiol. 2012, 15, 531–537. [Google Scholar] [CrossRef] [PubMed]
  69. Longdon, B.; Brockhurst, M.A.; Russell, C.A.; Welch, J.J.; Jiggins, F.M. The evolution and genetics of virus host shifts. PLoS Pathog. 2014, 10, e1004395. [Google Scholar] [CrossRef] [PubMed]
Figure 1. Phylogenetic tree based on relevant Phycodnaviridae and Mimiviridae major capsid protein (MCP) reference sequences (black), virus Operational Taxonomic Units (OTUs) found in a previous study in Raunefjorden (blue [35]), and the 22 most abundant viral OTU (vOTU) algal viruses (>50 reads) from Outer Oslofjorden (red). Bootstrap values >50 are shown at the nodes.
Viruses 11 01043 g001
Figure 2. Barplots representing: (a) Number of vOTUs per family and (b) proportional abundance (percentage reads) of the most abundant vOTUs (>50 reads per vOTU) over time at Outer Oslofjorden station.
Viruses 11 01043 g002
Figure 3. Bray clustering analyses representing Bray–Curtis similarities in virus community composition based on vOTU abundances.
Viruses 11 01043 g003
Figure 4. Network analysis showing the co-occurrence between virus and protist taxa (represented as blue and beige nodes respectively). Lines between nodes indicate positive (blue) and negative (red) SparCC correlation >|0.5| (two-sided pseudo p-value < 0.05) between the abundances of linked taxa. Network was visualized by Cystoscape V3.3.0.
Viruses 11 01043 g004
Figure 5. Temporal distribution of the four most abundant viruses, vOTU1-4, and their co-occurring protists. Virus OTU relative abundances are represented with dotted lines, those of pOTUs with continuous lines. Red lines indicate negative correlations between virus and protists, blue lines indicate positive correlations.
Viruses 11 01043 g005
Figure 6. Relative abundances over time of vOTUs matching known viruses (MpV1 and CeV) and their possible host Micromonas commoda and M. sp. clade-B-subarctic, M. pusilla, M. bravo, and Haptolina sp. obtained by Gran-Stadniczeñko et al. [34].
Viruses 11 01043 g006
Table 1. Details on positive and negative co-occurrences between virus MCP gene OTUs (vOTUs) obtained in this study and protist 18S rRNA gene OTUs (pOTUs) obtained by Gran-Stadniczeñko et al. [34].
VIRUS PROTIST
vOTU IDFamilyLowest Taxonomic LevelCo-Occurrence1pOTU IDSupergroupGroupLowest Taxonomic Level
vOTU 1PhycodnaviridaeMicromonas pusilla virus (MpV1) +pOTU 1AlveolataDinophytaKarenia papillonaceae
-pOTU 35AlveolataDinophytaMALV-III
-pOTU 78AlveolataDinophytaUncultured dinoflagellate
-pOTU 58ArchaeplastidaChlorophytaPycnococcus provasolii
-pOTU 209ArchaeplastidaChlorophytaPyramimonadales
vOTU 2MimiviridaeUncultured-pOTU 34AlveolataDinophytaUncultured dinoflagellate
+pOTU 169PicozoaPicomonadeaPicobiliphyta
vOTU 3PhycodnaviridaeMicromonas pusilla virus (MpV1) -pOTU 74AlveolataCiliophoraCyclotrichia
-pOTU 29AlveolataCiliophoraStrombidiidae
-pOTU 156StramenopilaBacillariophyta Coscinodiscophyceae
-pOTU 174StramenopilaChrysophyta Chrysophyceae-Clade-C
vOTU 4MimiviridaeChrysochromulina ericina virus (CeV)+pOTU 39OpistokontaChoanoflagellidaStephanoecidae-Group-D
+pOTU 20StramenopilaBacillariophyta Pseudo-nitzschia multiseries
+pOTU 9StramenopilaBacillariophyta Thalassiosira nordenskioeldii
vOTU 6MimiviridaeUncultured+pOTU 13HacrobiaCryptophytaTeleaulax gracilis
+pOTU 192Uncultured eukaryoteUncultured Eukaryote Uncultured eukaryote
vOTU 7PhycodnaviridaeMicromonas pusilla virus (MpV1) +pOTU 124AlveolataCiliophoraHaptoria
+pOTU 8AlveolataDinophytaGyrodinium helveticum
-pOTU 10HacrobiaHaptophyta Emiliania huxleyi
+pOTU 138OpistokontaChoanoflagellidaStephanoecidae-Group-D
-pOTU 45StramenopilaMASTMAST-1C
vOTU 16MimiviridaeUncultured+pOTU 7AlveolataDinophytaLepidodinium chlorophorum/L. viride
+pOTU 60AlveolataDinophytaMALV-III
+pOTU 43AlveolataDinophytaUncultured dinoflagellate
vOTU 26PhycodnaviridaeUncultured+pOTU 39OpistokontaChoanoflagellidaStephanoecidae-Group-D
+pOTU 56StramenopilaChrysophyta Chrysophyceae-Clade-C
vOTU 31MimiviridaeChrysochromulina ericina virus (CeV)+pOTU 30AlveolataDinophytaUncultured dinoflagellate
vOTU 35PhycodnaviridaeMicromonas pusilla virus (MpV1) +pOTU 7AlveolataDinophytaLepidodinium chlorophorum/L. viride
1 “+“ positive correlations, “-“ negative correlations.

