Article

Metabolomic Analysis of Influenza A Virus A/WSN/1933 (H1N1) Infected A549 Cells during First Cycle of Viral Replication

1
School of Life Sciences, University of Science and Technology of China, Hefei 230026, China
2
CAS Key Laboratory of Pathogenic Microbiology and Immunology, Institute of Microbiology, Chinese Academy of Sciences, Beijing 100101, China
3
Philips Institute for Oral Health Research, School of Dentistry, Virginia Commonwealth University, Richmond, VA 23298, USA
4
Shanghai Veterinary Research Institute, Chinese Academy of Agricultural Sciences, Shanghai 200241, China
5
University of Chinese Academy of Sciences, Beijing 100049, China
*
Authors to whom correspondence should be addressed.
Viruses 2019, 11(11), 1007; https://doi.org/10.3390/v11111007
Submission received: 2 September 2019 / Revised: 29 October 2019 / Accepted: 29 October 2019 / Published: 31 October 2019
(This article belongs to the Section Animal Viruses)

Abstract

:
Influenza A virus (IAV) has developed strategies to utilize host metabolites which, after identification and isolation, can be used to discover the value of immunometabolism. During this study, to mimic the metabolic processes of influenza virus infection in human cells, we infect A549 cells with H1N1 (WSN) influenza virus and explore the metabolites with altered levels during the first cycle of influenza virus infection using ultra-high-pressure liquid chromatography–quadrupole time-of-flight mass spectrometer (UHPLC–Q-TOF MS) technology. We annotate the metabolites using MetaboAnalyst and the Kyoto Encyclopedia of Genes and Genomes pathway analyses, which reveal that IAV regulates the abundance of the metabolic products of host cells during early infection to provide the energy and metabolites required to efficiently complete its own life cycle. These metabolites are correlated with the tricarboxylic acid (TCA) cycle and mainly are involved in purine, lipid, and glutathione metabolisms. Concurrently, the metabolites interact with signal receptors in A549 cells to participate in cellular energy metabolism signaling pathways. Metabonomic analyses have revealed that, in the first cycle, the virus not only hijacks cell metabolism for its own replication, but also affects innate immunity, indicating a need for further study of the complex relationship between IAV and host cells.

1. Introduction

Influenza A virus (IAV), a member of the Orthomyxoviridae family, is a negative-sense, single-stranded, enveloped, segmented RNA virus [1,2]. IAV usually infects epithelial cells of the upper and lower respiratory tracts, including the nasal mucosa, trachea, and lungs, with no evident symptoms during the early phase of infection [3,4]. Once an influenza virus invasion occurs, innate immunity is activated, and interferons are secreted by host cells to limit the early viral proliferation [3]. Then, adaptive immunity is activated by other cytokines produced during viral infection. However, in some cases, highly pathogenic influenza viruses induce cytokine storms, a consequence of excessive production of cytokines and interferon, resulting in infections and even death [5].
To facilitate virus replication in the host cells, IAV has evolved strategies to block the innate and adaptive immune responses of the host cells and seize organelles from host cells to synthesize a large number of metabolites required for viral reproduction, as well as energy for the packaging of the virus [6,7]. Enveloped, non-enveloped, DNA and RNA viruses share lipid metabolites in their replication cycles to induce the formation of new cytoplasmic membrane structures, which contribute to the replication and packaging of the viral genome [8,9,10]. Lipid metabolism also can block the innate immune response of host cells to ensure the large-scale replication of the virus. Therefore, IAV infection is linked closely to metabolism, and the proliferation of the virus also is inseparable from the host metabolism. This changing trend in small molecule metabolites may serve as a characterization of host–pathogen interactions to monitor immune status.
Although significant progress has been made toward an anti-influenza virus drug discovery, including M2 ion channel blockers, neuraminidase inhibitors, and polymerase inhibitors [11], challenges posed by drug toxicity and viruses with genetic resistance remain a serious problem [12,13,14,15]. Previous research demonstrated the metabolic effects of influenza virus infection in Madin–Darby canine kidney (MDCK) cells, displaying the intra- and extra-cellular metabolite profiling upon IAV infection [16,17]. Little is known, however, about the systemic metabolic dynamics during the early stage of virus infection. During our study, we analyze changes in metabolism upon influenza virus infection in human cells during the first infectious cycle via metabolomics. Early metabolite analysis will throw new light on the activation of the innate immune metabolism. We believe that the results of this work will elucidate the activation of innate immunity to viral infection from the perspective of the host and provide new control strategies for the development of novel drugs and the treatment and prevention of influenza virus infection.

2. Materials and Methods

2.1. Cell Culture and Viral Preparation

Human lung carcinoma epithelial cells (A549), MDCK cells and mouse lung epithelium (MLE-12) cells were grown in Dulbecco’s modified Eagle’s medium (DMEM; Gibco) supplemented with 10% fetal bovine serum (FBS, Gibco) in 5% CO2 at 37 °C. The IAV A/WSN/33 (H1N1) was propagated at 37 °C for 72 h in allantoic cavity-specific pathogen-free embryonated eggs at 10 days of age. Virus titers were determined by a plaque assay. Virus stocks were stored at −80 °C until use.

2.2. Plaque Assay

MDCK cells were seeded in 12-well plates, infected with serial dilutions of the virus in serum-free DMEM supplemented with 4 μg/mL of l-1-tosylamido-2-phenyethyl chloromethyl ketone (TPCK)-treated trypsin for 2 h, and then washed with phosphate-buffered saline (PBS). The cells were covered with Modified Eagle’s Medium containing 1% agarose (AMRESCO) and 2 μg/mL of TPCK-treated trypsin. The plates were allowed to solidify at 4 °C for 5 min and incubated upside-down at 37 °C. Following 72 h, viral titers were determined by counting the visible plaques.

2.3. Virus Infection In Vitro and In Vivo

When the A549 cells reached high confluence (>95%), they then were cultured for 4 h in serum-free DMEM, compared with controls under identical culture conditions, and infected with WSN at a multiplicity of infection (MOI) of 0.1, 1, and 5. The virus inoculums were removed by washing with PBS and incubation in DMEM for the indicated times in 5% CO2 at 37 °C. The infected cells were collected at 0 h, 8 h, and 16 h and stored at −80 °C.
The A/WSN/33 (H1N1) virus titer was determined by plaque assays. Groups of six 6–8-week-old female BALB/c mice were intranasally inoculated with 50 μL of 5000 p.f.u of virus diluted in phosphate-buffered saline (PBS). Mock-infected control animals were inoculated intranasally with 50 μL PBS. Animals that showed signs of severe disease and weight loss >30% of their initial body weight were considered moribund and were sacrificed humanely according to animal ethics guidelines. Five mice from each group were euthanized at 0 h, 12 h, 24 h, and 48 h and necropsies were performed. The lung tissue samples were homogenized in PBS with antibiotics in a homogenizer and used to determine the viral titers using the plaque assay. The lung tissue and serum were divided into three portions, used for an enzyme-linked immunosorbent assay (ELISA) and a metabolite concentration test, respectively.

2.4. Immunofluorescence Assay

Cells were cultured overnight in 24-well plates. Prior to the assays, cells were cultured for 4 h in a serum-free medium and then infected with WSN at a MOI of 0.1. Cells (500 μL) were collected at 0 h, 2 h, 5 h, and 8 h, washed with PBST, fixed in 4% paraformaldehyde, and stored at 4 °C overnight. Samples then were blocked with 4% bovine serum albumin (BSA) and stained with anti-influenza A virus nucleoprotein (NP) antibody (1:500). The secondary antibody (1:200) was fluorescein isothiocyanate (FITC) -conjugated goat anti-rabbit IgG, followed by 4′,6-diamidino-2-phenylindole (DAPI) staining for 15 min. Samples then were observed using a model Leica SP8 confocal laser scanning fluorescence microscope (Olympus). A549 cells and MDCK cells also were collected at 0 h, 12 h, 16 h, and 24 h, and infected with WSN at a 0.1, 1, and 5 MOI (Figure S1).

2.5. Sample Preparation, ELISA, and Metabolomics Analysis

The cells were washed twice with pre-cooled PBS and then lysed with 1 mL of methanol/acetonitrile/water (2:2:1, v/v) by vortexing twice for 30 min at 4 °C. The lysates then were incubated for 1 h at −20 °C, followed by centrifugation at 13,000× g/min for 15 min at 4 °C. The supernatants were collected and stored at –80 °C for further analysis. Metabolic concentration was determined by an ELISA assay according to the manufacturer’s instruction.

2.6. Data Acquisition through LC-MS Analysis

Samples were separated on an Agilent 1290 Infinity ultra-high-pressure liquid chromatography–quadrupole time-of-flight mass spectrometer (UHPLC-Q-TOF MS), with a column temperature of 25 °C, flow rate of 0.3 mL/min, and injection volume of 2 μL.
The mobile phase contained A (water, 25 mM ammonium acetate, and 25 mM ammonia) and B (acetonitrile). The gradient elution procedure was as follows: 0 min–1 min, 95% B; 1 min–14 min, decreased linearly from 95–65%; 14 min–16 min, B was decreased linearly from 65–40%; 16 min–18 min, B was maintained at 40%; 18 min–18.1 min, B was increased linearly from 40–95%; 18.1 min–23 min, B was maintained at 95%. Samples were placed in a 4 °C autosampler throughout the process. To avoid the effects of instrument detection signal fluctuations, continuous analysis of samples was performed in random order. QC samples were inserted into the sample queue to monitor and evaluate the stability of the system and the reliability of the experimental data.
The electrospray ionization (ESI) positive and negative ion modes were used for mass spectrometer (MS) detection. The samples were separated by ultra-high-pressure liquid chromatography (UHPLC) and subjected to MS using a Triple TOF 5600 mass spectrometer (ABSCIEX). The ESI source conditions were as follows: Ion Source Gas1 (Gas1): 60, Ion Source Gas2 (Gas2): 60, Curtain gas (CUR): 30, source temperature: 600 °C, IonSapary Voltage Floating (ISVF) range −5500 V to 5500 V; TOF MS scan m/z range: 60 Da–1000 Da, production scan m/z range: 25 Da–1000 Da, TOF MS scan accumulation time 0.2 s/spectra, production scan accumulation time 0.05 s/spectra; Information Dependent Acquisition (IDA) was obtained and adopted high sensitivity mode, Declustering potential (DP) range −60 V to 60 V; Collision Energy range 20 eV to 50 eV; IDA was set to exclude isotopes with 4 Da, candidate ions to monitor per cycle 6.

2.7. Statistical Analysis

XCMS software (https://xcmsonline.scripps.edu/index.php) was used to analyze the raw data for peak alignment, calibration, and retention time peak area extraction. Metabolite structure identification used a method of accurate mass matching (<25 ppm). Ion peaks with missing values >50% in the data group were deleted. SIMCA-P 14.1 (Umetrics, Umea, Sweden) was used to establish a statistical model [18]. The data were preprocessed by Pareto-scaling for multidimensional statistical analysis, including unsupervised principal component analysis (PCA) [19,20], supervised partial least squares discriminant analysis (PLS-DA) [21], and orthogonal partial least squares discriminant analysis (OPLS-DA) [22]. Single-dimensional statistical analysis included Student’s t-test and variation multiple analyses, and the PCA maps, volcano maps, and cluster maps were generated with the R program.

2.8. Differential Metabolite Analysis and Functional Pathway Analysis

Via the Variable Importance for the Projection (VIP), the characteristics of metabolite expression patterns were used to mine the differential metabolites with biological significance. During our study, VIP >1 was selected as the screening standard, and the differences between the groups initially were screened. Univariate statistical analysis was used to confirm significant differences in metabolites. Differential metabolites were identified by adjustments of the p-value for multiple testing at both VIP >1 and univariate statistical analysis p < 0.05.
To identify the altered metabolic pathways involved during influenza virus infection, the differential metabolites were subjected to the statistical tool MetaboAnalyst 4.0 (www.metaboanalyst.ca), which is a web-based service that provides online visual statistical analysis [23]. Data were uploaded to KEGG (www.kegg.jp) and HMDB 4.0 (www.hmdb.ca) for more information to identify significantly altered pathways [24,25,26,27]. All these programs support a variety of complex statistical calculations and high-quality graphic rendering capabilities that require copious computing resources.

3. Results

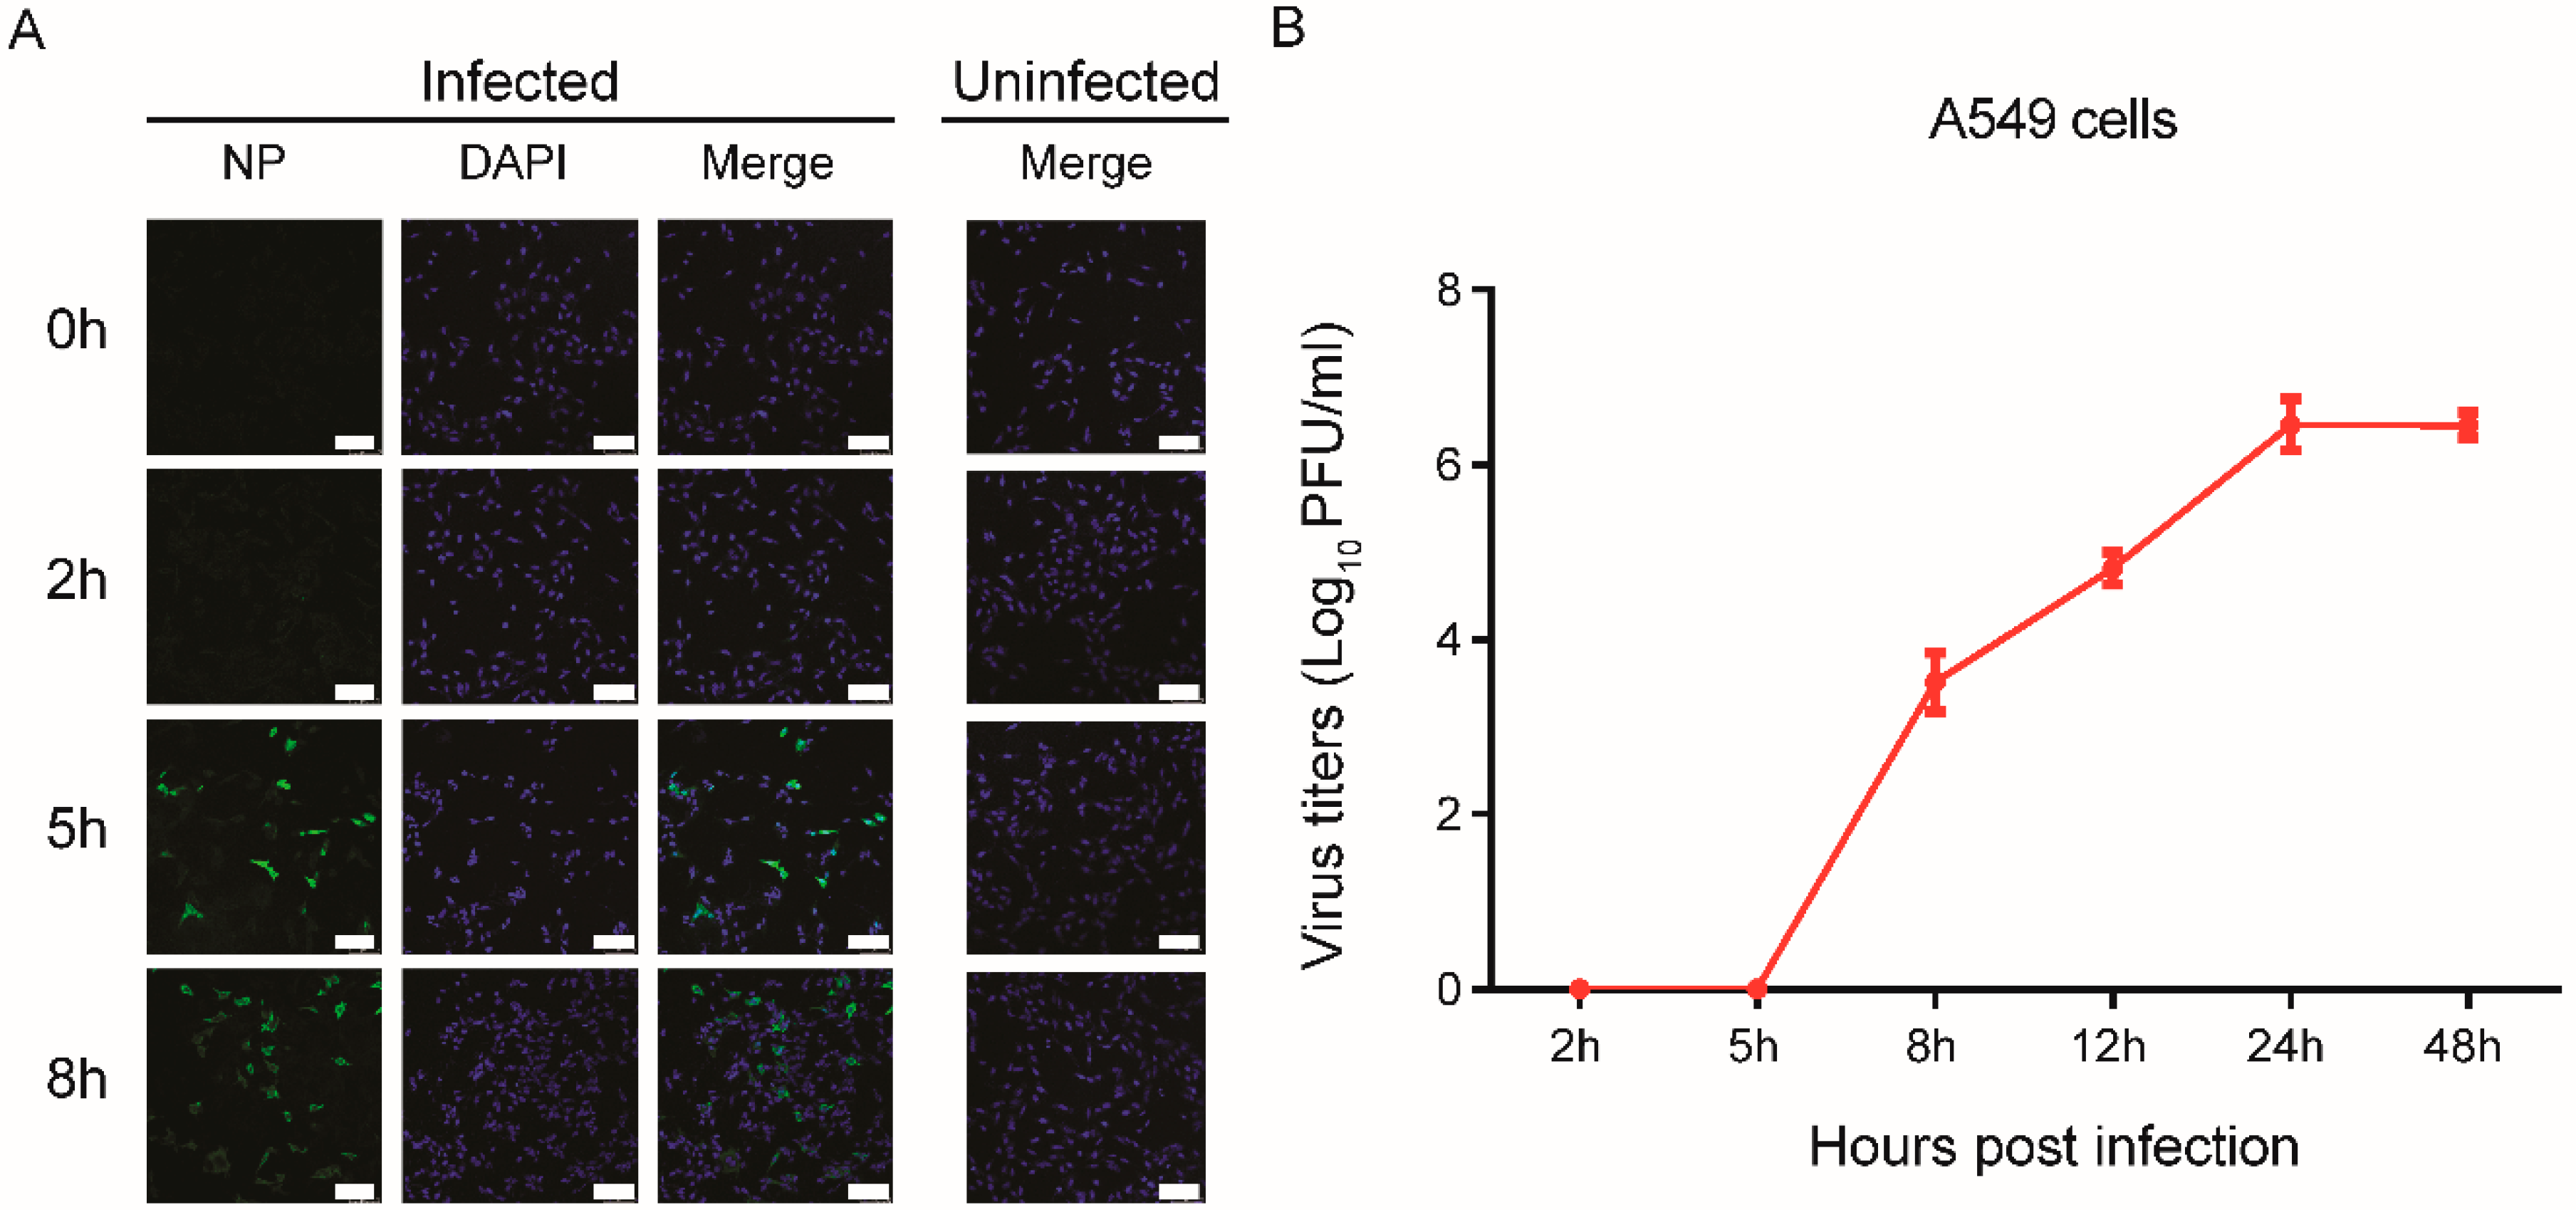
3.1. Rapid Replication of IAV in the Early Stages of Infection in Human Cells

To confirm virus replication in A549 cells, the cells were infected with A/WSN virus at a MOI of 0.1, and virus replication was analyzed. The ratio of infected cells also was identified by measuring viral intracellular NP using immunofluorescence microscopy analysis. We found that the number of infected cells at 8 h was greater than that of cells infected at 2 h and 5 h (Figure 1A), and that virus titers in the A549 cell progressively increased until reaching a peak at 24 h post-infection, indicating more efficient virus replication within 24 h post-infection (Figure 1B). Consistent results were observed in A549 cells infected with A/WSN/1933 and analyzed at different time points, and the virus production was comparable in a single-cycle infection, while infected cells at a MOI of 1 or 5 displayed a higher cell death (Figure S1).

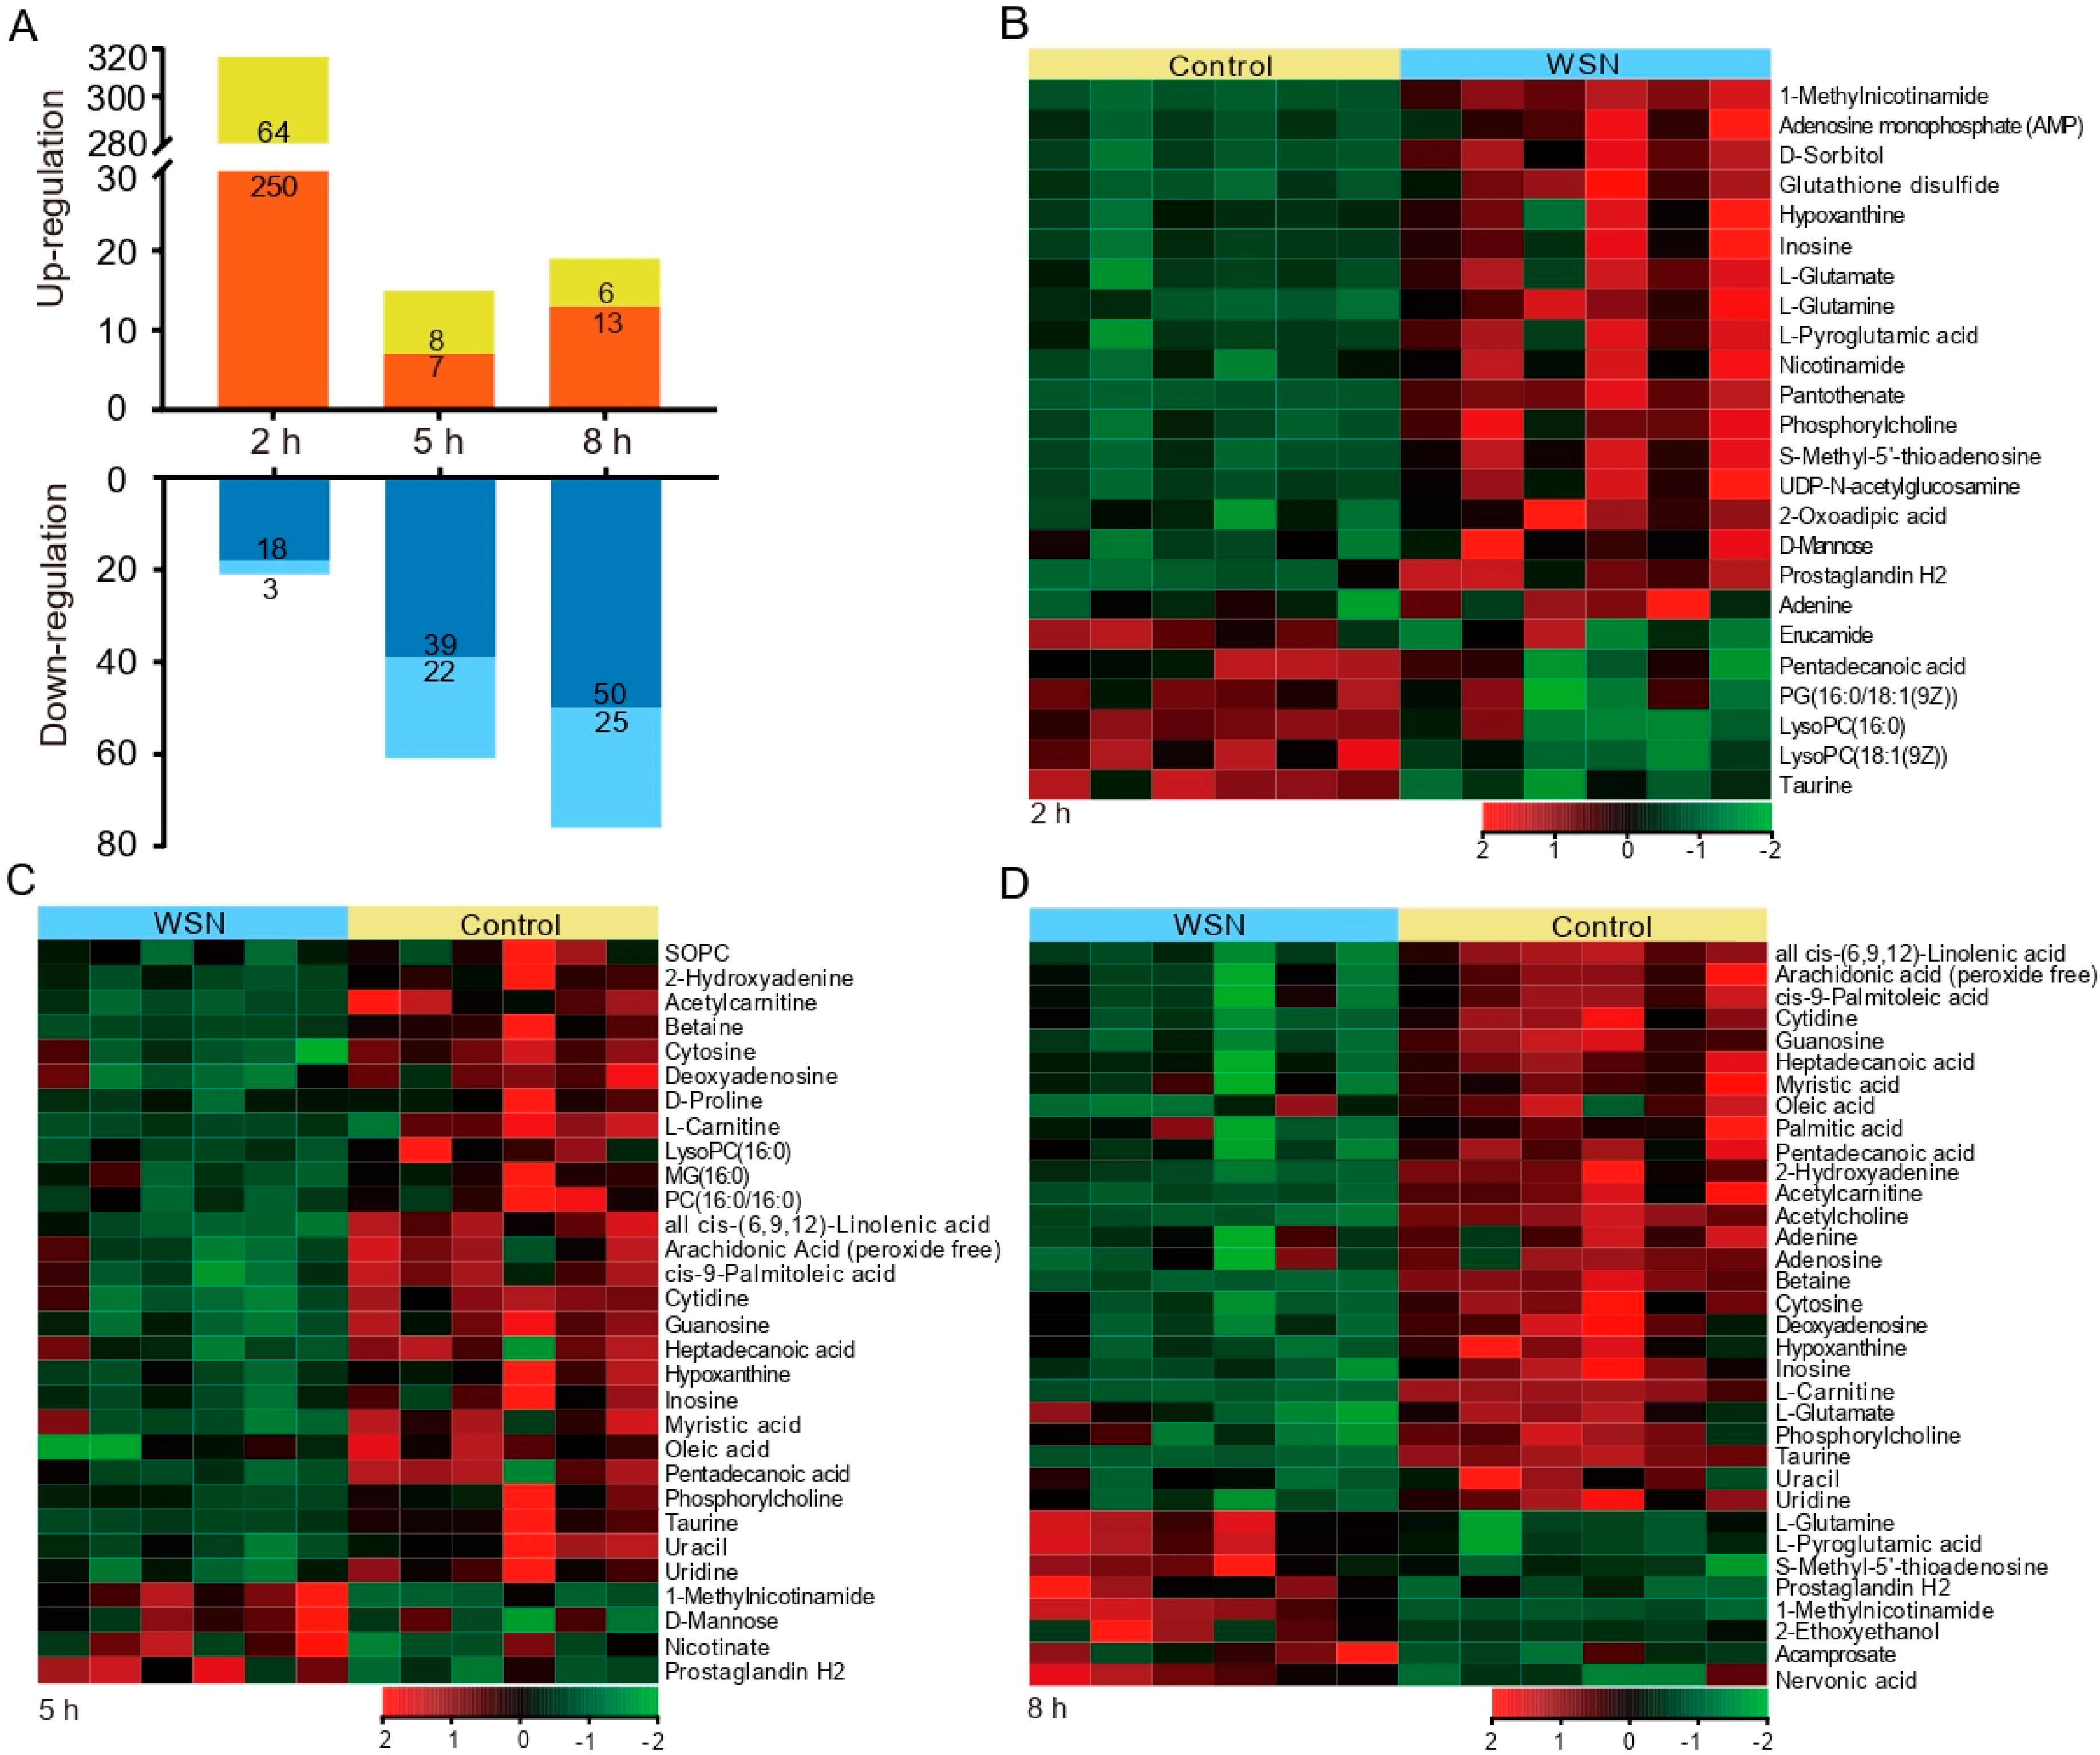
3.2. Characteristic Metabolites in Response to Virus Infection

Metabolite isolates were prepared individually from both WSN virus- and mock-infected A549 cells. To identify the functions of the characteristic metabolites during viral infection, univariate analysis was performed to analyze the total metabolite profiles in uninfected or WSN-infected A549 cells. Volcano plots in Figure S2 show all differentially expressed metabolites were identified. The variations in metabolites were correlated with different time points, and changes in up-regulated metabolites were more abundant at 2 h post-infection, while the down-regulation of metabolites was more significant at 8 h post-infection (Figure 2A).
To compare metabolite expression profiles at 2 h, 5 h, and 8 h post-infection, we filtered metabolites with fold analysis, calculating the 50 differentially expressed metabolites (Table 1). Shown in the heat map diagrams in Figure 2B–D, we depict the upregulated and downregulated metabolites in A549 cells responding to WSN virus infection induced at different time points, indicating the various metabolic influences induced by virus infection.

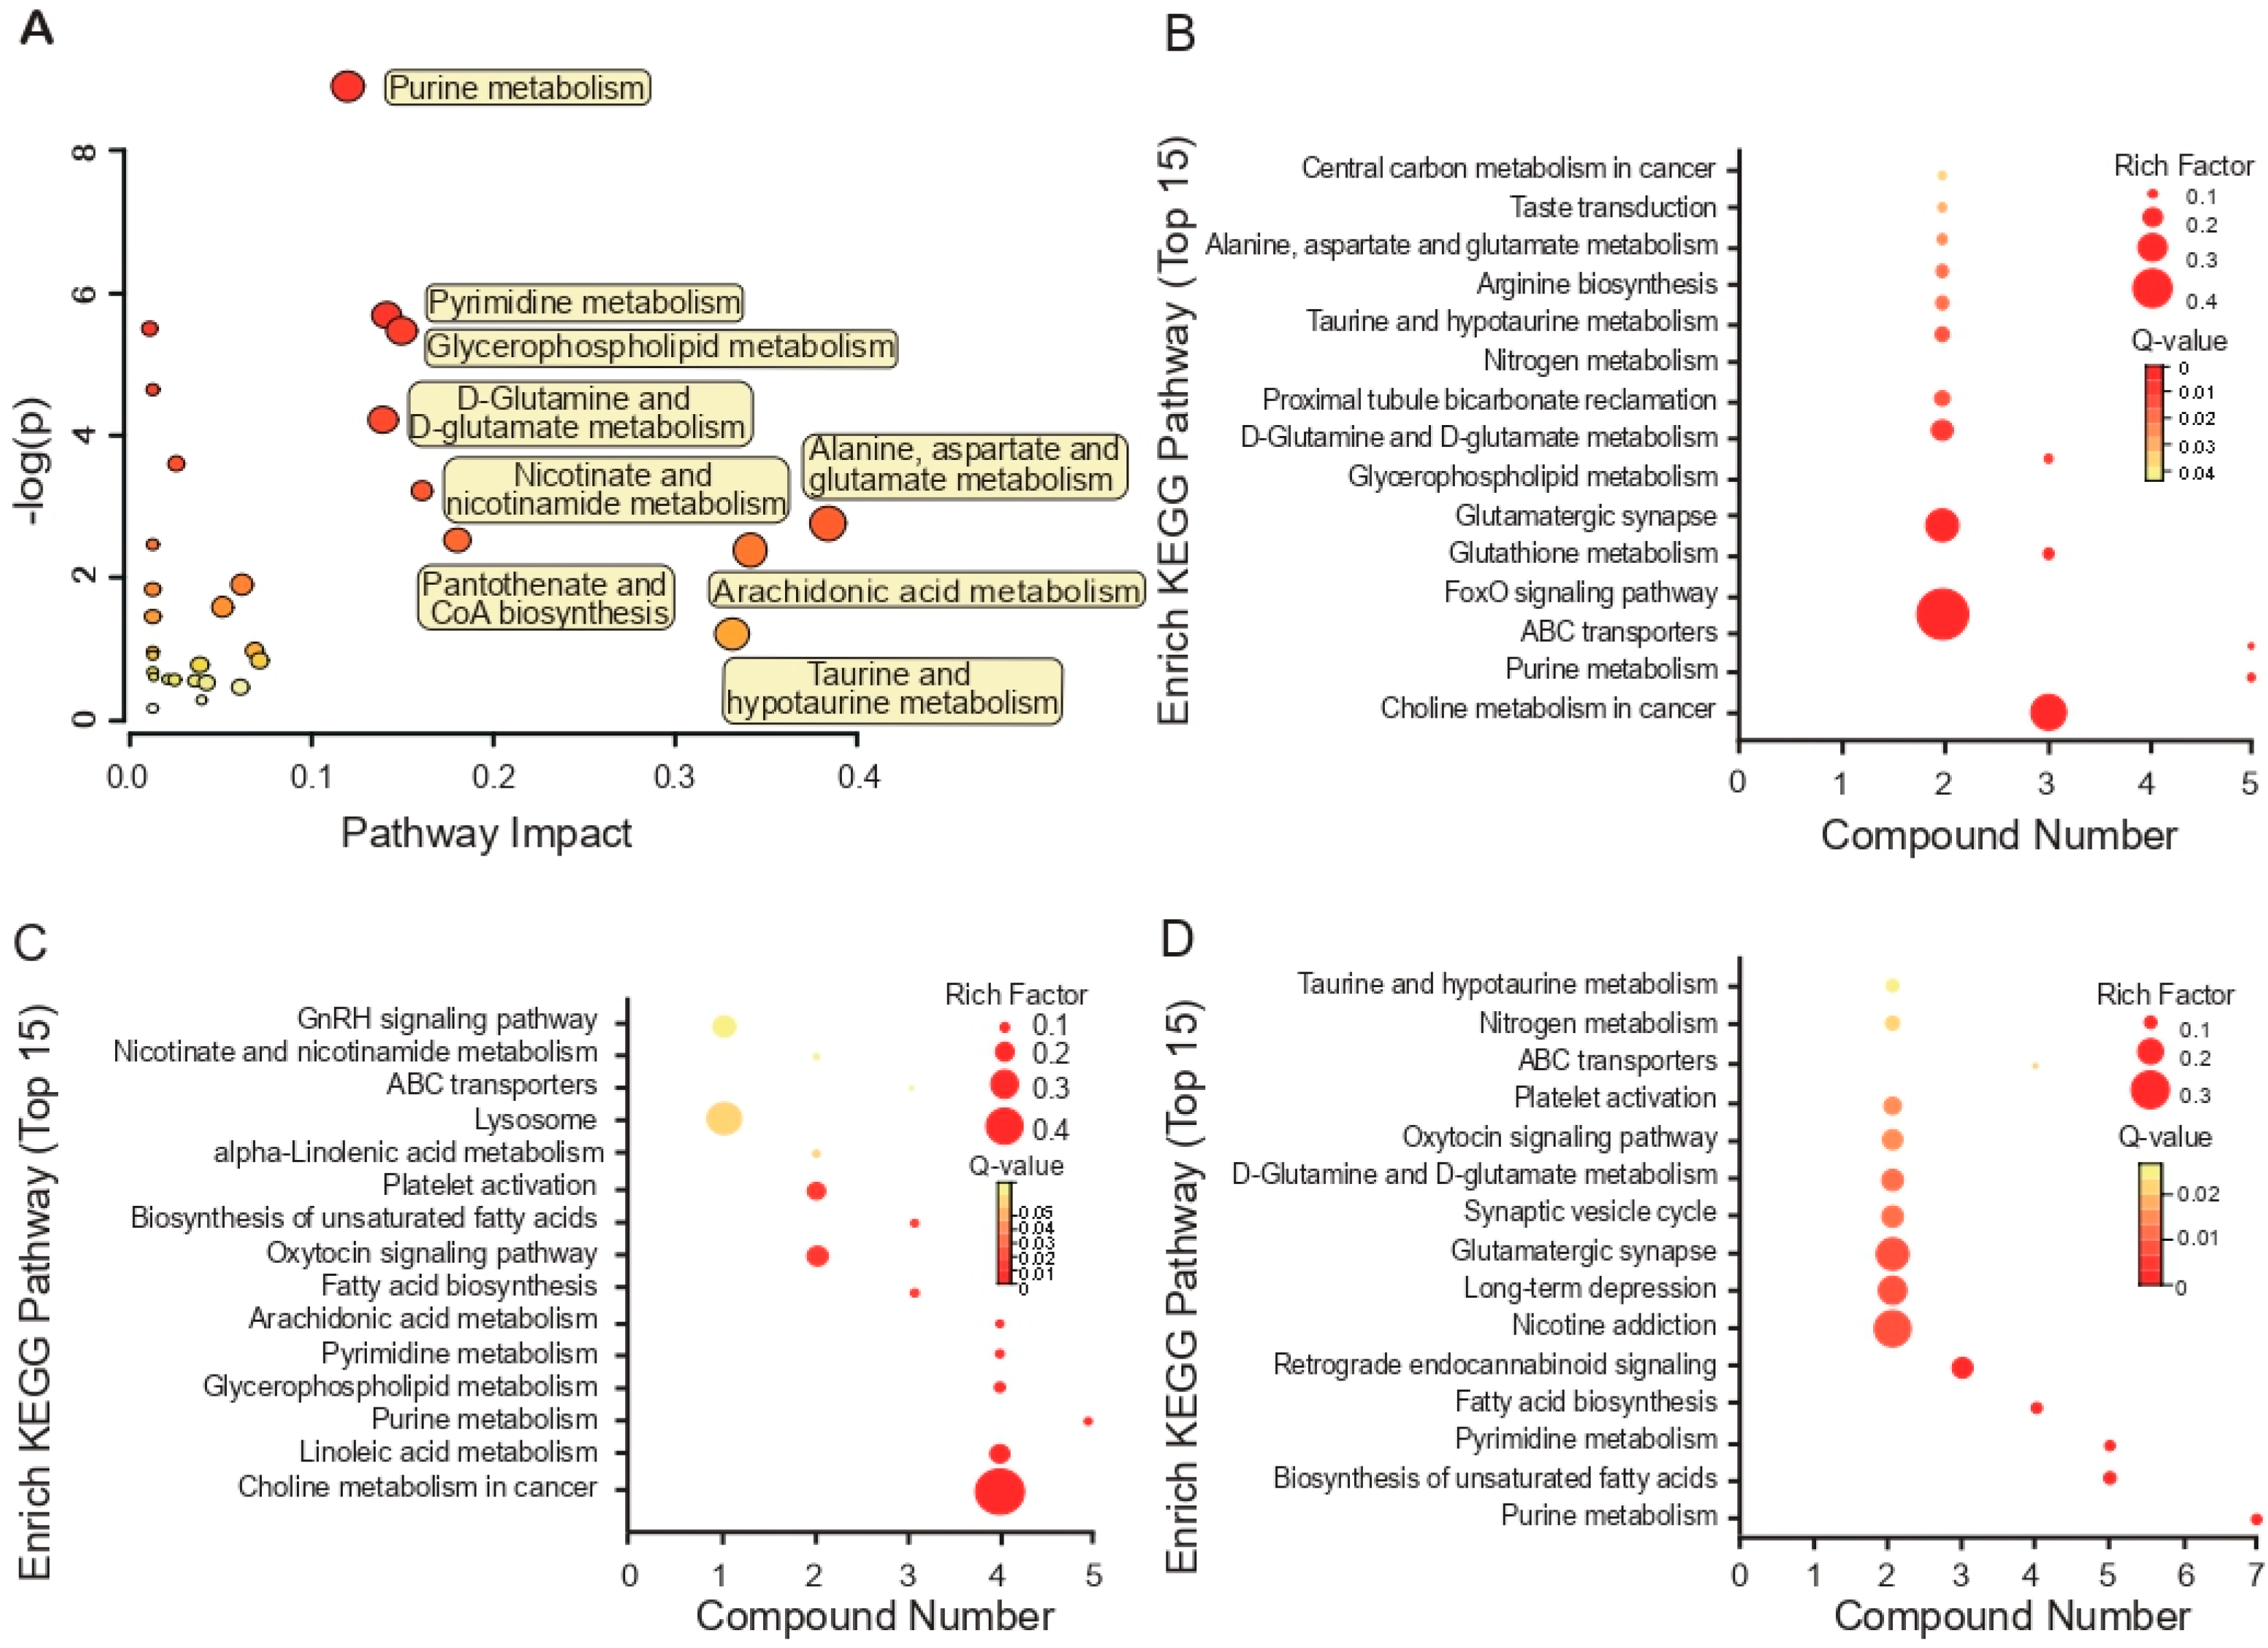
3.3. KEGG Pathway Enrichment Analyses Based on Metabolites

To identify the biological interactions of metabolites and determine important functional networks upon WSN infection in human cells, we analyzed the statistically enriched metabolites, listing the top 20-fold changes by the absolute value of the log2 scale obtained from the A549 cell lines (Figure 3A); we mapped the metabolites with altered expression into their KEGG pathways. We present the results of the top 30 pathways activated by the WSN virus in A549 cells in Table 2. Upon WSN virus infection, the most significantly activated cellular metabolite process was purine metabolization.
We also mapped metabolites identified at individual time points into the KEGG pathway database to further explain the individual function analysis. The top 15 enriched pathways in WSN-infected A549 cells are summarized in Figure 3. Two hours post-infection, ABC transporters and the FoxO signaling pathway, which are in the biological process category, were regulated most significantly by WSN infection (Q < 0.05 and p <0.01) (Figure 3B). During the next 6 h, choline metabolization in cancer and taurine, and hypotaurine metabolization were associated highly with the responses to WSN infection in A549 cells (Figure 3B,C).

3.4. Metabolite Correlation Network Diagram Analysis

We also used MetaboAnalyst 4.0 analyses to reveal the possible functions of the identified unique metabolites in cell samples. Examining the differential unique metabolites in the WSN group relative to glutathione metabolization and purine metabolization in A549 cells, we found the most enriched biological processes to be related mainly to the TCA cycle, arachidonic acid metabolization, and the hexosamine pathway (Figure 4), with purine metabolization and fatty acid biosynthesis as the most significant molecular functions.

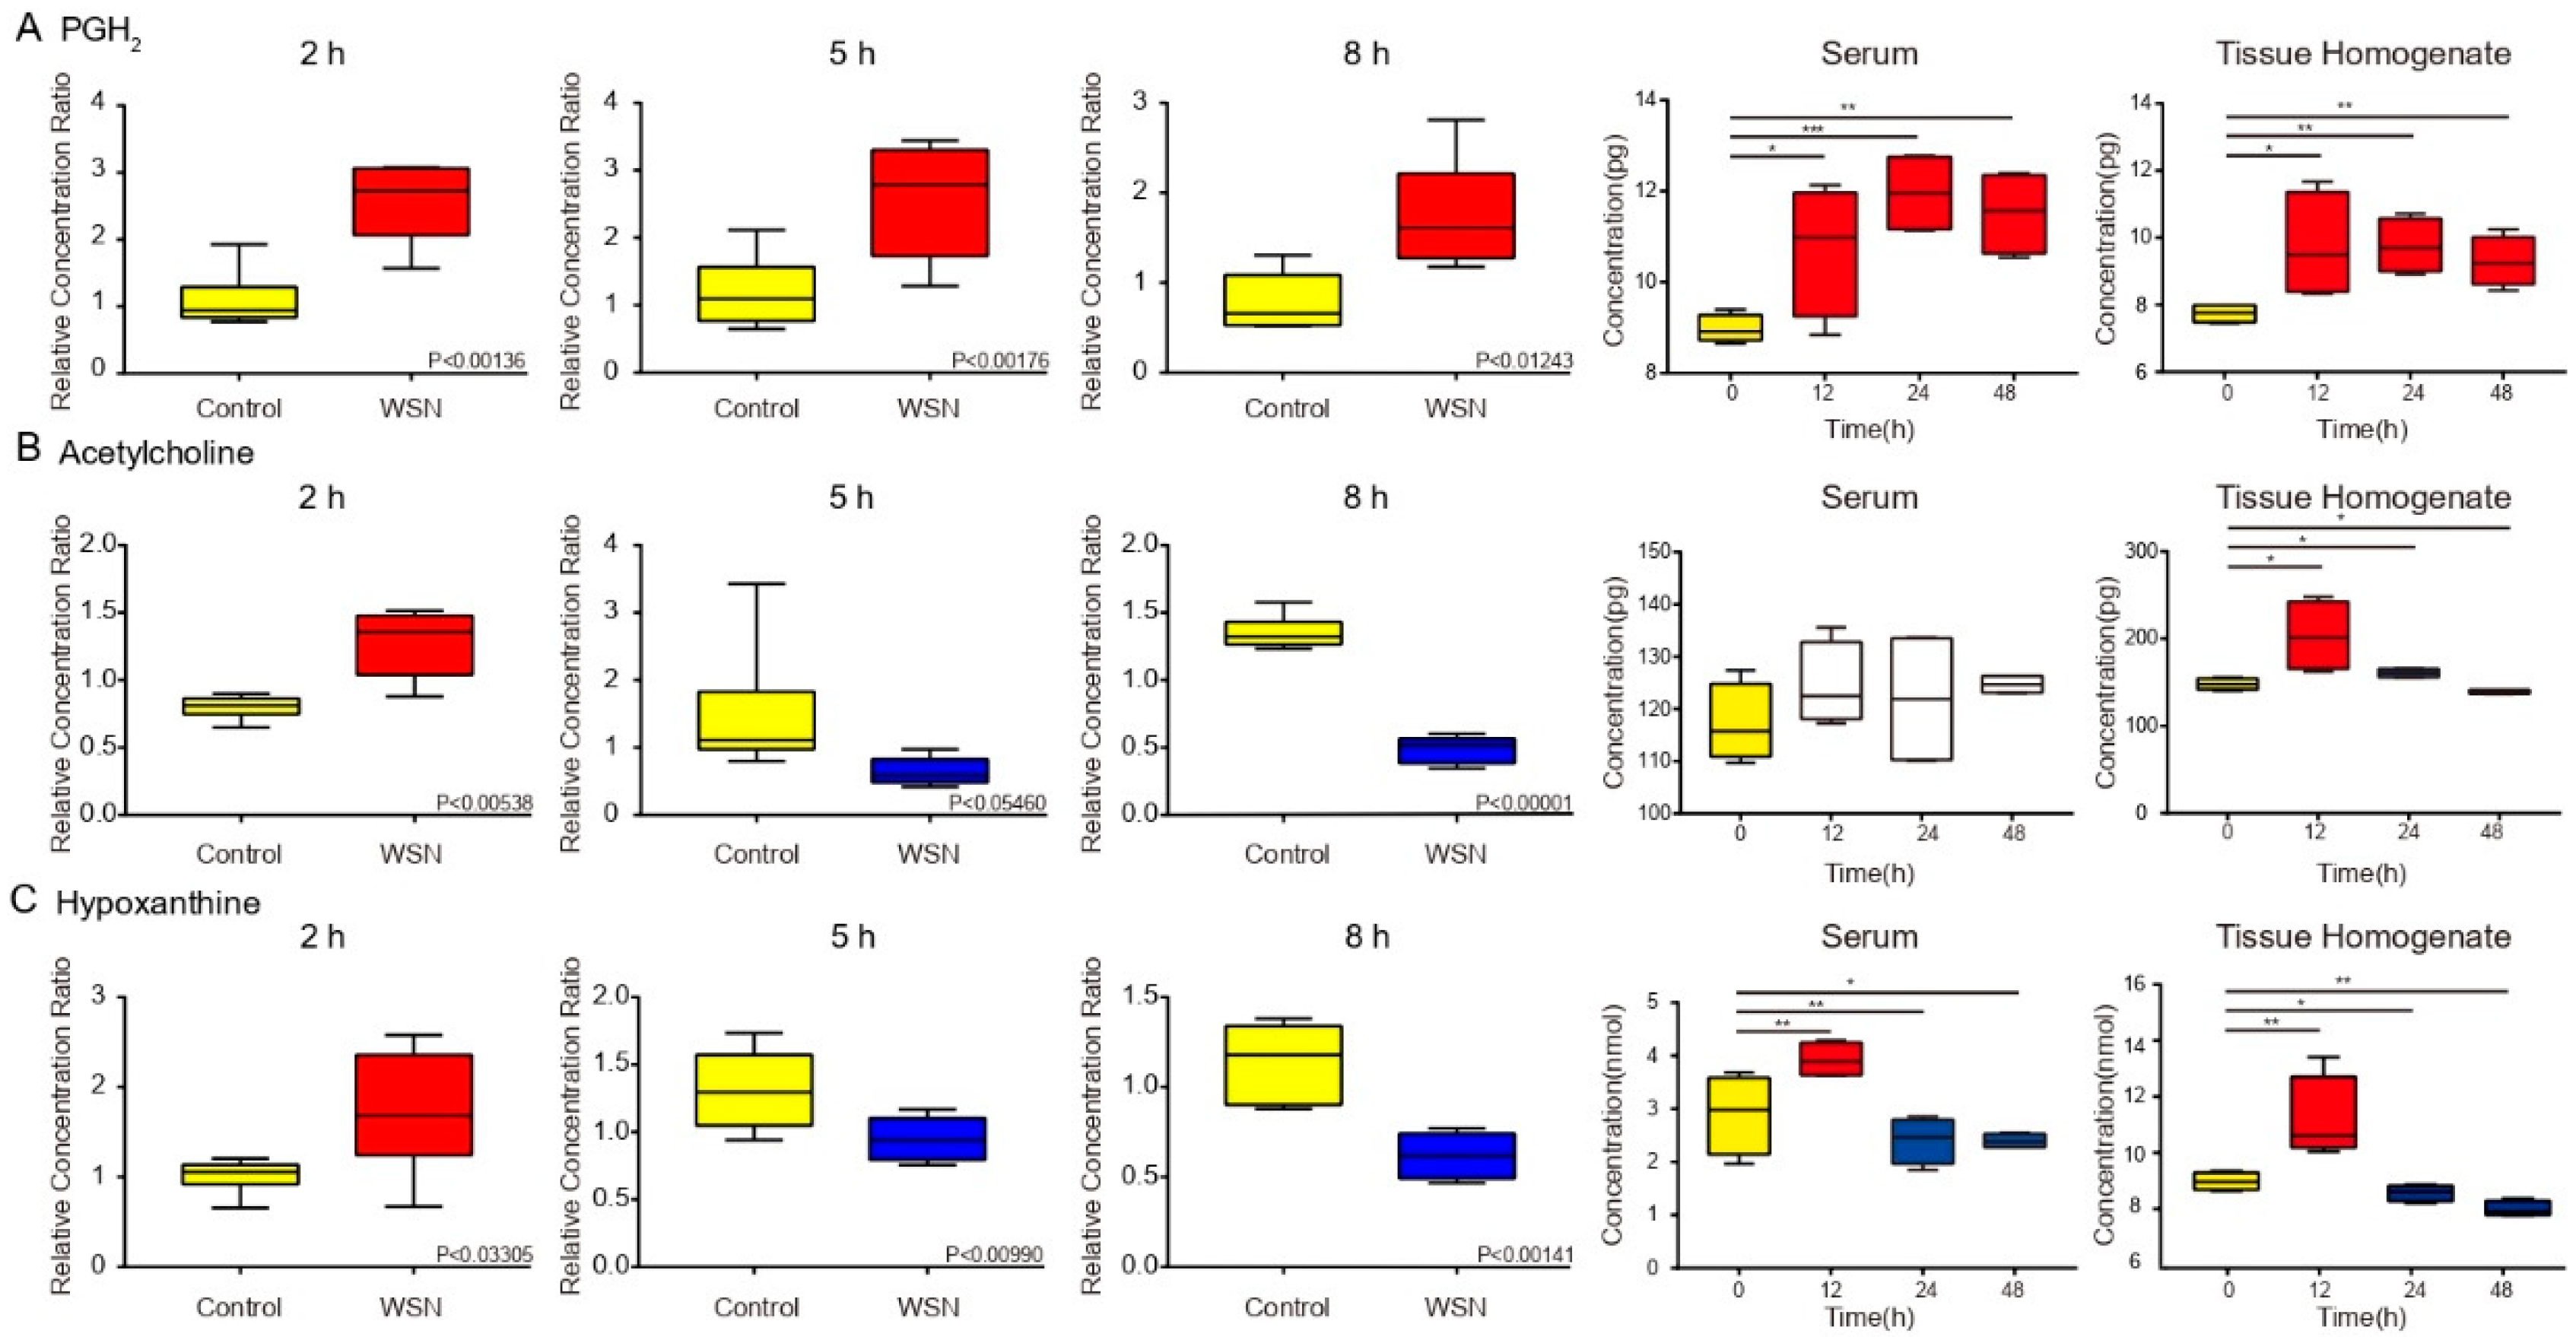
3.5. Trends in Key Metabolites by Box Plots of Different Times by Infection

By assembling box plots of selected metabolites across our experimental time, the differential expression profiles of the metabolites were validated. Although minor differences were observed in the different times due to their intrinsic differences, the results of these analyses demonstrated the key relative regulation of metabolites (Figures S3–S5).
The common regulative metabolites (PGH, O-acetylcholine, and hypoxanthine) induced by WSN infections are linked to elevated morbidity and mortality in humans [28]. Figure 5A shows the expression of the most regulative metabolites differed in infected A549 cells between 2 h post-infection and the next 6 h. However, the levels of PGH and O-acetylcholine, as well as hypoxanthine, were decreased markedly in WSN-infected A549 cells at 5 h post-infection. These findings suggest a remarkable initiation of the response of the host metabolic levels and capacity in WSN-infected A549 cells. To further confirm these results in vivo mice were intranasally inoculated with 50 μL of 5000 p.f.u of virus or PBS as a negative control. The lung tissue homogenates and serum samples were detected using an ELISA assay. Consistent results were observed in PGH2 and hypoxanthine expression. According to the metabolomic analysis data, acetylcholine displayed similar expression in the lung tissue, while the expression in serum was not changed significantly (Figure 5A). Additionally, we observed similar results in mouse lung epithelium (MLE-12) cells (Figure S6). The viral lung titers of the mice infected with WSN also are displayed in Figure S7.

4. Discussion

Influenza virus infection is linked inextricably to metabolism, and the proliferation of the virus is inseparable from the host metabolism. The mouse-adapted WSN virus, which is recognized as a neurovirulent strain, also can cause severe lung hypoxemia and pulmonary edema in mice [29]. Previous research demonstrated that blunting the cytokine storm significantly alleviated the syndrome of animals infected with WSN virus [5,30]. Though the prospect of blunting over-abundant innate immune response is enticing, little is known about the activation of an innate immune metabolism during early virus infection and the potential metabolites modulating immune response and virus replication. During our study, we identified >50 differential metabolites by exploring the metabolism and metabolic characteristics of early viral infection, established through the integration of statistical analyses and metabolic networks. Host metabolic changes upon influenza virus infection play a key role in regulating virus replication.
Influenza viruses can utilize the host’s energy metabolism for their own replication. Our study found no significant changes in intermediate metabolites in the TCA cycle during the first replication cycle (prior to 8 h). We conclude that the enzyme in the TCA cycle is still active. We observed the same phenomenon in the TCA cycle in the PR8-infected MDCK cell model over the first 10 h [16]. The IAV usually leads to apoptosis, which is caused by damage to the mitochondrial membrane after infection [31]. Apoptosis leads to more severe metabolic disorders, destroying cellular respiration. Apoptosis-related gene transcription levels were downregulated within 8 h prior to WSN infection [32]. Therefore, we believe that mitochondria remain intact in morphology and function during the first replication cycle of an influenza virus, and no apoptosis occurs. Concurrently, an increase in glutamate content was observed in glutathione metabolization, a strategy in which cells maintain high levels of oxidized coenzymes under high pressure to maintain an energy metabolism balance. During the first replication cycle, the mitochondrial energy supply is maintained by up-regulating the glutamate content to maintain TCA cycle stability to complete viral replication.
Theoretically, even if all a metabolite were disappeared in infected cells, expression of the metabolite would become 80–90% in this MOI 0.1 condition. However, our data shows that many metabolites were down-regulated several times, while our speculation was related to the regulation of uninfected cells by infected cells. Previous studies have found that virus infection between cells is a spatial process, depending on where the virus is at the infection time point. Infected cells gradually activate the antiviral immunity of surrounding uninfected cells through cytokines such as interferon [33,34,35]. Our study concentrated on the first cycle of virus replication, there was no progeny virus production. Therefore, we speculated that the infected cells, centered on the infected cells, communicated with the surrounding signals and produced the same metabolic changes, instructing the uninfected cells to enter the antiviral state, thus leading to such changes in metabolites.
We also found the negative regulatory effect of influenza virus on the metabolic pathway for fatty acids. According to our data, the relative abundance of myristic acid, palmitic acid, palmitoleic acid, and oleic acid was decreased. Fatty acids have been known to play a dual role in an influenza virus metabolism [36,37,38,39,40]. Previous research demonstrated the virulence of an influenza virus is enhanced by palmitoylation of the cysteine residues in the M2 protein in vivo, although this palmitoylation process is not necessary in the formation of IAV in vitro [41]. Additionally, other research suggests that palmitoyl-oleoyl-phosphatidylglycerol (POPG) [42], a minor component of pulmonary surfactants, effectively regulates the innate immune system. The presence of POPG significantly attenuates influenza virus-induced IL-8 production and apoptosis in human bronchial epithelial cells. During early infection, this POPG thus serves to activate the innate immune system to inhibit influenza virus replication.
Host nucleotides and their derivatives, consumed upon influenza virus replication, are important small molecules in cells involved in signal transduction [43,44,45,46], energy cycling [9,47] and the synthesis of genetic material [48]. Li et al., demonstrated that UDP-N-acetylglucosamine was used as a substrate for the hexosamine biosynthetic pathway (HBP) to glycosylate MAVs, an important signaling adaptor protein in the innate immune signaling pathway [49]. Thus, HBP plays an important role in the antiviral effect of innate immunity by targeting MAVs protein. Our results confirmed that the relative amount of UDP-N-acetylglucosamine increased during the first replication cycle of the virus, which may increase the glycosylation of MAVS, helping it to form prion-like aggregates to activate an antiviral response in innate immunity after viral infection. We also observed that purine metabolization changed significantly during the first cycle. Purine plays an important role in the biological processes of cells [50,51], Chandler et al., reported lung tissue was taken for metabolomics analysis at 10 days by IAV infection to obtain a decrease in AMP content; our data further enhances previous research that AMP content increased within 2 h by the first cycle of viral replication [52]. This may indicate that AMP plays an irreplaceable role as a core component in the metabolism of purine [53]. A sharp increase in AMP may increase the ratio of ATP/AMP, thereby activating the AMPK pathway [54,55,56,57], followed by beta-oxidation of fatty acids and glycolysis, providing more energy to the cell. The basic carbon skeleton is required for the synthesis of viruses. Here we demonstrate that influenza viruses widely use nucleotides and derivatives thereof as synthetic substrates during replication and, therefore, nucleotide starvation effectively can modulate immune responses, thereby reducing the efficiency of viral replication [58].
Furthermore, prostaglandins are reported to be used by IAV to achieve immune escape. Prostaglandin H2 was upregulated in our study. PGH2 is the first intermediate in the biosynthesis of all prostaglandins, which can be converted into PGE2 and PGD2 with biological activity [59,60]. PGE2 is expressed in macrophages during influenza infection, and inhibiting PGE2 can promote the aggregation of macrophages into the lungs and produce interferon [59]. However, to expand the infection of the influenza virus, DC cell migration is inhibited by PGD2 [60]. Thus, the blocking of prostaglandin synthesis during early infection leads to the accelerated activation of immune cells in the lungs to suppress infection.
Taken together, the metabolic activity of the virus in the early stage of infection plays a critical role in evading the host’s innate immunity and preparing a large number of substrates for its replication and proliferation. Therefore, virus infection can be targeted in the early stages of virus reproduction based on its characteristics. Accompanying the analysis of metabolomic studies, broad-spectrum antiviral drugs against post-infection lipid metabolization have been developed [8,13]. This affirms that metabolomics can serve as a mature research method to regulate influenza virus infection and contribute to the prevention and treatment of influenza [55].

5. Conclusions

To identify host cell responses to influenza-infected host cells, we used metabolomic analysis to identify differentially expressed metabolites between uninfected controls and IAV-infected A549 cells. We found that, compared to the control group, the IAV-infected group displayed a large amount of altered metabolic activity, with significant differences found in 50 discrete metabolites. These were distributed mainly in purine metabolization, lipid metabolization, and glutathione metabolization, which accelerate the replication speed of the virus for the first replication cycle of the influenza virus, but also causes innate immunity to monitor metabolic changes. To summarize, our research suggests novel approaches for the future development of immune metabolism studies and provides evidence for further confirmation of the complex regulatory mechanisms between IAV and host cells.

Supplementary Materials

The following are available online at https://www.mdpi.com/1999-4915/11/11/1007/s1, Figure S1. Immunofluorescence staining of A549 cells post-infection with A/WSN/1933 at MOI of 0.1, 1, or 5. Figure S2. Volcano plots of metabolic changes of virus infection at different time points. Figure S3. Box plots of the 2 h metabolic changes of virus infection in A549 cells. Figure S4. Box plots of the 5 h metabolic changes of virus infection in A549 cells. Figure S5. Box plots of the 8 h metabolic changes of virus infection in A549 cells. Figure S6. The concentration of metabolites in mouse lung epithelial cells (MLE-12). (A) Metabolic changes in PGH2, (B) changes in acetylcholine metabolism, and (C) changes in hypoxanthine metabolism. Figure S7. The viral lung titers of the mice infected with WSN.

Author Contributions

J.L. and W.L. conceived and designed the experiments. X.T. and C.C. performed the viral replication ability tests, immunology, and metabolomics analyses. J.M. and Y.C. performed other experimental data analyses. J.L., K.Z., and X.T. wrote the manuscript and completed its revision. C.D. suggested many of the experiment in this study. All authors read and approved the final manuscript.

Funding

This work was supported by grants from the National Natural Science Foundation of China (Grant No. 31970153, 31630079), the National Key R&D Program of China (2016YFD0500206), the National Science and Technology Major Project (2018ZX10101004), and Strategic Priority Research Program of the Chinese Academy of Sciences (XDB29010000). J.L. is supported by Youth Innovation Promotion Association of CAS (2019091).

Conflicts of Interest

The authors declare no conflict of interest.

References

  1. Cui, L.; Mahesutihan, M.; Zheng, W.; Meng, L.; Fan, W.; Li, J.; Ye, X.; Liu, W.; Sun, L. Cdc25b promotes influenza a virus replication by regulating the phosphorylation of nucleoprotein. Virology 2018, 525, 40–47. [Google Scholar] [CrossRef] [PubMed]
  2. Li, J.; Yu, M.; Zheng, W.; Liu, W. Nucleocytoplasmic shuttling of influenza a virus proteins. Viruses 2015, 7, 2668–2682. [Google Scholar] [CrossRef] [PubMed]
  3. Hale, B.G.; Albrecht, R.A.; Garcia-Sastre, A. Innate immune evasion strategies of influenza viruses. Future Microbiol. 2010, 5, 23–41. [Google Scholar] [CrossRef] [PubMed] [Green Version]
  4. Cline, T.D.; Beck, D.; Bianchini, E. Influenza virus replication in macrophages: Balancing protection and pathogenesis. J. Gen. Virol. 2017, 98, 2401–2412. [Google Scholar] [CrossRef]
  5. Teijaro, J.R.; Walsh, K.B.; Cahalan, S.; Fremgen, D.M.; Roberts, E.; Scott, F.; Martinborough, E.; Peach, R.; Oldstone, M.B.; Rosen, H. Endothelial cells are central orchestrators of cytokine amplification during influenza virus infection. Cell 2011, 146, 980–991. [Google Scholar] [CrossRef]
  6. Zheng, W.; Cao, S.; Chen, C.; Li, J.; Zhang, S.; Jiang, J.; Niu, Y.; Fan, W.; Li, Y.; Bi, Y.; et al. Threonine 80 phosphorylation of non-structural protein 1 regulates the replication of influenza a virus by reducing the binding affinity with rig-i. Cell Microbiol. 2017, 19. [Google Scholar] [CrossRef]
  7. Liu, X.; Sun, L.; Yu, M.; Wang, Z.; Xu, C.; Xue, Q.; Zhang, K.; Ye, X.; Kitamura, Y.; Liu, W. Cyclophilin a interacts with influenza a virus m1 protein and impairs the early stage of the viral replication. Cell Microbiol. 2009, 11, 730–741. [Google Scholar] [CrossRef]
  8. Altan-Bonnet, N. Lipid tales of viral replication and transmission. Trends Cell Biol. 2017, 27, 201–213. [Google Scholar] [CrossRef]
  9. Goodwin, C.M.; Xu, S.; Munger, J. Stealing the keys to the kitchen: Viral manipulation of the host cell metabolic network. Trends Microbiol. 2015, 23, 789–798. [Google Scholar] [CrossRef]
  10. Sanchez, E.L.; Lagunoff, M. Viral activation of cellular metabolism. Virology 2015, 479–480, 609–618. [Google Scholar] [CrossRef]
  11. Yip, T.F.; Selim, A.S.M.; Lian, I.; Lee, S.M. Advancements in host-based interventions for influenza treatment. Front. Immunol. 2018, 9, 1547. [Google Scholar] [CrossRef] [PubMed]
  12. Yanguez, E.; Hunziker, A.; Dobay, M.P.; Yildiz, S.; Schading, S.; Elshina, E.; Karakus, U.; Gehrig, P.; Grossmann, J.; Dijkman, R.; et al. Phosphoproteomic-based kinase profiling early in influenza virus infection identifies grk2 as antiviral drug target. Nat. Commun. 2018, 9, 3679. [Google Scholar] [CrossRef] [PubMed]
  13. Yuan, S.; Chu, H.; Chan, J.F.; Ye, Z.W.; Wen, L.; Yan, B.; Lai, P.M.; Tee, K.M.; Huang, J.; Chen, D.; et al. Srebp-dependent lipidomic reprogramming as a broad-spectrum antiviral target. Nat. Commun. 2019, 10, 120. [Google Scholar] [CrossRef] [PubMed]
  14. Boergeling, Y.; Ludwig, S. Targeting a metabolic pathway to fight the flu. FEBS J. 2017, 284, 218–221. [Google Scholar] [CrossRef] [PubMed]
  15. Gaelings, L.; Soderholm, S.; Bugai, A.; Fu, Y.; Nandania, J.; Schepens, B.; Lorey, M.B.; Tynell, J.; Vande Ginste, L.; Le Goffic, R.; et al. Regulation of kynurenine biosynthesis during influenza virus infection. FEBS J. 2017, 284, 222–236. [Google Scholar] [CrossRef]
  16. Ritter, J.B.; Wahl, A.S.; Freund, S.; Genzel, Y.; Reichl, U. Metabolic effects of influenza virus infection in cultured animal cells: Intra- and extracellular metabolite profiling. BMC Syst. Biol. 2010, 4, 61. [Google Scholar] [CrossRef]
  17. Janke, R.; Genzel, Y.; Wetzel, M.; Reichl, U. Effect of influenza virus infection on key metabolic enzyme activities in mdck cells. BMC Proc. 2011, 5 (Suppl. 8), P129. [Google Scholar] [CrossRef]
  18. Li, X.K.; Lu, Q.B.; Chen, W.W.; Xu, W.; Liu, R.; Zhang, S.F.; Du, J.; Li, H.; Yao, K.; Zhai, D.; et al. Arginine deficiency is involved in thrombocytopenia and immunosuppression in severe fever with thrombocytopenia syndrome. Sci. Transl. Med. 2018, 10. [Google Scholar] [CrossRef]
  19. Ren, Y.; Tang, Q.; Liu, W.; Tang, Y.; Zhu, R.; Li, B. Serum biomarker identification by mass spectrometry in acute aortic dissection. Cell Physiol. Biochem. 2017, 44, 2147–2157. [Google Scholar] [CrossRef]
  20. Wang, L.; Liu, S.; Yang, W.; Yu, H.; Zhang, L.; Ma, P.; Wu, P.; Li, X.; Cho, K.; Xue, S.; et al. Plasma amino acid profile in patients with aortic dissection. Sci. Rep. 2017, 7, 40146. [Google Scholar] [CrossRef]
  21. Qian, W.; Kang, A.; Peng, L.; Xie, T.; Ji, J.; Zhou, W.; Shan, J.; Di, L. Gas chromatography-mass spectrometry based plasma metabolomics of h1n1-induced inflammation in mice and intervention with flos lonicerae japonica-fructus forsythiae herb pair. J. Chromatogr. B Analyt. Technol. Biomed. Life Sci. 2018, 1092, 122–130. [Google Scholar] [CrossRef] [PubMed]
  22. Wiklund, S.; Johansson, E.; Sjostrom, L.; Mellerowicz, E.J.; Edlund, U.; Shockcor, J.P.; Gottfries, J.; Moritz, T.; Trygg, J. Visualization of gc/tof-ms-based metabolomics data for identification of biochemically interesting compounds using opls class models. Anal. Chem. 2008, 80, 115–122. [Google Scholar] [CrossRef] [PubMed]
  23. Xia, J.; Sinelnikov, I.V.; Han, B.; Wishart, D.S. Metaboanalyst 3.0--making metabolomics more meaningful. Nucleic Acids Res. 2015, 43, W251–W257. [Google Scholar] [CrossRef] [PubMed]
  24. Kanehisa, M.; Goto, S.; Sato, Y.; Furumichi, M.; Tanabe, M. Kegg for integration and interpretation of large-scale molecular data sets. Nucleic Acids Res. 2012, 40, D109–D114. [Google Scholar] [CrossRef] [PubMed]
  25. Kanehisa, M.; Goto, S.; Sato, Y.; Kawashima, M.; Furumichi, M.; Tanabe, M. Data, information, knowledge and principle: Back to metabolism in kegg. Nucleic Acids Res. 2014, 42, D199–D205. [Google Scholar] [CrossRef]
  26. Liu, W.; Qiu, X.; Song, C.; Sun, Y.; Meng, C.; Liao, Y.; Tan, L.; Ding, Z.; Liu, X.; Ding, C. Deep sequencing-based transcriptome profiling reveals avian interferon-stimulated genes and provides comprehensive insight into newcastle disease virus-induced host responses. Viruses 2018, 10, 162. [Google Scholar] [CrossRef] [PubMed]
  27. Wishart, D.S.; Jewison, T.; Guo, A.C.; Wilson, M.; Knox, C.; Liu, Y.; Djoumbou, Y.; Mandal, R.; Aziat, F.; Dong, E.; et al. Hmdb 3.0—The human metabolome database in 2013. Nucleic Acids Res. 2013, 41, D801–D807. [Google Scholar] [CrossRef]
  28. Kido, H. Influenza virus pathogenicity regulated by host cellular proteases, cytokines and metabolites, and its therapeutic options. Proc. Jpn. Acad. Ser. B Phys. Biol. Sci. 2015, 91, 351–368. [Google Scholar] [CrossRef] [Green Version]
  29. Tumpey, T.M.; Garcia-Sastre, A.; Taubenberger, J.K.; Palese, P.; Swayne, D.E.; Basler, C.F. Pathogenicity and immunogenicity of influenza viruses with genes from the 1918 pandemic virus. Proc. Natl. Acad. Sci. USA 2004, 101, 3166–3171. [Google Scholar] [CrossRef] [Green Version]
  30. Graham, A.C.; Hilmer, K.M.; Zickovich, J.M.; Obar, J.J. Inflammatory response of mast cells during influenza a virus infection is mediated by active infection and rig-i signaling. J. Immunol. 2013, 190, 4676–4684. [Google Scholar] [CrossRef]
  31. Pastorino, J.G.; Hoek, J.B. Hexokinase ii the integration of energy metabolism and control of apoptosis. Curr. Med. Chem. 2003, 10, 1535–1551. [Google Scholar] [CrossRef] [PubMed]
  32. Chung, M.; Cho, S.Y.; Lee, Y.S. Construction of a transcriptome-driven network at the early stage of infection with influenza a h1n1 in human lung alveolar epithelial cells. Biomol. Ther. 2018, 26, 290–297. [Google Scholar] [CrossRef] [PubMed]
  33. Hancock, A.S.; Stairiker, C.J.; Boesteanu, A.C.; Monzon-Casanova, E.; Lukasiak, S.; Mueller, Y.M.; Stubbs, A.P.; Garcia-Sastre, A.; Turner, M.; Katsikis, P.D. Transcriptome analysis of infected and bystander type 2 alveolar epithelial cells during influenza a virus infection reveals in vivo wnt pathway downregulation. J. Virol. 2018, 92, e01325-18. [Google Scholar] [CrossRef] [PubMed]
  34. Hui, K.P.; Lee, S.M.; Cheung, C.Y.; Mao, H.; Lai, A.K.; Chan, R.W.; Chan, M.C.; Tu, W.; Guan, Y.; Lau, Y.L.; et al. H5n1 influenza virus-induced mediators upregulate rig-i in uninfected cells by paracrine effects contributing to amplified cytokine cascades. J. Infect. Dis. 2011, 204, 1866–1878. [Google Scholar] [CrossRef] [PubMed]
  35. Voigt, E.A.; Swick, A.; Yin, J. Rapid induction and persistence of paracrine-induced cellular antiviral states arrest viral infection spread in a549 cells. Virology 2016, 496, 59–66. [Google Scholar] [CrossRef] [PubMed]
  36. Cui, L.; Zheng, D.; Lee, Y.H.; Chan, T.K.; Kumar, Y.; Ho, W.E.; Chen, J.Z.; Tannenbaum, S.R.; Ong, C.N. Metabolomics investigation reveals metabolite mediators associated with acute lung injury and repair in a murine model of influenza pneumonia. Sci. Rep. 2016, 6, 26076. [Google Scholar] [CrossRef]
  37. Lin, S.; Liu, N.; Yang, Z.; Song, W.; Wang, P.; Chen, H.; Lucio, M.; Schmitt-Kopplin, P.; Chen, G.; Cai, Z. Gc/ms-based metabolomics reveals fatty acid biosynthesis and cholesterol metabolism in cell lines infected with influenza a virus. Talanta 2010, 83, 262–268. [Google Scholar] [CrossRef]
  38. O’Neill, L.A.; Kishton, R.J.; Rathmell, J. A guide to immunometabolism for immunologists. Nat. Rev. Immunol. 2016, 16, 553–565. [Google Scholar] [CrossRef] [Green Version]
  39. Tisoncik-Go, J.; Gasper, D.J.; Kyle, J.E.; Eisfeld, A.J.; Selinger, C.; Hatta, M.; Morrison, J.; Korth, M.J.; Zink, E.M.; Kim, Y.M.; et al. Integrated omics analysis of pathogenic host responses during pandemic h1n1 influenza virus infection: The crucial role of lipid metabolism. Cell Host Microbe 2016, 19, 254–266. [Google Scholar] [CrossRef]
  40. Tam, V.C.; Quehenberger, O.; Oshansky, C.M.; Suen, R.; Armando, A.M.; Treuting, P.M.; Thomas, P.G.; Dennis, E.A.; Aderem, A. Lipidomic profiling of influenza infection identifies mediators that induce and resolve inflammation. Cell 2013, 154, 213–227. [Google Scholar] [CrossRef]
  41. Grantham, M.L.; Wu, W.H.; Lalime, E.N.; Lorenzo, M.E.; Klein, S.L.; Pekosz, A. Palmitoylation of the influenza a virus m2 protein is not required for virus replication in vitro but contributes to virus virulence. J. Virol. 2009, 83, 8655–8661. [Google Scholar] [CrossRef] [PubMed]
  42. Numata, M.; Kandasamy, P.; Nagashima, Y.; Posey, J.; Hartshorn, K.; Woodland, D.; Voelker, D.R. Phosphatidylglycerol suppresses influenza a virus infection. Am. J. Respir. Cell. Mol. Biol. 2012, 46, 479–487. [Google Scholar] [CrossRef] [PubMed]
  43. Metallo, C.M.; Vander Heiden, M.G. Metabolism strikes back: Metabolic flux regulates cell signaling. Genes Dev. 2010, 24, 2717–2722. [Google Scholar] [CrossRef] [PubMed]
  44. Elliott, M.R.; Chekeni, F.B.; Trampont, P.C.; Lazarowski, E.R.; Kadl, A.; Walk, S.F.; Park, D.; Woodson, R.I.; Ostankovich, M.; Sharma, P.; et al. Nucleotides released by apoptotic cells act as a find-me signal to promote phagocytic clearance. Nature 2009, 461, 282–286. [Google Scholar] [CrossRef] [PubMed] [Green Version]
  45. Burnstock, G.; Brouns, I.; Adriaensen, D.; Timmermans, J.P. Purinergic signaling in the airways. Pharmacol. Rev. 2012, 64, 834–868. [Google Scholar] [CrossRef]
  46. Idzko, M.; Ferrari, D.; Eltzschig, H.K. Nucleotide signalling during inflammation. Nature 2014, 509, 310–317. [Google Scholar] [CrossRef] [Green Version]
  47. Levine, A.J.; Puzio-Kuter, A.M. The control of the metabolic switch in cancers by oncogenes and tumor suppressor genes. Science 2010, 330, 1340–1344. [Google Scholar] [CrossRef]
  48. Amie, S.M.; Noble, E.; Kim, B. Intracellular nucleotide levels and the control of retroviral infections. Virology 2013, 436, 247–254. [Google Scholar] [CrossRef] [Green Version]
  49. Li, T.; Li, X.; Attri, K.S.; Liu, C.; Li, L.; Herring, L.E.; Asara, J.M.; Lei, Y.L.; Singh, P.K.; Gao, C.; et al. O-glcnac transferase links glucose metabolism to mavs-mediated antiviral innate immunity. Cell Host Microbe 2018, 24, 791–803 e796. [Google Scholar] [CrossRef]
  50. Rabinowitz, J.D.; White, E. Autophagy and metabolism. Science 2010, 330, 1344–1348. [Google Scholar] [CrossRef]
  51. Aeffner, F.; Woods, P.S.; Davis, I.C. Activation of a1-adenosine receptors promotes leukocyte recruitment to the lung and attenuates acute lung injury in mice infected with influenza a/wsn/33 (h1n1) virus. J. Virol. 2014, 88, 10214–10227. [Google Scholar] [CrossRef] [PubMed]
  52. Chandler, J.D.; Hu, X.; Ko, E.J.; Park, S.; Lee, Y.T.; Orr, M.; Fernandes, J.; Uppal, K.; Kang, S.M.; Jones, D.P.; et al. Metabolic pathways of lung inflammation revealed by high-resolution metabolomics (hrm) of h1n1 influenza virus infection in mice. Am. J. Physiol. Regul. Integr. Comp. Physiol. 2016, 311, R906–R916. [Google Scholar] [CrossRef] [PubMed]
  53. Shin, A.; Toy, T.; Rothenfusser, S.; Robson, N.; Vorac, J.; Dauer, M.; Stuplich, M.; Endres, S.; Cebon, J.; Maraskovsky, E.; et al. P2y receptor signaling regulates phenotype and ifn-alpha secretion of human plasmacytoid dendritic cells. Blood 2008, 111, 3062–3069. [Google Scholar] [CrossRef] [PubMed]
  54. Kuss-Duerkop, S.K.; Wang, J.; Mena, I.; White, K.; Metreveli, G.; Sakthivel, R.; Mata, M.A.; Munoz-Moreno, R.; Chen, X.; Krammer, F.; et al. Influenza virus differentially activates mtorc1 and mtorc2 signaling to maximize late stage replication. PLoS Pathog. 2017, 13, e1006635. [Google Scholar] [CrossRef] [PubMed]
  55. Inoki, K.; Kim, J.; Guan, K.L. Ampk and mtor in cellular energy homeostasis and drug targets. Annu. Rev. Pharmacol. Toxicol. 2012, 52, 381–400. [Google Scholar] [CrossRef]
  56. Yang, K.; Chi, H. Ampk helps t cells survive nutrient starvation. Immunity 2015, 42, 4–6. [Google Scholar] [CrossRef]
  57. Blagih, J.; Coulombe, F.; Vincent, E.E.; Dupuy, F.; Galicia-Vazquez, G.; Yurchenko, E.; Raissi, T.C.; van der Windt, G.J.; Viollet, B.; Pearce, E.L.; et al. The energy sensor ampk regulates t cell metabolic adaptation and effector responses in vivo. Immunity 2015, 42, 41–54. [Google Scholar] [CrossRef]
  58. Ayinde, D.; Casartelli, N.; Schwartz, O. Restricting hiv the samhd1 way: Through nucleotide starvation. Nat. Rev. Microbiol. 2012, 10, 675–680. [Google Scholar] [CrossRef]
  59. Coulombe, F.; Jaworska, J.; Verway, M.; Tzelepis, F.; Massoud, A.; Gillard, J.; Wong, G.; Kobinger, G.; Xing, Z.; Couture, C.; et al. Targeted prostaglandin e2 inhibition enhances antiviral immunity through induction of type i interferon and apoptosis in macrophages. Immunity 2014, 40, 554–568. [Google Scholar] [CrossRef]
  60. Zhao, J.; Zhao, J.; Legge, K.; Perlman, S. Age-related increases in pgd(2) expression impair respiratory dc migration, resulting in diminished t cell responses upon respiratory virus infection in mice. J. Clin. Investig. 2011, 121, 4921–4930. [Google Scholar] [CrossRef]
Figure 1. A549 cells were infected with A/WSN/1933 at different time points. (A) Immunofluorescence staining of A549 cells post-infection with A/WSN/1933. Infected cells were distributed in four wells of a 24-well plate at a MOI of 0.1. The influenza virus NP protein was analyzed with FITC-conjugated antibody (left), and the nuclei were examined using DAPI staining (middle). Uninfected control is shown on the right. Scale bar, 100 μm. (B) Growth curve of IAVs in A549 cells. The cells were infected with A/WSN/1933 virus (MOI of 0.1). The supernatants were collected at the indicated time points, and viral titers were determined by plaque-forming units.
Viruses 11 01007 g001
Figure 2. Identification and characterization of altered metabolites after IAV infection. (A), Bar graph showing a large number of metabolite changes. The X-axis represents the time point, and the negative log10 of the p-value on the y-axis. The metabolites with log2 fold changes >1 or <−1 and −log10 p > 1.3 were significantly different. Red (positive ion modes) and yellow (negative ion modes) indicate up-regulated, while dark blue (positive ion modes) and light blue (negative ion modes) indicate down-regulated. (BD), A549 cells were infected with A/WSN/1933 viruses at a MOI of 0.1 for 2 h (B), 5 h (C), and 8 h (D). Total metabolites were extracted and used for metabolomic analysis. The expression values shown in shades of green and red indicate gene levels below and above the median expression value across all the samples (log2, from −2 to +2), respectively. Each row is a differential metabolite, and each column represents a replicate of a group.
Viruses 11 01007 g002
Figure 3. Top 15 enriched pathways based on characteristic metabolites in A/WSN/1933-infected cells. Pathway analysis allowed the construction of a scatter plot of KEGG pathway enrichment statistics for characteristic metabolites following A/WSN/1933 infection of A549 cells. (A) Global metabolic disorders of the most relevant pathways induced by A/WSN/1933 were revealed using MetaboAnalyst 4.0. “Pathway Impact” means that the selected metabolites conducted topological analysis of the metabolic pathway according to their different positions in the metabolic pathway. The corresponding score is shown on the X-axis, and the p-value (Y-axis) of the metabolic pathway enrichment analysis is selected as the most valuable metabolic pathway, (BD). Rich factor is the ratio of the number of differentially expressed genes noted in the pathway terms to all metabolite numbers found in this pathway term. We selected the top 15 of the KEGG enrichment results as a reference. “Compound number” is the compounds here referring to the ones in Table 1. A greater Rich Factor indicates higher intensity. To control the false discovery rate (FDR), we used q = 0.05 to correct the p-value of the metabolites, ranging from 0 to 1. A lower q-value indicates higher intensity.
Viruses 11 01007 g003
Figure 4. Schematic of metabolic pathways influenced by IAV infection. The pathways depicted here are indicative of numerous cellular metabolic pathways. Glycerophospholipid metabolism, glutathione metabolism, fatty acid biosynthesis, the hexosamine pathway, glycolysis, and purine metabolism pathways are highlighted. The metabolites with red (upregulated) and green (downregulated) labels are significantly altered metabolites in A/WSN/1933.
Viruses 11 01007 g004
Figure 5. Key metabolites by box plots of different times by infection. Metabolite concentration changes in (A) PGH2, (B) acetylcholine, (C) hypoxanthine, extracted from human cells, serum, and lung tissue post-infection were determined by using each peak intensity ratio. Each p-value is filled on the box plot with the metabolite name, and the maximum/minimum value and dispersion of the data are illustrated in GC/MS chromatograms.
Viruses 11 01007 g005
Table 1. Summary of differentially expressed metabolites data.
No.Time (h)MetabolitesFormulaM/ZMrHMDBPubChemKEGG
121-MethylnicotinamideC7H9N2O137.07137.1HMDB0000699457C02918
22PantothenateC9H17NO5218.1035219.2HMDB0000210988C00864
32SorbitolC6H14O6181.0722182.1HMDB00002475780C00794
42L-GlutamineC5H10N2O3147.0754146.1HMDB00006415961C00064
52S-Methyl-5’-thioadenosineC11H15N5O3S298.0959297.3HMDB0001173439176C00170
6 Oxidized glutathioneC20H32N6O12S2613.1575612.6HMDB0003337975C00127
72LysoPC (18:1(9Z))C26H52NO7P522.3537521.7HMDB000281516081932C04230
82TaurineC2H7NO3S126.0208125.1HMDB00002511123C00245
92PhosphorylcholineC5H15NO4P184.0724184.2HMDB00015651014C00588
102Uridine diphosphate-N-acetylglucosamineC17H27N3O17P2608.087607.4HMDB0000290445675C00043
112LysoPC (16:0)C24H50NO7P496.3379495.6HMDB0010382460602C04230
122L-Glutamic acidC5H9NO4148.0596147.1HMDB000014833032C00025
132Pyroglutamic acidC5H7NO3130.0488129.1HMDB00002677405C01879
142Niacinamide (Niacinamide)C6H6N2O123.0541122.1HMDB0001406936C00153
152Adenosine monophosphate (AMP)C10H14N5O7P348.0695347.2HMDB00000456083C00020
162InosineC10H12N4O5269.0871268.2HMDB00001956021C00294
172HypoxanthineC5H4N4O137.0446136.1HMDB0000157790C00262
182AdenineC5H5N5136.0609135.1HMDB0000034190C00147
192ErucamideC18H19NO4338.3408313.3HMDB00293655280537C02717
202Prostaglandin H2C20H32O5351.2177352.5HMDB0001381445049C00427
212Oxoadipic acidC6H8O5141.0171160.1HMDB000022571C00322
222D-MannoseC6H12O6179.0562180.1HMDB000016918950C00159
232PG (16:0/18:1(9Z))C40H77O10P747.5194749.0HMDB001057452941750/
242Pentadecanoic acidC15H30O2241.2175242.4HMDB000082613849C16537
255UridineC9H12N2O6245.0758244.2HMDB00002966029C00299
265L-CarnitineC7H15NO3162.1115161.2HMDB00000622724480C00318
275DeoxyadenosineC10H13N5O3252.1082251.2HMDB000010113730C00559
285PC (16:0/16:0)C40H80NO8P778.536734.0HMDB0000564452110C00157
2952-HydroxyadenineC5H5N5O152.0557151.1HMDB000040376900/
305UracilC4H4N2O2111.0198112.1HMDB00003001174C00106
315MG (0:0/16:0/0:0)C19H38O4331.2837330.5HMDB0011533123409/
325AdenosineC10H13N5O4268.1033267.2HMDB000005060961C00212
335D-ProlineC5H9NO2116.0694115.1HMDB00034118988C00763
345Nicotinate (Nicotinic acid)C6H5NO2124.0383123.1HMDB0001488938C00253
355PC (18:0/18:1(9Z)) (SOPC)C44H86NO8P832.582788.1HMDB000803824778825C00157
365L-AcetylcarnitineC9H17NO4204.1221203.2HMDB00002011C02571
375CytidineC9H13N3O5244.0919243.2HMDB00000896175C00475
385CytosineC4H5N3O112.0494111.1HMDB0000630597C00380
395GuanosineC10H13N5O5284.098283.2HMDB00001336802C00387
405BetaineC5H11NO2118.0852117.1HMDB0000043247C00719
418AcetylcholineC7H16NO2146.1164146.2HMDB0000895187C01996
4282-EthoxyethanolC4H10O2151.095590.1HMDB00312138076C14687
438Palmitoleic acidC16H30O2253.2176254.4HMDB0003229445638C08362
448Oleic acidC18H34O2281.2488282.5HMDB0000207445639C00712
458Arachidonic acidC20H32O2303.2332304.5HMDB0001043444899C00219
468Myristic acidC14H28O2227.2022228.4HMDB000080611005C06424
478Heptadecanoic acidC17H34O2269.2486270.5HMDB000225910465/
488Nervonic acidC24H46O2365.3424366.6HMDB00023685281120C08323
498Palmitic acidC16H32O2255.2333256.4HMDB0000220985C00249
508AcamprosateC5H11NO4S180.0335181.2HMDB001479771158/
Table 2. Top pathways activated by H1N1-WSN virus in A549.
No.Name of PathwayTotalExpectedHits−log10 p-Value
1Purine metabolism921.605388.9037
2Pyrimidine metabolism601.046955.6818
3Nitrogen metabolism390.6805245.4648
4Glycerophospholipid metabolism390.6805245.4648
5Fatty acid biosynthesis490.8550144.6447
6D-Glutamine and D-glutamate metabolism110.1919424.2132
7Glutathione metabolism380.6630733.6014
8Nicotinate and nicotinamide metabolism440.7677633.2223
9Alanine, aspartate and glutamate metabolism240.4187822.7426
10Pantothenate and CoA biosynthesis270.4711322.5348
11beta-Alanine metabolism280.4885722.4715
12Arachidonic acid metabolism621.081832.387
13Arginine and proline metabolism771.343631.9036
14Galactose metabolism410.7154121.8366
15Fructose and mannose metabolism480.8375621.5918
16Taurine and hypotaurine metabolism200.3489811.2115
17Aminoacyl-tRNA biosynthesis751.308720.97063
18Fatty acid elongation in mitochondria270.4711310.96782
19alpha-Linolenic acid metabolism290.5060210.91228
20Lysine biosynthesis320.5583710.83755
21Amino sugar and nucleotide sugar metabolism881.535520.77921
22Butanoate metabolism400.6979610.67663
23Histidine metabolism440.7677610.61188
24Primary bile acid biosynthesis470.8201110.56861
25Lysine degradation470.8201110.56861
26Glycine, serine and threonine metabolism480.8375610.55507
27Fatty acid metabolism500.8724610.52922
28Cysteine and methionine metabolism560.9771510.46024
29Tryptophan metabolism791.378510.27865
30Porphyrin and chlorophyll metabolism1041.814710.16712

