Article

Distribution Changes of Phosphorus in Soil–Plant Systems of Larch Plantations across the Chronosequence

1
Key Laboratory of Pollution Ecology and Environmental Engineering, Institute of Applied Ecology, Chinese Academy of Sciences, Shenyang 110016, China
2
University of Chinese Academy of Sciences, Beijing 100049, China
*
Author to whom correspondence should be addressed.
Forests 2018, 9(9), 563; https://doi.org/10.3390/f9090563
Submission received: 23 August 2018 / Revised: 5 September 2018 / Accepted: 11 September 2018 / Published: 13 September 2018
(This article belongs to the Special Issue Carbon, Nitrogen and Phosphorus Cycling in Forest Soils)

Abstract

:
Phosphorus (P) is one of the most important factors influencing the growth and quality of larch plantations. A systematic knowledge of the dynamic changes of P in soil–plant systems can provide a theoretical basis for the sustainable development of larch plantations. We determined the concentration, biomass, and accumulation of P in five tree components (i.e., leaf, branch, bark, stem, and root), and the concentrations of various soil P fractions of larch plantations in 10-, 25-, and 50-year-old stands in northeast China. Our results showed that the N:P ratio and P concentration in leaves increased with stand age, indicating that the growth of larch plantations might be limited by P in the development of stands. The N:P ratio and P concentration in roots, and P resorption efficiency, increased with stand age, indicating the use efficiency of P could be enhanced in older stands. The concentrations of soil-labile P fractions (Resin-P, NaHCO3-Pi, and NaHCO3-Po) in 25- and 50-year-old stands were significantly lower than those in 10-year-old stands, indicating the availability of soil P decreases with the development of larch plantations.

1. Introduction

Larch (Larix kaempferi) is a major plantation species that is widely planted in northeast China because of its high yield and timber quality [1]. Since the 1960s, to meet the great demand for timber, large amounts of secondary forests in northeast China have been replaced by larch plantations [2]. However, due to a lack of efforts to convert larch plantations into mixed forests and the use of improper harvesting and thinning types (whole-tree thinning and harvesting methods) for larch plantations, there has been a decline in soil nutrients in these areas [3,4,5]. Among these depleted soil nutrients, phosphorus (P) has gradually become a major element affecting the growth of larch plantations with the increase of stand age [6,7].
The dynamic change of P is crucial to assess the growth and function of a forest. Further, it is closely related to the ability of soil to supply P, and the ability of plants to extract available P from the soil and to cycle absorbed P among different plant components [8,9,10]. Soil P exists in many chemical forms, including labile P and stable P forms in Hedley fractionation [11]. The transformation between different soil P forms is important for the availability of soil P for plants [12]. Although a few studies have reported on the changes of soil P fractions in larch plantations, these studies did not focus on the long-time variation of P throughout the development of larch plantations. Thus, knowledge of the variations in soil P fractions across the chronosequence can help us better understand the supply capacity of soil P with forest development. The concentration and accumulation of nutrients in different components of plants are important factors influencing plant growth [13]. Many studies have reported biomass- and nutrient-allocation strategies in plants [8,13,14,15,16]. However, these studies were not based on a destructive sampling method, especially the above- and below-ground components along a chronosequence. Moreover, few studies have focused on the study of the combination of P between soil and plants with the development of pure plantations.
In this study, we examined the changes in soil P fraction concentration and plant P allocation in larch plantations across different age classes (10-, 25-, and 50-year-old) in northeast China. The objectives of the study were to (1) reveal the variation of P distribution in soil–plant systems along an age sequence of a larch plantation, and (2) assess the availability of soil P and the ability of plants to use P across the chronosequence. We hope to provide a theoretical basis for effective P management strategies for the sustainable development of larch plantations.

2. Materials and Methods

2.1. Site Description and Experimental Design

The study was conducted at the Qingyuan Forest CERN (Chinese Ecosystem Research Network), Chinese Academy of Sciences in Liaoning Province, China (41°51′ N, 124°54′ E). The climate of this region belongs to the continental monsoon climate, with humid and rainy summers and cold and dry winters. The annual temperature is 4.7 °C and the minimum monthly and maximum monthly temperatures are –12.1 °C in January and 21.0 °C in July, respectively [17]. Annual rainfall is 700–850 mm, with more than 80% falling from July to August [1].
The study site was firstly occupied by primary mixed broadleaved Korean pine forests until the 1930s and was subsequently subjected to decades of unregulated timber removal. In the early 1950s, the original forests at this study site were completely cleared off by a large fire, and then the forest was replaced by a mixture of naturally regenerating broadleaved native tree species. Since the 1960s, the secondary natural forests at the study site were cleared for larch plantations [2].
Three stands of larch plantations, 10-year-old (young), 25-year-old (half-mature), and 50-year-old (mature) stands, were selected. Each stand was selected on a narrow range of altitudes (525–650 m) and slopes (13–17°) to minimize the differences caused by topographical features. The soil of all stands is typical brown forest soil according to the second edition of the United States Department of Agriculture soil taxonomy, with 25.6% sand, 51.2% silt, and 23.2% clay, on average, and soil depth of 40–50 cm [2]. All of the stands were in their first rotation and were developed by replacing the secondary forests. Therefore, all the stands shared similar geology, microenvironment conditions, and previous land uses, varying only in the age of the plantations. Thus, the preconditions of all the stands were appropriate for our chronosequence study. In each stand, three 20 × 20 m sample plots were laid out with three >10 m buffer zones between them. The diameter at breast height (DBH) and height of all the individual trees in each sample plot were measured. The trees in each stand were divided into 5 DBH classes based on DBH distribution. Five sample trees from each sample plot with different DBHs were selected within each stand. The basic information of the stands is presented in the Table 1.

2.2. Plant Sampling and Analysis

The sample trees of each stand were cut down in August 2015 as leaf biomass reached its peak and nutrient concentrations were stable. The stem of the sample tree was divided into segments with a length of 1 m. Next, the branch was cut down from the stem. All leaves attached to branches were picked off and divided into upper, middle, and lower layers. The roots were dug out completely, and the soil and rocks attached to the roots were cleaned away. The fresh weight of each component was immediately measured with an electronic scale. After weighing, a stem sample with a width of 2 cm was collected from each segment. In the middle of each stem segment, a 10 cm length of bark was stripped as the bark sample. A leaf sample was collected from the three layers. The root sample was collected according to the diameter of the root. At the end of September 2015, when the leaves of the larch plantation were freshly senesced, 10 litter collectors were laid out in each sample plots to obtain the senesced leaf samples. The samples of each component were immediately sent to the laboratory for drying at 65 °C until the weight was unchanged to obtain the moisture content. The biomass of each different component was obtained by adjusting the fresh weight with the respective moisture content. The P accumulation in each component was calculated by multiplying the P concentration by its respective biomass. The total biomass and P accumulation of each individual tree was calculated by summing the different components. The P resorption efficiency (PRE) was calculated as follows: PRE (%) = ((Pg − Ps × MLCF)/Pg) × 100, where Pg and Ps represent P concentrations in green and senesced leaves. The mass-loss correction factor (MLCF) value was 0.745 for conifers [18]. The larch P concentration was determined by H2SO4-H2O2 digestion, and the amount of P in each component was determined by the Murphy and Riley method [19].

2.3. Soil Sampling and Analysis

Soil bulk density samples were collected by a known volume soil cutting ring for each sample plots, then dried at 105 °C for 12 h, and reweighed to measure soil bulk density. An S-shaped curve (5 sampling plots) was randomly arranged to collect the soil cores at depths of 0–20 cm in each sample plot in July 2015. The 5 soil cores were then mixed into a composite soil sample for each sample plot. Therefore, there were 3 soil samples for each stand. The soil samples were air-dried, ground, and passed through a 0.15 mm sieve for the analysis of soil P fractions.
Soil P fractions were determined by the modified Hedley sequential extraction method [11,20]. Half a gram of each soil sample was weighed into a 50 mL centrifuge tube, and different soil P fractions were sequentially extracted by the following extraction steps: (I) Resin-P: soil was extracted with 30 mL of deionized water and a resin strip. (II) NaHCO3-P: the residue from the first extraction was further extracted with 30 mL of 0.5 M NaHCO3 (adjusted to pH 8.5). One set was oxidized to determine the total NaHCO3-P (NaHCO3-Pt). The other set was used for the determination of NaHCO3 inorganic P (NaHCO3-Pi). (III) NaOH-P: the residue from the second extraction was then extracted with 30 mL of 0.1 M NaOH. One set was oxidized for the determination of total NaOH-P (NaOH-Pt). The other set was used for the determination of NaOH inorganic P (NaOH-Pi). (IV) HCl-P: the residue from the third extraction was further extracted with 30 mL of 1 M HCl. (V) Residual-P: the residue from the last extraction was overdried at 60 °C and transferred to a conical flask and digested with conc. H2SO4 and HClO4. The amount of Residual-P was determined by the Murphy and Riley method [19]. The amounts of other soil P fractions were determined by the malachite green method [21].

2.4. Statistical Analysis

A one-way ANOVA test was conducted to evaluate the influence of stand age on soil P fractions, larch P concentrations, and N:P ratio. LSDs based on multiple posthoc comparisons (p < 0.05) were performed to evaluate the difference between the three stand ages. All statistical analyses were performed using SPSS software package version 23.0.

3. Results

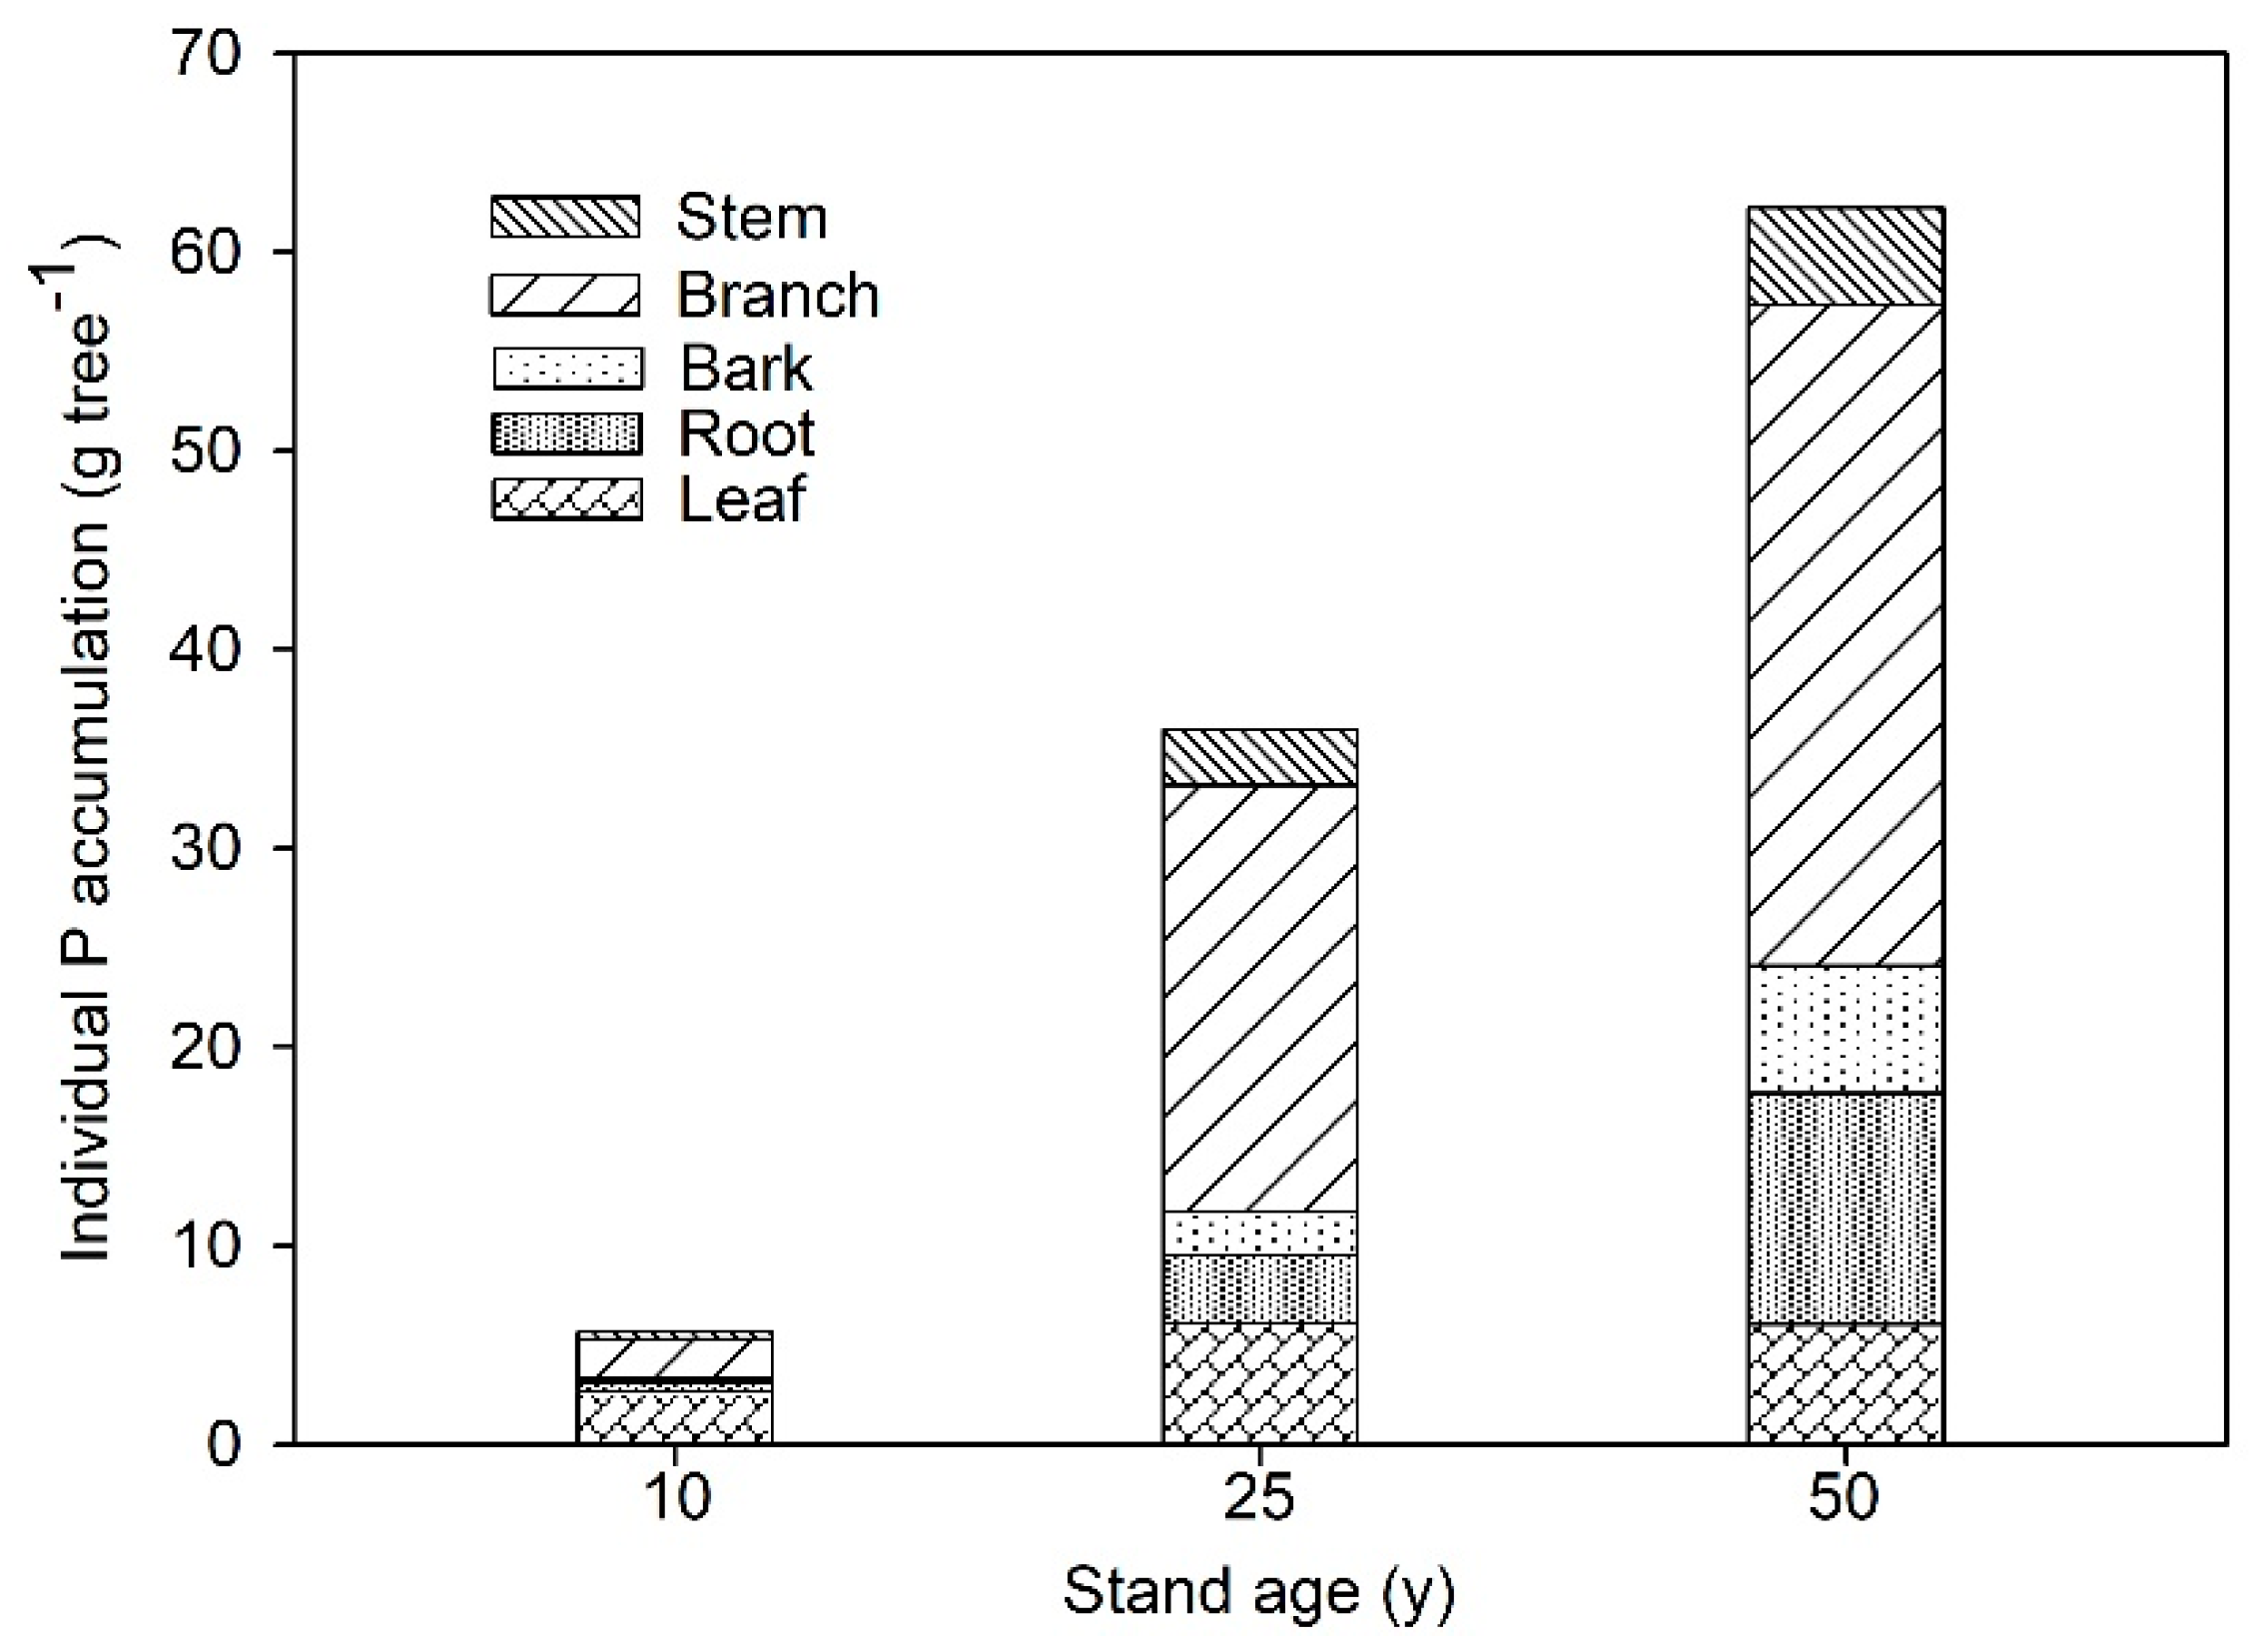
3.1. P Distribution Changes in Tree Components with Stand Age on Larch Plantations

Generally, the concentration of P in different tree components showed a consistent tendency in the three stands; P concentration decreased in the order of leaf > branch > root > bark > stem. The P concentration observed in leaves was approximately 10 times greater than that in the stems. Stand age had a significant influence on the concentration in the leaves, branches, and roots. The concentration of P in leaves decreased with increased stand age. P concentration in the roots in the 50-year-old stand was significantly higher than that in the 10- and 25-year-old stands. Stand age had no significant influence on the P concentration of the bark and stem (Table 2). The green-leaf N:P ratio significantly increased from 13.9 in the 10-year-old stand to 15.4 and 18.4 in the 25- and 50-year-old stands, respectively. The senesced leaf N:P ratio showed consistent tendency with green leaves, ranging from 6.3 to 32.6. In contrast, the root N:P ratio significantly decreased with stand age, ranging from 23.3 to 11.0, while stand age had no significant influence on the N:P ratio of the bark and stem (Table 2).
On the whole, total tree biomass increased from 9.62 kg tree−1 in the 10-year-old stand to 119.79 and 372.38 kg tree−1 in the 25- and 50-year-old stands, respectively (Table 3). Individual P accumulation for the 10-, 25-, and 50-year-old stands was 5.64, 35.95, and 62.20 g tree−1, respectively. In increasing order, P was contained in the bark (i.e., 3%, 6%, and 10% in the 10-, 25-, and 50-year-old stands, respectively) and the roots (i.e., 8%, 10%, and 19% in the 10-, 25-, and 50-year-old stands, respectively). The relative contribution of leaves to total P accumulation decreased from 47% in the 10-year-old stand to 17% and 10% in the 25- and 50-year-old stands, respectively. The relative proportion of branches to total P accumulation was 35%, 60%, and 53% in the 10-, 25-, and 50-year-old stands, respectively. The relative share of stems in total P accumulation was 7%, 8%, and 8% in the 10-, 25-, and 50-year-old stands, respectively (Figure 1).

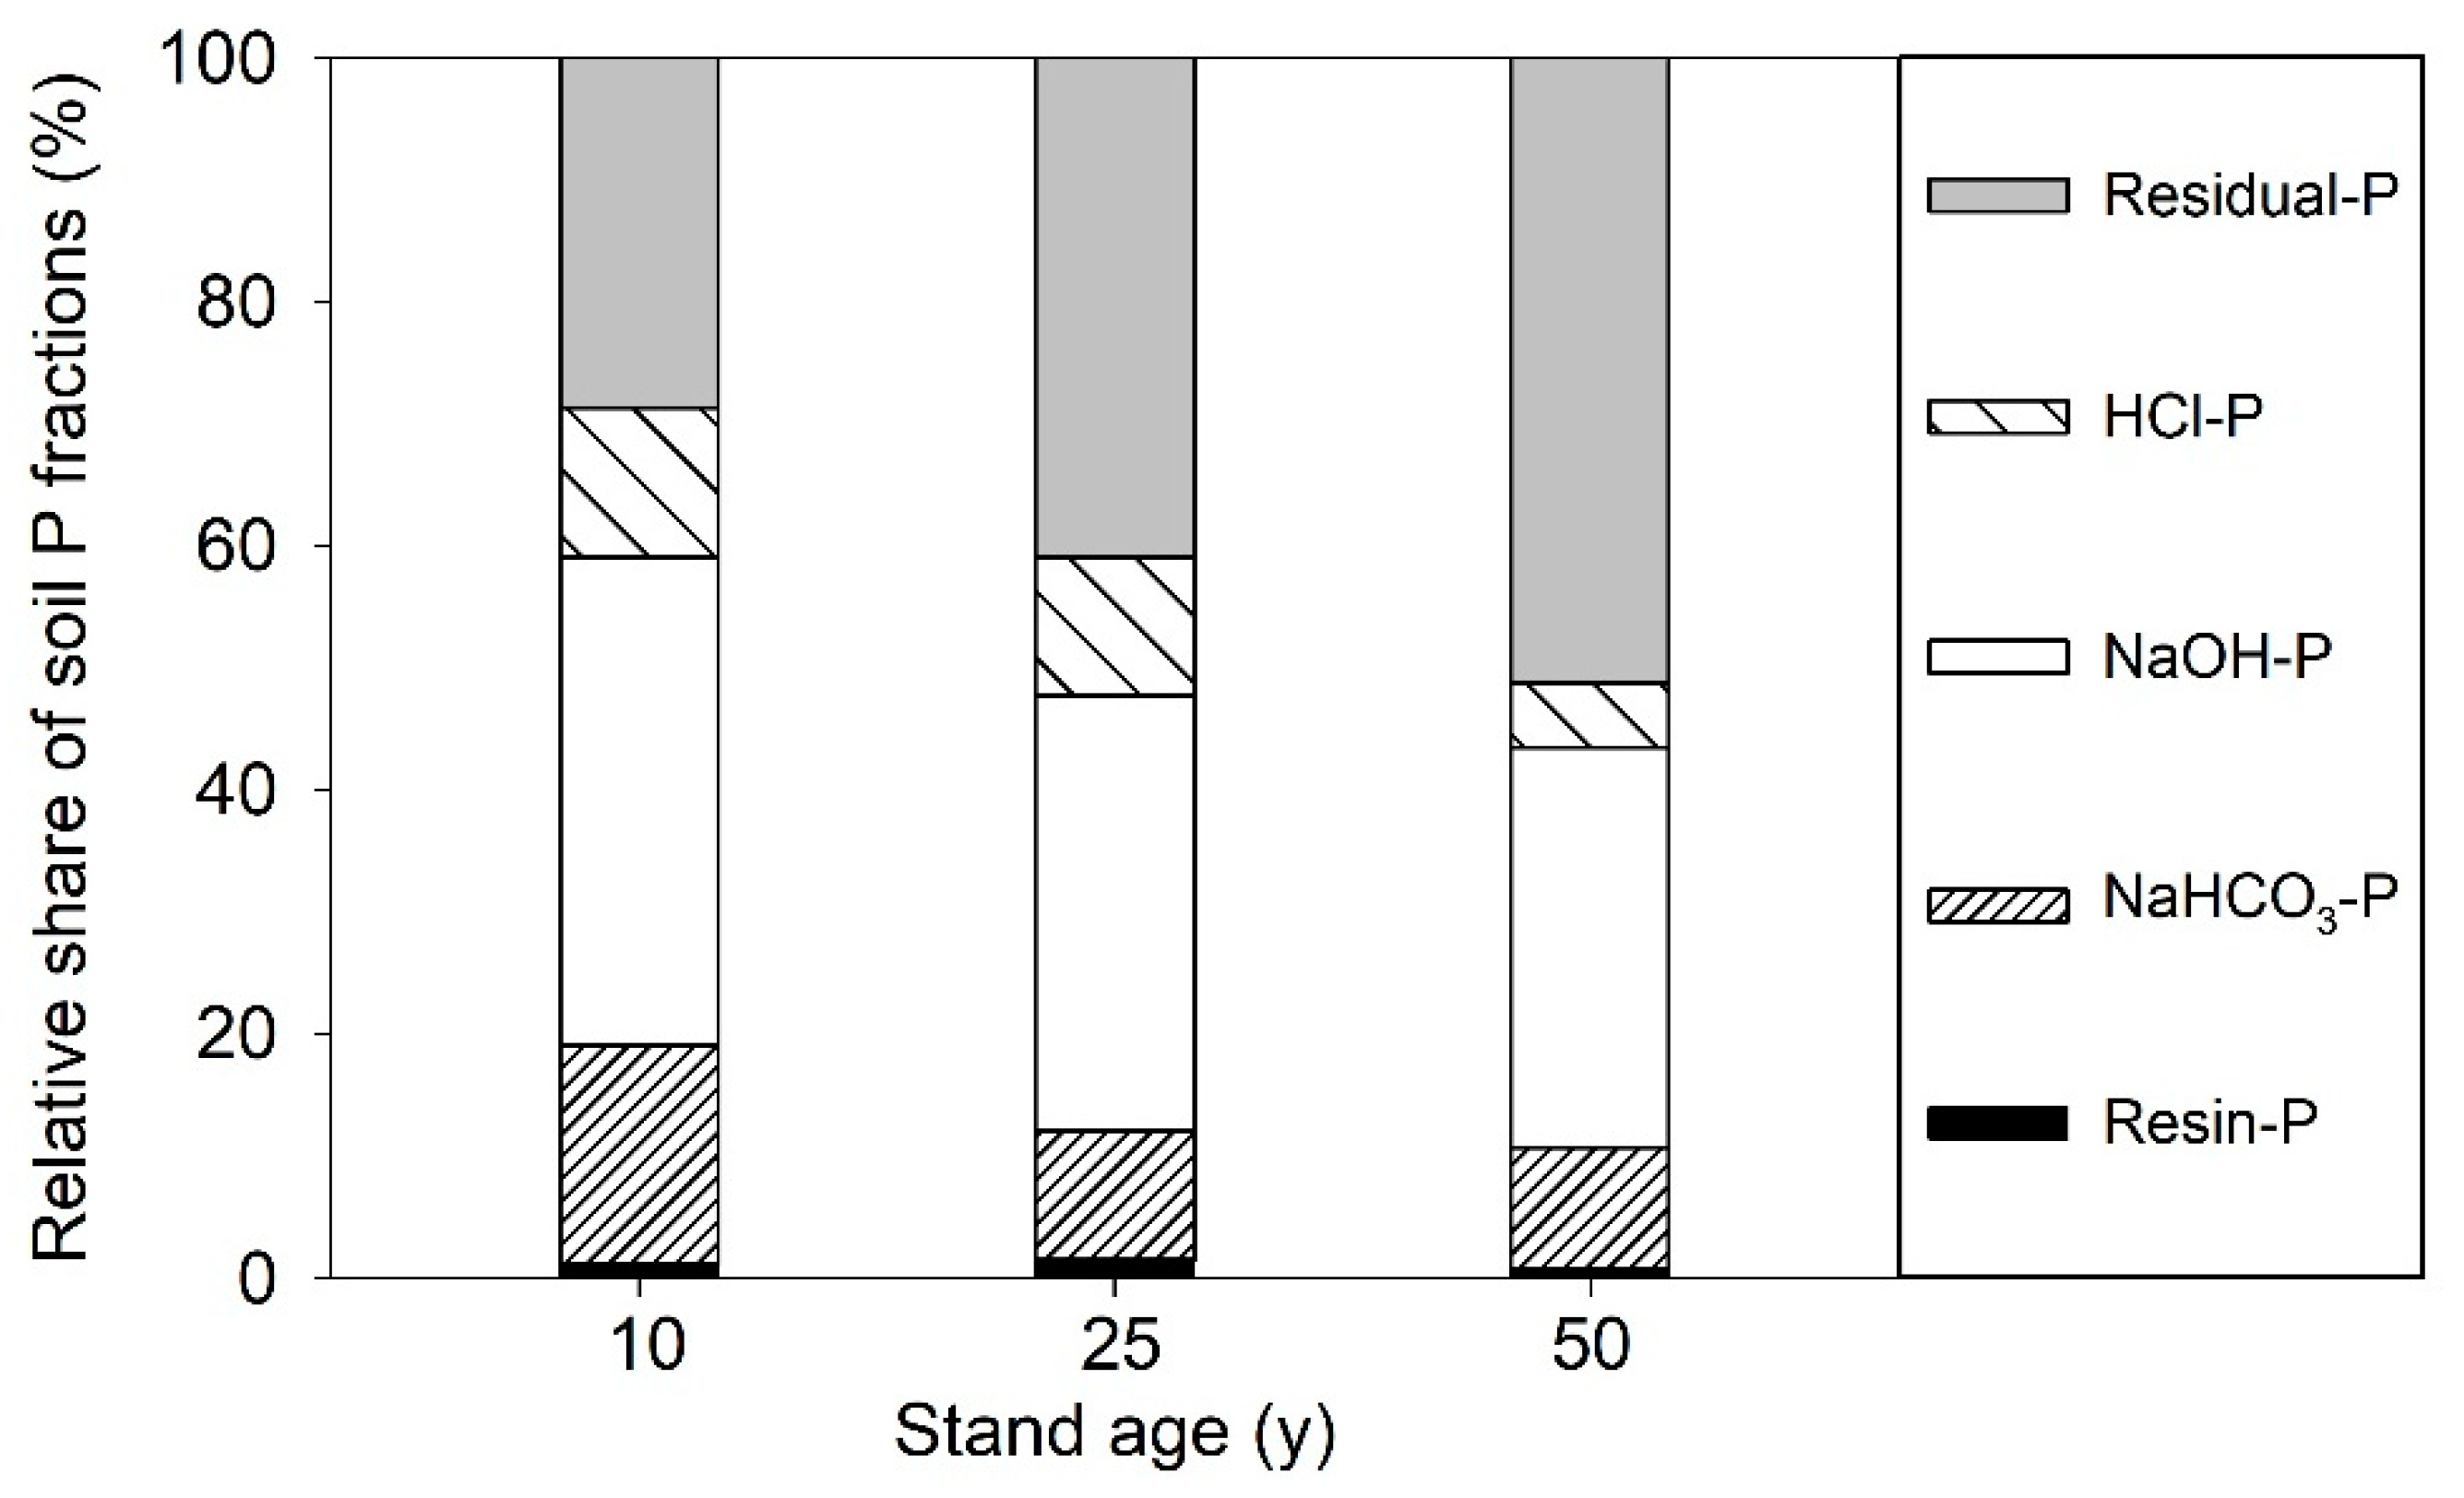
3.2. Variation of Soil P Fractions with Stand Age of Larch Plantations

The concentration of each type of soil P fraction of different stand ages is presented in Figure 2. Generally, Resin-P accounted for around 1% of the soil total P. The proportion of soil P held in the available P form (NaHCO3-P) was decreased from 18.0% in the 10-year-old stand to 10.5% in the 25-year-old stand and 10.0% in the 50-year-old stand. NaOH-P, which is known as a moderately stable P, accounted for the second-largest fraction of the soil total P in each stand, with a fraction of 40.0%, 35.7%, and 32.8% in the 10-, 25-, and 50-year-old stands, respectively. HCl-P accounted for the 12.2%, 11.4%, and 5.3% of the soil total P in the 10-, 25-, and 50-year-old stands, respectively. The percentage of residual P, which belongs to the most stable P pool, increased from 39.6% in the 10-year-old stand to 44.7% in the 25-year-old stand and 53.3% in the 50-year-old stand (Figure 2).
With an increased stand age, the concentrations of soil inorganic P fractions, such as Resin-P, NaHCO3-Pi, and HCl-P, significantly reduced. The highest concentration of each of these inorganic fractions was observed in the 10-year-old stand and was approximately triple of that in the 50-year-old stand. The soil organic P fractions (NaHCO3-Po and NaOH-Po) and the Residual-P in the 25-year-old stand were significantly lower than those in the 50-year-old stand. In contrast, the concentration of NaOH-Pi in the 25-year-old stand was much higher than that in the 50-year-old stand (Table 4).
Soil labile P is usually obtained as the sum of Resin-P, NaHCO3-Pi, and NaHCO3-Po [11]. The highest concentration of soil labile P was observed in the 10-year-old stand, which was 40% higher than that in the 25- and 50-year-old stands. Furthermore, there was no significant difference in soil labile P between the 25- and 50-year-old stands (Figure 3).

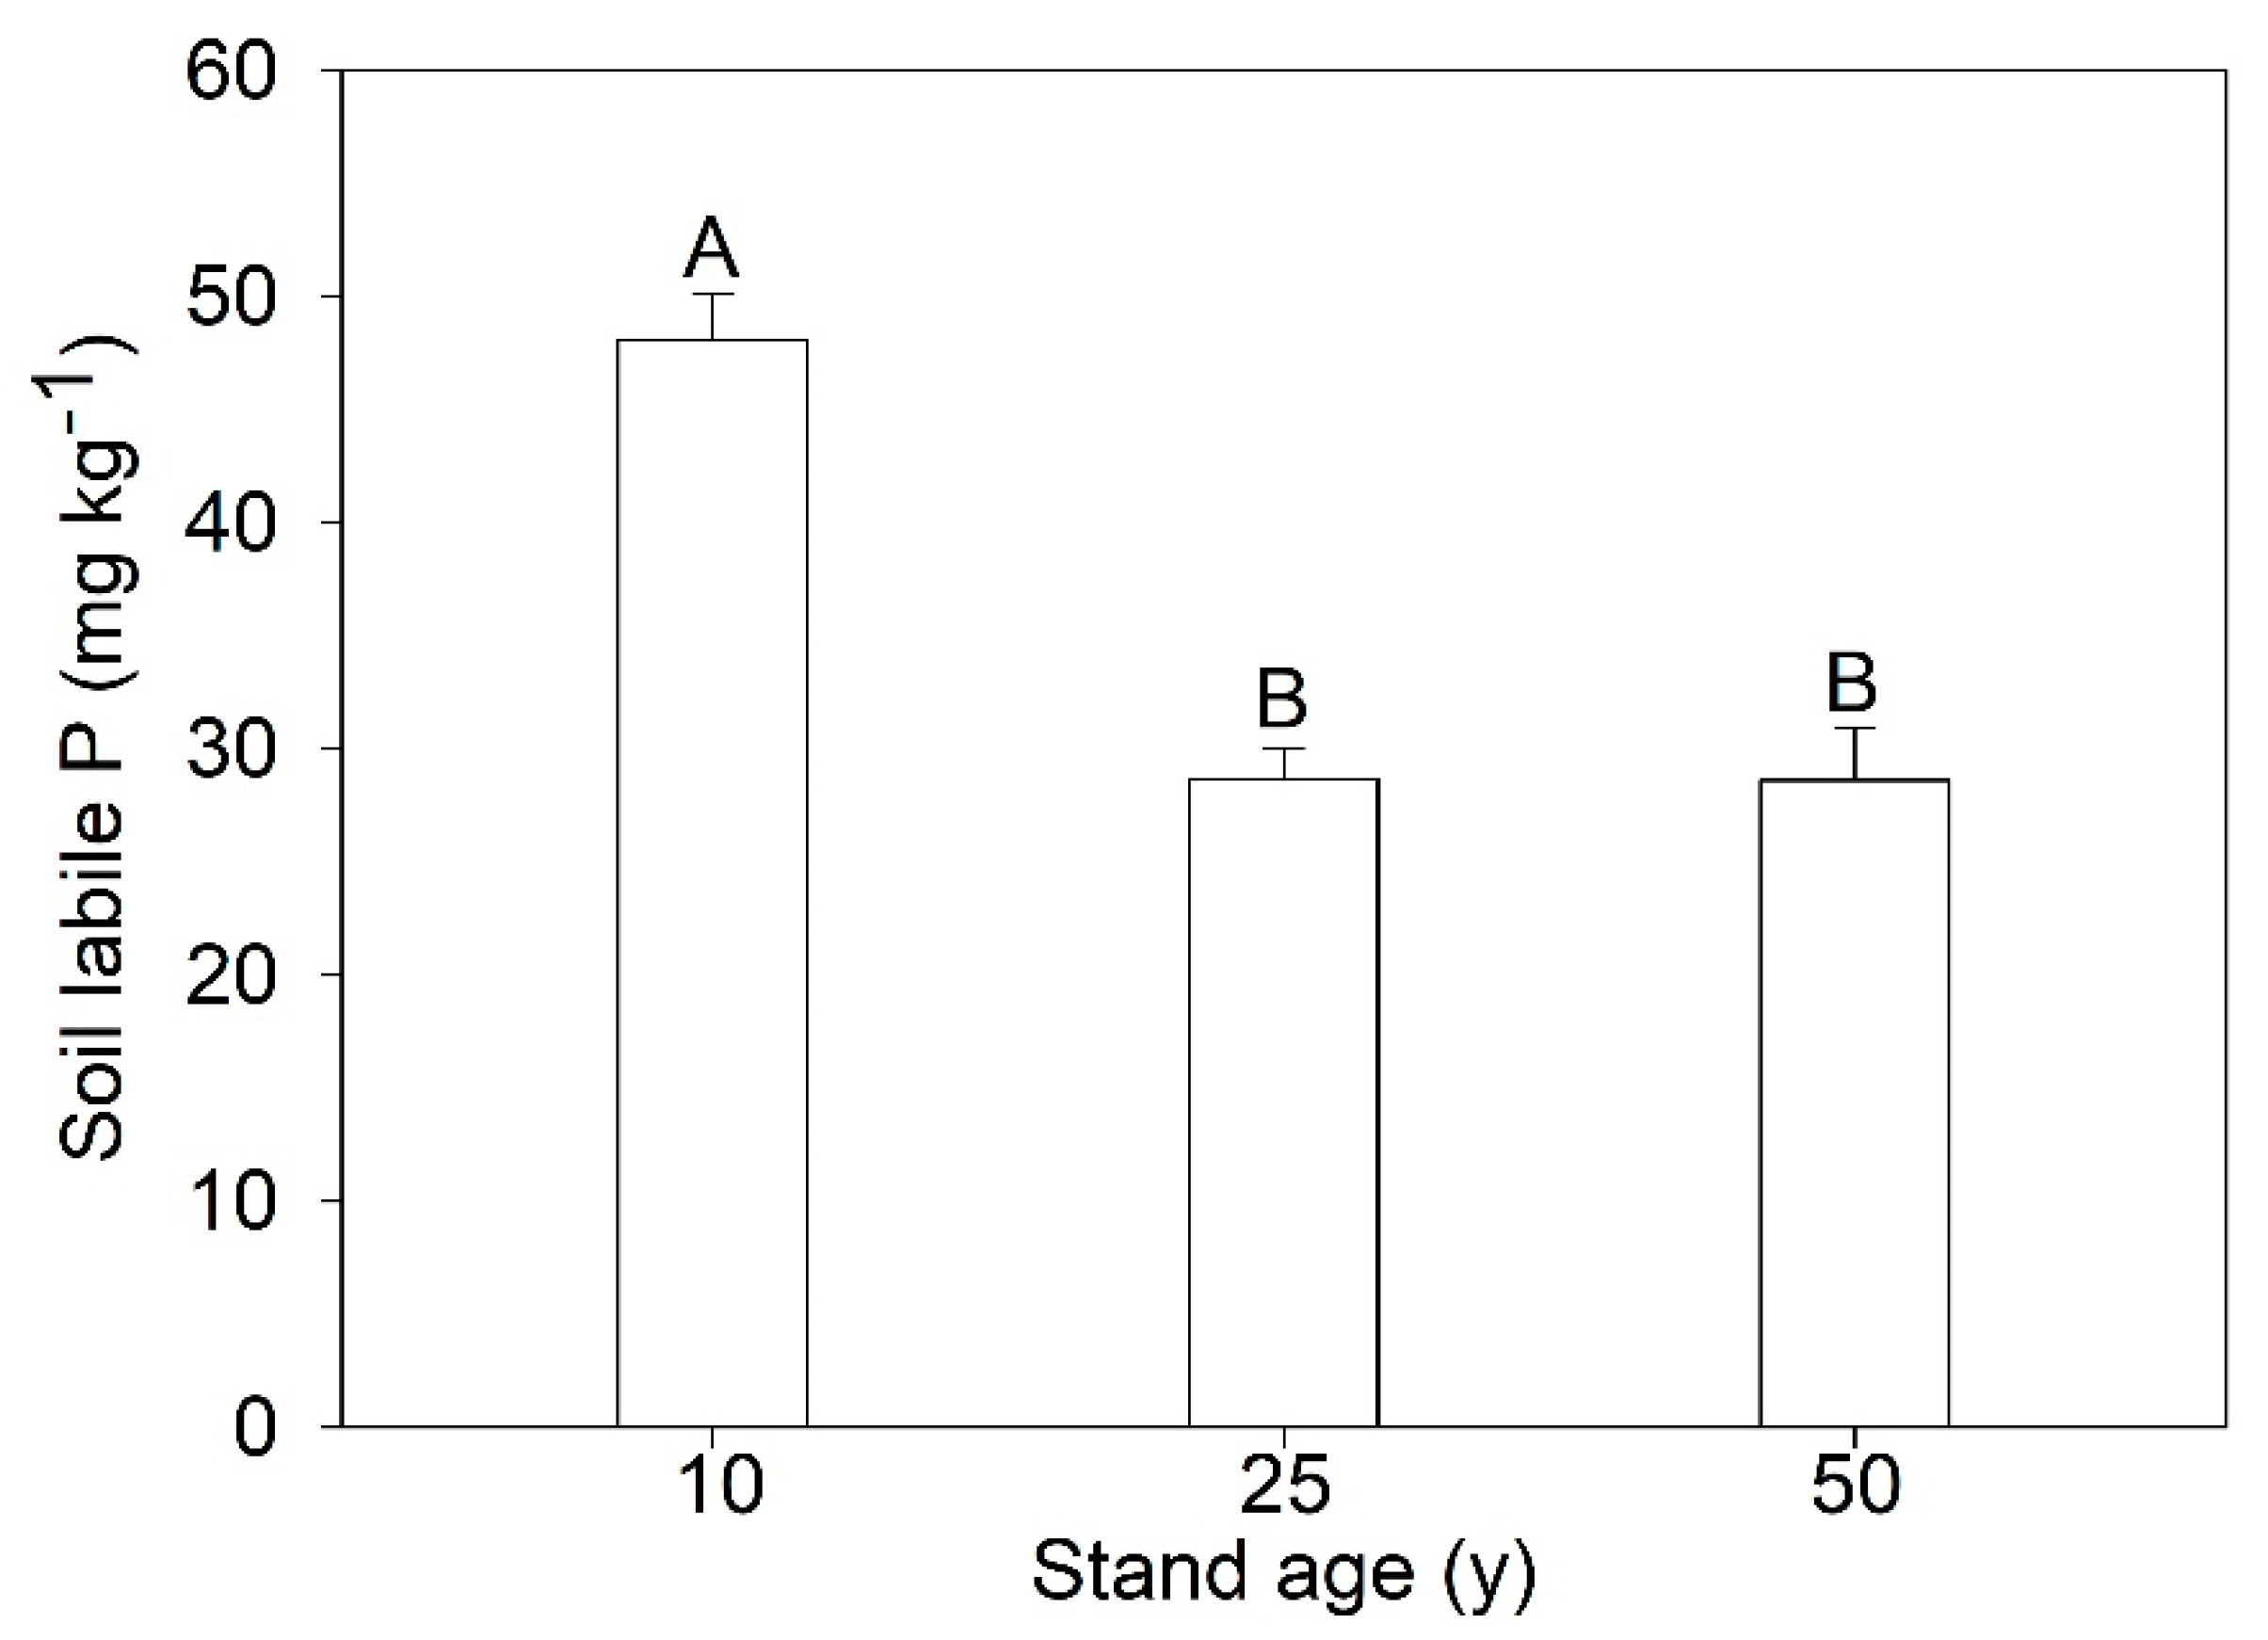
3.3. Stock of Soil Labile P and Larch P

The stock of soil labile P at 0–20cm was obtained as: soil labile P stock (kg ha−1) = soil labile P concentration (reported in Figure 3) × soil depth × soil bulk density (reported in Table 1). P stocks in the soil labile P pool for the 10-, 25-, and 50-year-old stands were 135.61, 66.15, and 70.53 kg ha−1, respectively. The stock of larch P was obtained as: larch P stock (kg ha−1) = individual tree P accumulation (reported in Figure 1) × stand density (reported in Table 1). The stock of larch P, which increased with the stand age, varied from 15.87 kg ha−1 in the 10-year-old stand to 50.15 and 65.07 kg ha−1 in the 25- and 50-year-stands, respectively. The highest P stock in green leaves was observed in the 25-year-old stand, with a value of 11.91 kg ha−1. The P stocks in green leaves at the 10- and 50-year-old stands were 9.79 and 5.47 kg ha−1, respectively. The P stocks in senesced leaves in the 50-year-old stand was 0.93 kg ha−1, which was almost five times lower than that in the 10- and 25-year-old stands. The PRE increased with the stand age and varied from 44.60% to 83.71% (Table 5).

4. Discussion

4.1. Variations of Larch N:P Ratio, PRE, P Concentration, and P Accumulation across the Larch-Plantation Chronosequence

N:P stoichiometry is widely used as an indicator of N and P balance and sources of ecosystems [22]. The distribution of nutrient concentrations in different tree components is closely related to nutrient use strategies of trees in certain conditions [23]. In our study, the N:P ratio and P concentration in the roots increased with stand age, while the root N:P ratio and P concentration in the leaves decreased with stand age. These variations of N:P ratio and P concentration might be caused by the different nutrient use strategies at different growth stages of the trees on larch plantations. Some previous studies reported that nutrient use efficiency and retranslocation efficiency in older stands were significantly higher than those in young stands [24,25,26]. Therefore, older larches tend to decrease P concentration in leaves and resorb more P with forest development. Leaf N:P is usually considered to be a predictor to evaluate the limitation of N and P on the plant [22]. Variations in the larch N:P ratio may indicate that the growth of a larch plantation could be limited by P with the development of stands. The PRE increased with stand age, ranging from 44.60% to 83.71%. The PREs in larches are higher than in other plants. This may be due to the fact that the larch is a kind of deciuous confier that can use its high PRE to make itself less dependent on soil P supply [23,27]. Our findings are consistent with the results of Chen et al., and Yan et al. [6,7], indicating that the larch plantations in northeast China are facing increasing P limitation.
In our study, we observed that the larches increased the relative share of biomass in the remaining component (stem) and decreased the relative share of biomass in the returning components (leaf and branch) with forest development. As for underground biomass allocation, the relative share of the biomass of the roots increased from 12% in the 10-year-old stand to 14% in the 50-year-old stand. Similar findings were also observed in three woody species [28]. Some studies have reported that plants can increase root-biomass allocation and decrease leaf-biomass allocation in response to nutrient limitations [13,29]. However, there is no direct evidence in our study to prove that the different above-ground and below-ground biomass allocation may result from P limitation. The changes in biomass allocation might be mainly caused by stand age.
Our results showed that the relative share of P accumulation in the crown components (the sum of leaf and branch) decreased with stand age. Sardans and Peñuelas [30] found that the allocation of P in leaves has a closer relationship with above-ground growth. The higher portion of P accumulation in the crown components of the 10- and 25-year-old stands may be due to the allocation of more nutrients to leaves and branches in response to rapid growth [31], while the lower relative share of P accumulation in the crown components of the mature stand may result from the trees’ nutrient allocation strategies for adapting to soil-fertility conditions [13]. Our results showed the relative contribution of root P concentration and accumulation increased with stand age. Similar findings observed in pines [32] indicated that plants may increase their root allocation to strengthen P acquisition in response to P limitation.
By analyzing the variations of P accumulation in different components, we found that stems constitute less than 10% of the total P accumulation. while P content in leaves, branches, and roots accounts for more than 80% of total P accumulation. Our results may indicate that P loss could be alleviated by leaving the leaf, branch, and root components in the field when larch plantations are thinned and harvested.

4.2. Variations of Soil P Fractions across the Larch-Plantation Chronosequence

In our study, the content of soil labile P was significantly lower in the 25- and 50-year-old stands than that in the 10-year-old stand, while there was no significant difference between the 25- and 50-year-old stands. A possible explanation for the decline of soil labile P in the 25-year-old stand is an improper-harvesting scenario. The whole-tree thinning and harvesting method for larch plantations around the age of 25 years is common in northeast China and can cause a large loss of the amounts of soil nutrients and the depletion of soil P [4]. The variations of soil labile P in the 25- and 50-year-old stand may be the result of increased PRE. According to our results, the PRE in the 50-year-old stand is much higher than that in the 25-year-old stand, indicating that older larches could reduce their dependence on soil P supply. The variations of soil Resin-Pi, NaHCO3-Pi, and NaHCO3-Po fractions during forest development may result from differences in behavior, mobility, and availability [33]. Among these labile P fractions, Resin-P can be absorbed directly by the plant, and NaHCO3-Pi can adhere to the solid phase and become the available P for the plant when the concentration of Resin-P decreases [34]. Some of the moderately stable P pool (especially NaOH-P) can also contribute to the labile P pool under certain conditions [35,36]. In our study, we observed a decrease of NaOH-Po and an increase of NaOH-Pi in the 25-year-old stand. Similar findings were observed in the Luquillo experimental forest [37]. The content variation of NaOH-Po with stand age may be due to the mineralization. The mineralization of organic P forms plays an important role in supplying P nutrients under P deficiency [36]. Although we do not have direct evidence that larches have used the stable P forms in the old stand, the increase of the soil inorganic P fractions and decrease of soil organic P fractions in the 25-year-old stand may help support the increase in mineralization of organic P. In our study, residual P accounted for the largest fraction of the soil total P in each age-class stand, and decreased in the order of 10- > 50- > 25-year-old stand. Higher residual P contents in the youngest plantation (10 years) may be the result of the remainder of the harvest and removal from the prior secondary forest. Our results are in agreement with Walker and Syers’ findings, which indicated that soil P is dominated by organic P and occluded P in the late stages of soil development [38].

4.3. Stock of Larch P and Soil Labile P

Soil labile P is considered to be the pool of P most likely to contribute to plant-available P. By measuring the stock of labile P and larch P for the 10–50-year-old stands, we found that the decline of labile P stock is about the same as the increase of larch P stock. This implies that there might be a close balance between the uptake of P from the soil and the increase in P in the biomass. In our study, the stock of larch P increased in the order 10- > 25- > 50-year-old stands, while the stock of soil labile P decreased in the order 10- > 50- > 25-year-old stands. The difference of larch P stock and soil labile P stock with stand age may be caused by the following reasons. First, the peak of larch growth occurs between 10- and 25-years and needs large amounts of P to maintain the plants’ rapid growth [39]. Soil labile P is considered to be the pool of P most likely to contribute to the plant-available P [37]. Therefore, the increase of larch P stock and the decline of soil labile P stock mainly occur between the 10- and 25-year-old stands. Second, nutrient resorption is one of the most important nutrient use strategies of plants [23,39,40]. In our study, the highest PRE was observed in the 50-year-old stand, and was around two times higher than that in the 10-year-old stand. Therefore, the 50-year-old stand could resorb more nutrients from senescing leaves and reduce its dependence on the soil labile P supply. Third, the primary source of P was from rock weathering, which occurs at an extremely slow rate [38]. Thus, P recovery could be very difficult when P output exceeds P input for the ecosystem, especially for those in an infertile environment.

5. Conclusions

Leaf N:P ratio increased with stand age, and the content of soil labile P of larch plantations decreased with stand age. This might indicate that larch plantations in northeast China are facing increasing P limitation and the availability of soil P has decreased with the development of larch plantations. Decreased P concentration and the relative share of P accumulation in the leaves, increased P concentration and the relative proportion of P accumulation in the roots, and increased PRE across the chronosequence indicate that larches might improve their use efficiency of P in response to increasingly acute P limitation in older stands. We should pay attention to increasing P limitation across the larch-plantation chronosequence in order to maintain the sustainable development of larch plantations. Nevertheless, the change of P in soil–plant systems is a multifactor effect that depends on soil properties, rhizosphere, microbial activities, plant process, etc. Further research is necessary to better understand these multiple effects and interactions on the growth of larch plantations.

Author Contributions

G.C. and X.C. conceived and designed the experiment; F.Z. performed the experiment and analyzed the data; F.Z and B.H. wrote the manuscript.

Funding

This research was funded by grants from the National Natural Science Foundation of China (31470624).

Acknowledgments

We are grateful to Qingyuan Forest CERN, Chinese Academy of Sciences for providing the experimental sites and relevant support. We thank T.Y. and W.J. for the help with field measurements.

Conflicts of Interest

The authors declare no conflict of interest.

References

  1. Zhu, J.J.; Liu, Z.G.; Wang, H.X.; Yan, Q.L.; Fang, H.Y.; Hu, L.L.; Yu, L.Z. Effects of site preparation on emergence and early establishment of Laix olgensis in montane regions of northeast China. New For. 2008, 36, 247–260. [Google Scholar] [CrossRef]
  2. Yang, K.; Zhu, J.J.; Yan, Q.L.; Sun, J.O. Changes in soil P chemistry as affected by conversion of nature secondary forests to larch plantations. For. Ecol. Manag. 2010, 260, 422–428. [Google Scholar] [CrossRef]
  3. Yang, K.; Shi, W.; Zhu, J.J. The impact of secondary forests conversion into larch plantations on soil chemical and microbiological properties. Plant Soil 2013, 368, 535–546. [Google Scholar] [CrossRef]
  4. Yan, T.; Zhu, J.J.; Yang, K.; Yu, L.Z.; Zhang, J.X. Nutrient removal under different harvesting scenarios for larch plantations in northeast China: Implications for nutrient conservation and management. For. Ecol. Manag. 2017, 400, 150–158. [Google Scholar] [CrossRef]
  5. Zheng, X.F.; Yuan, J.; Zhang, T.; Hao, F.; Jose, S.; Zhang, S.X. Soil Degradation and the decline of available nitrogen and phosphorus in soils of the main forest types in the Qinling Mountains of China. Forests 2017, 8, 460. [Google Scholar] [CrossRef]
  6. Chen, L.X.; Zhang, C.; Duan, W.B. Temporal variations in phosphorus fractions and phosphatase activities in rhizosphere and bulk soil during the development of Larix olgensis plantations. J. Plant Nutr. Soil Sci. 2016, 179, 67–77. [Google Scholar] [CrossRef]
  7. Yan, T.; Lü, X.T.; Zhu, J.J.; Yang, K.; Yu, L.Z.; Gao, T. Changes in nitrogen and phosphorus cycling suggest a transition to phosphorus limitation with the stand development of larch plantations. Plant Soil 2018, 422, 385–396. [Google Scholar] [CrossRef]
  8. Slazak, A.; Freese, D.; Matos, E.S.; Hüttl, R.F. Soil organic phosphorus fraction in pine-oak forest stands in Northeastern Germany. Geoderma 2010, 158, 156–162. [Google Scholar] [CrossRef]
  9. Galván-Tejada, N.C.; Peña-Ramírez, V.; Mora-Palomino, L.; Siebe, C. Soil P fractions in a volcanic soil chronosequence of Central Mexico and their relationship to foliar P in pine trees. J. Plant Nutr. Soil Sci. 2014, 177, 792–802. [Google Scholar] [CrossRef]
  10. Shiau, Y.J.; Pai, C.W.; Tsai, J.W.; Liu, W.C.; Yam, R.W.; Chang, S.C.; Tang, S.L.; Chiu, C.Y. Characterization of Phosphorus in a Toposequence of Subtropical Perhumid Forest Soils Facing a Subalpine Lake. Forests 2018, 9, 294. [Google Scholar] [CrossRef]
  11. Hedley, M.J.; Stewart, W.B.; Chauhan, B.S. Changes in inorganic and organic soil phosphorus fractions induced by cultivation practices and by laboratory incubations. Soil Sci. 1982, 46, 970–976. [Google Scholar] [CrossRef]
  12. Cross, A.F.; Schesinger, W.H. A literature review and evaluation of the Hedley fractionation: Applications to the biogeochemical cycle of soil phosphorus in natural ecosystems. Geoderma 1995, 64, 197–214. [Google Scholar] [CrossRef]
  13. Zhang, K.; Su, Y.Z.; Yang, R. Biomass and nutrient allocation strategies in a desert ecosystem in the Hexi Corridor, northwest China. J. Plant Res. 2017, 130, 699–708. [Google Scholar] [CrossRef] [PubMed]
  14. Müller, I.; Schmid, B.; Weiner, J. The effect of nutrient availability on biomass allocation patterns in 27 species of herbaceous plants. Perspect. Plant Ecol. Evol. Syst. 2000, 3, 115–127. [Google Scholar] [CrossRef]
  15. Glynn, C.; Herms, D.A.; Egawa, M.; Hansen, R.; Mattson, W.J. Effects of nutrient availability on biomass allocation as well as constitutive and rapid induced herbivore resistance in poplar. Oikios 2003, 101, 385–397. [Google Scholar] [CrossRef]
  16. Bargaza, A.; Noyceb, G.L.; Fulthorpeb, R.; Carlssona, G.; Furzeb, J.R.; Jensena, E.S.; Dhiba, D.; Isaacb, M.E. Species interactions enhance root allocation, microbial diversity and P acquisition in intercropped wheat and soybean under P deficiency. Appl. Soil Ecol. 2017, 120, 179–188. [Google Scholar] [CrossRef]
  17. Yang, K.; Zhu, J.J. The effects of N and P additions on soil microbial properties in paired stands of temperate secondary forests and adjacent larch plantations in Northeast China. Soil Biol. Biochem. 2015, 90, 80–86. [Google Scholar] [CrossRef]
  18. Vergutz, L.; Manzoni, S.; Porporato, A.; Novais, R.F.; Jackson, R.B. Global resorption efficiencies and concentrations of carbon and nutrients in leaves of terrestrial plants. Ecol. Monogr. 2012, 82, 205–220. [Google Scholar] [CrossRef] [Green Version]
  19. Murphy, J.; Riley, J.P. A modified single solution method for determination of phosphate in natural waters. Anal. Chim. Acta 1962, 27, 31–36. [Google Scholar] [CrossRef]
  20. Tiessen, H.; Moir, J.O. Characterization of available P by sequential extraction. In Oil Sampling and Methods of Analysis, 2nd ed.; Carter, M., Gregorich, E.G., Eds.; CRC Press: Boca Raton, FL, USA, 2008; pp. 293–305. ISBN 9781420005271. [Google Scholar]
  21. Ohno, T.; Zibilske, L.M. Determination of low concentrations of phosphorus in soil extracts using malachite green. Soil Sci. Soc. Am. J. 1991, 46, 892–895. [Google Scholar] [CrossRef]
  22. Koerselman, W.; Meuleman, A.F.M. The vegetation N:P a new tool to detect the nature of nutrient limitation. J. Appl. Ecol. 1996, 33, 1441–1450. [Google Scholar] [CrossRef]
  23. Kobe, R.K.; Lepczyk, C.A.; Iyer, M. Resorption efficiency decreases with increasing green leaf nutrients in a global data set. Ecology 2005, 86, 2780–2792. [Google Scholar] [CrossRef]
  24. Gholz, R.F.; Fisher, R.F.; Prichett, W.L. Nutrient Dynamics in Slash Pine Plantation Ecosystems. Ecology 1986, 66, 647–659. [Google Scholar] [CrossRef]
  25. Hayes, P.; Turner, B.L.; Lambers, H.; Laliberté, E. Foliar nutrient concentrations and resorption efficiency in plants of contrasting nutrient-acquisition strategies along a 2-million-yeardune chronosequence. J. Ecol. 2014, 102, 396–410. [Google Scholar] [CrossRef]
  26. Viera, M.; Schumacher, M.V.; Bonacina, D.M.; Ramos, L.O.O.; Rodríguez-Soalleiro, R. Biomass and nutrient allocation to aboveground components in fertilized Eucalyptus saligna and E. urograndis plantations. New For. 2017, 48, 445–462. [Google Scholar] [CrossRef]
  27. Carlyle, J.C.; Malcom, D.C. Larch litter and nitrogen availability in mixed larch spruce stands. 1. Nutrient withdrawal, redistribution, and leaching loss from larch foliage at senescence. Can. J. For. Res. 1986, 16, 321–326. [Google Scholar] [CrossRef]
  28. Kramer-Walter, K.R.W.; Laughlin, D.C. Root nutrient concentration and biomass allocation are more plastic than morphological traits in response to nutrient limitation. Plant Soil 2017, 416, 539–550. [Google Scholar] [CrossRef]
  29. Wu, P.F.; Wang, G.Y.; Farooq, T.H.; Li, Q.; Zou, X.H. Low phosphorus and competition affect Chinese fir cutting growth and root organic acid content: Does neighboring root activity aggravate P nutrient deficiency? J. Soils Sediments 2017, 17, 2775–2785. [Google Scholar] [CrossRef]
  30. Sardans, J.; Peñuelas, J. Tree growth changes with climate and forest type are associated with relative allocation of nutrients, especially phosphorus, to leaves and wood. Glob. Ecol. Biogeogr. 2013, 22, 494–507. [Google Scholar] [CrossRef]
  31. Ewe, S.M.L.; Sternberg, L.S.L. Growth and gas exchange response of Brazilian pepper (Schinus terebinthifolius) and native South Florida species to salinity. Trees 2005, 19, 119–128. [Google Scholar] [CrossRef]
  32. Peichl, M.; Arain, M.A. Above- and belowground ecosystem biomass and carbon pools in an age-sequence of temperate pine plantation forests. Agric. For. Meteorol. 2006, 140, 51–63. [Google Scholar] [CrossRef]
  33. Hansen, J.C.; Cade-Menun, B.J.; Strawn, D.G. Phosphorus speciation in manure-amended alkaline soils. J. Environ. Qual. 2004, 33, 1521–1527. [Google Scholar] [CrossRef] [PubMed]
  34. Frossard, E.; Condron, L.M.; Oberson, A.; Sinaj, S.; Fardeau, J.C. Processes governing phosphorus availability in temperate soils. J. Environ. Qual. 2000, 29, 15–23. [Google Scholar] [CrossRef]
  35. Cumming, J.R.; Weinstein, L.H. Utilization of AlPO4 as a phosphorus source by ectomycorrhizal Pinus rigida Mill. seedlings. New Phytol. 1990, 116, 99–106. [Google Scholar] [CrossRef]
  36. Turner, B.L.; Condron, L.M.; Richardson, S.J.; Peltzer, D.A.; Allison, V.J. Soil organic phosphorus transformations during pedogenesis. Ecosystems 2007, 10, 1166–1181. [Google Scholar] [CrossRef]
  37. Frizano, J.; Johnson, A.H.; Vann, D.R.; Scatena, F.N. Soil phosphorus fractionation during forest development on landslide scars in the Luquillo Mountains, Puerto Rico. Biotropica 2002, 34, 17–26. [Google Scholar] [CrossRef]
  38. Walker, T.W.; Syers, J.K. The fate of phosphorus during pedogenesis. Geoderma 1976, 15, 1–19. [Google Scholar] [CrossRef]
  39. Aerts, R. Nutrient resorption from senescing leaves of perennials: Are there general patterns? J. Ecol. 1996, 84, 597–608. [Google Scholar] [CrossRef]
  40. Brant, A.N.; Chen, H.Y.H. Patterns and mechanisms of nutrient resorption in plants. Crit. Rev. Plant Sci. 2015, 34, 471–486. [Google Scholar] [CrossRef]
Figure 1. Individual P accumulation of each tree component for different stand ages in larch plantations.
Forests 09 00563 g001
Figure 2. Distribution of soil P fractions for different stand ages on larch plantations. NaHCO3-P is the sum of NaHCO3-Pi and NaHCO3-Po. NaOH-P is the sum of NaOH-Pi and NaOH-Po.
Forests 09 00563 g002
Figure 3. Variations in the concentration of soil labile P (the sum of Resin-P, NaHCO3-Pi, and NaHCO3-Po) with stand age on larch plantation. Thick bars represent the means and thin bars represent standard errors for n = 3. Different letters indicate group with significant differences for p < 0.05.
Forests 09 00563 g003
Table 1. Summary of stand properties of the three age classes of larch plantations.
Stand PropertiesStand Age (Years)
102550
Elevation (m)525 (3)620 (3)650 (5)
Slope (°)13 (0.7)15 (0.9)17 (0.6)
Density (trees ha−1)3688 (320)1966 (220)960 (130)
DBH (cm)6.15 (0.1)15.25 (0.2)25.08 (0.4)
Tree height (m)7.20 (0.3)18.24 (0.1)24.38 (0.6)
Soil typeTypical brown forest soilTypical brown forest soilTypical brown forest soil
Soil bulk density (g cm−3)1.41 (0.05)1.13 (0.07)1.23 (0.06)
SOC (%)2.57 (0.24)3.00 (0.09)3.14 (0.39)
Soil total Fe (%)2.47 (0.13)2.88 (0.11)2.32 (0.07)
Soil total Al (%)6.33 (0.56)6.34 (0.31)5.98 (0.54)
Soil pH5.98 (0.09)5.79 (0.11)5.84 (0.06)
Values in the table are the means (standard errors) of the 3 plots per stand n = 3. DBH: diameter at breast height; SOC: soil organic carbon.
Table 2. P concentrations and N:P ratio in different larch-plantation components.
Tree ComponentPhosphorus (P) Concentration (g kg−1)
10-Year-Old25-Year-Old50-Year-Old
Green leaf1.8 (0.04) A1.6 (0.02) B1.0 (0.01) C
Root0.3 (0.01) B0.3 (0.01) B0.5 (0.01) A
Bark0.2 (0.02) A0.2 (0.01) A0.2 (0.03) A
Branch0.5 (0.02) C0.8 (0.01) A0.7 (0.05) B
Stem0.1 (0.01) A0.1 (0.01) A0.1 (0.01) A
Senesced leaf1.3 (0.02) A0.9 (0.01) B0.2 (0.01) C
N:P Ratio
Green Leaf13.9 (0.22) C15.4 (0.56) B18.8 (0.42) A
Root23.3 (0.32) A15.8 (0.40) B11.0 (0.58) C
Bark12.5 (0.24) A12.9 (0.12) A12.7 (0.36) A
Branch7.5 (0.47) A4.8 (0.36) C6.1 (0.67) B
Stem18.2 (0.46) A20.0 (0.84) A18.8 (0.64) A
Senesced leaf6.3 (0.21) A8.1 (0.34) B32.6 (1.21) C
Values in the table are the means (standard errors) of the three plots per stand n = 3. The different letters indicate groups with significant differences between different stand ages in each tree component (p < 0.05).
Table 3. Biomass of each tree component for different stand ages in larch plantations.
Tree ComponentBiomass (kg tree−1)
10-Year-Old25-Year-Old50-Year-Old
Leaf1.503.865.87
Root1.6913.8452.77
Bark2.0021.4733.23
Branch0.7610.8535.80
Stem3.6769.77244.71
Total tree9.62119.79372.38
The total tree values were obtained as the sum of all components.
Table 4. Variations of soil P fractions for different age classes of larch plantations.
Stand Age
(years)
Resin-P
(mg kg−1)
NaHCO3-P
(mg kg−1)
NaOH-P
(mg kg−1)
HCl-P
(mg kg−1)
Residual-P
(mg kg−1)
NaHCO3-PiNaHCO3-PoNaOH-PiNaOH-Po
104.319.824.029.3125.847.2153.4
(0.06) A(0.23) A(1.88) A(0.65) B(3.97) A(0.82) A(7.27) A
253.711.813.734.952.127.7108.9
(0.18) B(0.81) B(1.35) B(1.43) A(6.33) C(0.45) B(5.45) B
501.95.221.514.974.314.4145.1
(0.08) C(0.30) C(1.21) A(1.52) C(8.38) B(0.67) C(5.90) A
Values in the table are the means (standard errors) of the three plots per stand n = 3. Pi: inorganic P; Po: organic P. Different letters indicate groups with significant differences between different stand ages in each soil P fraction (p < 0.05).
Table 5. The stock of soil labile P and larch P.
Stand Age
(years)
Soil Labile P Stock
(kg ha−1)
Larch P Stock
(kg ha−1)
Green Leaf P Stock
(kg ha−1)
Senesced Leaf P Stock
(kg ha−1)
PRE
(%)
10135.6115.879.795.4244.60
2566.1550.1511.915.0158.01
5070.5365.075.470.9383.71
The soil labile P stock is the sum of the soil Resin-P, soil NaHCO3-Pi, and soil NaHCO3-Po stocks in 0–20 cm soil. PRE: P resorption efficiency.

