Article

Effects of Hardwood Content on Balsam Fir Defoliation during the Building Phase of a Spruce Budworm Outbreak

1
Faculty of Forestry and Environmental Management, University of New Brunswick, P.O. Box 4400, Fredericton, NB E3B 5A3, Canada
2
Natural Resources Canada, Canadian Forest Service-Atlantic Forestry Centre, P.O. Box 4000, Fredericton, NB E3B 5P7, Canada
*
Author to whom correspondence should be addressed.
Forests 2018, 9(9), 530; https://doi.org/10.3390/f9090530
Submission received: 25 July 2018 / Revised: 22 August 2018 / Accepted: 30 August 2018 / Published: 31 August 2018
(This article belongs to the Special Issue Protection Strategy against Spruce Budworm)

Abstract

:
Defoliation by spruce budworm (Choristoneura fumiferana Clem.) on balsam fir (Abies balsamea (L.) Mill.) is more severe in fir than in mixed fir-hardwood stands. Previous studies assumed that defoliation in fir-hardwood stands was reduced in proportion to percent hardwood regardless of outbreak severity. We tested the influence of stand composition on defoliation during the first 5 years of a spruce budworm outbreak near Amqui, Quebec, by sampling 27 fir-hardwood plots selected to represent three percent hardwood basal area classes (0%–25%, 40%–65%, and 75%–95%). Balsam fir defoliation was significantly lower (p < 0.001) as hardwood content increased, but the relationship varied with overall defoliation severity each year. Annual plot defoliation in fir-hardwood plots, estimated using: (1) defoliation in pure fir plots and the assumption that defoliation in fir-hardwood plots was reduced in proportion to percent hardwood; (2) a generalized linear mixed-effects model with defoliation in pure fir plots, percent hardwood, and interaction as fixed-effects; and (3) Random Forests prediction incorporating 11 predictor variables, resulted in r = 0.77, 0.87, and 0.92 versus measured defoliation, respectively. Average defoliation severity in softwood plots and percent hardwood content were the most important variables in Random Forests analysis. Data on average defoliation level in softwood stands, as an indicator of overall outbreak severity, improves prediction of balsam fir defoliation in mixed stands.

1. Introduction

Effective forest pest management in heterogeneous landscapes and in mixed-species forest stands requires knowledge about how tree diversity affects insect herbivory. A meta-analysis of a worldwide data set of 119 studies by Jactel and Brockerhoff [1] showed a significant reduction in herbivory with increasing forest diversity for oligophagous insects (i.e., species that exploit one or a few closely related genera of hosts). This seems also to be the case for spruce budworm (Choristoneura fumiferana Clem.), which is the major defoliator of balsam fir (Abies balsamea (L.) Mill.) and spruce (Picea spp.) in boreal and New England-Acadian forests in eastern North America [2,3,4]. Budworm outbreaks are cyclical and have occurred at 30–40-year intervals in eastern Canada during the past century [5,6]. Outbreaks usually last 5–15 years and severe defoliation causes growth loss and tree mortality over large areas [7,8], peaking at over 52 million ha of defoliation of forests in eastern Canada [9]. Spruce budworm defoliation can be assessed by conducing aerial survey, ground assessment with binoculars, and branch sampling with pole pruners, of which branch sampling with pole pruners and rating defoliation on individual shoots is considered to be the most accurate technique [10,11,12].
Several studies have reported lower spruce budworm-caused defoliation of balsam fir, and lower resulting growth reduction and mortality, in stands or forest landscapes associated with higher percentage of hardwood tree species [13,14,15,16]. Mature stands with a large proportion of balsam fir, especially in contiguous softwood landscapes, have the highest susceptibility and vulnerability to spruce budworm outbreaks [17,18]. Balsam fir defoliation assessed using the branch sampling method was 12%‒32% in fir-hardwood stands with >40% hardwood content versus 58%‒71% in stands with <40% hardwood content [15]. Tree-ring analysis showed that budworm-caused growth reductions averaged 40% in stands with <50% hardwood content versus 20% in stands with >50% hardwood content [16]. Mortality of balsam fir resulting from budworm-caused defoliation was 14%–30% less in fir-hardwood mixed stands (~30% hardwood content) than in fir-dominated stands [13,14].
Two hypotheses have been proposed to explain less severe insect herbivory associated with higher tree diversity. The “natural enemy” hypothesis [19] argues that more diverse plant communities support more abundant natural enemies of herbivore insects by providing alternative prey, more predation opportunities, or better sheltering conditions [20,21,22]. Alternatively, the “habitat fragmentation” hypothesis argues that reduced host tree availability increases the degree of habitat fragmentation for the insects and creates barriers for foraging, dispersal, and mating success [23,24,25].
Past studies of how hardwood content influences spruce budworm defoliation have all focused on severely defoliated stands at the peak and declining phases of outbreaks. Su et al. [15] reported that defoliation of balsam fir decreased as hardwood content increased in the declining phase (last 5 years) of the last outbreak, but also noted that the relationship between defoliation and hardwood content may well vary during different stages of outbreak. Information is lacking on the building phase of an outbreak, as budworm populations increase from low to peak density.
Su et al. [15] also proposed a direct linear relationship for use in predicting defoliation in fir-hardwood stands, using percent hardwood and defoliation in a pure fir stand. The relationship can be expressed succinctly as y = D0 × (1 − x) (which we term the simplified linear model), where fir defoliation in a mixedwood stand (y) is a function of percent hardwood (x) and fir defoliation level in a pure fir stand (D0). The relationship was quantified using defoliation data collected in the declining years (1989–1993) of the last outbreak and were subsequently used in Needham et al. [26] and Sainte-Marie et al. [27]. In this study, we examine whether this relationship holds true in the building phase of an outbreak.
Insect herbivory is influenced by other variables in addition to tree diversity. For example, Douglas-fir tussock moth (Orgyia pseudotsugata McDunnough) defoliation varied with slope, stand density, and site index [28]. Scots pine (Pinus sylvestris L.) defoliation during common pine sawfly (Diprion pini L.) outbreaks was correlated with forest site class [29]. Studies conducted in the declining phase of the last spruce budworm outbreak suggested that hardwood content was significant in predicting defoliation [30,31], but other factors can include outbreak stage and severity, soil drainage, and site conditions [30,32]. In the above mentioned simplified linear model, percent hardwood was used as a variable and defoliation in pure fir stand was used as a constant for predicting defoliation in mixedwood stand in a given year. In this study, we also test whether adding other biotic and abiotic variables improve the accuracy of defoliation prediction.
The objectives of this study were to: (1) determine the relationship between balsam fir defoliation and hardwood content during the initiation and building phases (first 5 years) of a spruce budworm outbreak and (2) compare accuracy of predictions of spruce budworm defoliation in fir-hardwood stands based on three alternative model formulations: the simplified linear model; a generalized linear model with mixed-effects; and a machine learning (Random Forests) formulation. We evaluated two predictions: (1) fir-hardwood stands with higher hardwood content will have less severe annual defoliation of balsam fir and (2) the simplified linear model can be used to estimate budworm defoliation in fir-hardwood mixed stands if other predictor variables are not available, but incorporating more variables will improve the accuracy of predictions.

2. Materials and Methods

2.1. Study Area and Stand Sampling

Study sites were located on the north side of Lake Matapédia in the Gaspé area, Quebec (48°32′ N‒48°35′ N, 67°25′ W‒67°34′ W) (Figure 1). The area is within forest section L6, Témiscouata-Restigouche, in the Great Lakes-St. Lawrence forest region [33]. Aerial survey of spruce budworm defoliation conducted by the Quebec provincial government since 2010 indicated that defoliation was first detected in the study area in 2012 [34]. Defoliation was classified by aerial observers using a three-level scale: light, moderate, and severe. Most of the study area was classified as light or light-moderate defoliation in 2012 and 2013, and as severe or moderate-severe defoliation in 2014 and 2015. Defoliation from the aerial survey declined to light or light-moderate in 2016 [35].
Given that previous studies suggested that less severe defoliation would be observed in fir-hardwood stands with >40%–50% hardwood during a spruce budworm outbreak [15,16,26], mature (age >40 years) fir-hardwood stands were selected within three percent basal area of hardwood content classes: 0%–25% (termed softwood), 40%–65% (mixedwood), and 75%–95% (hardwood) (Figure 1). Nine 12.6 m radius circular (0.05 ha) sample plots were established, at least 50 m apart and away from stand edges within each of the three classes. Within each plot, all trees with diameter at breast height (DBH, 1.3 m above ground) >4 cm were numbered, and DBH and total height were measured. Elevation, slope, tree density, dominant ground vegetation, and GPS coordinates of plot center were recorded. All sample plots were established in spring 2014 except plots 13a, 14a, and 15a, which were established in 2015 to replace the corresponding original plots that were harvested during winter 2014, in an area with similar stand and defoliation conditions. Therefore, defoliation from 2012 to 2014 was collected in plot 13, 14, and 15 whereas defoliation for 2015 and 2016 was collected in plot 13a, 14a, and 15a.
Balsam fir was the dominant softwood species in all 27 plots, ranging from 64%–95% of the basal area in softwood plots, 20%–57% in mixedwood, and 5%–24% in hardwood (Table 1). White spruce (Picea glauca (Moench) Voss) occurred in about one-half of the softwood and mixedwood plots, and in one hardwood plot, but comprised <10% of the basal area in most plots. Percent basal area of hardwoods ranged from 1% to 95%, and averaged 12%, 56%, and 88% in the softwood, mixedwood, and hardwood classes, respectively (Table 1). Sugar maple (Acer saccharum Marshall) is a late successional species that was commonly found in both hardwood and mixedwood plots but was absent in softwood plots. The most abundant hardwood species in the mixedwood plots were generally yellow birch (Betula alleghaniensis Britton), white birch (Betula papyrifera Marshall), and red maple (Acer rubrum L.). Stand density ranged from 520 to 2975 stems/ha, with an average of 1346 stems/ha. Density of softwood and mixedwood plots was approximately double that of hardwood plots. Mean DBH and height of softwood, mixedwood, and hardwood plots was 15.7, 16.3, and 19.3 cm, and 14.0, 13.6, and 15.4 m respectively. Average diameter of balsam fir always exceeded the plot mean diameter in the softwood plots, but this relationship was variable in the mixedwood and hardwood plots. All plots except three were on flat ground with <10 degrees of slope. Elevation ranged from 165 to 357 m, with an average of 261 m.

2.2. Defoliation Measurements

Current year’s defoliation was estimated on four trees per plot, one branch per tree, and 25 current-year shoots per branch after annual defoliation ceased (in August) each year from 2014 to 2016. Mean plot defoliation was computed as the averages of four trees. In each sample plot, four co-dominant balsam fir trees were randomly selected, and one mid-crown branch [36] was collected using pole pruners from each tree. Cardinal direction was not considered as it does not significantly influence spruce budworm density [37] and therefore not defoliation. Twenty-five current-year shoots per branch were randomly selected beginning at the branch tip and back along the branch length and assessed for annual defoliation using the shoot-count (Fettes) method [10]. Total number of needles of an individual shoot was visually compared to the regular pattern of needle positions (phyllotaxis) and the shoot was assigned to one of the seven defoliation classes (0%, 1%–20%, 21%–40%, 41%–60%, 61%–80%, 81%–99%, and 100%) in the field to prevent physical needle removal during transport. The mid-point of each defoliation class was used to calculate mean defoliation per branch and per plot. Required sample sizes (25 shoots per branch) were determined based on MacLean and MacKinnon [11] to achieve 90% accuracy under most defoliation levels.
In 2014, branch samples were also collected in the spring prior to current year defoliation, and used to measure the annual defoliation that occurred in 2012 and 2013. Needle losses on 2012 and 2013 foliage were deemed to be the defoliation that occurred in the corresponding years, since aerial surveys indicated that defoliation was light to light-moderate in both years and back-feeding (late instar larvae feeding on older, non-current-year age classes of foliage) only occurs when very high insect populations consume all current year foliage [38].

2.3. The Simplified Linear Model

As described in the introduction, the simplified linear model was a direct linear relationship proposed by Su et al. [15]:
y = D 0   × ( 1 x )
where percent hardwood (x) and fir defoliation in a pure fir stand (D0) were used to predict fir defoliation in fir-hardwood mixed stands (y). We used the average plot defoliation in our softwood plots (i.e., with 0%–25% hardwoods) calculated each year as D0. In Su et al. [15], intercept from simple linear regression for defoliation as a function of percent hardwood content each year were used as D0. In our data, preliminary analysis suggested that average plot defoliation in softwood plots was highly correlated (r = 0.995) with the intercepts from simple linear regressions. We chose to use the empirical average plot defoliation in softwood plots instead of the theoretical extrapolated “defoliation-with-zero-hardwood” from the statistical models, because it is based on measured data.

2.4. Analyzing the Relationship between Annual Balsam Fir Defoliation and Hardwood Content Using Generalized Linear Mixed-Effects Model

Average balsam fir defoliation at the plot level has two biological limits. At the lower end of the scale, needle loss can occur due to factors other than spruce budworm feeding. This and the lower threshold of measurement (i.e., use of 0% and 1%–20% defoliation classes, the latter with a mid-point of 10% defoliation) prevent defoliation from averaging 0% even in the absence of budworm. At the upper end, competition for food occurs among larvae, and defoliation reaches a near-100% plateau when budworm populations are extreme. Yet, average plot defoliation rarely reaches 100% because usually some needles escape complete defoliation. Hence, while a linear relationship between defoliation and hardwood content could be expected at mid-range defoliation severity levels, non-linear relationships would be expected at very light and at extreme defoliation levels. For these reasons, we analyzed defoliation through a logit link function [39] using a generalized linear mixed-effects model (GLMM):
logit ( defoliation ) = β 0 + b 0 + β 1 x + β 2 D 0 + β 3 x × D 0 ,
where logit(defoliation) is the logit link function (ln(p/(1 − p))) for defoliation in a fir-hardwood mixture; x = percent hardwood content; D0 = average plot defoliation in softwood plots (as in Equation (1)); βi’s are the fixed effects parameter estimates; and b0 is the random effects. Year as a categorical variable was not included in the model since the annual differences were already incorporated in D0. Plot was included as random effect and a serial correlation structure CorAr1 was included in the model error term to control for temporal autocorrelation. Averaged annual defoliation for each stand type was calculated and differences among the three stand types were tested using Kruskal-Wallis analysis by ranks.

2.5. The Random Forests Model

Random Forests [40], an ensemble regression tree statistical procedure, was also used to predict spruce budworm defoliation. Random Forests has been used extensively in ecological and forestry studies (e.g., [41,42,43]) and has shown advantages in dealing with small sample size [44] and complex interactions between factors [45,46]. Random Forests was developed from classification and regression trees [47]. We used the Random Forests routine in R [48] and the default of 500 trees (parameter “ntree”) was applied as error rate stabilized at 100–150 trees. A random one-third of predictor variables were used to perform data partitioning at each node (parameter “mtry”). Two-thirds of the overall dataset was randomly selected and used to build the Random Forests model, and the other one-third retained for testing the model. The importance of each predictor variable was measured as the change in prediction accuracy (increase in mean square error, function “importance”), computed by permuting (value randomly shuffled) the variable with out-of-bag data in the Random Forests validation approach [48]. A larger percent increase in mean square error indicates higher importance of a variable in prediction.
Initially, a total of 14 variables were assessed for multicollinearity using a correlation matrix: hardwood percent basal area (HW%), balsam fir percent basal area (bF%), D0, mean DBH, mean height, basal area (BA), mean DBH of bF, mean height of bF, standard deviation of bF height, mean bF crown base height, standard deviation of bF crown base height, tree density, elevation, and slope. Random Forests does not hold formal distributional assumptions of data and is relatively insensitive to multicollinearity [40], but removing multicollinearity and redundancy to improve predictive power is recommended [49,50]. Correlation analysis indicated that, HW% and bF%, mean DBH of bF and mean height of bF, and mean DBH and density were highly correlated with coefficients (r) of −0.97, 0.87, and −0.84, respectively. HW%, mean DBH of bF, and mean DBH were selected over their counterpart variables because HW% should be included as a predictor in attempts to estimate defoliation reduction caused by hardwood; and mean DBH is readily available in most forest inventories and can be quickly assessed with an efficient sampling design. Therefore, 11 variables were retained and tested using Random Forests: HW%, D0, mean DBH, mean height, mean DBH of bF, BA, standard deviation of bF height, mean bF crown base height, standard deviation of bF crown base height, elevation, and slope.

2.6. Statistical Analyses

Balsam fir defoliation was estimated using the three alternative models: (1) the simplified linear model; (2) the GLMM model; and (3) the Random Forests model. The annual plot defoliation estimated using each model was plotted against actual defoliation measured in the field. Pearson correlation analysis was used to compare the accuracy of the estimates of the three models to the measured defoliation.
All statistical analyses were performed using R software (R Foundation for Statistical Computing: Vienna, Austria) [51], with p = 0.05 used to indicate significance. Kruskal-Wallis test and Pearson correlation analysis were performed using the R “stats” package [51], GLMM model using “nlme” [52], and Random Forests using the “randomForest” [48] packages.

3. Results

3.1. Relationship between Defoliation and Hardwood Content

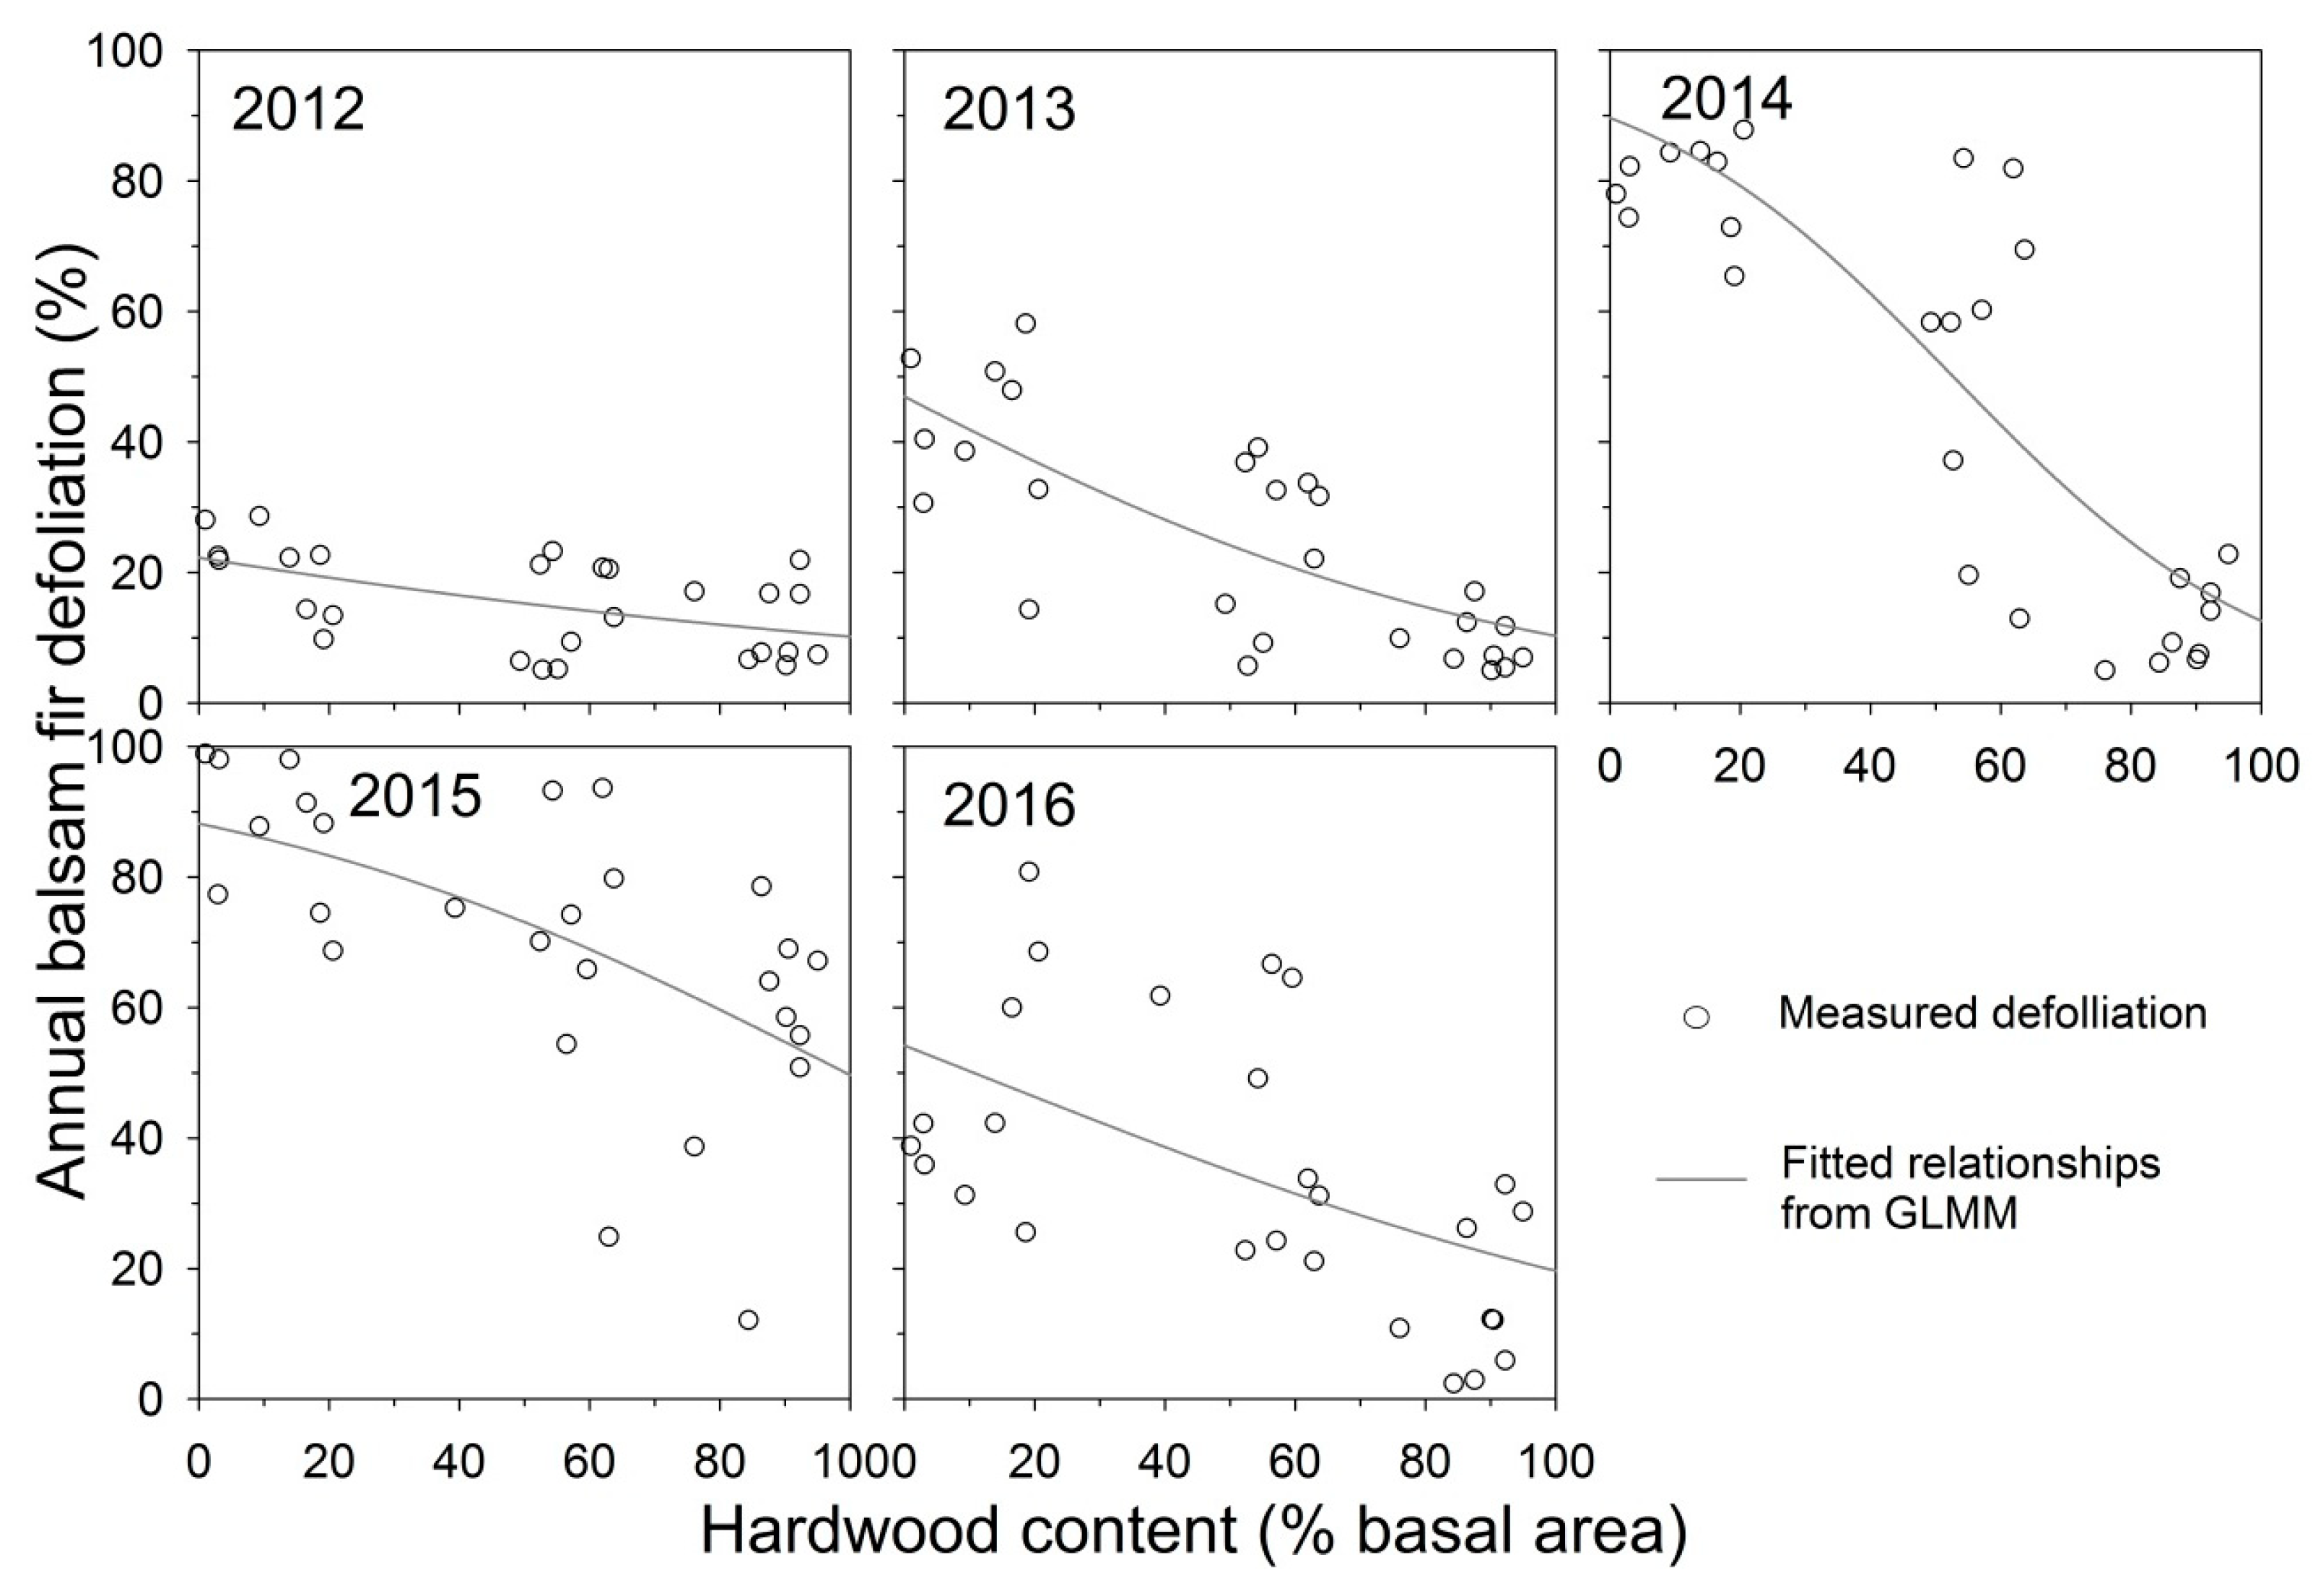
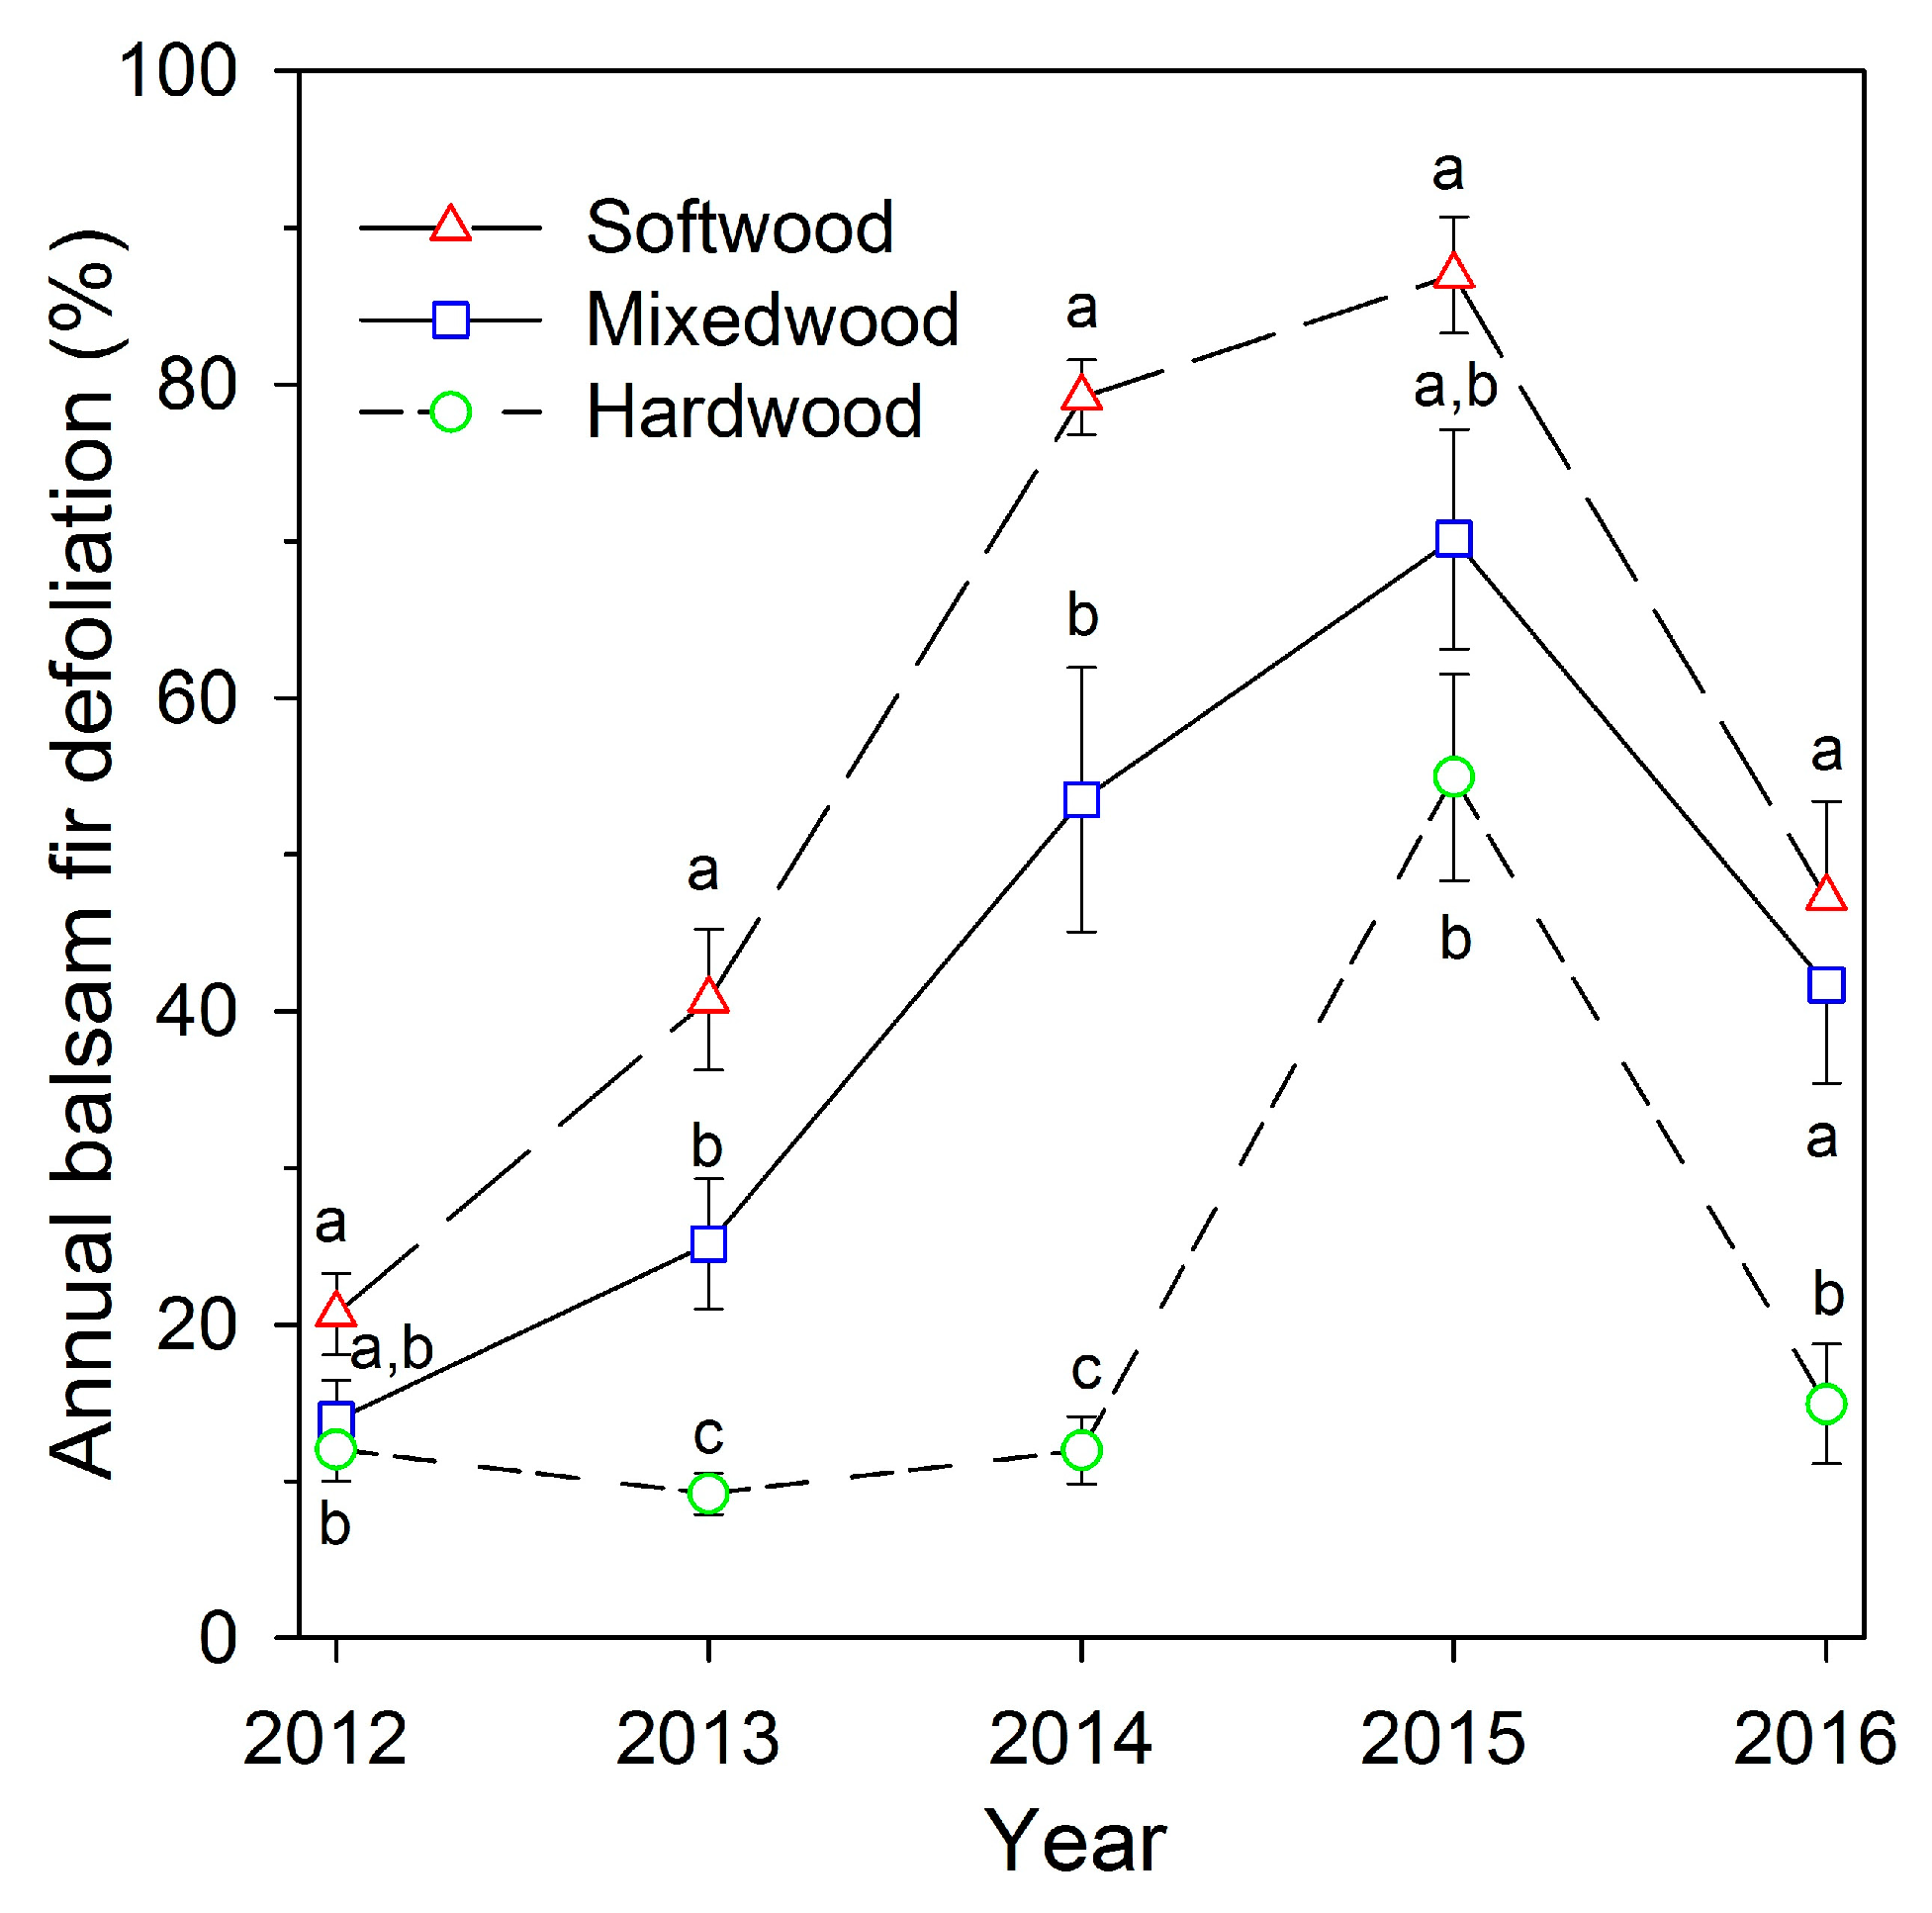
Both percent hardwood content and D0 had significant effects on balsam fir defoliation (Table 2), with a significant interaction between percent hardwood and D0, indicating that the relationship between defoliation and percent hardwood varied significantly with overall defoliation severity each year. Examining the fitted relationships from GLMM, balsam fir defoliation was negatively related to percent hardwood content each year from 2012 to 2016 (Figure 2). The fitted lines indicated that the relationship between defoliation and hardwood amount was weak in 2012 and became stronger in 2013 and 2014, the second and third years of defoliation, then declined 2015 and 2016. Defoliation was highest in softwood plots in 2014 and 2015 (means of 79% and 87%, respectively), and in those years mean defoliation in hardwood plots was 12% and 55%, respectively (Figure 3). In 2012, the first year of defoliation, mean defoliation of balsam fir in softwood, mixedwood, and hardwood plots was 27%, 14%, and 12%, respectively. Average plot defoliation was significantly different among stand types (softwood > mixedwood > hardwood) in 2013 and 2014, when defoliation rapidly increased in softwood and mixedwood plots (Figure 3). Defoliation in softwood was significantly higher than in hardwood plots in all 5 years, but was significantly higher than in mixedwood plots only in 2013 and 2014. Defoliation peaked in 2015 in all three stand types, with means of 87%, 70%, and 55% defoliation in softwood, mixedwood, and hardwood plots, respectively (Figure 3). Defoliation declined in 2016, to 47% and 42% defoliation in softwood and mixedwood and 15% defoliation in hardwood plots, comparable to years prior to 2015. Over the 5 years, defoliation in softwood plots averaged 14% higher than in mixedwood plots, and defoliation in mixedwood plots averaged 20% higher than in hardwood plots. Average fir defoliation in hardwood plots remained below 20% in all years except 2015, the year with the highest defoliation in all stand types (Figure 3).

3.2. Defoliation Estimated Using Three Model Formulations

The Random Forests model demonstrated the best performance among all three models, yielding a correlation of 0.92 with defoliation measured in the field (Figure 4C). The GLMM model produced an intermediate correlation (r = 0.87) among the three models (Figure 4B), while defoliation estimated using the simplified linear model showed the lowest correlation (r = 0.77; Figure 4A). The GLMM described the effects of hardwood content and D0 on balsam fir defoliation well (R2 = 0.85 considering fixed effects only and 0.94 considering both fixed and random effects [53]).
The simplified linear model that estimated defoliation using Equation (1) largely underestimated defoliation in mixedwood and hardwood plots under moderate and severe defoliation scenarios (Figure 4A). The GLMM performed well but still underestimated defoliation in some hardwood and mixedwood plots under mid-range defoliation level (Figure 4B). Among the three models, the Random Forests model provided the most accurate defoliation estimates, but a slight underestimation in softwood plots when actual defoliation was >80% (Figure 4C). Interestingly, both the Random Forests and GLMM models slightly overestimated defoliation in some hardwood plots under light defoliation levels (<20%) (Figure 4B,C).
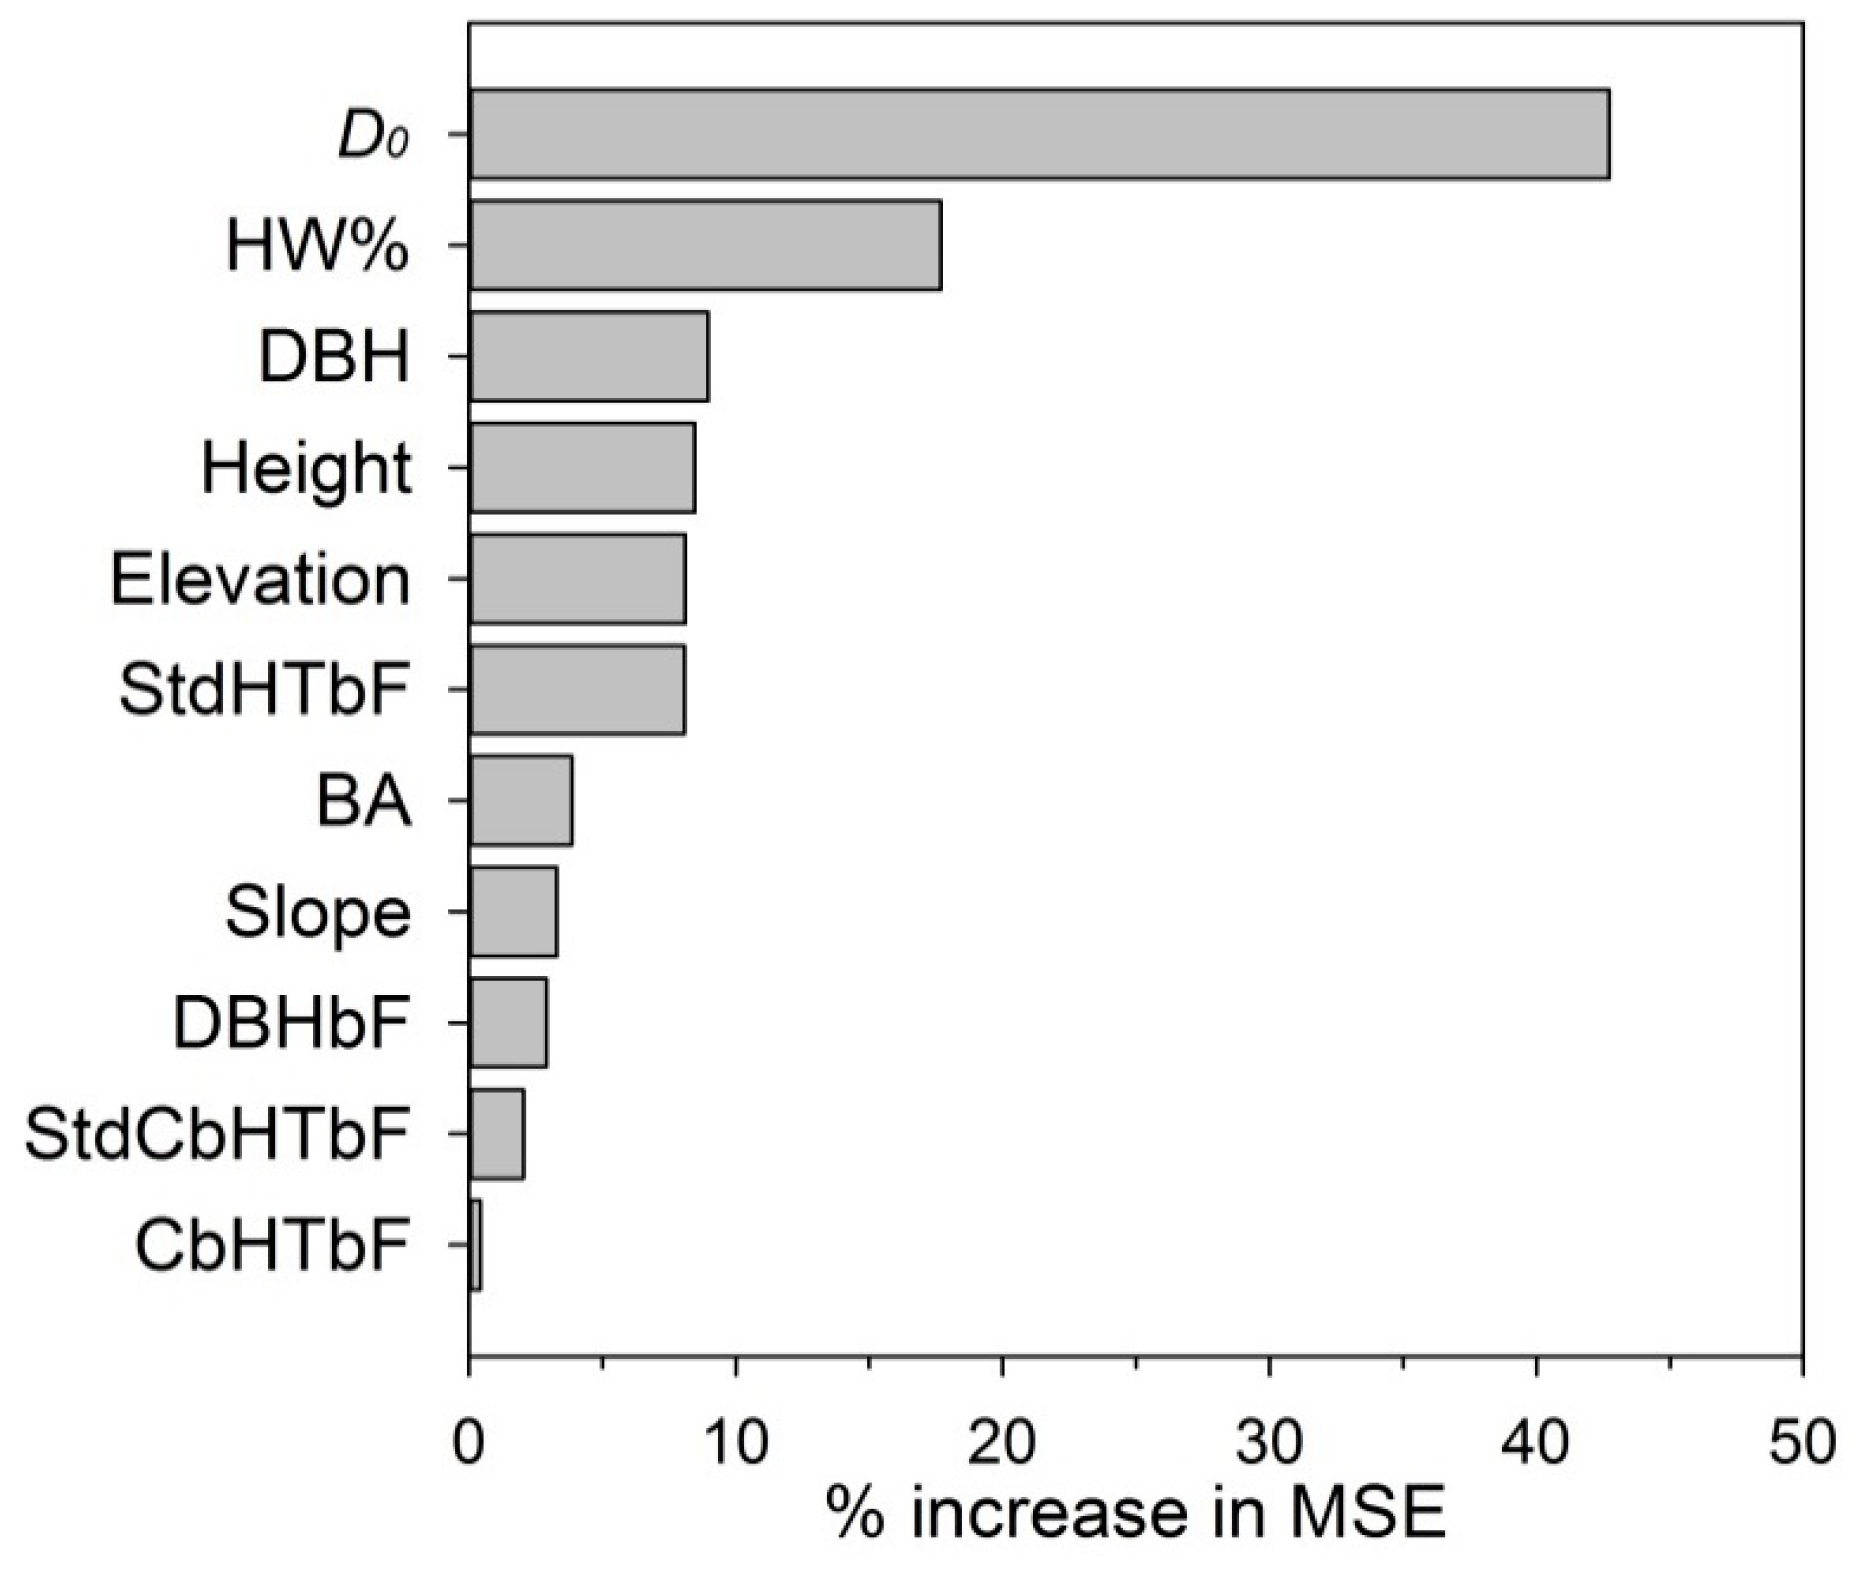
Amongst the 11 variables used to predict annual defoliation with Random Forests, average annual defoliation in softwood plots (D0) and percent hardwood content were the most important predictor variables, at increases in mean square error of 43% and 18%, respectively (Figure 5). D0 was important as an indicator of the overall spruce budworm outbreak severity in a given year, while inclusion of percent hardwood content confirmed its significance in predicting budworm defoliation. Mean DBH, mean height, elevation, and standard deviation of bF height ranked as the third to the sixth most important predictors, at 8%–9% increases in mean square error (Figure 5). Other predictor variables included in the model (BA, slope, mean DBH of bF, standard deviation of bF crown base height, and mean bF crown base height) each had <5% increase in mean square error (Figure 5). We tried running the Random Forests model eliminating some of the variables with little contribution to accuracy (e.g., using only the top several variables in Figure 5), and the resulting correlation between measured defoliation and the model estimate dropped by 2%–3%. Variables in the Random Forests model and the GLMM essentially converged, along with the addition of DBH or Height and Elevation in the Random Forests model.

4. Discussion

4.1. Relationships between Defoliation and Hardwood Content during Building Phase of a Spruce Budworm Outbreak

Our results on the relationship between spruce budworm defoliation of balsam fir and hardwood content during the building phase of an outbreak generally conformed to observations in the literature that tree diversity reduces herbivory by oligophagous insects [1]. Defoliation of fir was lower in plots with higher hardwood content in each of the 5 years of our study. Density of softwood and mixedwood plots was approximately twice that of hardwood plots. Under dense host conditions, natural enemies of budworm may have more predation opportunities since budworm as the prey may be more concentrated. Average balsam fir diameter always exceeded the plot mean diameter in the softwood plots, but this relationship was variable in the mixedwood and hardwood plots. Female budworm moths may have less chance landing and laying eggs on balsam fir trees in mixedwood and hardwood plots as balsam fir was less dominant in these plots.
Relationships between defoliation and hardwood content varied significantly with average defoliation in softwood plots each year in the GLMM. The relationship was weak in 2012 and became stronger in 2013 and 2014 before declining again in 2015 and 2016. Similarly, a varying relationship between defoliation and hardwood content was found in the declining phase (1989–1993) of the last outbreak [15]. Relationships were stronger in the first 3 years of the sampling period (1989–1991) and declined gradually in the last 2 years (1992 and 1993). In the building phase of a spruce budworm outbreak, populations increase and eventually reach epidemic level. Likewise, populations gradually decrease to endemic levels in the declining phase. Royama et al. [54] suggested that the budworm outbreak cycle was mainly determined by postdiapause mortality caused by parasitism. The varying relationship between defoliation and hardwood content among years may reflect varying parasitism rates associated with hardwoods. For example, in 2012 when budworm population density was low, assemblage of hyperparasitoids was smaller than in years with high budworm density [55]; parasitism rates may be similar in softwood and hardwood plots. When budworm population density rapidly increased in 2013 and 2014, “switching behavior” of mobile generalist parasitoids was stronger in a heterogeneous environment than in homogeneous forest plots [55,56]; parasitism rates may be higher in plots with more hardwoods than in pure fir plots. Once the budworm population reached its peak in 2015, neither the “birdfeeder effect” [55] nor “switching behavior” could stabilize the food web or regulate the severity of the outbreak under the high prey density; thus, parasitism rates may have been similar again and the defoliation reached its highest level in all three stand types.
Judged based on dispersion of data points around the graphed defoliation versus hardwood content relationships (our Figure 2 versus Figure 2 in Su et al. [15]), our results showed somewhat weaker relationships in the spruce budworm building phase compared with the declining phase. Budworm annual defoliation is significantly affected by budworm outbreak status [32]. It is unclear why a stronger relationship and larger impact between budworm defoliation and hardwood content occurred in the declining phase than it is in the building phase, but there are two possible explanations. First, in the declining phase of a budworm outbreak, sudden declines in the spruce budworm population in a given year can occur (e.g., third to fourth instar larval population decreased about 20 times in 1988 for Plot 1 and Plot 2 in Royama et al. [54]). Given that the density of natural enemies (parasitoids) in year X is determined by their density in the previous year (X − 1) when the budworm population was higher, parasitism and its impact on budworm populations in year X would be disproportionately large [54], resulting in less defoliation and, thus, a strong relationship between defoliation and hardwood content. The second possible explanation is based on the “habitat fragmentation” hypothesis, because tree mortality occurs during the declining phase of a budworm outbreak, resulting in an increasing degree of habitat fragmentation for budworm larvae. After the peak of an outbreak, balsam fir trees and branches as the main food source for budworm would be sparser and patchier than earlier in the outbreak. The worsened host condition in the declining phase could have greater impact on budworm population, and thus defoliation, resulting in a stronger relationship between budworm herbivory and tree diversity. These hypotheses could be tested by further studies on spruce budworm population dynamics.

4.2. Which Model Provides the “Best” Defoliation Estimates?

The Random Forests model yielded the most accurate defoliation estimates among the three tested models. It incorporated 11 predictor variables, with percent hardwood the second most important predictor, following only average annual defoliation in softwood plots (D0), reflecting average regional severity of defoliation in a particular year. Hardwood content was a significant factor in predicting budworm defoliation, similar to findings of MacKinnon and MacLean [30] and Colford-Gilks et al. [31]. Mean DBH and mean height ranked as the third and fourth important variables, suggesting that average tree size had some importance in predicting budworm defoliation. It has repeatedly been observed that mature and over-mature stands have the highest susceptibility and vulnerability to budworm outbreaks (e.g., [17]). Standard deviation of bF height was the only variable with >5% increase in mean square error among variables related with canopy structure, indicating that canopy structure had little importance in predicting defoliation in these plots, which were mature with a single canopy layer. We conclude that incorporating more independent variables improved the accuracy of defoliation predictions, but at the cost of constructing a larger and more complex model. Such models could be difficult to construct using traditional parametric approaches due to complex interactions among variables and violation of distributional assumptions. Nevertheless, hardwood content and D0 as the two most important independent variables were not correlated and we suggest that they should be included in any budworm defoliation modeling attempts.
Defoliation estimates from the GLMM were less accurate than the Random Forests model but better than estimates from the simplified linear model. Like the Random Forests model, the GLMM model was constructed using sampled defoliation data from all three stand types, but fewer predictor variables were included. The GLMM modified the form of the relationship and included the different relationships between defoliation and percent hardwood content under varying defoliation severities. In contrast, the simplified linear model assumed a constant relationship, but did have the benefit of being able to estimate defoliation in fir-hardwood stands without conducting comprehensive sampling, model construction, or parameter estimation. Percent hardwood content is readily available in all forest inventories and D0 as an indicator of average annual defoliation severity can be estimated relative easily from either regional defoliation surveys carried out by government agencies in softwood stands, or regional spruce budworm population sampling such as second instar larval or moth sampling. With these data and Equation (1), defoliation in fir-hardwood stands could be quickly estimated. However, either traditional parametric (GLMM) model or non-parametric Random Forests model provided more accurate defoliation estimates than the simplified linear model. In similar analyses, we suggest that data about the average defoliation level, or another indicator of annual outbreak severity, should be included in addition to percent hardwood content.

5. Conclusions

Balsam fir defoliation caused by spruce budworm during the initiation and building phase of the outbreak (2012–2016) was significantly lower in plots with higher percent hardwood content. The relationship between defoliation and percent hardwood varied significantly with overall defoliation severity each year. Average defoliation in softwood was significantly higher than in hardwood plots in all years during the studied period, but was significantly higher than in mixedwood plots only in 2013 and 2014 when overall defoliation rapidly increased. Average defoliation severity in softwood plots and percent hardwood content were the two most important variables for predicting balsam fir defoliation caused by spruce budworm. Excluding average defoliation severity in softwood plots as a predictor variable decreased the accuracy of prediction of fir defoliation. A simplified linear model could be used to quickly estimate spruce budworm defoliation in mixedwood stands, but with lower accuracy than parametric or non-parametric modeling approaches that include percent hardwood content and an indicator of average defoliation level or overall outbreak severity. The varying relationship between forest stand composition and defoliation indicated that dynamics and community structure of spruce budworm that was possibly governed by complex ecological processes [57], e.g., “natural enemy” and/or “habitat fragmentation” hypotheses, varied not only in time and with prey density, but also with changing forest condition.

Author Contributions

The authors provided equal contribution towards decisions regarding methodology and study design. B.Z. wrote the manuscript draft; D.A.M., R.C.J., and E.S.E. contributed to manuscript revision and development.

Funding

This research was funded by the Atlantic Innovation Fund project “Early Intervention Strategy to Suppress a Spruce Budworm Outbreak” grant to D.A.M.

Acknowledgments

We thank Wayne E. MacKinnon of the Canadian Forest Service for providing inventory data for stand selection, Chris R. Hennigar for input on statistics, and Annik Proulx of Quebec Ministère des Forêts, de la Faune et des Parcs for excluding our sample plots from harvesting and insecticide treatment. Allison Dykstra, Evan Dracup, Matt Hill, Shawn Donovan, Jessica Cormier, Craig Wall, and Maggie Brewer assisted with field data collection.

Conflicts of Interest

The authors declare no conflicts of interest.

References

  1. Jactel, H.; Brockerhoff, E.G. Tree diversity reduces herbivory by forest insects. Ecol. Lett. 2007, 10, 835–848. [Google Scholar] [CrossRef] [PubMed]
  2. Morris, R.F.; Cheshire, W.F.; Miller, C.A.; Mott, D.G. The numerical response of avian and mammalian predators during a gradation of the spruce budworm. Ecology 1958, 39, 487–494. [Google Scholar] [CrossRef]
  3. Belle-Isle, J.; Kneeshaw, D. A stand and landscape comparison of the effects of a spruce budworm (Choristoneura fumiferana (Clem.)) outbreak to the combined effects of harvesting and thinning on forest structure. For. Ecol. Manag. 2007, 246, 163–174. [Google Scholar] [CrossRef]
  4. Morin, H.; Jardon, Y.; Gagnon, R. Relationship between spruce budworm outbreaks and forest dynamics in eastern North America. In Plant Disturbance Ecology: The Process and the Response; Johnson, E.A., Miyanishi, K., Eds.; Elsevier: New York, NY, USA, 2007; pp. 555–577. [Google Scholar]
  5. Royama, T. Population dynamics of the spruce budworm Choristoneura fumiferana. Ecol. Monogr. 1984, 54, 429–462. [Google Scholar] [CrossRef]
  6. Royama, T.; MacKinnon, W.E.; Kettela, E.G.; Carter, N.E.; Hartling, L.K. Analysis of spruce budworm outbreak cycles in New Brunswick, Canada, since 1952. Ecology 2005, 86, 1212–1224. [Google Scholar] [CrossRef]
  7. Piene, H.; MacLean, D.A. Spruce budworm defoliation and growth loss in young balsam fir: Patterns of shoot, needle and foliage weight production over a nine-year outbreak cycle. For. Ecol. Manag. 1999, 123, 115–133. [Google Scholar] [CrossRef]
  8. Hennigar, C.R.; MacLean, D.A.; Quiring, D.T.; Kershaw, J.A. Differences in spruce budworm defoliation among balsam fir and white, red, and black spruce. For. Sci. 2008, 54, 158–166. [Google Scholar] [CrossRef]
  9. Natural Resources Canada. Compendium of Canadian Forestry Statistics 1994; Canadian Council of Forest Ministers: Ottawa, ON, Canada, 1995; pp. 1–217. ISBN 0-662-21710-1.
  10. Sanders, C.J. A Summary of Current Techniques Used for Sampling Spruce Budworm Populations and Estimating Defoliation in Eastern Canada; Environment Canada, Canadian Forestry Service: Sault Ste. Marie, ON, Canada, 1980; pp. 1–33.
  11. MacLean, D.A.; MacKinnon, W.E. Sample sizes required to estimate defoliation of spruce and balsam fir caused by spruce budworm accurately. North. J. Appl. For. 1998, 15, 135–140. [Google Scholar] [CrossRef]
  12. Donovan, S.D.; MacLean, D.A.; Kershaw, J.A.; Lavigne, M.B. Quantification of forest canopy changes caused by spruce budworm defoliation using digital hemispherical imagery. Agric. For. Meteorol. 2018, 262, 89–99. [Google Scholar] [CrossRef]
  13. MacLean, D.A. Vulnerability of fir-spruce stands during uncontrolled spruce budworm outbreaks: A review and discussion. For. Chron. 1980, 56, 213–221. [Google Scholar] [CrossRef]
  14. Bergeron, Y.; Leduc, A.; Joyal, C.; Morin, H. Balsam fir mortality following the last spruce budworm outbreak in northwestern Quebec. Can. J. For. Res. 1995, 25, 1375–1384. [Google Scholar] [CrossRef]
  15. Su, Q.; Needham, T.D.; MacLean, D.A. The influence of hardwood content on balsam fir defoliation by spruce budworm. Can. J. For. Res. 1996, 26, 1620–1628. [Google Scholar] [CrossRef]
  16. Campbell, E.M.; MacLean, D.A.; Bergeron, Y. The severity of budworm-caused growth reductions in balsam fir/spruce stands varies with the hardwood content of surrounding forest landscapes. For. Sci. 2008, 54, 195–205. [Google Scholar] [CrossRef]
  17. MacLean, D.A. Effects of spruce budworm outbreaks on the productivity and stability of balsam fir forests. For. Chron. 1984, 60, 273–279. [Google Scholar] [CrossRef]
  18. Nealis, V.G.; Régnière, J. Insect host relationships influencing disturbance by the spruce budworm in a boreal mixedwood forest. Can. J. For. Res. 2004, 34, 1870–1882. [Google Scholar] [CrossRef]
  19. Riihimäki, J.; Kaitaniemi, P.; Koricheva, J.; Vehviläinen, H. Testing the enemies hypothesis in forest stands: The important role of tree species composition. Oecologia 2005, 142, 90–97. [Google Scholar] [CrossRef] [PubMed]
  20. Siemann, E.; Tilman, D.; Haarstad, J.; Ritchie, M. Experimental tests of the dependence of arthropod diversity on plant diversity. Am. Nat. 1998, 152, 738–750. [Google Scholar] [CrossRef] [PubMed]
  21. Quayle, D.; Régnière, J.; Cappuccino, N.; Dupont, A. Forest composition, host-population density, and parasitism of spruce budworm Choristoneura fumiferana eggs by Trichogramma minutum. Entomol. Exp. Appl. 2003, 107, 215–227. [Google Scholar] [CrossRef]
  22. Cardinale, B.J.; Srivastava, D.S.; Duffy, J.E.; Wright, J.P.; Downing, A.L.; Sankaran, M.; Jouseau, C. Effects of biodiversity on the functioning of trophic groups and ecosystems. Nature 2006, 443, 989–992. [Google Scholar] [CrossRef] [PubMed]
  23. Kemp, W.P.; Simmons, G.A. Influence of stand factors on survival of early instar spruce budworm. Environ. Entomol. 1979, 8, 993–996. [Google Scholar] [CrossRef]
  24. Cappuccino, N.; Lavertu, D.; Bergeron, Y.; Régnière, J. Spruce budworm impact, abundance and parasitism rate in a patchy landscape. Oecologia 1998, 114, 236–242. [Google Scholar] [CrossRef] [PubMed]
  25. Yamamura, K. Biodiversity and stability of herbivore populations: Influences of the spatial sparseness of food plants. Popul. Ecol. 2002, 44, 33–40. [Google Scholar] [CrossRef]
  26. Needham, T.; Kershaw, J.A.; MacLean, D.A.; Su, Q. Effects of mixed stand management to reduce impacts of spruce budworm defoliation on balsam fir stand-level growth and yield. North. J. Appl. For. 1999, 16, 19–24. [Google Scholar] [CrossRef]
  27. Sainte-Marie, G.B.; Kneeshaw, D.D.; MacLean, D.A.; Hennigar, C.R. Estimating forest vulnerability to the next spruce budworm outbreak: Will past silvicultural efforts pay dividends? Can. J. For. Res. 2014, 45, 314–324. [Google Scholar] [CrossRef]
  28. Stoszek, K.J.; Mika, P.G.; Moore, J.A.; Osborne, H.L. Relationships of Douglas-fir tussock moth defoliation to site and stand characteristics in northern Idaho. For. Sci. 1981, 27, 431–442. [Google Scholar] [CrossRef]
  29. De Somviele, B.; Lyytikäinen-Saarenmaa, P.; Niemelä, P. Sawfly (Hym., Diprionidae) outbreaks on Scots pine: Effect of stand structure, site quality and relative tree position on defoliation intensity. For. Ecol. Manag. 2004, 194, 305–317. [Google Scholar] [CrossRef]
  30. MacKinnon, W.E.; MacLean, D.A. The influence of forest and stand conditions on spruce budworm defoliation in New Brunswick, Canada. For. Sci. 2003, 49, 657–667. [Google Scholar] [CrossRef]
  31. Colford-Gilks, A.K.; MacLean, D.A.; Kershaw, J.A.; Béland, M. Growth and mortality of balsam fir-and spruce-tolerant hardwood stands as influenced by stand characteristics and spruce budworm defoliation. For. Ecol. Manag. 2012, 280, 82–92. [Google Scholar] [CrossRef]
  32. MacLean, D.A.; MacKinnon, W.E. Effects of stand and site characteristics on susceptibility and vulnerability of balsam fir and spruce to spruce budworm in New Brunswick. Can. J. For. Res. 1997, 27, 1859–1871. [Google Scholar] [CrossRef]
  33. Rowe, J.S. Forest Regions of Canada; Environment Canada, Canadian Forestry Service: Ottawa, ON, Canada, 1972; pp. 1–172.
  34. Ministère des Forêts de la Faune et des Parcs. Aires Infestées Par la Tordeuse des Bourgeons de L’épinette au Québec en 2012-Version 1.1; Gouvernement du Québec, Direction de la Protection des Forêts: Québec, QC, Canada, 2012; pp. 1–19.
  35. Ministère des Forêts de la Faune et des Parcs. Aires Infestées Par la Tordeuse des Bourgeons de L’épinette au Québec en 2016-Version 1.0; Gouvernement du Québec, Direction de la Protection des Forêts: Québec, QC, Canada, 2016; pp. 1–16. ISBN 978-2-550-7474-6.
  36. MacLean, D.A.; Lidstone, R.G. Defoliation by spruce budworm: Estimation by ocular and shoot-count methods and variability among branches, trees, and stands. Can. J. For. Res. 1982, 12, 582–594. [Google Scholar] [CrossRef]
  37. Morris, R.F. The development of sampling techniques for forest insect defoliators, with particular reference to the spruce budworm. Can. J. Zool. 1955, 33, 225–294. [Google Scholar] [CrossRef]
  38. Blais, J.R. Effects of the destruction of the current year’s foliage of balsam fir on the fecundity and habits of flight of the spruce budworm. Can. Entomol. 1953, 85, 446–448. [Google Scholar] [CrossRef]
  39. McCullagh, P.; Nelder, J.A. Generalized Linear Models, 2nd ed.; Chapman Hall/CRC Press: London, UK, 1989; Volume 37, pp. 476–478. ISBN 0412317605. [Google Scholar]
  40. Breiman, L. Random Forests. Mach. Learn. 2001, 45, 5–32. [Google Scholar] [CrossRef] [Green Version]
  41. Candau, J.N.; Fleming, R.A. Forecasting the response of spruce budworm defoliation to climate change in Ontario. Can. J. For. Res. 2011, 41, 1948–1960. [Google Scholar] [CrossRef]
  42. Penner, M.; Pitt, D.G.; Woods, M.E. Parametric vs. nonparametric LiDAR models for operational forest inventory in boreal Ontario. Can. J. Remote Sens. 2013, 39, 426–443. [Google Scholar] [CrossRef]
  43. Lopatin, J.; Dolos, K.; Hernández, H.J.; Galleguillos, M.; Fassnacht, F.E. Comparing Generalized Linear Models and random forest to model vascular plant species richness using LiDAR data in a natural forest in central Chile. Remote Sens. Environ. 2016, 173, 200–210. [Google Scholar] [CrossRef]
  44. Chen, X.; Ishwaran, H. Random forests for genomic data analysis. Genomics 2012, 99, 323–329. [Google Scholar] [CrossRef] [PubMed] [Green Version]
  45. Prasad, A.M.; Iverson, L.R.; Liaw, A. Newer classification and regression tree techniques: Bagging and random forests for ecological prediction. Ecosystems 2006, 9, 181–199. [Google Scholar] [CrossRef]
  46. Cutler, D.R.; Edwards, T.C.; Beard, K.H.; Cutler, A.; Hess, K.T.; Gibson, J.; Lawler, J.J. Random forests for classification in ecology. Ecology 2007, 88, 2783–2792. [Google Scholar] [CrossRef] [PubMed]
  47. De’ath, G.; Fabricius, K.E. Classification and regression trees: A powerful yet simple technique for ecological data analysis. Ecology 2000, 81, 3178–3192. [Google Scholar] [CrossRef]
  48. Liaw, A.; Wiener, M. Classification and regression by randomForest. R News 2002, 2, 18–22. [Google Scholar]
  49. Murphy, M.A.; Evans, J.S.; Storfer, A. Quantifying Bufo boreas connectivity in Yellowstone National Park with landscape genetics. Ecology 2010, 91, 252–261. [Google Scholar] [CrossRef] [PubMed]
  50. Dormann, C.F.; Elith, J.; Bacher, S.; Buchmann, C.; Carl, G.; Carré, G.; Marquéz, J.R.G.; Gruber, B.; Lafourcade, B.; Leitão, P.J. Collinearity: A review of methods to deal with it and a simulation study evaluating their performance. Ecography 2013, 36, 27–46. [Google Scholar] [CrossRef]
  51. R Core Team. R: A Language and Environment for Statistical Computing; R Foundation for Statistical Computing: Vienna, Austria, 2018. [Google Scholar]
  52. Pinheiro, J.; Bates, D.; DebRoy, S.; Sarkar, D.; R Core Team. nlme: Linear and Nonlinear Mixed Effects Models; R package version 3.1-137; 2018. Available online: https://CRAN.R-project.org/package=nlme (accessed on 25 June 2018).
  53. Nakagawa, S.; Schielzeth, H. A general and simple method for obtaining R2 from generalized linear mixed-effects models. Methods Ecol. Evol. 2013, 4, 133–142. [Google Scholar] [CrossRef]
  54. Royama, T.; Eveleigh, E.S.; Morin, J.R.B.; Pollock, S.J.; McCarthy, P.C.; McDougall, G.A.; Lucarotti, C.J. Mechanisms underlying spruce budworm outbreak processes as elucidated by a 14-year study in New Brunswick, Canada. Ecol. Monogr. 2017, 84, 600–631. [Google Scholar] [CrossRef]
  55. Eveleigh, E.S.; McCann, K.S.; McCarthy, P.C.; Pollock, S.J.; Lucarotti, C.J.; Morin, B.; McDougall, G.A.; Strongman, D.B.; Huber, J.T.; Umbanhowar, J.; et al. Fluctuations in density of an outbreak species drive diversity cascades in food webs. Proc. Natl. Acad. Sci. USA 2007, 104, 16976–16981. [Google Scholar] [CrossRef] [PubMed] [Green Version]
  56. Křivan, V.; Schmitz, O.J. Adaptive foraging and flexible food web topology. Evol. Ecol. Res. 2003, 5, 623–652. [Google Scholar]
  57. Régnière, J.; Nealis, V.G. The fine-scale population dynamics of spruce budworm: Survival of early instars related to forest condition. Ecol. Entomol. 2008, 33, 362–373. [Google Scholar] [CrossRef]
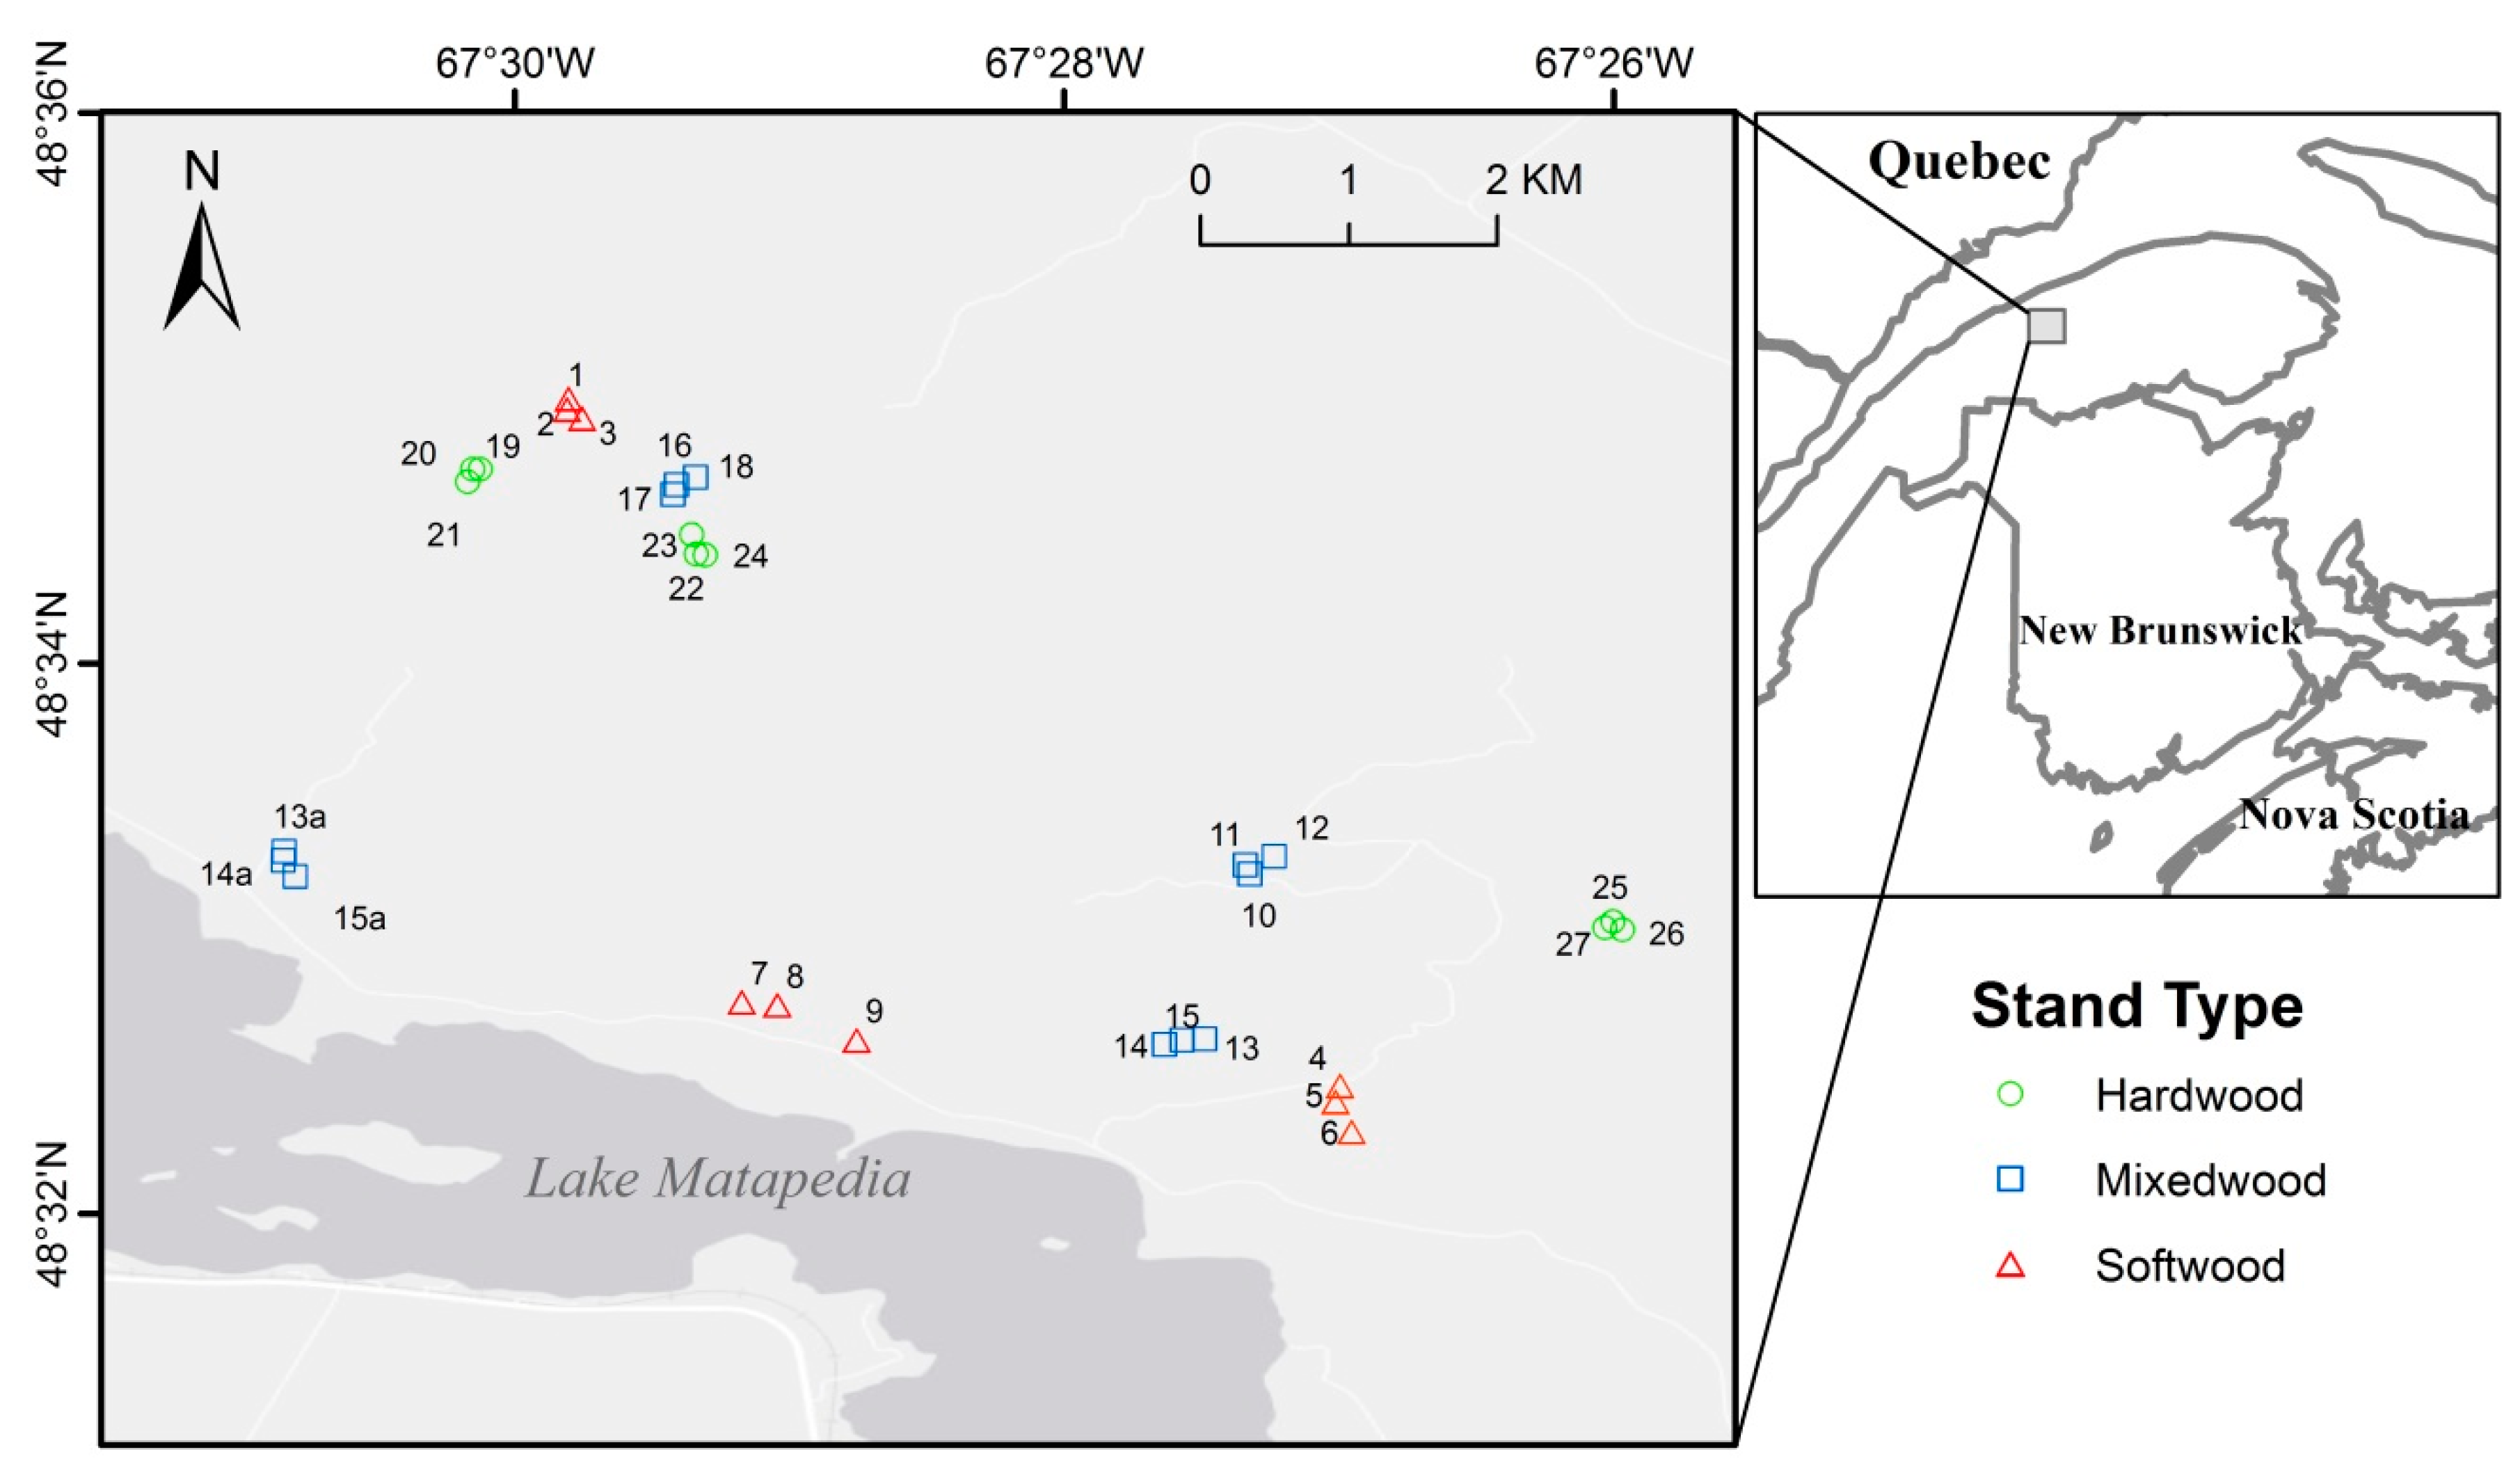
Figure 1. Locations of 27 plots sampled near Amqui, Quebec, by stand type.
Forests 09 00530 g001
Figure 2. Measured balsam fir defoliation and fitted relationships from generalized linear mixed-effects model to test the effects of percent hardwood content on annual plot defoliation from 2012 to 2016, for 27 plots near Amqui, Quebec.
Forests 09 00530 g002
Figure 3. Average annual balsam fir defoliation (± one standard error) from 2012 to 2016, for nine plots in each of three stand types with varied hardwood contents, near Amqui, Quebec. Different letters indicate significant differences among stand types in each year.
Forests 09 00530 g003
Figure 4. Annual plot defoliation, estimated with: (A) the simplified linear model (Equation (1)); (B) a generalized linear mixed-effects model; and (C) the Random Forests model, plotted against measured defoliation for 27 plots each year from 2012 to 2016.
Forests 09 00530 g004
Figure 5. Variable importance (percent increase in mean square error of the Random Forests model when the data for that variable were randomly permuted) of the 11 predictors used to predict spruce budworm defoliation in fir-hardwood mixed stands. High values of percent increase in mean square error indicate more important variables in the Random Forests model. The 11 predictor variables were: average annual defoliation in softwood plots (D0), percent hardwood basal area (HW%), mean DBH (DBH), mean height (Height), elevation, standard deviation of balsam fir (bF) height (StdHTbF), basal area (BA), slope, mean DBH of bF (DBHbF), standard deviation of bF crown base height (StdCbHTbF), and mean bF crown base height (CbHTbF).
Forests 09 00530 g005
Table 1. Description of the 27 plots sampled near Amqui, Quebec.
Plot No. bDensity (stems/ha)DBH c (cm)Ht c (m)DBHbF c (cm)BA c (m2/ha)Species Composition % Basal Area dTotal HW d (%BA)
bFwSOSsMyBIH
Softwood a
1102020.0 ± 1.116.3 ± 0.620.7 ± 1.1377849289
2280013.6 ± 0.512.8 ± 0.414.1 ± 0.64978341519
392021.5 ± 1.415.7 ± 0.823.4 ± 1.33964171633
4297513.1 ± 0.512.9 ± 0.313.1 ± 0.5478431211
5165016.1 ± 0.914.6 ± 0.715.8 ± 1.0408151414
6212515.6 ± 0.515.8 ± 0.315.8 ± 0.64495233
7210015.6 ± 0.813.9 ± 0.416.0 ± 0.850697811616
8110016.5 ± 1.712.7 ± 0.821.5 ± 2.238811919
9138016.4 ± 1.114.1 ± 0.722.5 ± 1.4397981321
Mixedwood
10254011.2 ± 0.79.7 ± 0.57.3 ± 0.73620107343064
1176019.2 ± 2.112.5 ± 1.020.8 ± 2.63236229191362
12162014.1 ± 1.110.7 ± 0.614.1 ± 1.337451233155
1396020.1 ± 1.518.7 ± 1.020.9 ± 1.7393311714949
1498021.5 ± 1.917.5 ± 1.219.0 ± 1.8492711775555
15128017.8 ± 1.017.5 ± 0.918.1 ± 1.539425225353
13a198011.0 ± 0.79.7 ± 0.510.0 ± 1.326405960
14a162013.7 ± 0.911.0 ± 0.613.3 ± 1.332445656
15a178015.1 ± 0.812.0 ± 0.514.4 ± 0.94057453540
16126017.7 ± 1.115.0 ± 0.519.0 ± 1.238489162852
17120016.9 ± 1.114.5 ± 0.618.9 ± 2.333438222857
18120017.3 ± 1.414.0 ± 0.616.7 ± 1.9403346174063
Hardwood
1980018.2 ± 1.816.7 ± 0.826.9 ± 7.328109090
20108016.8 ± 1.414.5 ± 0.821.3 ± 3.733243593176
2152022.8 ± 2.316.5 ± 1.020.0 ± 2.327125182988
22100018.5 ± 1.712.0 ± 0.711.4 ± 2.03812334242684
2362022.6 ± 2.717.2 ± 1.426.8 ± 4.135148686
2464018.7 ± 2.412.6 ± 1.025.7 ± 1.227816284992
25112013.7 ± 1.015.2 ± 0.722.9 ± 3.92288121092
2680017.2 ± 1.716.5 ± 0.819.7 ± 4.42557914295
2756024.8 ± 2.317.2 ± 0.619.6 ± 2.8331044281890
a Softwood, mixedwood, and hardwood stand types were classified by hardwood basal area percentage: softwood (0%–25%), mixedwood (40%–65%), and hardwood (75%–95%). b The ‘a’ suffix denotes three sample plots established 1 year after initial sampling to replace original plots which were harvested. c Abbreviations: DBH = mean diameter at breast height; Ht = mean total height; DBHbF = mean DBH of balsam fir; BA = basal area. DBH, Ht, and DBHbF are shown as plot average ± one standard error of the mean. d Species abbreviations: bF balsam fir; wS white spruce; OS other softwood = black spruce (Picea mariana (Mill.) BSP), eastern white-cedar (Thuja occidentalis L.), and eastern larch (Larix laricina (Du Roi) K. Koch); sM sugar maple; yB yellow birch; IH intolerant hardwood = red maple, white birch, trembling aspen (Populus tremuloides Michx.), and balsam poplar (Populus balsamifera L.), HW hardwood = sM + yB + IH.
Table 2. Results of generalized linear mixed-effects model to test the effects of percent hardwood content (HW%) and average annual defoliation in softwood plots (D0) on defoliation for 27 plots from 2012 to 2016 in Quebec.
Fixed EffectsParameter EstimatesAnalysis of Deviance
Par.Est.SEX2p
Interceptβ0−2.12250.3434
HW%β1−0.00890.006146.68<0.001
D0β20.04900.0055175.70<0.001
HW% × D0β4−0.00020.00016.510.011