Article

Mediterranean Islands Hosting Marginal and Peripheral Forest Tree Populations: The Case of Pinus brutia Ten. in Cyprus

1
Cyprus Association of Professional Foresters, P.O. Box 24258, 1703 Nicosia, Cyprus
2
Nature Conservation Unit, Frederick University, P.O. Box 24729, 1303 Nicosia, Cyprus
3
Laboratory of Forest Genetics and Tree Breeding, School of Forestry and Natural Environment, Aristotle University of Thessaloniki, P.O. Box 238, 54124 Thessaloniki, Greece
4
Department of Forests, Ministry of Agriculture, Rural Development and Environment, 1414 Nicosia, Cyprus
*
Author to whom correspondence should be addressed.
The authors contributed equally to this article.
Forests 2018, 9(9), 514; https://doi.org/10.3390/f9090514
Submission received: 20 July 2018 / Revised: 15 August 2018 / Accepted: 21 August 2018 / Published: 24 August 2018
(This article belongs to the Special Issue Genetics and Genomics of Forest Trees)

Abstract

:
Mediterranean islands have served as important Tertiary and glacial refuges, hosting important peripheral and ecologically marginal forest tree populations. These populations, presumably harboring unique gene complexes, are particularly interesting in the context of climate change. Pinus brutia Ten. is widespread in the eastern Mediterranean Basin and in Cyprus in particular it is the most common tree species. This study evaluated genetic patterns and morphoanatomical local adaptation along the species geographical distribution and altitudinal range in Cyprus. Analysis showed that the Cyprus population of P. brutia is a peripheral population with high genetic diversity, comprised of different subpopulations. Evidence suggests the presence of ongoing dynamic evolutionary processes among the different subpopulations, while the most relic and isolated subpopulations exhibited a decreased genetic diversity compared to the most compact subpopulations in the central area of the island. These results could be the consequence of the small size and prolonged isolation of the former. Comparing populations along an altitude gradient, higher genetic diversity was detected at the middle level. The phenotypic plasticity observed is particularly important for the adaptive potential of P. brutia in an island environment, since it allows rapid change in local environmental conditions.

1. Introduction

The islands of the Mediterranean basin comprise one of the 36 terrestrial biodiversity hot spots of the world and are characterized by high diversity of landscape and vegetation types due to the complex historical biogeography and the profound environmental heterogeneity [1,2]. Mediterranean islands contain a significant component of Mediterranean biodiversity, notably a number of range-restricted species and unusual vegetation types [3,4]. The vegetation types usually considered as “typically Mediterranean” are the evergreen and sclerophyllous shrublands and forests under semi-arid or subhumid bioclimates, corresponding to thermo-mediterranean and meso-mediterranean vegetation belts [4]. Although the majority of Mediterranean islands are “continental islands” (that is, they became progressively isolated from the mainland and from each other by a complex combination of tectonic and glacio-eustatic processes), there are also cases of Mediterranean “oceanic islands” in the geological sense which were part of mainland (such as islands that emerged from the bottom of the sea) (see previous papers [3,5]). Thus, “oceanic islands” often present lower richness of biodiversity elements compared to “continental islands” [6], while the genetic background of their wild populations could be restricted, due to isolation, small population, founder effects, bottlenecks, low effective population sizes, and genetic drift [7].
The Mediterranean islands have served as important Tertiary and glacial refuges, and, hence, Mediterranean islands possess highly polymorphic species and vicariant endemic plants which emerged from more or less recent speciation events [6,7]. The geographic isolation and the environmental heterogeneity of the Mediterranean basin have favored diverse evolutionary processes of gradual speciation of plants, such as genetic drift or adaptive radiation (see previous papers [4,8,9]). These features indicate the role of the wild populations of flora and fauna species in the Mediterranean islands as important peripheral (and marginal) populations. Currently, the value of peripheral forest tree populations is of particular interest in the context of climate change [10]. These populations may concurrently be those where the most significant evolutionary changes will occur; those with increasing extinction risk; the source of migrants for the colonization of new habitats at leading edges; or the source of genetic variation for reinforcing existing genetic variation in various parts of the range [10].
Several authors argued that demographic and evolutionary processes shape peripheral populations differently, compared to populations at the core of the distribution, depending on their situation in the geographic space [11,12,13]. Thus, whether leading edge populations are diverse enough to efficiently contribute to colonization will depend on their interpopulation gene flow and the amount of gene flow from core populations [10]. The Mediterranean island forest tree populations are identified as geographically peripheral populations, since they are found at the rear edge of distribution areas; indeed an increasingly unfavorable climate may lead to their ecological marginalization, with drastic consequences for their survival [10].
Brutia pine (Pinus brutia Ten.), along with Aleppo pine (Pinus halepensis Mill.) form a distinct group (Group Halepensis) within the Eurasian hard pines; their combined geographic distribution reflects their prominence among low-elevation Mediterranean forest species [14]. Pinus brutia Ten. is a coniferous species confined mainly to the Eastern Mediterranean region (incl. Greece, Turkey, Cyprus, Syria, and Lebanon), and can also be found in Iraq and Iran [15,16]. P. brutia grows under several variations of the Mediterranean climate [15], on a wide range of soil types [17,18], while it is recognized for its adaptation to drought and alkaline soils [19,20]. In addition, P. brutia is able to form stable vegetation associations with broad-leaved species [21,22], a characteristic which has led to an increased interest in the species for commercial plantations, illustrated by breeding and provenance trails carried out in various countries in the Mediterranean region [14,23,24] and even in wider geographical ranges [20,25,26]. The P. brutia forests correspond to habitat type “9450 Mediterranean Pine Forests with Endemic Mesogean pine” according to the European Directive 93/42/EC. Despite the fact that the largest area covered by P. brutia occurs in Turkey (3.8–5.4 million ha) [16,27,28], the conservation interest nowadays focuses on the geographically peripheral and ecologically marginal populations of this species.
The present study examines the genetic and ecological processes acting on the peripheral population of P. brutia in Cyprus, an oceanic island as defined above, located at the southern edge of the species’ distribution. Thus, the current study examines possible genetic and morphoanatomical responses of P. brutia in relation to (i) its geographical distribution within the island of Cyprus and (ii) its distribution in different altitudes. Therefore, this study is an attempt to pursue a genetic and morphoanatomic analysis at a landscape scale, following a refined longitudinal, latitudinal, and altitudinal sampling within an island environment. Its outcomes will be invaluable in delineating a conservation strategy for mitigating adverse effects of global warming on the potential growth and survival of P. brutia forests in Cyprus and their genetic resources. The outcomes from this study will also contribute in obtaining more knowledge on the evolutionary capacity of geographically peripheral and potentially ecologically marginal populations of coniferous species, under the island environment (biogeography) and their adaptability to changing conditions, as well as the impact of altitude gradients on population genetic structure within the island ecosystems.

2. Material and Methods

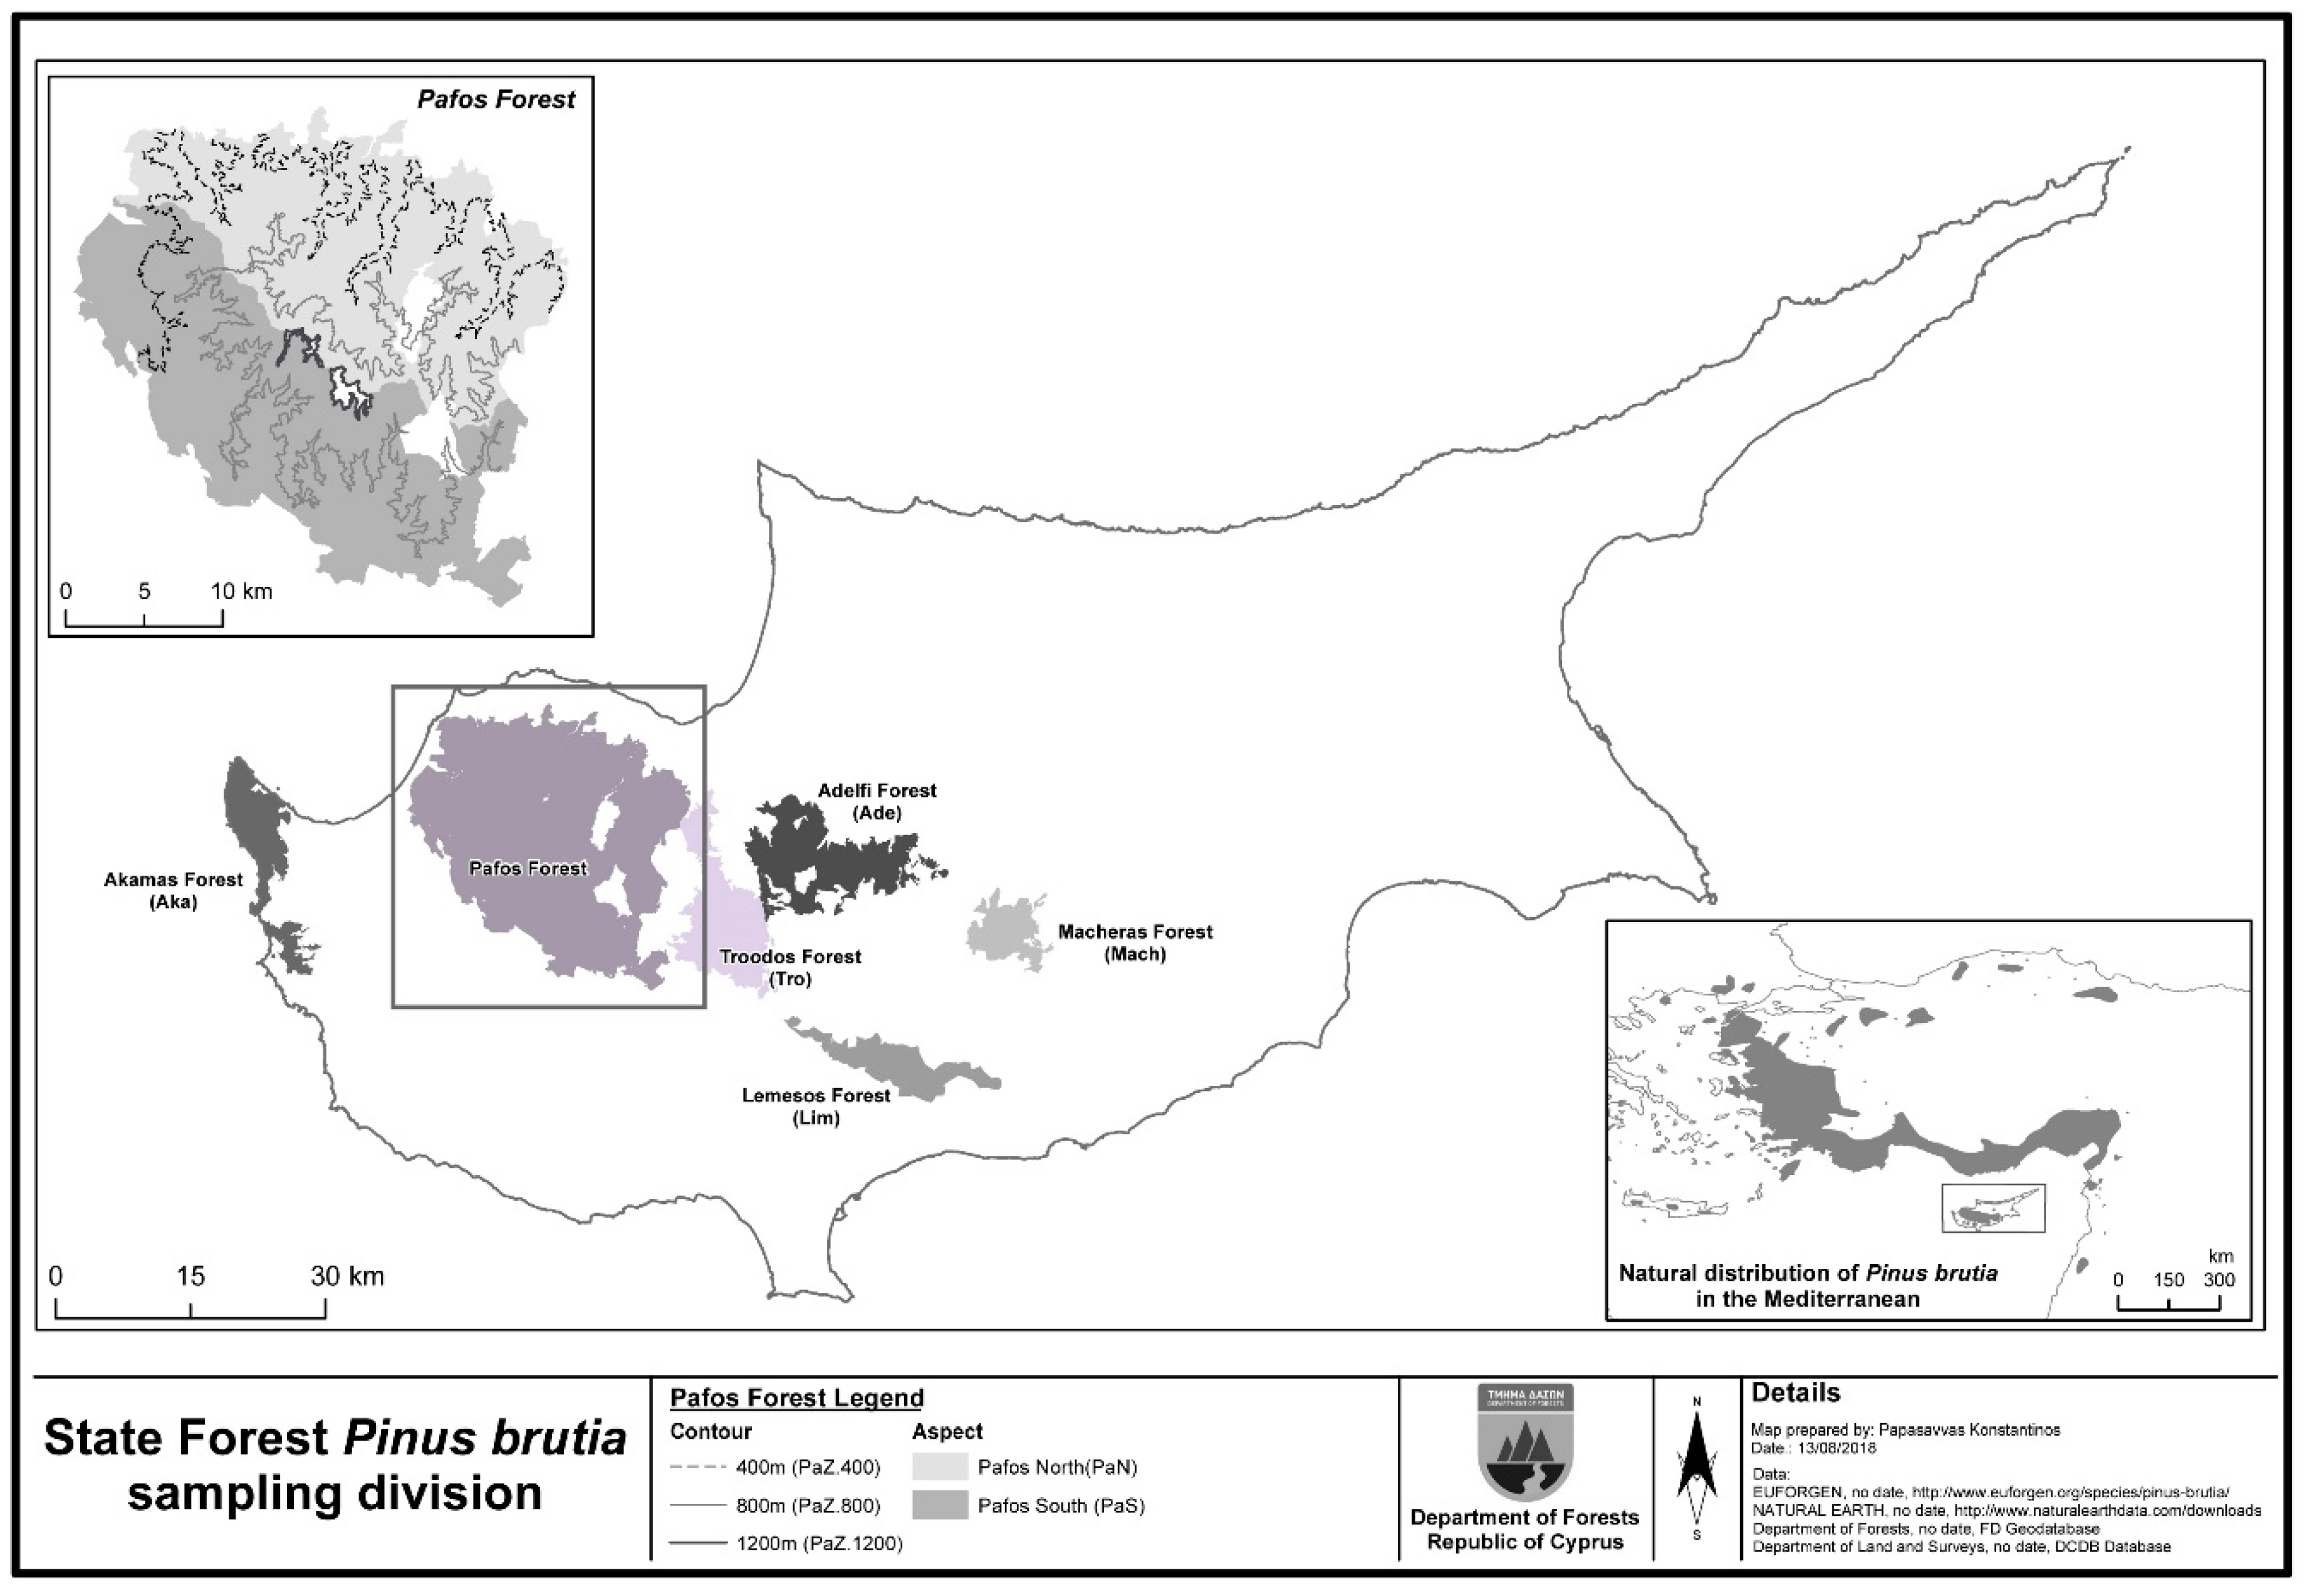
2.1. The P. brutia Forest in Cyprus

In Cyprus the thermophilous pine forests with P. brutia is the most extensive and widespread forest type, occurring in all mountainous areas from dry to subhumid climates (0–1.400 m), covering 66% of island-wide forest land (~88,790 ha) [29]. The Troodos range is well covered with dense pine forests, which attain their best development in Pafos forest (60,159 ha), where the largest unfragmented and best conserved P. brutia forests are found. According to the Rivas–Martínez bioclimatic classification, Cyprus has a Mediterranean Mesophytic to Xerophytic–Oceania bioclimate with zones ranging from Thermo-Mediterranean–semi-arid (lowlands) to supra-Mediterranean-humid (Troodos) [30].

2.2. Sampling Design

For the purposes of the current study, sampling was carried out in the central and main mountain range of the island, namely the “Troodos Mountain range”. Sampling covered a distance of 90 km longitudinal and 45 km latitudinal (Figure 1) and was implemented in the six forests, as these are defined by the Department of Forests, namely: Akamas forest, Pafos forest, Troodos forest, Adelphi forest, Limassol forest, and Macheras forest (referred to as “subpopulations”, see Table 1 & Figure 1). Plant tissues were collected from adult trees 50–70 years old (see Table 1) at a distance of 200 m in order to avoid genetic kinship. Within Pafos forest, sampling adopted ecological parameters, namely: (i) altitudinal subpopulations (altitude zones of 400 m, 800 m, and 1200 m—referred to as “altitudinal subpopulations”) and (ii) different aspects, namely the northeast and the southwest orientation (referred to as “aspect subpopulations”). P. brutia forest is the dominant vegetation in Pafos forest (size: 60,159 ha), shaping the best growing P. brutia forest on the island, covering a large area of forest from near-sea-level up to the peak of Tripylos at 1352 m. These characteristics allow a detailed assessment of genetic structure reflecting the dynamic effect of differential adaptation within Pafos forest (which is distinguished in three altitudinal subpopulations and two aspect subpopulations). The altitudinal subpopulations within Pafos forest were defined based on the Rivas–Martínez bioclimatic classification of Cyprus’ bioclimatic zones [31], where: (i) 0–400 m a.s.l. corresponding to the Hot Arid to Mild Arid bioclimatic belt, (ii) 400–800 m a.s.l. corresponding to the semi wet mild bioclimatic belt and (iii) 800–1300 m a.s.l. corresponding to the semi wet cool to cool wet bioclimatic belt.

2.3. Assessment of Genetic Diversity and Structure

For assessing the patterns of genetic diversity at both intra- and intersampling levels, three wind-pollinated cones were collected from the middle of the trees’ crown (Table 1), based on the assertion that at the middle-to-high range of a tree’s crown the possibility of autogamy (self-fertilization) is much lower (practically absent) than at the low level of the crown [32]. In continuation all sampled seeds from each “subpopulation” were bulked, and, hence, bulked seed material was obtained for further genetic analyses (Table 1). The genetic diversity in P. brutia from Cyprus was assessed based on haploid megagametophytes from germinated seeds assayed by isoenzyme horizontal starch gel electrophoresis. Isoenzyme analysis provides a nonrandom sampling of expressed genomic sequences and has proven invaluable in population genetic analysis over many decades of implementation. The protocols of Conkle et al. [33] and Cheliak and Pitel [34] were used to study the following enzyme systems: aspartate aminotransferase (AAT; EC 2.6.1.1), glutamate dehydrogenase (GDH; E.C.1.4.1.2), leucine aminopeptidase (LAP; E.C.3.4.11.1), and phosphoglucose isomerase (PGI; E.C.5.3.1.9), menadione reductase (MNR; E.C.1.6.99.2), isocitrate dehydrogenase (IDH; EC.1.1.1.42), malate dehydrogenase (MDH; E.C.1.1.1.37), and 6-phosphogluconate dehydrogenase (6PGD; E.C.1.1.1.44).
In order to assess Mendelian inheritance in P. brutia in Cyprus, six megagametophytes from each sampled tree of the Akamas (Aka) subpopulation and the altitudinal subpopulation PaZ.800 were used to derive the genotype of the (maternal) tree. Furthermore, the observed heterozygosity (Ho) and the expected heterozygosity (He) for these subpopulations were also estimated, based on the formulas by Nei [35,36]. In addition, the Hardy–Weinberg equilibrium (HWE) was calculated for these two subpopulations, as well as their genetic heterozygosity. The significance level of HWE was estimated based on the differentiation between observed and expected frequency of genotypes (as this was observed in each of the two subpopulations) using the chi-squared (X2) statistic test. These subpopulations were chosen since both showed specific ecological and demographic features according to the national forest inventories of the Department of Forests (1981; 1991; 2001; 2011): The Aka subpopulation represents the driest and most degrading pine forest in Cyprus, while the subpopulation PaZ.800 corresponds to the altitude zone which is classified as the best ecological niche of the species growing in Cyprus.
For all sampling levels (subpopulations, altitude subpopulations, and orientation subpopulations) the multilocus intra-level genetic variation was assessed by the: percentage of polymorphic loci (PPL), observed number of allelic (Na), effective number of allelic (Ne), Shannon’s index (I), and genetic diversity (HE). Regarding the Pafos forest, the above measures were calculated as the mean values from the different subpopulations (i.e., altitude subpopulations and orientation subpopulations). The software GenAlEx 6.5 [37] was used for the calculation of the above interpopulation measures.
The intersampling level genetic diversity was assessed at three levels: (i) all sampled subpopulations, (ii) range-wide subpopulations (including all sampled subpopulations but without the altitude subpopulations), and (iii) altitudinal subpopulations. Furthermore, the subpopulations genetic structure was investigated using a Bayesian model-based clustering analysis [38], as implemented in the Structure v 2.3.4 software [38]. Bayesian analysis was performed using the admixture and the frequency-independent allele models with 50,000 Markov chain Monte Carlo (MCMC) steps and 10,000 burn-in periods. The number of K was set (i) from 1 to 15 when all subpopulations were included in the analysis, (ii) from 1 to 9 when the range-wide subpopulations were included, and (iii) from 1 to 5 when the three altitudinal subpopulations were included; for all runs each value of K for each case was run by three replicates. Post-processing of Structure software’s results, for selecting the optimum number of clusters (K) based on the Evanno method [39] and producing the graphical output, was implemented using the software CLUMPAK [40].
The genetic structure was also examined using a hierarchical analysis of molecular variance (AMOVA) as this is applied in software GenAlEx 6.5 [37], while its significance level was computed using 999 permutations. As in the previous investigation, the AMOVA was performed at three different levels (all sampled subpopulations, range-wide subpopulations and altitudinal subpopulations). At the range-wide subpopulations level AMOVA was implemented by subdividing the sampling locations into six “Groups” (i.e., each group corresponding to each sampling forest), while for the range-wide subpopulation the analysis was performed into two hierarchical levels. In addition, the hierarchical levels of genetic structure were also investigated at the marginal subpopulations, where two separate AMOVA runs were carried out: one for the three altitude gradient subpopulations, and one for the two orientation subpopulations.
The genetic relationships among sampled subpopulations (all sampled subpopulations, range-wide subpopulations, and altitude gradient subpopulations), were analyzed by means of a cluster analysis based on the unweighted pair group method with arithmetic mean (UPGMA) and the genetic distance of Nei [41], using the software TFPGA (version 1.3) [42]. Bootstrap values for the dendrogram were generated using the same software, after 10,000 replications over individuals. Visualization of the genetic structure, at multivariate space was carried out based on a Principal Coordinate Analysis (PCoA) using the GenAlEx 6.5 [37].
Finally, the correlation between the three altitudinal subpopulations (PaZ.400, PaZ.800, and PaZ.1200) and their allele frequencies was investigated by the Spearman’s rank correlation coefficient; using software SPSS 20.0 (SPSS Inc.®, New York, NY, USA).

2.4. Assessment of Morphoanatomical Diversity and Structure

The morphoanatomical variation of P. brutia in Cyprus was investigated using needles and cones. Three branches and three cones were collected from each sampled tree. For cones the following morphological traits were measured: cone length (CLen), cone width (CWid), and the ratio of cone length/width (CLen/CWid). From each of the measured cones three seeds (from the middle-part of the cone) were selected for measuring the morphological traits: seed length (SLen), seed width (SWid), length of seed’s wing (SWing), and the total length of seed and wing (SLenWing). Needles were collected from the north side and middle part of tree crowns and three needles (two-years-old) from each sampled tree were used to measure 13 morphoanatomical traits: length of needle sheath (NShLen), needle length (NLen), needle width (NWid), needle thickness (NThic), number of resin ducts (internal side—NResIn), number of resin ducts (dorsal side—NResDo), total number of resin ducts per needle (NResTot), number of stomata rows (dorsal side—NStomDo), number of stomata rows (internal side—NStomIn), total number of stomata rows per needle (NStoRow), number of stomata per row (NSto/Row), total number of stomata per 1 cm2 of needle (NStom), and number of needle teeth (NTeh). For 10 out of the 13 of the needle morphoanatomical traits, that is, apart from NLenSh, NLen, and NWin, measurements were carried out at the middle of the needle length, while the anatomic traits were measured using a stereoscope (magnification: 2 × 40).
The software SPSS 20.0 (SPSS Inc.®) was used to assess morphoanatomical trait variation from all sampled subpopulations at the intra- and intersampling location levels. For each trait and in each sampled subpopulation the following descriptive statistics were calculated: mean (μ), standard deviation (SD), and coefficient of variation (CV). The Spearman test was used to assess the correlation between the morphological and anatomical traits and to evaluate the correlation between traits and altitude within the Pafos forest. Furthermore, to assess morphoanatomical variation at the multivariate space level a principal component analysis (PCA) was used. The new independent components that were formed with eigenvalues above unity (>1) were used for the estimation of Euclidean distances among the sampled subpopulations. In order to visualize the classification patterns, in each of the three levels of sampling (all sampled subpopulations, range-wide sampled subpopulations, and altitudinal subpopulation) an unweighted pair group method with arithmetic average (UPGMA) dendrograms was constructed based on the morphological Euclidean distances (morphoanatomical distance), using the software NTSYS-pc 2.0 [43]. In addition, the hypothesis that trees belonging to their original sampled subpopulation are morphologically and anatomically similar was tested, using back-grouping, a nonparametric classification method analogous to discriminant analysis [44,45]. Finally, a Mantel test [46,47] was performed in order to investigate the possible relationship between morphoanatomical distance and genetic distance using also NTSYS-pc 2.0 [43].

3. Results

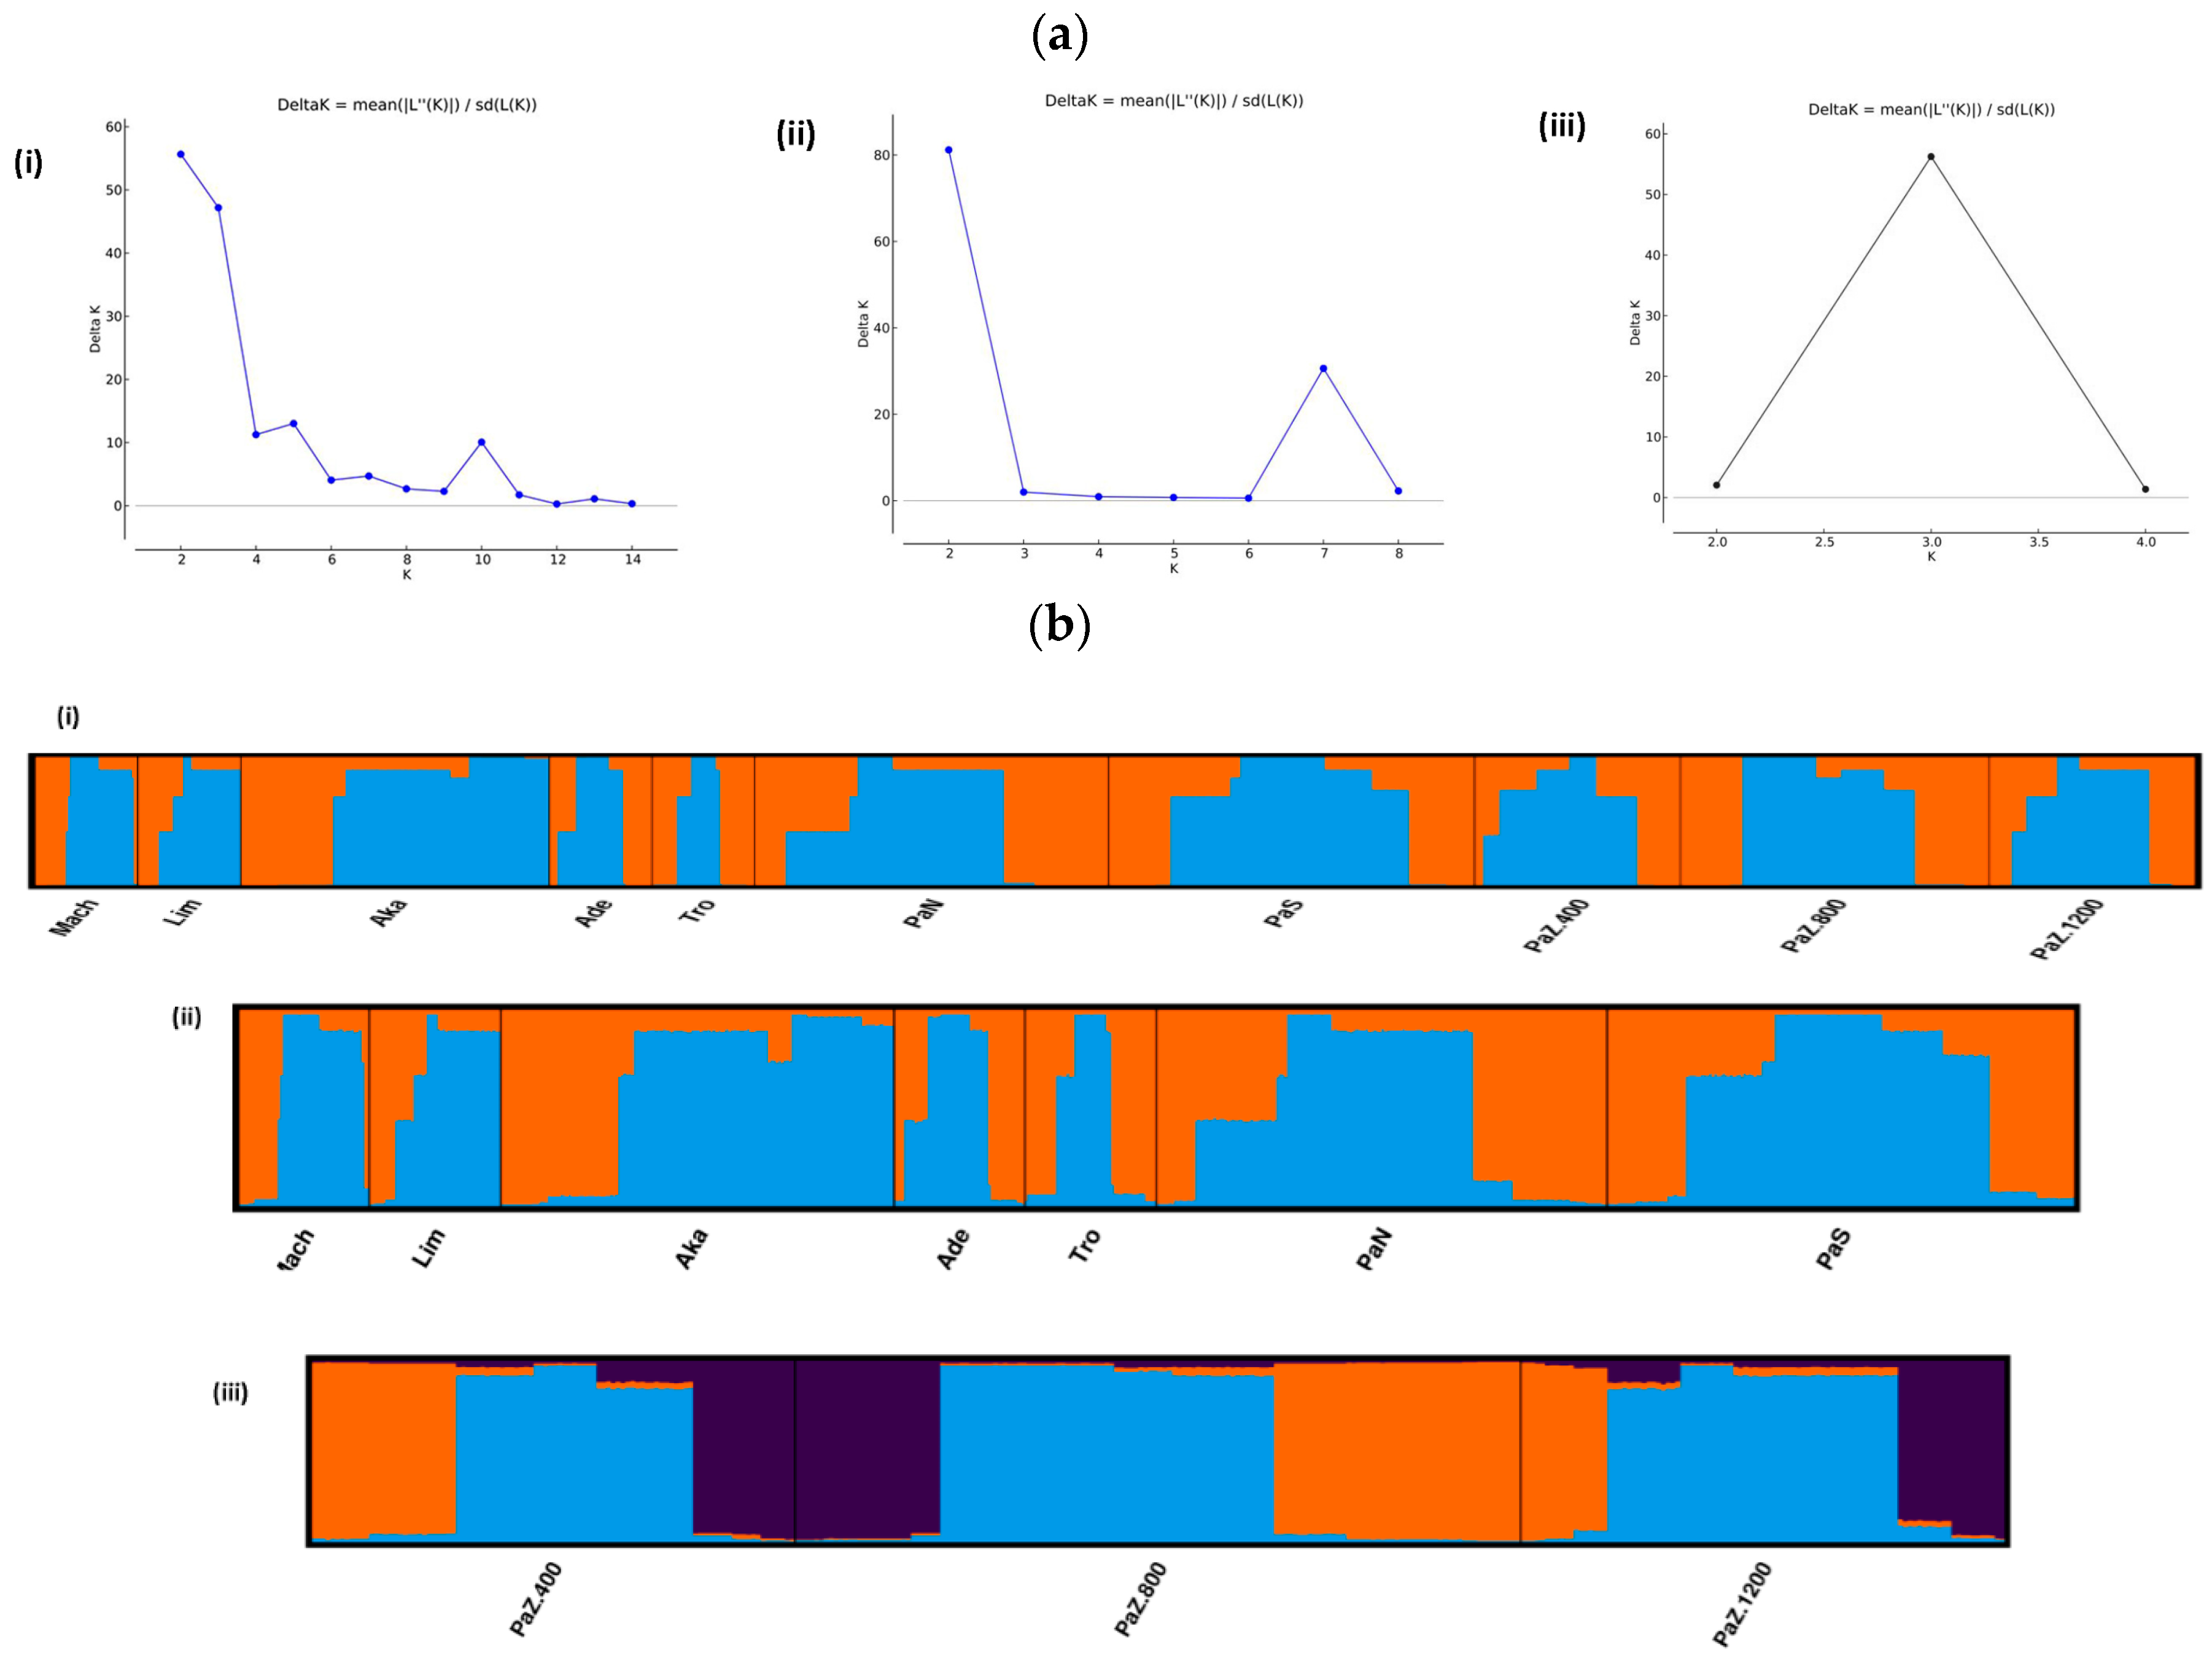
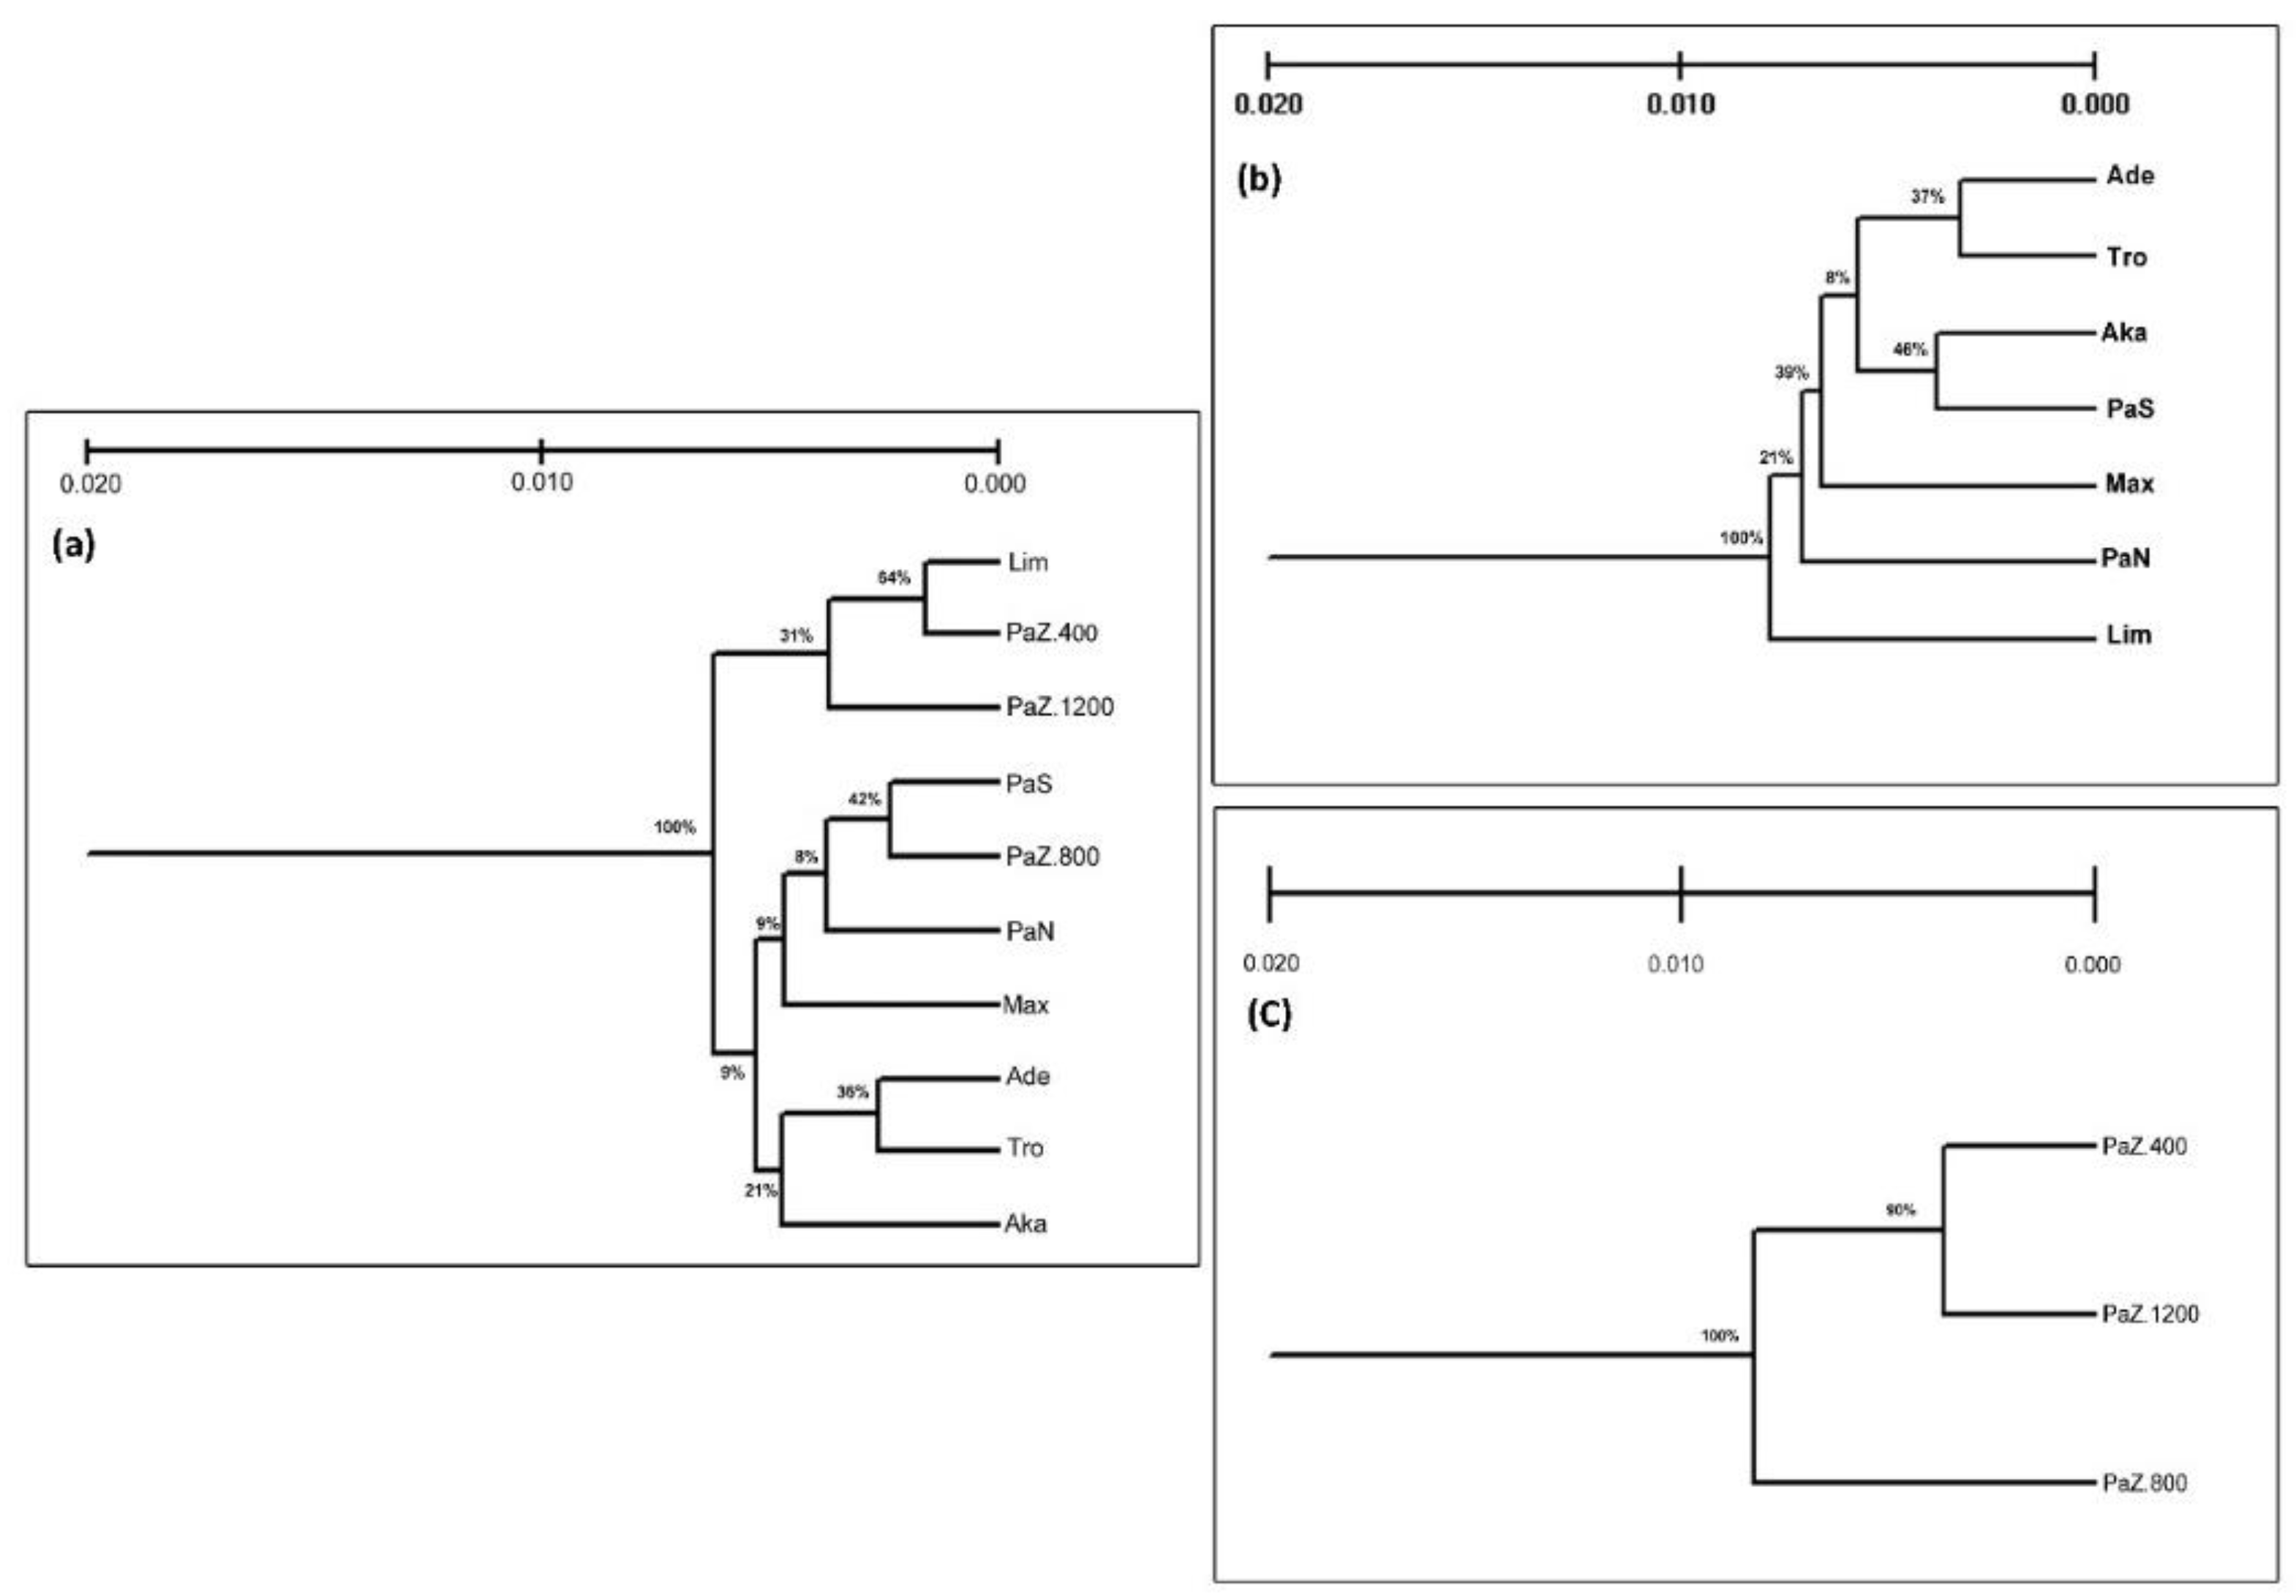
3.1. Genetic Diversity and Subpopulations Structure of P. brutia in Cyprus

Eight enzyme systems encoded by 10 loci (enzyme systems AAT and MDH encoded two loci each: AAT-1, AAT-2, MDH-1, and MDH-2) were analyzed. Nine out of 10 loci were found to be polymorphic. Six loci (AAT-1, AAT-2, LAP, GDH, MDH-1, and IDH) presented two alleles, two loci (PGI and MNR) displayed three alleles, and one locus (6PGD) showed four alleles. Remarkably, one out of the three allelic detected in locus MNR was found in subpopulation PaN and in the altitudinal subpopulation PaZ.800, and one out of the two alleles of locus IDH was found in subpopulation PaN and in the altitudinal subpopulation PaZ.1200. In the locus-by-locus analysis the genetic diversity (HE) ranged from 0 (for IDH in PaZ.400 & PaZ.800 & the monomorphic MDH-2) to 0.66 (for 6PGD in PaZ.800); the latter exhibited the highest mean genetic diversity (HE = 0.631) (Table S1). However, the highest average number of allelic (Na = 2.667) was detected in locus PGI (Table S1).
Mendelian inheritance was verified for seven out of the nine polymorphic loci (see Table S2 for more details), where X2 and p > 0.05 at a 99% CI were tested. The outcomes from this analysis support the absence of segregation distortion of the tested loci (except for LAP where segregation distortion was found) (see Table S2). The Hardy–Weinberg equilibrium (HWE) was also calculated for the two subpopulations (Akamas and PaZ.800) where the Mendelian inheritance was investigated. Both subpopulations were under HWE for most of the study loci, since loci MNR-1 and LAP-1 showed nonsignificant HWE for the Aka subpopulation and the locus LAP-1 was not significant in PaZ.800. Based on individuals’ genotype, the overall genetic diversity of Aka subpopulation was estimated: observed heterozygosity (Ho) = 0.164, expected heterozygosity (He) = 0.216, and the value of inbreeding (Fis) = 0.241. The level of genetic diversity for PaZ.800 was slightly higher (Ho = 0.216) and the He = 0.242, while the Fis was almost half (Fis = 0.107).
Assessment of multilocus genetic diversity within each of the sampled subpopulations (Table 2) showed that PaN and PaZ.1200 have the highest PPL value (90%), whereas Mach, Lim, and Tro the lowest PPL value (60%). PaN was the subpopulation with the highest number of allelic per locus (Na = 2.300) and Lim the one with the lowest (Na = 1.700). The effective number of alleles (Ne) was the lowest in Lim (Ne = 1.300), but relatively similar for two out of the ten subpopulations (PaN, Ne = 1.415 and Paz.800, Ne = 1.464). In overview, PaZ.800 presented the highest genetic diversity (I = 0.418 and HE = 0.244) and Lim the lowest (I = 0.269 and HE = 0.170). Notably, in Pafos forest (PaN, PaS, PaZ.400, PaZ.800, and PaZ.1200) the overall mean genetic diversity is PPL = 84%, Na = 2.160, Ne = 1.397, I = 0.373, and HE = 0.217. The present study detected the total genetic diversity of P. brutia in Cyprus as PPL = 90%, Na = 2.300, Ne = 1.421, I = 0.381, and HE = 0.220.
Furthermore, when only the samples of altitudinal subpopulations were considered, PaZ.800 presented the highest genetic diversity and PaZ.1200 the lowest, although the latter presented the highest presentence of polymorphic loci and a relatively high number of alleles per locus (Table 2).
The Bayesian clustering analyses were performed at three levels, nevertheless results were not explicitly clear. Analysis of all subpopulations, showed the highest Evanno’s ΔΚ index for K = 2 (with relatively high statistical support; ΔΚ = 55.64), while two more K values demonstrated a trend of grouping, but with low statistical support of ΔΚ index, K = 5 (ΔΚ = 13.01) a number corresponding to the geographic origins of sampled subpopulations and K = 10 (ΔΚ = 10.05) a number equal to the sampled subpopulations (Figure 2a(i)). Similar outcomes were recorded when the Bayesian analysis was performed including the range-wide subpopulations, by recording the highest Evanno’s ΔΚ index for K = 2 (with high statistical support; ΔΚ = 81.81) and a further peak on the graphical illustration of ΔΚ in K = 7 (ΔΚ = 30.62), a number equal to the range-wide subpopulations unit (all sampled subpopulation without the PaZ.400, PaZ.800, and PaZ1200) (Figure 2a(ii)). Bayesian clustering analysis was implemented in the altitudinal subpopulations, revealing three distinct clusters (K = 3; ΔΚ = 56.25) (Figure 2a(iii)).
The AMOVA showed that most of the genetic variation occurs within the sampled subpopulations (Table 3a,b) and the hierarchical analysis based on the subpopulations origin (grouping based on forest origin) revealed significant genetic differentiation (PhiRT = 0.118 ***) (Table 3a). The same analysis did not detect significant genetic differentiation between groups that consist of the core (central) area subpopulations and the peripheral subpopulations (forests). Quantification of genetic differentiation among all sampled subpopulations using AMOVA found a significant PhiST = 0.129 *** (Table 3a), while low but significant genetic differentiation was also detected among the altitudinal populations (PhiST = 0.018 **, Table 3b) and between the two subpopulations with different orientation (PhiST = 0.012 **, Table 3b).
Pairwise genetic distances (Nei’s minimum genetic distance—Table S3) among sampled subpopulations were depicted using UPGMA (Figure 3). The genetic similarities among all subpopulations reflect significant subdivisions among two major groups (Figure 3a). One group includes subpopulations Lim, PaZ.400, and PaZ.1200 and the second group the rest. However, the clades in the latter group were shown to be unimportant due to the low values of bootstraps. A similar observation was made in the range-wide subpopulations UPGMA. In this case, Lim formed a separate group (Figure 3b). Contrary to the previous dendrograms, the UPMGA on altitudinal subpopulations reflects significant subdivisions among them, since PaZ.800 seems clearly subdivided from the other two subpopulations (PaZ.400 and PaZ.1200) with the highest bootstrap value (Figure 3c).
A PCoA was used to discover and depict the major patterns within a multivariate dataset, by detecting the relationship between the distance matrix elements in a two-dimensional space. When all sampled subpopulations were considered, PCoA revealed four loosely formed groups that do not correspond well to subpopulation geographic origin (Figure 4a). On the other hand, when analysis was performed at the range-wide subpopulations, Ade and Tro were completely isolated from the remaining populations, while the orientation subpopulations (PaN and PaS) grouped with the Mach population (Figure 4b). Contrary to the above analyses that considered the latitudinal and longitudinal sampling of populations, the visualization of the genetic structure of the altitudinal populations showed a clear disjunction among the populations of the three zones sampled (Figure 4c).
Given the significant influence of altitude in subpopulations genetic structure, the Spearman’s correlation coefficient analysis examined the relation between allele frequency across loci and altitudinal subpopulations. It revealed a positive significant correlation between the altitudinal subpopulations in a single case, namely regarding one allelic in locus 6PGD.

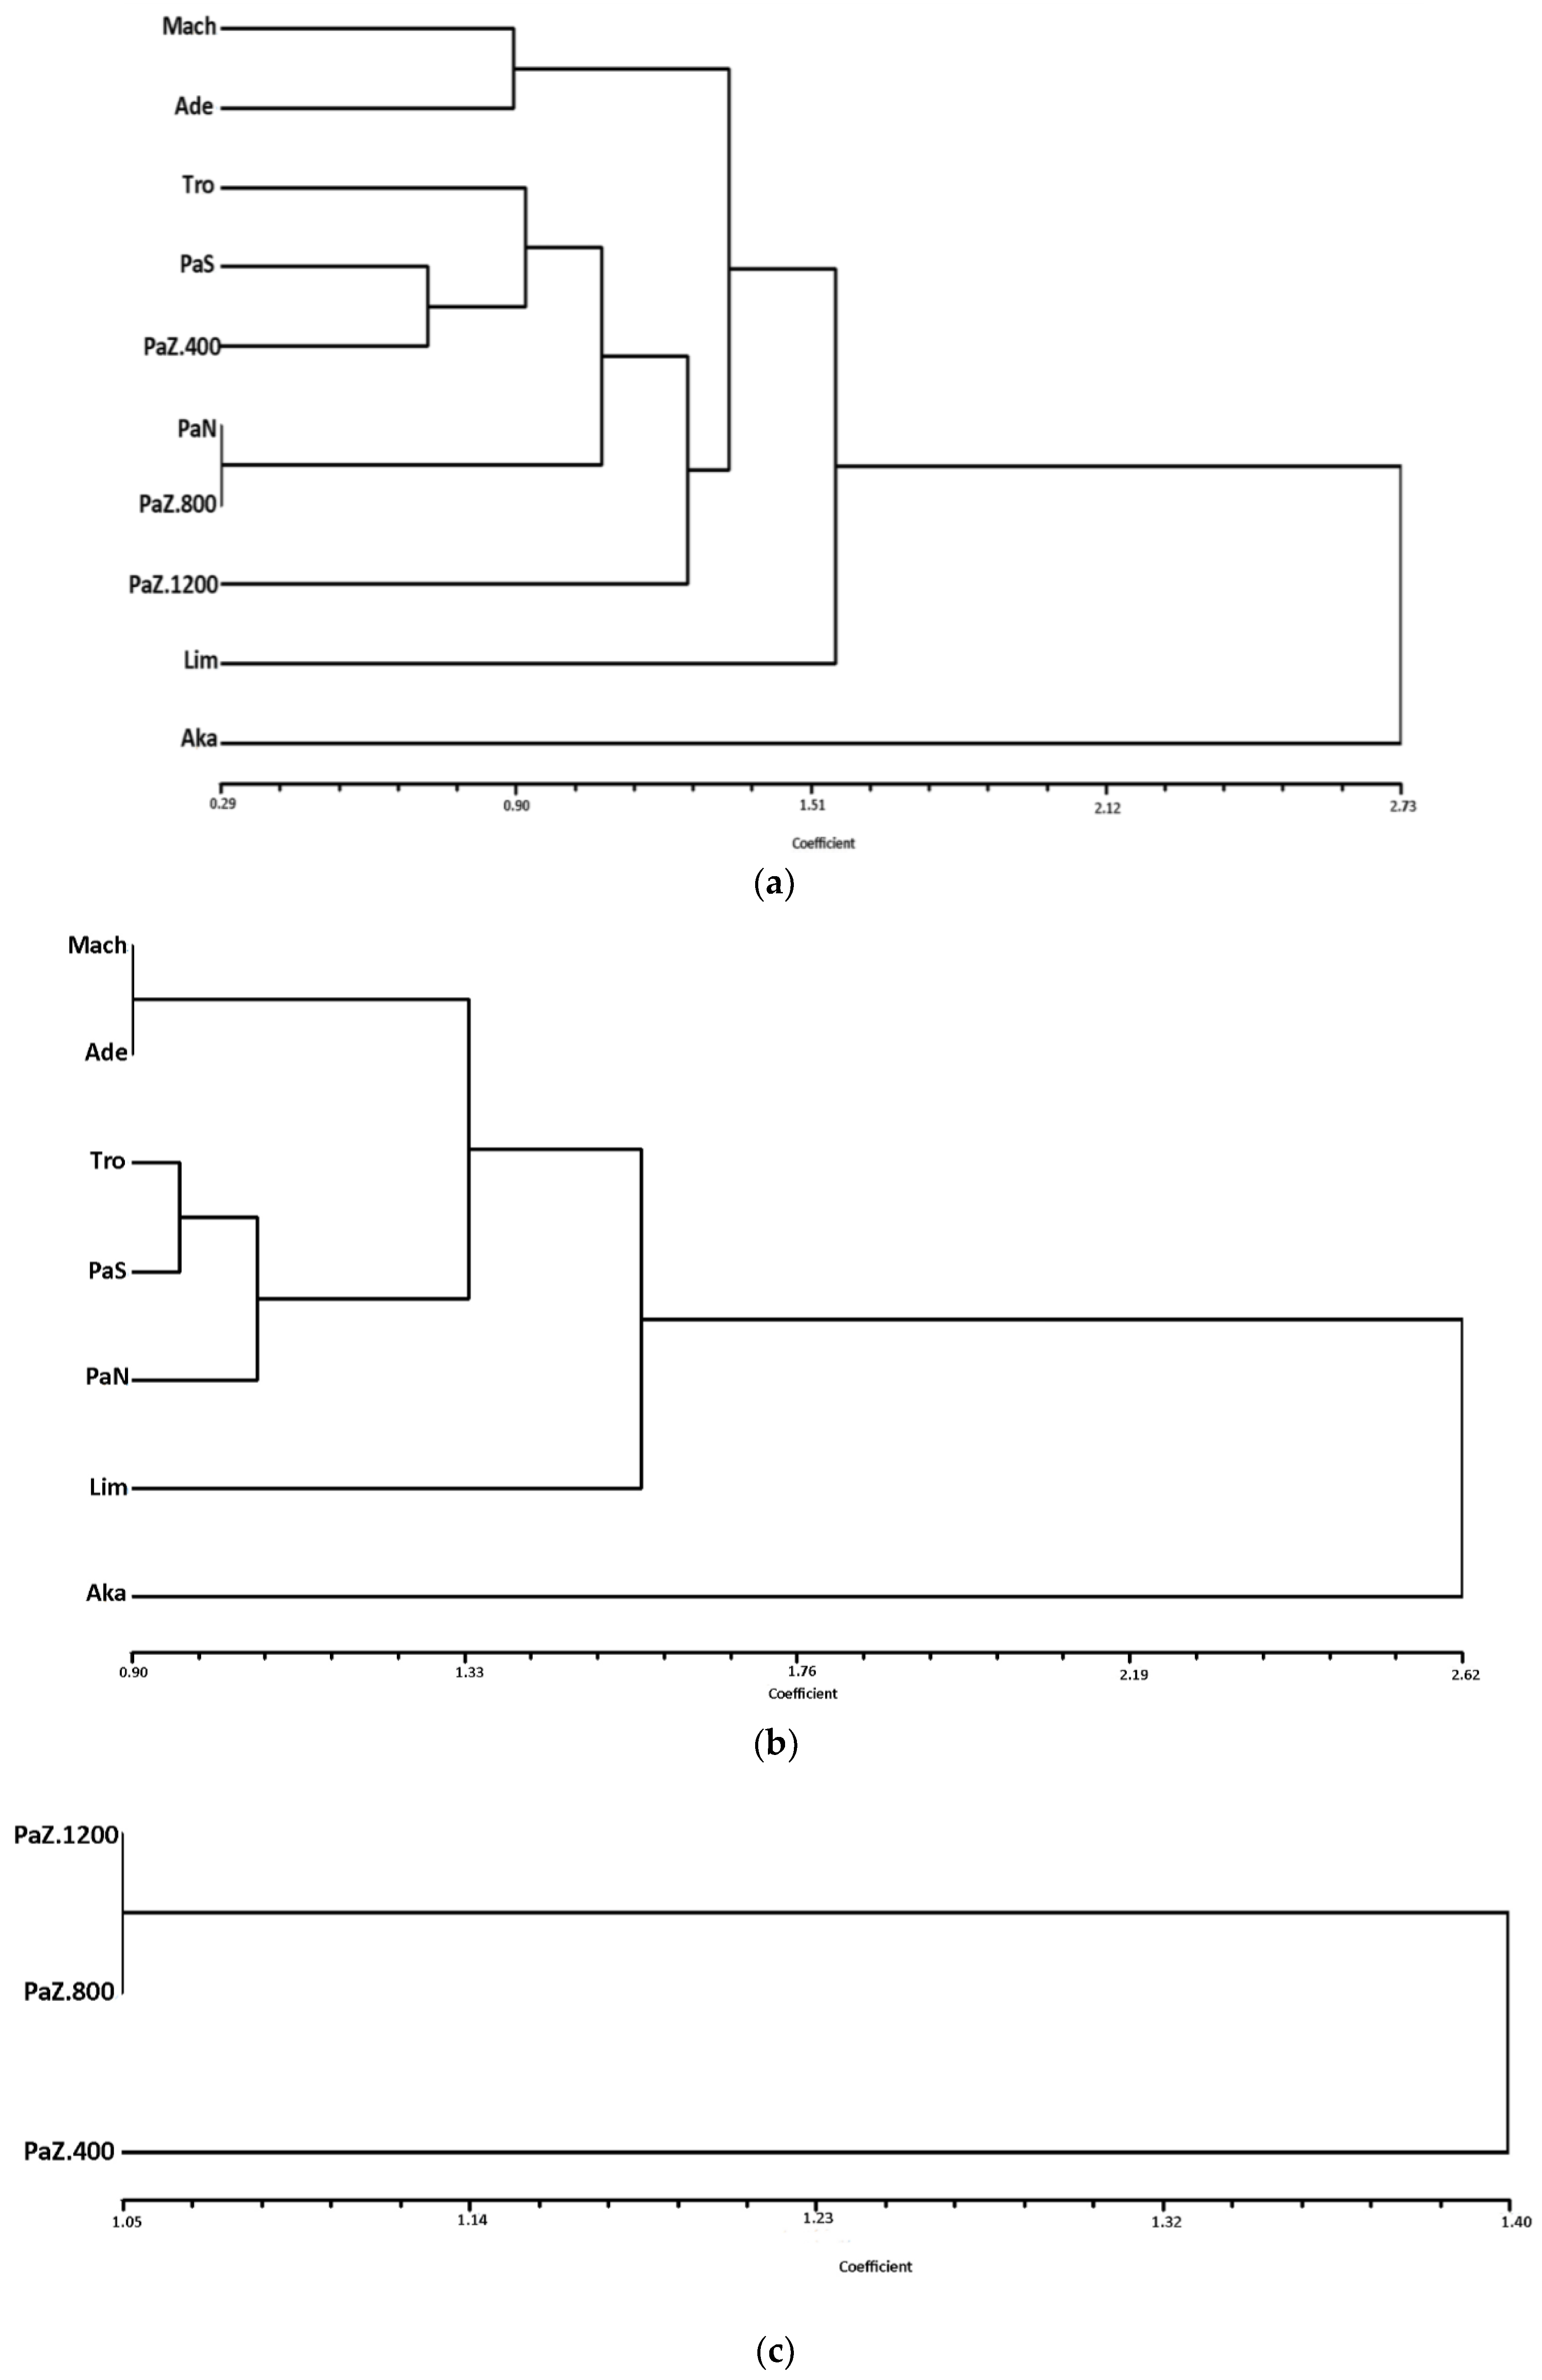
3.2. The Patterns of Morphoanatomical Diversity and Structure in P. brutia

Table 4 presents the statistical description of morphoanatomic traits of P. brutia in Cyprus. Aka and Lim presented the lowest values of morphological traits for cones and seeds, while cone and seed length and width increased from low to high elevation in the altitudinal analysis. In addition, needle morphoanatomical traits showed that needle length (NLen) is variable among sampled subpopulations, since Lim presented the lowest values (106 mm), while Ade and PaN presented the largest (131 mm and 128 mm, respectively). Aka showed the highest values of NWid (1.43 mm) and NThic (0.88 mm), while PaZ.800 showed the lowest values NWid (1.25 mm) and NThic (0.77 mm). Concerning needle anatomical traits, Aka presented the highest values for resin ducts (NResIn: 4.23; NResDO: 6.72; NResTot: 10.95) and PaS showed the lowest values (NResIn: 3.15; NResDO: 5.21; NResTot: 8.36). In addition, resin ducts appear to increase with the altitude zonation. Regarding the five anatomical traits of stomata, Aka, Lim, and Tro, presented lower values (measurements relative to stomata traits) than the other subpopulations.
The Spearman correlation among the investigated morphological and anatomical traits showed that 52 out of the 190 paired correlations (matrix table of 20 traits) are statistically significant for p-value > 95% (Table S4). Interestingly, significant correlations between needle size and the stomata rows, between cones traits as well as between the cone and seed traits, were found. Investigation on the association (Spearman correlation) between morphoanatomical traits and altitude, detected positive correlations for 12 out of the 20 traits; namely 10 correlations were positively significant and two negatively significant (Table 5). Despite the fact that the correlation coefficient is relatively low, the analysis showed a significant increase of the size of specific traits (e.g., morphological traits for cone and seed; morphoanatomical traits: NShLen, NResTot, and NStom) as the altitudinal subpopulations increased from the PaZ.400 to PaZ.1200. The identification of the traits that contribute more significantly in the overall phenotypic variation observed was investigated by PCA. The use of the eingenvalues (e.g., Kaiser’s criterion), reduced the dimension of the 20 morphoanatomical traits to nine axes (for components see Table 6), of which the first six explain 97% of the total variance (Table 6). The first axis presents strong correlations with the initial variable expression of NWid, NThic, and SLen, explaining 40.60% of the total morphological variance. The second axis, accounting for 27.90% of the total variation, was associated with traits NLen and NStom, while the third axis interpreted 14% of the total variation, with NShLen and SWid to be the associated traits for this axis. The next three axes accounted for 14.6% of the overall variation, and were associated with the anatomical traits (stomata and resin ducts) and with the morphological traits of cones and seeds (Table 6). Furthermore, a morphoanatomical Euclidean distance matrix (Table S3) among the sampled subpopulations was produced using the PCA first six axes. The subpopulation analysis showed that the highest morphoanatomical distance was recorded between Aka and PaZ.800 (3.188) and the lowest between PaS and PaZ.800 (0.292). On the other hand, based on the altitudinal subpopulations, the morphoanatomical distance between PaZ.400 and PaZ.1200 was the highest (1.482) distance occurring compared to the other morphoanatomical distances recorded between the PaZ.800 (middle range) and the other altitudinal subpopulations (Table S2). The illustration of these distances in a UPGMA dendrogram indicated a specific grouping pattern (Figure 5). The subpopulations from Pafos forest (PaN, PaS, PaZ.400, PaZ.800, and PaZ.1200) and Tro shaped a clear geographically defined group and formed a common clade. The other clade was built by the Mach and Ade subpopulations. The geographically isolated subpopulations of Lim and Aka were incorporated in two different (separate) clades on the dendrogram. With regards to the altitude gradient subpopulations analysis, and contrary to the UPGMA based on genetic distances, the morphoanatomical Euclidean distances were lower between PaZ.400 and PaZ.800, whereas the PaZ.1200 was grouped in a single clade (Figure 5).
In the alternative grouping pattern (using the back-grouping method), 37.2% of the initial observations (sampled trees) were back-grouped in the original sampled subpopulations. Despite the overall relatively low percentage of classification, Aka was the subpopulation with the highest value of back-grouping (82.7%), while in the other geographically disjunct subpopulations of Lim and Mach the percentage of return was 51.7% and 48.3%, respectively. On the contrary, the subpopulations PaN and PaS presented a low percentage of back-grouping (Figure 6).
Finally, in the present study there does not seem to be a significant correlation (p > 0.05) between the genetic distance (Nei’s minimum distance) and morphoanatomical Euclidean distance, for any of the three levels of analysis, as these are classified as (i) all sampled subpopulations, (ii) range-wide subpopulations, and (iii) altitudinal subpopulations.

4. Discussion

4.1. P. brutia in Cyprus as a Source of Peripheral and Marginalforest Genetic Resources

To the authors’ knowledge, this study represents one of the few cases of genetic and morphoanatomic analysis, considering a refined longitudinal, latitudinal, and altitudinal sampling in an island environment. In such a geographically peripheral and ecologically marginal environment, an overview argument supports that numerous factors may influence the patterns of genetic diversity and population structure in a peripheral population, including phylogeographical constraints, meta-population dynamics, refugium, and autochthonous origin [48,49].
The loci used conform to Mendelian inheritance in agreement with previous studies on Pinus sp. for the same isoenzyme loci [50,51]. The observed total genetic diversity (HE) was HE = 0.220; a value relatively higher than the mean genetic diversity (HE = 0.118) found at the P. brutia subsp brutia in the east Mediterranean Basin (incl. populations from Greece, Cyprus, and Asia Minor) [52] and slightly lower than the genetic diversity of the neighboring population in the mainland in the northern part of Asia Minor where HE = 0.265 [53] using isoenzyme loci. The higher number of rare alleles recorded in the Cyprus population of P. brutia, for specific loci (i.e., loci: AAT, PGI, LAP, 6PGD, IDH, and MNR), compared to the populations from its continuous range [52,54,55], implies that the P. brutia peripheral population in Cyprus contains unique genetic variants due to its distinctive evolutionary history. Thus, this population can be appreciated as a living gene bank for forest genetic resources for this species.
The nonsignificant inbreeding coefficient values observed in the two populations (Aka and PaZ.800), in conjunction to the presence of Hardy–Weinberg equilibrium, support the general argument, as in most conifers, of a random mating system. These results indicate that these two subpopulations (which showed reverse ecological and demographic features) are not characterized by a founder effect and have not been affected by strong bottleneck events. Hence, the P. brutia forest in Cyprus may have been somewhat preserved from genetic bottlenecks; especially during displacement and confinement of populations in Pleistocene glaciations, or by raised water levels during intervening warm periods as this event has been observed for several species in Europe [12,56].
The above arguments are also supported by the comparison of several morphoanatomical traits from the present study and other studies on P. brutia populations from other islands (i.e., Rodos, Crete, etc.) and/or populations of larger origins (continuous populations). The coefficient of variation (CV) [57,58] and the mean values [57,58,59] for numerous morphoanatomical traits show similarities between the populations of Cyprus and those from other origins, which implies that the morphological and anatomic traits of the former are not affected by restriction of genetic diversity and genetic drift (or strong inbreeding events). A remarkable observation on Cypriot P. brutia is the significant correlation between morphological and anatomical traits (Table S4). This morphoanatomic association in this rear-edge population could be a consequence of macro-environmental differentiation from the continuous distribution range of the species. Such adaptive needle traits have been mentioned for other coniferous species [60]. Often the acclimation to their environment leads to the development of specific adaptive phenotypic responses by altering their length, width, number of stomata, their angle towards the shoot, or by forming needle clumping [61,62,63,64]. In the current study, the correlation between NLen and Nstom, indicates that long needles are associated with a high number of stomata, an observation which could be a relative advantage for Cypriot P. brutia, providing effective resilience and adaptability for this peripheral population in different environmental conditions.

4.2. Patterns of Genetic Diversity of P. brutia in Cyprus

A nonuniform genetic diversity distribution across longitudinal, latitudinal, and altitudinal distributions was detected. Genetic variation among subpopulations is most likely a consequence of different demographic and evolutionary events. The intensive and negative impact of human activities on forests resilience and the deforestations in Cyprus, since the first human presence (11th millennium B.C.), is well-known [65,66]. During the Ottoman period (1570–1878 A.C.) reported goat stocking rates [67] are far above the forest carrying capacity, while the Cypriot forests were repeatedly logged in order to cover the energy needs of Bronze Age copper production (c. 3300–1200 BC) [68]. These historical facts may reasonably be linked to the fragmentation of P. brutia forest and lead to negative pressures on genetic variability within specific relic subpopulations, and consequently to different genetic variation patterns. Thus, the divergence of genetic variation (HE) and effective number of alleles (Ne) between subpopulations, seems to be linked to high past anthropogenic pressure, particularly for subpopulations located in peripheral and more isolated forests (Aka, Lim, and Mach) where the pressure was higher (see Figure 1 and Table 2).
The clustering of subpopulations in two groups (Structure analysis; K = 2) and the detection of significant genetic differentiation among the subpopulations (AMOVA, see Table 3), alongside with the unclear geographic clustering of subpopulations from UPMGA and PCoA, could be attributed either to the fragmentation of an earlier larger and uniform population, or to the fact that the present forests are relics of previously differentiated populations of P. brutia. This question could not be directly answered by the present study, as more powerful molecular markers may be needed, for a more clear estimation of the best K-clustering of P. brutia in Cyprus. Meanwhile, the existence of landscape barriers to effective gene flow among the current subpopulations, shape genetic differentiation through generations.
Comparison of the genetic differentiation values (PhiPT = GST = 0.129) between this and other studies reveals that a notably higher level of differentiation was observed in the case of P. brutia in Cyprus. In particular, populations of P. brutia originating from islands of the north-eastern Aegean sea showed GST = 0.021 [55], whereas populations from south Asia Minor (GST = 0.053) support the previous argument that rear-edge populations shape disproportionately high levels of genetic differentiation present even between geographically proximal ones, leading to exceptionally high levels of regional genetic diversity, than the populations of the continuous range [12,69,70,71].
Fingerprinting of the genetic diversity in Pafos forest allowed assessing the impact of local landscape on genetic patterns. Despite the fact that the comparison of northeast and southwest (aspect) subpopulations detected equal expected heterozygosity (HE = 0.228 and HE = 0.220, respectively), a low but significant genetic differentiation was detected (PhiPT = 0.012). Moreover, the three altitude gradient subpopulations showed significant but low differentiation (PhiPT = 0.018) and structure (K = 3); while the middle altitude gradient subpopulation (PaZ.800) recorded the highest genetic diversity (HE = 0.244) (Table 2). The highest value of HE was found in PaZ.800, being also the highest value among all subpopulations in Cyprus. This result is in concordance with other studies regarding P. brutia, particularly in the Taurus mountains, where the middle altitude zone recorded a higher genetic diversity than other zones [53]. The significant differentiation among the three altitude gradient subpopulations could be attributed to a combination of anthropogenic activities and small scale disturbance, or to the processing of different genetic evolutionary factors within each subpopulation (at local microscale), after their last postglaciation separation. An alternative explanation, could be altitudinal movements amplified by local topography (upward and downward movement within a single mountain region) during Pleistocene glaciations and interglaciations. Such an option has been presented for Euro-Mediterranean ecosystems [70], and is supported for instance by the findings on Cedrus brevifolia, a narrow endemic tree in Cyprus [72]. Therefore, this shift at different altitudinal gradient zones (i.e., ecological niche) during interglaciation and postglaciation periods is potentially the reason for the formation of an admixture zone. Alternatively, the significant differentiation among the altitude gradient subpopulations could be attributed to the processing of different evolutionary factors at microscale, after their last postglaciation partition.
The hypothesis of local (microenvironmental) adaptation dynamics is supported by relevant literature which demonstrates several examples of wild populations on ecologically marginal sites (i.e., altitudinal gradients, and different ecological aspects) [73,74,75,76] and further reinforced by the presence of altitudinal clinal variation in P. brutia in the various morphoanatomical traits, since significant positive correlation between traits and altitudinal variation was detected (discussed below).

4.3. Patterns of Morphoanatomical Traits of P. brutia in Cyprus

The sampled subpopulations exhibit varying degrees of diversity in the 20 morphoanatomical traits studied, in relation to the longitudinal or the altitudinal gradient. In particular, morphological and anatomical traits constituted powerful tools for describing the phenotypic diversity and structure in the present study. The interpretation of the morphoanatomical trait diversity patterns, suggests that the observed diversity and structure, possibly are the result of the manifestation of phenotypic plasticity at different micro-environments. High phenotypic plasticity, leads to the species being distributed in a wider geographical and ecological range. The morphoanatomical traits detected a similar range of values between the populations of Cyprus and those from other origins, which bring the notion of the connection of phenotypic plasticity to genetics (see a previous paper [77]) and to the underlying quantitative trait loci variation that shapes phenotypic patterns. Phenotypic plasticity is reflected in: (i) the clustering of sampled subpopulations in a morphoanatomical dendrogram (Figure 5) where clustering of the subpopulations is concordant to their geographical origin, a relation not seen in the genetic data; and (ii) the back-grouping method results (Figure 6), in which the isolated subpopulations illustrated the highest value of back-grouping (Aka, Lim, and PaZ.1200). Phenotypic plasticity among subpopulations could be a consequence of different reaction norms, where a set of phenotypes can be produced by an individual genotype when exposed to different environmental conditions, such as different soil type and meteorological conditions. Furthermore, phenotypic plasticity is manifested in the positive significant clinal variation of the morphoanatomical traits in the altitudinal range subpopulations (PaZ.400, PaZ.800, PaZ.1200). This clinal variation across the altitudinal range may be due to trade-offs between plasticity and stress tolerance in harsh environments, as indicated for other species [78,79,80]. Thus, P. brutia from Cyprus showed an increased number of resin ducts and stomata per needle, as well as the largest size of cones and seeds as the altitude increased within the mountain elevation gradient.
The morphoanatomical trait patterns observed could be the consequence of isolation and phenotypic plasticity seen over different environmental gradients. A similar interpretation was also invoked in analyses of other peripheral populations of the same species in Crete [58], in other tree species, such as Abies cephalonica in Mt. Parnitha [81] and Fagus sp. in western Eurasia [82]. Therefore, this study further supports the notion that the evolution of plasticity increases the response to selection, thus reducing maladaptation induced by gene flow (see previous works [83,84]). The same studies support that, in interaction with local population growth, the evolving plasticity allows a species to occupy a larger geographical range, presenting higher plasticity in marginal than in central habitats [84].
The morphological and anatomical diversity of P. brutia in Cyprus is greatly dependent on a number of needle (NWid, NThic, NLen, NStomRow, and NShLen) and seed (SLen and Swid) traits, with high loadings in the first three axes of PCA where 82.5% of the total variance measured is explained (Table 6). In addition, the significant correlation between specific traits, such as needle size (i.e., between length and width), needle morphology, and anatomy (i.e., between length or width of needle and resin ducts or stomata), and cone size with seed size (i.e., between cone width and total length of seed and wing), probably implies that the species developed mechanisms and characters that permit different morphological and anatomical harvesting strategies. Peripheral subpopulations (i.e., Lim, Aka, and PaS) appear to develop different mechanisms to survive in different micro-environments. They are characterized by short, wide, thick needles (especially Aka), which function as an adaptation mechanism (morphological features) in dry sites [85]. The Aka and the PaZ.1200 (the subpopulation at the highest altitude) present the highest number of resin ducts. This feature is linked to a plant species mechanism under extreme environment conditions (dry or cold), since resin ducts seem to protect vascular tissues and ground tissues in most species [85,86]. Alternatively stomata numbers are low at the driest micro-environments (subpopulations: Aka, Lim, and Tro), which implies a development of adaptation mechanisms against water loss in the summer. Similar adaptation mechanisms to dry environments were recorded in other studies [81,85]. Cone and seed size was smaller in peripheral, drier, and ecologically degraded subpopulations (Aka, Lim), while the opposite results were observed in subpopulations of higher altitude, where the same traits present clinal variation. These patterns were also observed in other studies of P. brutia and have been attributed to ecological factors, in particular to the brief sprouting period which is coupled to low temperatures [58,85]. Such factors are apparently present in this study, particularly at a higher altitude.

5. Conclusions and Perspectives of Conservation Action

5.1. Inferences from the Study of a Mediterranean Oceanic Island’s Peripheral Tree Population

The population of P. brutia in Cyprus is an example of an isolated (both geographically and ecologically) island peripheral population, whose patterns of genetic diversity were shaped by past demographic and ecological stochasticity. The detection of high genetic diversity of P. brutia in Cyprus may respond to more stable effective population sizes in eastern Mediterranean forest tree populations as argued for Mediterranean conifers by Fady [8]. This study likely constitutes an example of a peripheral forest tree population that does not tend towards genetic erosion, neither towards increased inbreeding or genetic drift, when compared to core populations. These findings are contrary to earlier observations that peripheral tree populations showed genetic erosion and elevated inbreeding leading to genetic drift, in comparison to core populations [87,88,89]. The detection of significant genetic structure (Bayesian and AMOVA) among geographically sampled subpopulations shows that the population of P. brutia in Cyprus is not genetically homogeneous, comprising of genetically different subpopulations. Thus, ongoing genetic evolution dynamic processes seem to occur within the study population, in spite of its small geographical distribution within an island.
In the present study, the peripheral population of P. brutia presented a similar value range regarding morphoanatomical traits, to populations from other origins in the Mediterranean Basin (island and mainland). This is in contrast to earlier findings suggesting that in peripheral populations’ phenotypic trait descriptive statistics, show different values from those found in core populations, indeed for a limited range of traits usually related to growth [90]. The phenotypic plasticity that was observed in the present study is of particular importance for the adaptive potential of the targeted population in an island environment. Such phenotypic plasticity, especially for long-lived plants, is particularly important since it allows wild organisms to accommodate rapid change in local environmental conditions [91,92].

5.2. Future Conservation Actions

Nowadays the argument that peripheral forest tree populations need to be managed under an evolution-oriented forestry [10,93,94] is gaining ground. In the case of Cyprus, where the consequences of climate change will lead to the increase of the mean annual temperature and to the decrease of the mean annual precipitation [95], it is crucial to develop and adopt a rational and sustainable management plan for the P. brutia forest, characterized by compatible management of the habitat, together with genetic conservation. Thus, dynamic conservation of the target species need to be ensured at two levels: (i) in situ conservation by establishing a conservation unit within each of the sampled subpopulations where the germplasm will be protected and the natural regeneration will be safeguarded and (ii) ex situ conservation by maintaining (or establishing) seed orchards. In addition to these conservation measures, the sampled subpopulations from this study could be delineated as seed zones or provenance regions, whereas seedlots from each subpopulation need to be sampled and stored in seed banks. Also, the existing provenance trials should be maintained and evaluated, while new ones should be established at different phytosociological associations within the island according to the present study’s outcomes. Critical for the sustainable management of P. brutia genetic resources is the collection and use of local genetic material for seed sowing and for seedling production in postfire restoration programs. Especially for subpopulations that show low genetic diversity (i.e., Aka, and PaZ.1200) the seed material must be collected from the whole range of their distribution; collected bulked seed materials should then be used towards implementing postfire management plans.

Supplementary Materials

The following are available online at https://www.mdpi.com/1999-4907/9/9/514/s1, Table S1: Patterns of genetic variation at single-locus level for each sampled subpopulation; Table S2: Assessment of Mendelian inheritance in P. brutia from Cyprus. (For loci where the analysed megagametophytes were lower than 18, the X2 was not calculated.); Table S3: Pairwise genetic distance among sampled subpopulations based on Nei’s minimum distance (below the diagonal) and pairwise morphoanatomical Euclidean distance (above diagonal); Table S4: Assessment of correlation (Spearman correlation test) signal among the investigated morphological and anatomical traits.

Author Contributions

The manuscript was collectively written and edited by N.-G.H.E., F.(P.)A.A. and A.K.C. and is a part of the doctorate research of A.K.C., referenced as: “A.K.C. Assessment of genetic variation of Pinus brutia in Cyprus. Ph.D. Thesis, Faculty of Agriculture, Forestry and Natural Environment, Aristotle University of Thessaloniki, Greece, 2000”.

Funding

This research received no external funding.

Acknowledgments

This manuscript was elaborated under the framework of research tasks of projects: V4-1438, V4-1614, COST Action FP1202 “Strengthening conservation: a key issue for adaptation of marginal/peripheral populations of forest trees to climate change in Europe (MaP-FGR)”. The authors wish to thank the Cyprus Department of Forests for the valuable help in sampling. In addition, the authors would like to dedicate this paper to Prof. Kostas Panetsos. Prof. Kostas Panetsos has been a mentor for A.K.C. and F.(P.)A.A. and a prominent figure for forest genetics research in the south-eastern Mediterranean region. He was among the first who stressed the importance of the conservation of forest genetic resources and conceived studies on local adaptation, the topic of this work.

Conflicts of Interest

The authors declare no conflicts of interest.

References

  1. Médail, F.; Myers, N. Mediterranean Basin. In Hotspots Revisited: Earth’s Biologically Richest and Most Endangered Terrestrial Ecoregions; Mittermeier, R.A., Robles-Gil, P., Hoffmann, M., Pilgrim, J., Brooks, T., Mittermeier, C.G., Lamoreux, J., da Fonseca, G.A.B., Eds.; CEMEX: Monterrey, Mexico; Conservation International: Washington, DC, USA; Agrupación Sierra Madre: Mexico City, Mexico, 2004; pp. 144–147. [Google Scholar]
  2. Noss, R.F.; Platt, W.J.; Sorrie, B.A.; Weakley, A.S.; Means, D.B.; Costanza, J.; Pee, R.K. How global biodiversity hotspots may go unrecognized: Lessons from the North American Coastal Plain. Divers. Distrib. 2015, 21, 236–244. [Google Scholar] [CrossRef]
  3. Vogiatzakis, I.N.; Pungetti, G.; Mannion, A.M. Mediterranean Island Landscapes: Natural and Cultural Approaches, Landscape Series; Springer Science & Business Media: New York, NY, USA, 2008; Volume 9. [Google Scholar]
  4. Médail, F. The specific vulnerability of plant biodiversity and vegetation on Mediterranean islands in the face of global change. Reg. Environ. Chang. 2017, 17, 1775–1790. [Google Scholar] [CrossRef] [Green Version]
  5. Whittaker, R.J.; Fernández-Palacios, J.M. Island Biogeography, Ecology, Evolution, and Conservation, 1st ed.; Oxford University Press: New York, NY, USA, 2007. [Google Scholar]
  6. Mansion, G.; Rosenbaum, G.; Schoenenberger, N.; Bacchetta, G.; Rosselló, J.A.; Conti, E. Phylogenetic analysis informed by geological history supports multiple, sequential invasions of the Mediterranean Basin by the angiosperm family Araceae. Syst. Biol. 2008, 57, 269–285. [Google Scholar] [CrossRef] [PubMed]
  7. Rosselló, J. A perspective of plant microevolution in the Western Mediterranean islands as assessed by molecular markers. In Proceedings of the Islands and Plants: Preservation and Understanding of Flora on Mediterranean Islands, 2nd Botanical conference in Menorca, Maó, Spain, 26–30 April 2011; Cardona Pons, E., Estaún Clarisó, I., Comas Casademont, M., Fraga i Arguimbau, P., Eds.; Institut Menorquı’ d’Estudis: Illes Balears, Spain, 2013; pp. 21–34. [Google Scholar]
  8. Fady, B. Is there really more biodiversity in Mediterranean forest ecosystems? Taxon 2005, 54, 905–910. [Google Scholar] [CrossRef]
  9. Fady, B.; Conord, C. Macroecological patterns of species and genetic diversity in vascular plants of the Mediterranean basin. Divers. Distrib. 2010, 16, 53–64. [Google Scholar] [CrossRef]
  10. Fady, B.; Aravanopoulos, F.A.; Alizoti, P.; Mátyás, C.; von Wühlisch, G.; Westergren, M.; Belletti, P.; Cvjetkovic, B.; Ducci, F.; Huber, G.; et al. Evolution-based approach needed for the conservation and silviculture of peripheral forest tree populations. For. Ecol. Manag. 2016, 375, 66–75. [Google Scholar] [CrossRef]
  11. Alleaume-Benharira, M.; Pen, I.R.; Ronce, O. Geographical patterns of adaptation within a species’ range: Interactions between drift and gene flow. J. Evol. Biol. 2006, 19, 203–215. [Google Scholar] [CrossRef] [PubMed]
  12. Hampe, A.; Petit, R.J. Conserving biodiversity under climate change: The rear edge matters. Ecol. Lett. 2005, 8, 461–467. [Google Scholar] [CrossRef] [PubMed] [Green Version]
  13. Ohsawa, T.; Ide, Y. Global patterns of genetic variation in plant species along vertical and horizontal gradients on mountains. Glob. Ecol. Biogeogr. 2008, 17, 152–163. [Google Scholar] [CrossRef] [Green Version]
  14. Panetsos, C.P. Monograph of Pinus halepensis (Mill.) and Pinus brutia (Ten.). Annu. For. 1981, 9, 39–77. [Google Scholar]
  15. Emberger, L.; Gaussen, H.; Kassa, A.; De Phillips, A. Bioclimatic Map of the Mediterranean Zone: Ecological Study of the Mediterranean Zone; UNESCO-FAO: Paris, France, 1963; 58p. [Google Scholar]
  16. Fady, B.; Semerci, H.; Vendramin, G.G. EUFORGEN Technical Guidelines for Genetic Conservation and Use for Aleppo pine (Pinus halepensis) and Brutia pine (Pinus brutia); Bioversity International: Rome, Italy, 2003. [Google Scholar]
  17. Selik, M. Botanical investigation on Pinus brutia especially in comparison with P. halepensis, Istanbul Univ. Fac. For. J. 1958, 8, 161–198. [Google Scholar]
  18. Mirov, N.T. The Genus Pinus; The Roland Press Company: New York, NY, USA, 1967; pp. 252–254. [Google Scholar]
  19. Oppenheimer, H.R. Mechanisms of Drought Resistance in Conifers of the Mediterranean Zone and the Arid West of the U.S.A. Part 1. Physiological and Anatomical Investigations; Final Report on Project No. A 10-FS 7, Grant No. FG-Is-119; Hebrew University of Jerusalem: Rehovot, Israel, 1967; 73p. [Google Scholar]
  20. Spencer, D. Conifers in the Dry Countries; A Report for the RIRDC/L&W Australia/FWPRDC Joint Venture Agroforestry Program, RIRDC Publication No. 01/46; Rural Industries Research and Development Corporation: Kingston, Australia, 2001. [Google Scholar]
  21. Zohary, M. Geobotanical Foundation of the Middle East; Gustav Fischer Verlag: Stuttgart, Germany, 1973; 740p. [Google Scholar]
  22. Barbéro, M.; Loisel, R.; Quézel, P.; Richardson, D.M.; Romane, F. Pines of the Mediterranean Basin. In Ecology and Biogeography of Pinus; Richardson, D.M., Ed.; Cambridge University Press: Cambridge, UK, 1998; pp. 153–170. [Google Scholar]
  23. Isik, K. Altitudinal variation in Pinus brutia Ten.: Seed and seedling characteristics. Silvae Genet. 1986, 35, 58–67. [Google Scholar]
  24. Bariteau, M. Variabilité géographique et adaptation aux contraintes du milieu méditerranéen des pins de la section halepensis: Resultants (provisoires) d’ún essai en plantations comparatives en France. Annu. Sci. For. 1992, 49, 261–276. [Google Scholar] [CrossRef]
  25. Souvannavong, O.; Malagnoux, M.; Palmberglerche, C. Nations join to conserve forests and woodlands of the Mediterranean region. Diversity 1995, 11, 19–20. [Google Scholar]
  26. Spencer, D.J. Dry country pines: Provenance evaluation of the Pinus halepensis-P. brutia complex in the semi-arid region of south-east Australia. Aust. For. Res. 1985, 15, 263–279. [Google Scholar]
  27. Boydak, M. Silvicultural characteristics and natural regeneration of Pinus brutia Ten.—A review. Plant Ecol. 2004, 171, 153–163. [Google Scholar] [CrossRef]
  28. Kurt, Y.; González-Martínez, S.C.; Alía, R.; Isik, K. Genetic differentiation in Pinus brutia Ten. using molecular markers and quantitative traits: The role of altitude. Annu. For. Sci. 2012, 69, 345–351. [Google Scholar] [CrossRef]
  29. Department of Forests. Criteria and Indicators—For the Sustainable Forest Management in Cyprus; Ministry of Agriculture, Natural Resources and Environment: Nicosia, Cyprus, 2006.
  30. Barber i Valles, A. Contribution to the Knowledge of the Bioclimate and Vegetation of the Island of Cyprus; Cyprus Forestry College: Nicosia, Cyprus, 1995. [Google Scholar]
  31. Pantelas, V. The Bioclima and Phytosociology in Cyprus; Report in Department of Forests, Ministry of Agriculture, Natural Resources and Environment: Nicosia, Cyprus, 1996.
  32. Shen, H.; Rudin, D.; Lindgren, D. Study of the pollination pattern in a scots pine seed orchard by means of Isozyme Analysis. Silvae Genet. 1981, 30, 7–15. [Google Scholar]
  33. Conkle, M.T.; Hodgkiss, P.D.; Nunnally, L.B.; Hunter, S.C. Starch Gel Electrophoresis of Conifer Seeds, A Laboratory Mannual; Gen. Techn. Rep. PSW-64; Pacific Southwest Forest and Range Experiment Station: Berkeley, CA, USA, 1982. [Google Scholar]
  34. Cheliak, W.M.; Pitel, J.A. Genetic control of allozyme variants in mature tissues of white spruce trees. J. Hered. 1984, 75, 34–40. [Google Scholar] [CrossRef]
  35. Nei, M. F-statistics and analysis of gene diversity in subdivided populations. Annu. Hum. Genet. 1977, 41, 225–233. [Google Scholar] [CrossRef]
  36. Nei, M. Estimation of average heterozygosity and genetic distance from a small number of individuals. Genetics 1978, 89, 583–590. [Google Scholar] [PubMed]
  37. Peakall, R.; Smouse, P.E. GenAlEx 6.5: Genetic analysis in Excel. Population genetic software for teaching and research-an update. Bioinformatics 2012, 28, 2537–2539. [Google Scholar] [CrossRef] [PubMed]
  38. Pritchard, J.K.; Stephens, M.; Donnelly, P. Genetics Society of America Inference of Population Structure Using Multilocus Genotype Data. Genetics 2000, 155, 945–959. [Google Scholar] [PubMed]
  39. Evanno, G.; Regnaut, S.; Goudet, J. Detecting the number of clusters of individuals using the software STRUCTURE: A simulation study. Mol. Ecol. 2005, 14, 2611–2620. [Google Scholar] [CrossRef] [PubMed]
  40. Kopelman, N.M.; Mayzel, J.; Jakobsson, M.; Rosenberg, N.A.; Mayrose, I. CLUMPAK: A program for identifying clustering modes and packaging population structure inferences across K. Mol. Ecol. Res. 2015, 15, 1179–1191. [Google Scholar] [CrossRef] [PubMed]
  41. Nei, M. Genetic distance between populations. Am. Nat. 1972, 106, 283–292. [Google Scholar] [CrossRef]
  42. Miller, M.P. Tools for Population Genetic Analyses (TFPGA) Version 1.3—A Windows Program for the Analysis of Allozyme and Molecular Population Genetic Data; Northern Arizona University: Flagstaff, AZ, USA, 1997. [Google Scholar]
  43. Rohlf, F.J. NTSyS-p.c: Numerical Taxonomy and Multivariate Analysis System, version 2.0; Exeter Software Publishers Ltd.: Setauket, NY, USA, 1998. [Google Scholar]
  44. Breiman, L.; Friedman, J.; Olshen, R.; Stone, C. Classification and Regression Trees; Wadsworth International Group: Belmont, CA, USA, 1984. [Google Scholar]
  45. De’ath, G.; Fabricius, K.E. Classification and regression trees: A powerful yet simple technique for the analysis of complex ecological data. Ecology 2000, 81, 3178–3192. [Google Scholar] [CrossRef]
  46. Mantel, N.A. The detection of disease clustering and a generalized regression approach. Can. Res. 1967, 27, 209–220. [Google Scholar]
  47. Sokal, R. Testing statistical significance of geographic variation patterns. Syst. Zool. 1979, 28, 227–232. [Google Scholar] [CrossRef]
  48. Pujol, B.; Pannell, J.R. Reduced responses to selection after species range expansion. Science 2008, 321, 96. [Google Scholar] [CrossRef] [PubMed]
  49. Holt, R.D.; Keitt, T.H.; Lewis, M.A.; Maurer, B.A.; Taper, M.L. Theoretical models of species’ borders: Single species approaches. Oikos 2005, 108, 18–27. [Google Scholar] [CrossRef]
  50. Adams, W.T.; Joly, R.J. Genetics of allozyme variants in loblolly pine. J. Hered. 1980, 71, 33–40. [Google Scholar] [CrossRef]
  51. Morgante, M.; Vendramin, G.G.; Giannini, R. Inheritance and linkage relationships of isozymes variants of Pinus leucodermis Ant. Silvae Genet. 1993, 42, 231–237. [Google Scholar]
  52. Conkle, M.T.; Schiller, G.; Grunwald, C. Electrophoretic analysis of diversity and phylogeny of Pinus brutia and closely related taxa. Syst. Bot. 1988, 13, 411–424. [Google Scholar] [CrossRef]
  53. Kara, N.; Korol, L.; Isik, K.; Schiller, G. Genetic Diversity in Pinus brutia TEN.: Altitudinal Variation. Silvae Genet. 1997, 46, 2–3. [Google Scholar]
  54. Schiller, G.; Conkle, M.T.; Grunwald, C. Local differentiation among Mediterranean populations of Aleppo pine in their isoenzymes. Silvae Genet. 1985, 35, 11–19. [Google Scholar]
  55. Panetsos, K.P.; Aravanopoulos, F.; Scaltsoyiannes, A. Genetic Variation of Pinus brutia from Islands of the Northeastern Aegean Sea. Silvae Genet. 1998, 47, 2–3. [Google Scholar]
  56. van Staaden, M.J.; Michener, G.R.; Chesser, R.K. Spatial analysis of microgeographic genetic structure in Richardson’s ground squirrels. Can. J. Zool. 1996, 74, 1187–1195. [Google Scholar] [CrossRef]
  57. Panetsos, K.; Scaltsoyiannes, A.; Aravanopoulos, F.A.; Dounavi, K.; Demetrakopoulos, A. Identification of Pinus brutia TEN., P. halepensis MILL. and Their Putative Hybrids. Silvae Genet. 1997, 46, 253–257. [Google Scholar]
  58. Dangasuk, O.G.; Panetsos, K.P. Altitudinal and longitudinal variations in Pinus brutia (Ten.) of Crete Island, Greece: Some needle, cone and seed traits under natural habitats. New For. 2004, 27, 269–284. [Google Scholar] [CrossRef]
  59. Calamassi, R.; Puglisi, S.R.; Vendramin, G.G. Genetic variation in morphological and anatomical needle characteristics in Pinus brutia Ten. Silvae Genet. 1988, 37, 5–6. [Google Scholar]
  60. Tian, Μ.; Yu, G.; He, N.; Hou, J. Leaf morphological and anatomical traits from tropical to temperate coniferous forests: Mechanisms and influencing factors. Sci. Rep. 2016, 6, 19703. [Google Scholar] [CrossRef] [PubMed] [Green Version]
  61. Niinemets, Ü.; Cescatti, A.; Lukjanova, A.; Tobias, M.; Truus, L. Modification of light-acclimation of Pinus sylvestris shoot architecture by site fertility. Agric. For Meteorol. 2002, 111, 121–140. [Google Scholar] [CrossRef]
  62. Smolander, S.; Stenberg, P. A method to account for shoot scale clumping in coniferous canopy reflectance models. Remote Sens. Environ. 2003, 88, 363–373. [Google Scholar] [CrossRef] [Green Version]
  63. Niinemets, Ü. A review of light interception in plant stands from leaf to canopy in different plant functional types and in species with varying shade tolerance. Ecol. Res. 2010, 25, 693–714. [Google Scholar] [CrossRef]
  64. Gebauer, R.; Volařík, D.; Urban, J.; Børja, I.; Nagy, N.E.; Eldhuset, T.D.; Krokene, P. Effect of thinning on the anatomical adaptation of Norway spruce needles. Tree Physiol. 2011, 31, 1103–1113. [Google Scholar] [CrossRef] [PubMed]
  65. Knapp, B. Cyprus’s earliest prehistory: Seafarers, Forgers and Settlers. J. World Prehist. 2010, 23, 79–120. [Google Scholar] [CrossRef]
  66. Vigne, J.-D.; Briois, F.; Zazzo, A.; Willcox, G.; Cucchi, T.; Thiébault, S.; Carrère, I.; Franel, Y.; Touquet, R.; Martin, C.; et al. First wave of cultivators spread to Cyprus at least 10,600 y ago. Proc. Natl. Acad. Sci. USA 2012, 109, 8445–8449. [Google Scholar] [CrossRef] [PubMed] [Green Version]
  67. Thirgood, J.V. Cyprus, a Chronicle of Its Forest, Land, and People; University of British Columbia Press: Vancouver, BC, Canada, 1987. [Google Scholar]
  68. Geological Survey Department. The Geology of Cyprus; Article 10; Ministry of Agriculture, Natural Resources and Environment: Nicosia, Cyprus, 2002.
  69. Hampe, A.; Arroyo, J.; Jordano, P.; Petit, R.J. Range wide phylogeography of a bird-dispersed Eurasian shrub: Contrasting Mediterranean and temperate glacial refugia. Mol. Ecol. 2003, 12, 3415–3426. [Google Scholar] [CrossRef] [PubMed]
  70. Petit, R.J.; Aguinagalde, I.; de Beaulieu, J.L.; Bittkau, C.; Brewer, S.; Cheddadi, R.; Ennos, R.; Fineschi, S.; Grivet, D.; Lascoux, M.; et al. Glacial refugia: Hotspots but not melting pots of genetic diversity. Science 2003, 300, 1563–1565. [Google Scholar] [CrossRef] [PubMed]
  71. Martin, P.R.; McKay, J.K. Latitudinal variation in genetic divergence of populations and the potential for future speciation. Evolution 2004, 58, 938–945. [Google Scholar] [CrossRef] [PubMed]
  72. Eliades, N.-G.; Gailing, O.; Leinemann, L.; Fady, B.; Finkeldey, R. High genetic diversity and significant population structure in Cedrus brevifolia Henry, a narrow Mediterranean endemic tree from Cyprus. Plant Syst. Evol. 2011, 294, 185–198. [Google Scholar] [CrossRef]
  73. Gonzalo-Turpin, H.; Hazard, L. Local adaptation occurs along altitudinal gradient despite the existence of gene flow in the alpine plant species Festuca eskia. J. Ecol. 2009, 97, 742–751. [Google Scholar] [CrossRef]
  74. Sáenz-Romero, C.; Guzmán-Reyna, R.R.; Rehfeldt, G.E. Altitudinal genetic variation among Pinus oocarpa populations in Michoacán, Mexico Implications for seed zoning, conservation, tree breeding and global warming. For. Ecol. Manag. 2006, 229, 340–350. [Google Scholar] [CrossRef]
  75. Byars, S.G.; Papst, W.; Hoffmann, A.A. Local adaptation and cogradient selection in the Alpine plant, Poa hiemata, along a narrow altitudinal gradient. Evolution 2007, 61, 2925–2941. [Google Scholar] [CrossRef] [PubMed]
  76. Brousseau, L.; Postolache, D.; Lascoux, M.; Drouzas, A.D.; Källman, T.; Leonarduzzi, C.; Liepelt, S.; Piotti, A.; Popescu, F.; Roschanski, A.M.; et al. Local Adaptation in European Firs Assessed through Extensive Sampling across Altitudinal Gradients in Southern Europe. PLoS ONE 2016, 11, e0158216. [Google Scholar] [CrossRef] [PubMed]
  77. Forsman, A. Rethinking phenotypic plasticity and its consequences for individuals, populations and species. Heredity 2015, 115, 276–284. [Google Scholar] [CrossRef] [PubMed]
  78. Matyas, C.; Yeatman, C.W. Effect of geographical transfer on growth and survival of jack pine (Pinus banksiana Lamb.) populations. Silvae Genet. 1992, 41, 370–376. [Google Scholar]
  79. Körner, C. The use of “altitude” in ecological research. Trends Ecol. Evol. 2007, 22, 569–574. [Google Scholar] [CrossRef] [PubMed]
  80. Corcuera, L.; Cochard, H.; Gil-Pelegrin, E.; Notivol, E. Phenotypic plasticity in mesic populations of Pinus pinaster improves resistance to xylem embolism (P50) under severe drought. Trees 2011, 25, 1033–1042. [Google Scholar] [CrossRef]
  81. Papageorgiou, A.C.; Kostoudi, C.; Sorotos, I.; Varsamis, G.; Korakis, G.; Drouzas, A.D. Diversity in needle morphology and genetic markers in a marginal Abies cephalonica (Pinaceae) population. Annu. For. Res. 2015, 58, 217–234. [Google Scholar] [CrossRef]
  82. Denk, T.; Grimm, G.; Stögerer, K.; Langer, M.; Hemleben, V. The evolutionary history of Fagus in western Eurasia: Evidence from genes, morphology and the fossil record. Plant Syst. Evol. 2002, 232, 213–236. [Google Scholar] [CrossRef]
  83. Chevin, L.-M.; Collins, S.; Lefèvre, F. Phenotypic plasticity and evolutionary demographic responses to climate change: Taking theory out to the field. Funct. Ecol. 2013, 27, 966–979. [Google Scholar] [CrossRef]
  84. Chevin, L.M.; Lande, R. Adaptation to marginal habitats by evolution of increased phenotypic plasticity. J. Evol. Biol. 2011, 24, 1462–1476. [Google Scholar] [CrossRef] [PubMed] [Green Version]
  85. Tiwari, S.P.; Kumar, P.; Yadav, D.; Chauhan, D.K. Comparative morphological, epidermal, and anatomical studies of Pinus roxburghii needles at different altitudes in the North-West Indian Himalayas. Turk. J. Bot. 2013, 37, 65–73. [Google Scholar]
  86. Sheue, C.R.; Yang, Y.P.; Huang, L.L.K. Altitudinal variation of resin ducts in Pinus taiwanensis Hayata (Pinaceae) needles. Bot. Bull. Acad. Sin. 2003, 44, 305–313. [Google Scholar]
  87. Brown, J.H.; Stevens, G.C.; Kaufman, D.M. The geographic range: Size, shape, boundaries, and internal structure. Annu. Rev. Ecol. Syst. 1996, 27, 597–623. [Google Scholar] [CrossRef]
  88. Sagarin, R.D.; Gaines, S.D.; Gaylord, B. Moving beyond assumptions to understand abundance distributions across the ranges of species. Trends Ecol. Evol. 2006, 21, 524–530. [Google Scholar] [CrossRef] [PubMed]
  89. Eckert, C.G.; Samis, K.E.; Lougheed, S.C. Genetic variation across species’ geographical ranges: The centralmarginal hypothesis and beyond. Mol. Ecol. 2008, 17, 1170–1188. [Google Scholar] [CrossRef] [PubMed]
  90. Rehfeldt, G.E.; Tchebakova, N.M.; Parfenova, Y.I.; Wykoff, W.R.; Kuzmina, N.A.; Milyutin, L.I. Intraspecific responses to climate in Pinus sylvestris. Glob. Chang. Biol. 2002, 8, 912–929. [Google Scholar] [CrossRef]
  91. Schlichting, C.; Pigliucci, M. Phenotypic Evolution: A Reaction Norm Perspective; Sinauer Associates Incorporated: Sunderland, MA, USA, 1998. [Google Scholar]
  92. Sultan, S.E. Phenotypic plasticity for plant development, function and life-history. Trends Plant Sci. 2000, 5, 537–542. [Google Scholar] [CrossRef]
  93. Lefèvre, F.; Boivin, T.; Bontemps, A.; Courbet, F.; Davi, H.; Durand-Gillmann, M.; Fady, B.; Gaüzere, J.; Gidoin, C.; Karam, M.J.; et al. Considering evolutionary processes in adaptive forestry. Annu. For. Sci. 2014, 71, 723–739. [Google Scholar] [CrossRef]
  94. Aravanopoulos, F.A. Do silviculture and forest management affect the genetic diversity and structure of long-impacted forest tree populations? Forests 2018, 9, 355. [Google Scholar] [CrossRef]
  95. Hadjinicolaou, P.; Giannakopoulos, C.; Zerefos, C.; Lange, M.A.; Pashiardis, S.; Lelieveld, J. Mid-21st century climate and weather extremes in Cyprus as projected by six regional climate models. Reg. Environ. Chang. 2011, 11, 441–457. [Google Scholar] [CrossRef]
Figure 1. The distribution of sampled subpopulations of Pinus brutia in Cyprus.
Forests 09 00514 g001
Figure 2. Bayesian cluster analysis of the optimum K clusters. (a) The optimal number of clusters (K) based on the Evanno method: (i) all sampled subpopulations, (ii) range-wide subpopulations, and (iii) altitudinal subpopulations. (b) Bar plot with individual mosquitoes represented as vertical bars colored in proportion to their assignment to clusters inferred at (i) all sampled subpopulations—K = 2, (ii) range-wide subpopulations—K = 2, and (iii) altitudinal subpopulation—K = 3.
Forests 09 00514 g002
Figure 3. The genetic similarities in Pinus brutia illustrated by UPGMA dendrogram based on Nei’s minimum genetic distance. (a) Sampling location level; (b) subpopulation level; (c) altitude level.
Forests 09 00514 g003
Figure 4. Two dimensional principal component analysis (PCA) plot of the genetic distance with regard to the first two principal components. (a) All sampled subpopulations; (b) wide-range subpopulation level; (c) altitudinal subpopulations.
Forests 09 00514 g004
Figure 5. Unweighted pair group method wit arithmetic average (UPGMA) dendrogram based on Euclidean distances for morphoanatomical traits. (a) All sampled subpopulations; (b) wide-range subpopulation level; (c) altitudinal subpopulations.
Forests 09 00514 g005
Figure 6. Back-grouping (classification) results of the morphoanatomical traits, using the sampling locations as a dependent variable.
Forests 09 00514 g006
Table 1. Geographic location of samples along the Troodos mountain range and sample size per sampled subpopulation.
Location (Abbr.)Distribution Area ǂ (ha/km)Elevation Range (m)Sample Size
Genetic AnalysisMorphoanatomical Analysis
No. TreesNo. Mega-GametophytesNo. TreesNo. ConesNo. SeedsNo. Needles
Macheras (Mach)5583 ha400–1200605060180540180
Limassol (Lim)7896 ha800–1200605060180540180
Akamas (Aka)5743 ha40025150 *2575225180
Adelphi (Ade)12,826 ha400–1200605060180540180
Troodos (Tro)8843 ha400–1200605060180540180
Pafos North (PaN)37,794 ha400–12006017260180540180
Pafos South (PaS)22,365 ha400–12006017860180540180
Pafos z.400 (PaZ.400)320 km4006010060180540180
Pafos z.800 (PaZ.800)438 km80025150 *60180540180
Pafos z.1200 (PaZ.1200)35 km12006010060180540180
Total5801050565169550851695
ǂ Distribution area corresponds to the area that is covered by sampled “subpopulation” and estimated either in ha in case of extended forest area or in km in case of specific altitude zone. * For the Aka and PaZ.800 the 150 megagametophytes resulted by the collection of six (6) seeds per tree from 25 different trees. For the rest “subpopulations” the sampling of seeds for genetic analysis was done as described in Section 2.3. Abbr.: Abbreviation.
Table 2. Patterns of genetic variation at multilocus level over subpopulations in P. brutia in Cyprus.
SubpopulationGenetic Parameters
PPLNaNeIHE
Mach60%1.8001.4350.3310.203
Lim60%1.7001.3000.2690.170
Aka70%2.0001.4420.3710.217
Ade80%2.1001.4730.3930.242
Tro60%1.8001.4300.3350.214
PaN90%2.3001.4150.3930.228
PaS80%2.1001.4150.3750.220
PaZ.40080%2.0001.3750.3500.209
PaZ.80080%2.2001.4640.4180.244
PaZ.120090%2.2001.3150.3270.186
Overall90%2.3001.4210.3810.220
PPL: % of polymorphic loci; Na: Number of allelic per locus; Ne: Effective number of allelic; I: Shannon’s index; HE: Genetic diversity.
Table 3. Summary of the hierarchical analysis of molecular variance (AMOVA). (a) Hierarchical AMOVA based on the sampled subpopulation patterns, (i) all sampled subpopulations and (ii) range-wide subpopulations. (b) Hierarchical AMOVA based on marginality level, (i) altitude gradient subpopulations and (ii) different orientation subpopulations.
(a)
Source of VariationAll Sampled Subpopulations§Range-Wide Subpopulations
d.f.Variance ComponentsPercentage VariationFixation Indicesǂd.f.Variance ComponentsPercentage VariationFixation Indicesǂ
Among Groups 50.13712%PhiRT = 0.118 ***30.0050%PhiRT = 0.004 n.s
Among subpopulations within Groups40.0131%PhiPR = 0.012 ***30.0111%PhiPR = 0.010 *
Within subpopulations within Groups10401.01787%PhiPT = 0.129 ***6931.08899%PhiPT = 0.014 ***
Total10491.167100% 6931.104100%
(b)
Source of VariationAltitudinal SubpopulationsAspect Subpopulations
d.f.Variance ComponentsPercentage VariationFixation Indicesǂd.f.Variance ComponentsPercentage VariationFixation Indicesǂ
Among subpopulations20.0202% 10.0141%
Within subpopulations3471.08798%PhiPT = 0.018 **3481.11899%PhiPT = 0.012 **
Total3491.107100% 3491.132100%
§ Sampled subpopulations grouped in six “Groups” (based on their geographical origin) for AMOVA —Group #1: Mach; Group #2: Lim; Group #3: Aka; Group #4: Ade; Group #5: Tro; Group #6: PaN, PaS, PaZ.400, PaZ.800, PaZ.1200. The sampled location grouped in three “Groups” for AMOVA. Group #1: Mach; Group #2: Lim; Group #3: Aka; Group #4: Ade, Tro, PaN, and PaS. ǂ PhiRT: proportion of genetic differentiation due to differences between groups; PhiPR: proportion of genetic differentiation due to different populations within groups; PhiPT: proportion of genetic differentiation among populations among groups. d.f., degrees of Freedom. Significant level of genetic differentiation: n.s., not significant; ***, p < 0.001; **, p < 0.01; *, p < 0.05.
Table 4. Statistical measures (average value, standard deviation, and coefficients of variance) of morphological and anatomical traits in P. brutia from Cyprus: (a) the values in each sampled subpopulations and (b) the overall value of morphoanatomical traits in P. brutia.
(a)
TraitsMachLimAkaAdeTro
μSDCVμSDCVμSDCVμSDCVμSDCV
Clen (mm)69.478.500.1268.857.800.1163.277.160.1168.239.610.1467.398.380.12
Cwid (mm)40.403.170.0837.773.310.0835.3353.600.1038.563.650.3438.533.110.08
Clen/Cwid1.720.180.101.770.120.061.790.130.071.770.170.091.750.170.09
Slen (mm)8.150.610.077.760.570.077.330.550.078.090.720.097.880.570.06
SWid (mm)5.010.450.094.630.430.094.440.350.084.880.460.094.710.390.08
SWing (mm)18.181.900.1017.022.170.1215.972.520.1617.692.290.1316.981.860.11
SLenWing (mm)26.334.800.0824.782.450.0923.302.740.1225.782.680.1024.862.120.08
NShLen (mm)6.821.480.216.400.990.156.810.870.136.570.960.146.461.030.16
NLen (mm)126.7615.620.12106.1013.010.12115.7212.830.11131.0515.630.12119.3314.910.12
NWid (mm)1.330.090.061.310.060.051.430.090.061.320.080.061.280.080.06
NThic (mm)0.820.050.060.790.040.050.880.060.070.820.060.070.780.060.07
NResIn3.730.890.233.430.980.284.230.480.113.640.790.213.340.880.26
NResDo6.050.980.165.780.990.176.720.950.146.161.060.175.641.240.22
NResTot9.781.480.159.211.690.1810.951.100.109.801.600.168.991.850.20
NStomDo8.981.170.139.000.830.098.920.870.108.901.070.129.061.210.13
NStomIn3.750.760.213.870.650.163.490.740.213.660.600.163.730.680.18
NStoRow12.741.630.1212.711.640.1312.411.260.1012.561.390.1112.781.570.12
NSto/Row83.378.690.1083.379.750.1184.2510.680.1387.478.140.0981.659.570.11
Nstom13,47129170.2111,26824720.2112,0622171.600.18144112730.800.1912,4652654.400.21
NTeh70.239.430.1371.4312.080.1775.078.240.1170.7310.610.1567.2113.500.20
TraitsPaNPaSPaZ.400PaZ.800PaZ.1200
μSDCVμSDCVμSDCVμSDCVμSDCV
CLen (mm)69.9610.260.1467.6910.050.1468.759.080.1368.7510.090.1467.028.790.13
CWid (mm)39.043.840.0938.644.150.1038.263.580.0939.44.090.139.493.590.09
CLen/CWid1.740.160.091.740.170.091.790.170.091.750.160.091.690.150.08
SLen (mm)8.120.610.078.050.660.087.950.610.078.170.670.088.230.620.07
SWid (mm)4.830.400.084.810.420.084.730.370.084.860.410.084.960.430.08
SWing (mm)17.712.550.1417.512.510.1417.442.320.1317.892.510.1417.662.080.11
SLenWing (mm)25.832.950.1125.562.980.1125.392.720.126.062.960.1125.892.420.09
NShLen (mm)6.541.070.166.330.890.146.110.770.126.390.910.147.041.10.16
NLen (mm)128.4719.120.15114.5014.140.12121.721.620.17127.415.860.12116.4915.550.13
NWid (mm)1.270.090.071.280.070.051.290.090.071.250.080.061.290.070.05
NThic (mm)0.780.050.060.770.050.060.790.060.070.770.050.060.780.050.06
NResIn3.550.900.253.150.870.273.241.080.333.370.80.233.460.790.22
NResDo5.841.200.205.211.210.235.211.550.35.581.160.25.81.110.19
NResTot9.391.900.208.361.840.228.462.340.278.941.790.29.261.660.18
NStomDo8.921.060.129.181.020.118.911.060.128.581.010.119.481.10.11
NStomIn3.670.610.163.690.620.163.690.60.163.560.590.163.790.690.18
NStoRow12.591.380.1112.881.320.1012.611.410.1112.141.220.113.271.540.11
NSto/Row84.447.330.8786.648.310.0985.818.320.0985.098.070.0985.888.820.1
Nstom13,6782837.130.2012,7772391.700.1813,1382854.600.2113,1632430.700.1813,270.182676.900.2
NTeh69.979.980.1471.0610.220.1471.459.850.1370.7910.090.1471.9810.820.15
(b)
CLenCWidCLen/CWidSLenSWidSWingSLenWing
μ67.6038.741.758.024.8117.5025.51
SD0.220.090.0040.010.010.050.06
CV0.140.100.100.080.090.130.11
NShLenNLenNWidNThicNResInNResDoNResTotNStomDoNStomInNStoRowNSto/RowNstomNTeh
μ6.53121.071.290.793.475.749.219.003.7112.6984.831302670.74
SD1.0617.830.090.060.911.231.881.080.661.488.832769.610.79
CV0.160.150.070.660.260.210.200.120.180.120.100.210.15
Table 5. Results of Pearson Correlation coefficient between investigated morphoanatomical traits and the sampled altitudinal subpopulations (PaZ.400, PaZ.800, and PaZ.1200).
CLenCWidCLen/CWidSLenSWidSWingSLenWing
Altitude zone−0.79 n.s.0.13 **−0.24 **0.20 **0.23 **0.04 n.s.0.09 **
NShLenNLenNWidNThicNResInNResDoNResTotNStomDoNStomInNStoRowNSto/RowNstomNTeh
Altitude zone0.36 **−0.10 *−0.03 n.s.−0.05 n.s.0.09 *0.16 **0.14 **0.20 **0.05 n.s.0.16 n.s.−0.001 n.s.0.01 n.s.0.03
Significant level: *, p < 0.05; **, p < 0.01; n.s.: nonsignificant.
Table 6. Principal component analysis (PCA) of the 20 morphoanatomical traits of Pinus brutia in Cyprus.
VariableAxis 1Axis 2Axis 3Axis 4Axis 5Axis 6Axis 7Axis 8Axis 9
% of variance explained40.627.914.07.24.43.02.00.60.2
NWid−0.628 *0.2770.2160.1910.199−0.126−0.185−0.2730.136
NThic−0.578 *0.5570.1590.1030.296−0.074−0.268−0.1260.086
SLen0.446 *0.1450.2810.1490.1850.166−0.0550.0330.188
NLen0.3280.742 *−0.2730.023−0.052−0.181−0.033−0.2140.258
NStoRow0.2500.439 *0.0110.4090.060−0.154−0.408−0.2690.224
NShLen−0.0470.1710.579 *0.009−0.288−0.2180.046−0.0630.293
SWid0.3480.2590.475 *0.1090.4190.108−0.0390.113−0.019
NStom0.0680.060−0.0280.639 *0.0120.334−0.1930.2620.018
NResIn−0.2630.3750.282−0.182−0.553 *0.128−0.2870.0110.001
NResTot−0.2960.4150.278−0.168−0.530 *0.118−0.131−0.216−0.078
CWid0.3370.1360.325−0.2180.432 *0.0730.156−0.019−0.023
CLen0.1530.076−0.040−0.0930.363 *0.166−0.018−0.0600.231
NStomDo−0.019−0.1590.3940.2460.087−0.452 *−0.388−0.424−0.002
NTeh−0.1100.0020.0630.341−0.1020.361 *0.354−0.2770.263
SWing0.2530.1540.1480.0080.3290.344 *0.079−0.122−0.167
SLenWing0.3240.1670.1950.0420.3280.337 *0.055−0.098−0.099
NStomIn−0.005−0.1360.190−0.1540.2130.139−0.454 *−0.4110.376
NStomDo0.004−0.1410.3640.1580.168−0.387−0.428−0.472 *0.134
NResDo−0.2500.3430.189−0.097−0.3390.0690.117−0.454 *−0.160
CLen/CWid−0.128−0.022−0.3800.0830.1050.159−0.136−0.0070.424 *
* Variables that showed strong correlation with each component.

