Article

Influence of Natural and Artificial Weathering on the Colour Change of Different Wood and Wood-Based Materials

Department of Wood Science and Technology, Biotechnical Faculty, University of Ljubljana, Jamnikarjeva 101, SI-1000 Ljubljana, Slovenia
*
Author to whom correspondence should be addressed.
Forests 2018, 9(8), 488; https://doi.org/10.3390/f9080488
Submission received: 1 July 2018 / Revised: 6 August 2018 / Accepted: 8 August 2018 / Published: 10 August 2018
(This article belongs to the Special Issue Wood Properties and Processing)

Abstract

:
The importance of the aesthetic performance of wood is increasing and the colour is one of the most important parameters of aesthetics, hence the colour stability of twelve different wood-based materials was evaluated by several in-service and laboratory tests. The wood used for wooden façades and decking belongs to a group of severely exposed surfaces. Discolouration of wood in such applications is a long-known phenomenon, which is a result of different biotic and abiotic causes. The ongoing in-service trial started in October 2013, whilst a laboratory test mimicking seasonal exposure was performed in parallel. Samples were exposed to blue stain fungi (Aureobasidium pullulans and Dothichiza pithyophila) in a laboratory test according to the EN 152 procedure. Afterwards, the same samples were artificially weathered and re-exposed to the same blue stain fungi for the second time. The purpose of this experiment was to investigate the synergistic effect of weathering and staining. The broader aim of the study was to determine the correlation factors between artificial and natural weathering and to compare laboratory and field test data of fungal disfigurement of various bio-based materials. During the four years of exposure, the most prominent colour changes were determined on decking. Respective changes on the façade elements were significantly less prominent, being the lest evident on the south and east façade. The results showed that there are positive correlations between natural weathering and the combination of artificial weathering and blue staining. Hence, the artificial weathering of wood-based materials in the laboratory should consist of two steps, blue staining and artificial weathering, in order to simulate colour changes.

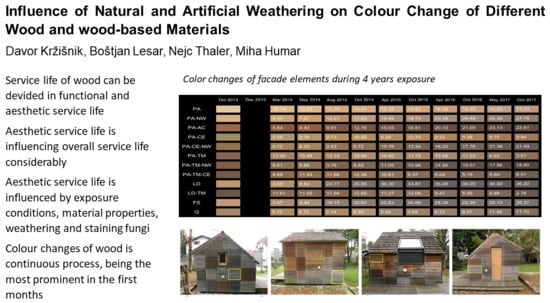
Graphical Abstract

1. Introduction

During their service life, buildings and building components are exposed to a wide variety of environmental conditions. For wood-based materials, moisture stress and biological factors like mould, blue-stain, and decay fungi are often critical, especially for cladding and decking applications in exterior use conditions, representing two commodities where wood is frequently used [1,2]. Service life prediction, service life cost analysis, and the aesthetic performance of newly available bio-based building materials are essential for their promotion and increased use in the construction sector. The appearance of bio-based building materials usually changes during their service life. Therefore, the aesthetic service life is often a decisive criterion for these applications [3,4].
The service life of different building products and commodities is determined by very different criteria, e.g., colour stability of coated or uncoated surfaces; cracking and checking; the occurrence of moulds, stain, or fungal decay; damage by insects or marine borers; resistance to abrasion and wear, etc. In addition, the effect of other factors, like solar radiation, surface erosion, and mechanical impact, has a role in the service life of wood, which makes it a huge challenge to take into account the many different factors having a potential impact on the service life of wooden components [1,5,6]. In general, the service life of wood can be categorised into a group of functional, technical, or aesthetic service lives. While in the past, the majority of research efforts were focused on the functional service life, nowadays, aesthetic service life is gaining importance.
Wooden façades are a group of severely exposed wooden surfaces and as such are very susceptible to discolouration by different biotic and abiotic causes. The most important biotic factors for discolouration are fungi and bacteria due to the production of pigments, e.g., melanin by blue stain fungi [7,8]. The wood-discolouring moulds and staining fungi live on nutrients in the parenchyma cells of sapwood [9,10]. Conifers and hardwoods, round wood, lumber, finished wood, and wood products can all be colonized if the moisture content is high enough. Discolouring fungi do not cause any or only very little cell wall attack [11,12]. Tertiary blue stain fungi, which develop on the surface of the wood in use, are frequently Aureobasidium pullulans and Dothichiza pithyophila [13]. These two fungal species develop on timber that has been converted into products and was painted, and re-imbibe moisture while in service, like wooden façades, window frames, garage doors, and garden furniture [14]. Frequently, moulds are recognizable by their fast growth on the surface of substrates, on which conidia can develop rapidly. Due to the species-specific colour of the conidia, wood colonized by several mould species can result in a multi-coloured impression, or be dominated by a single colour, e.g., black due to Aspergillus niger, or green due to Penicillium spp. or Trichoderma spp. In parallel to biotic factors, wood is exposed to solar radiation, which initially leads to rapid colour change due to the absorption of sunlight, and in the further stages, to large chemical modifications and breakdown of the wood surface layer [15,16]. This complex degradation process in combination with exposure to precipitation is often described as weathering [17]. The UV spectrum of solar radiation is one of the most effective parameters amongst all environmental factors that contribute to the weathering process of wood [15,18,19]. Although the UV spectrum only represents 5% of energy in sunlight, its strong effect on wood degradation is well documented [19,20]. The photo-degraded wood surface is a good substrate for bacteria and fungi, including staining fungi; the light colour of the photo-degraded wood surface and the black colour of fungal hyphae make up the majority of the grey surface of outdoor weathered wood [17,19,21]. Besides UV and fungi, there are some additional agents contributing to weathering, namely; water (leaching of extractives, stress in the material leading to fractures), the atmosphere (oxygen, free radicals, pollutants), and wind (wind-driven rain, hail, particles like sand) [22,23]. Leaching of extractives is predominantly important for wood species with a high extractive content, like oak [24]. However, in the first year of exposure in a temperate zone, oak wood usually exhibits rather low colour changes, while spruce wood is rather prone to discolouration [25,26,27]. Even higher colour changes are usually reported for dark thermally-modified wood. One of the wood species that is frequently used for cladding applications is larch. Larch can perform very well in applications with a lot of UV radiation and a low relative humidity. In these climates, a grey colour develops. On the other hand, the aesthetic performance of larch in a moderate climate with a higher relative humidity and less sunny days is not meeting users’ expectations due to the development of mould fungi on the surface, which leads to several users’ complains [28].
As already stated, aesthetic service life is becoming more and more important. End users want to see the final visual appearance of their wooden facades in the planning phase. Therefore, ageing and weathering models have to be included in BIM (Building Information Modelling) software [29]. In order to model this parameter, we have to prove the factors contributing to this phenomena and provide a methodology for the characterization of new materials The aim of this research was to study the correlations between natural and artificial weathering and their effect on the colour change of twelve different bio-based wooden materials. Although there have been several reports on the colour and structural changes after natural and artificial weathering [17,30,31,32,33,34,35], these correlations were usually less significant, as the artificial weathering did not include the step which would enable mould growth. Hence, there was no fungal staining considered. To our knowledge, this study is the first report where significant correlation factors between laboratory tests (combination of blue staining and artificial weathering) and natural weathering have been determined for various wood-based materials commercially used in outdoor applications in a temperate climate. In the respective study, the aesthetic performance of twelve different wood-based materials used for cladding applications was investigated.

2. Material and Methods

The group of selected materials consists of four untreated wood species (Norway spruce, European larch, European beech, and English oak) and eight materials that are treated or modified in different ways (Table 1).
Thermal modification (TM) was performed according to the commercial process Silvapro® (Silvaprodukt, Ljubljana, Slovenia) with an initial vacuum in the first step of the treatment [36,37]. The modification was performed for three hours at the target temperature (ranging between 210 °C and 230 °C, depending on the wood species). Impregnation was performed with a commercial copper-ethanolamine solution Silvanolin® (Silvaprodukt, Ljubljana, Slovenia), which consists of copper, ethanolamine, boric acid, and quaternary ammonium compounds [38]. The concentration of active ingredients and consequent retention meet the use of class 3 requirements [39]. Impregnation was performed according to the full cell process in a laboratory impregnation setup. It consisted of 30 min vacuum (80 kPa), 180 min pressure (1 MPa), and 20 min vacuum (80 kPa), respectively. The same procedure was used for the impregnation of wood with 5% commercially available natural wax dispersion with a solid content of up to 50% by weight (Montax 50, Romonta, Seegebiet Mansfelder Land, Germany) [40]. The acrylic surface coating Silvanol® Lazura B (Silvaprodukt, Ljubljana, Slovenia) was manually applied to wood by brushing in two layers, with a 24-h drying time between each layer.

2.1. In-Service Testing

Figure 1 shows the wooden model house unit at the Department of Wood Science and Technology in Ljubljana, Slovenia (46°02′55.7” N 14°28′47.3” E, elevation above sea level 293 m), where the in-service performance of the façade and decking cladding elements was tested. The test specimens with a cross-section of 2.5 × 5.0 cm were exposed horizontally on the walls of the model house facing north, south, east, and west. At least seven specimens of the same material were exposed on each wall and deck. The in-service testing started in October 2013 and the prime objective was to monitor aesthetical properties (aesthetic service life), the presence of decay (functional service life), and moisture performance.
To determine the colour development due to weathering of the outdoor exposed samples, the colour of the test specimens was recorded in the CIE Lab system during the year with a portable colourimeter (EasyCo 566, Erichsen, Hemer, Germany). Colour was determined on the exposed surfaces only. To limit the influence of moisture content, measurements were performed at least two days after the last rain event. There were five to seven measurements performed on every respective element. We have tried to avoid fasteners, knots, and resin pockets, if present. Also, according to modified Johansson et al. [41], the evaluation of surface blue staining was performed using a rating scale from 0 to 4 as follows:
  • 0 = not blue stained;
  • 1 = weakly blue stained: few spots of blue stain on the surface;
  • 2 = slightly blue stained: up to 1.5 mm in width and 4 mm in length;
  • 3 = moderately blue stained: up to one-third of the surface;
  • 4 = severely blue stained.
The evaluation scale from Johansson [41] was adopted, in order to meet our needs and to enable an easier comparison between laboratory and field trials.

2.2. Artificial Weathering Test

In parallel to the in-service test, we prepared a set of five samples (110 mm × 40 mm × 10 mm) made of the same materials as those listed in Table 1. All obtained specimens were exposed to blue stain fungi in a laboratory test according to the EN 152 [42] procedure. Afterwards, samples were exposed to artificial weathering and then re-exposed to blue stain fungi for the second time. With this setup, we somehow mimicked the natural processes. We have decided on this sequence, as we have noticed that the occurrence of the blue staining on wood is a rather fast process and that the first discolourations on wood are the consequence of blue staining and not weathering. The purpose of this experiment was to determine the semi-synergistic effect of weathering and staining.
The laboratory test was conducted with the blue-stain fungi Aureobasidium pullulans (de Bary) G. Arnaud strain ZIM L060 and Dothichiza pithyophila (Corda) Petr. strain ZIM L070. Both strains were obtained from the Collection of wood decay fungi from the Department of Wood Science and Technology (Biotechnical Faculty, Ljubljana, Slovenia) [43]. Prior to the inoculation, the wood specimens were sterilized in an autoclave with hot steam at 121 °C and 150 kPa for 15 min. Later on, the sterilized specimens were dipped into a spore suspension and placed horizontally in a Kolle flask, which was also inoculated with 15 mL of spore suspension. Afterwards, the flasks were placed in an incubation chamber at 25 °C and 80% RH for six weeks. After that time, the samples were visually evaluated and ranked according to the ranking system prescribed in the EN 152 [31] from 0 to 3 (rank 0 = not blue stained; 1 = small spots less than 2 mm; 2 = blue stained up to one third of surface; 3 = strongly blue stained). Only the uppermost side was evaluated and scanned for colour measurements.
An artificial weathering test (AW) between two EN 152 [42] tests was performed in a solar simulation chamber (Suntest XXL+, Atlas Material Testing Technology, Linsengericht, Germany). The climatic test chamber for solar simulation is equipped with three 1700 W xenon lamps emitting light with wavelengths between 300 and 420 nm. The standard EN 16474-1test [44] was followed to reproduce the artificial radiation in outdoor conditions. The exposure experiment was performed at a black standard temperature (BST) of 63 °C and an irradiance of approximately 0.35 W m−2 (340 nm) with daylight filters, and with a total cycle time of 2 h, composed of a 102 min dry cycle at 40%–60% relative humidity and an 18 min wet cycle with water spray. The colour of the specimens was measured every 100 h for the total duration of 500 h of artificial weathering. Every period, the uppermost side was visually evaluated and scanned.
After the artificial weathering, the specimens were re-exposed to blue-stain fungi for the second time, according to the standard EN 152 procedure [42] described above.

2.3. Colour Analysis

Colour was determined on semi-radial surfaces of the samples. There were no measurements performed on axial surfaces. Prior measurement samples were conditioned under laboratory conditions (23 °C; 65%) to limit the influence of wood moisture content on colour. The colour measurements were performed on samples from the artificial weathering test according to the CIE Lab system, a method created by the Commission International de l’Eclairage. The CIE Lab system is characterized by three parameters: L*, a*, and b*. The L* axis represents the lightness, which varies from a hundred (white) to zero (black), representing the achromatic axis of greys, whereas a* and b* are the chromaticity coordinates. A positive value of a* denotes a redder colour on a green-red scale, whereas a positive value of b* denotes a more yellow colour on a blue-yellow scale. Together, those three components form a three-dimensional colour space [45].
Colour measurements of in-service testing were performed several times a year with a portable Colour Measuring Device (EasyCo 566, Erichsen, Hemer, Germany) and expressed in the CIE L*a*b* system. This device enables contact-free precise colour measurement. The diameter of the measurement spot is 20 mm. However, laboratory test specimens were scanned and processed with Corel Photo-Paint 8 software. Corel Photo paint was used as colour analysis as this technique provides the colour of the whole surface and not of individual spots. This technique provides reliable measurements, as indicated by the comparison of both techniques in our laboratory.
Total colour difference ΔE (Equation (1)) from a reference colour (L*0, a*0, b*0) to a target colour (L*1, a*1, b*1) in the CIE Lab space is calculated by determining the Euclidean distance between two colours given by:
Δ E = ( Δ L * ) 2 + ( Δ a * ) 2 + ( Δ b * ) 2
Summing up ΔE (ΣΔE) for all analysed points in time, the course of the colour changes can be taken into account:
i 1 , 1 n Δ E i , n = Δ E 0 , 1 + Δ E 1 , 2 + + Δ E n 1 , n

2.4. Data Processing

The total colour difference (ΔE values) for different directions from the in-service and laboratory trial was used to calculate the Pearson product moment correlation coefficient (r) using Statgraphics Centurion XVII software, version 17.2.05 (Statpoint Technologies Inc., The Plains Virginia, USA). The Multiple-Variable Analysis (Correlations) procedure was used to calculate the correlation coefficients to measure the strength of the linear relationship between all the variables. p-values (P) below 0.05 were considered to be significant.

3. Results and Discussion

3.1. Colour Changes of In-Service Testing

As already stated in the introduction, in-service testing provided the most accurate information regarding the colour changes during weathering. Figure 1 shows the visual appearance of the model house and plotted colour values (L*, a*, and b*) against exposure time for Norway spruce (PA) only. Norway spruce was studied in more detail, as it is one of the most frequently used wood species in central Europe. Lightness values (L*) for south exposure exhibited the lowest change, being the most light-coloured after four years of exposure, and decking had the highest rate of change; moreover, the latter samples were the darkest of the group at the end of the exposure. One of the reasons for this observed difference originated in the construction details. Samples exposed on the south façade were the most protected against rainfall events, while decking was the most exposed. In addition, the samples on the north façade and decking showed seasonal fluctuations in lightness, e.g., after the summer months, the L* values were higher, and after the winter, the L* values were lower.
The most important reason for seasonal fluctuations was related to fungal melanin; with its formation on one hand being countered by bleaching on the other. During the wet autumn and winter months, blue stain fungi grew on the surface (Table 2). In the summer months, melanin was at least partially bleached [31], which resulted in fluctuations of lightness (in the autumn and winter the wood gets darker and in summer it turns back to lighter colours) (Figure 1). The extent of discolouration depended on microclimate conditions, the susceptibility of the material, UV radiation, etc. The rate of change of the two chromatic components, a* and b* values, decreased over time for north, east, and west façade exposure and was close to zero, meaning that samples were close to being achromatic, i.e., grey, which was also clearly evident from their visual appearances. Values of parameter a* on Norway spruce samples (PA) exposed on the east façade dropped beneath 0 in October 2015, which meant that the chromatic value changed from “red” to “green”. However, after October 2015, values were positive again.
The total colour difference (ΔE from Equation (1)) after four years of weathering was the highest on decking and lowest on the south facing façade. Colour changes on the other three exposures (north, east, and west) were comparable. Furthermore, seasonal fluctuation in ΔE could be observed on all façades and decking, but mostly on the north facing façade and on the deck. The horizontal position is the most exposed to sun radiation, as well as to precipitation, which assured conditions for colour changes in abiotic and biotic ways, in particular the formation of a grey colour, as well as the sequential formation of UV-induced free radicals, the degradation of lignin into quinones, the leaching of quinones [20], and the development of staining fungi [38,46].
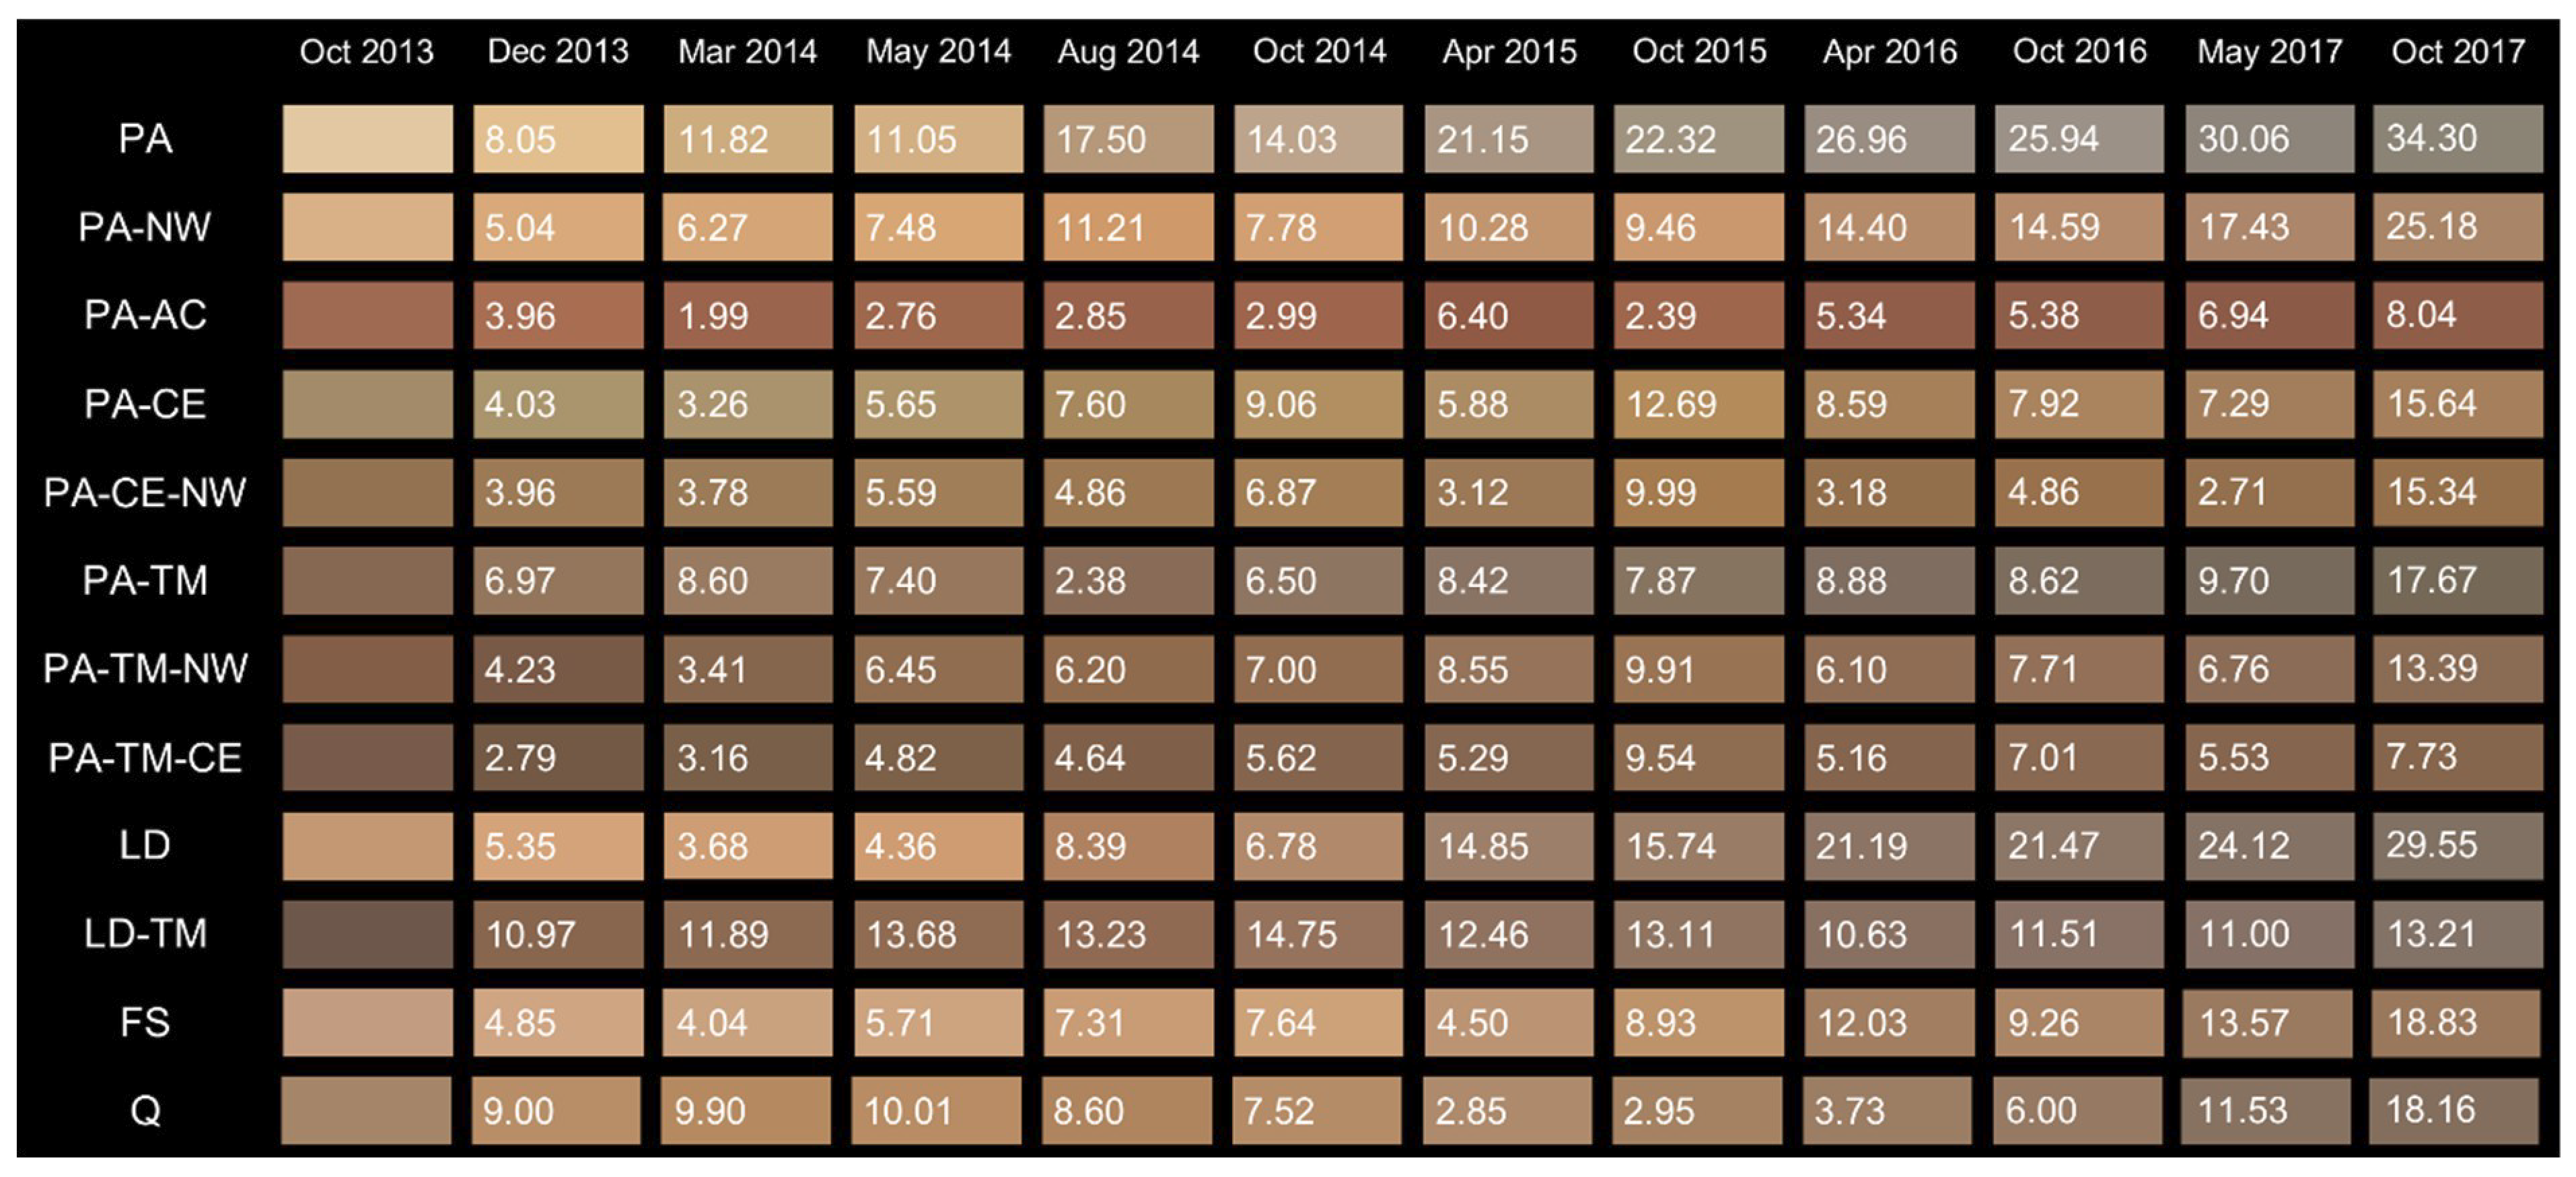
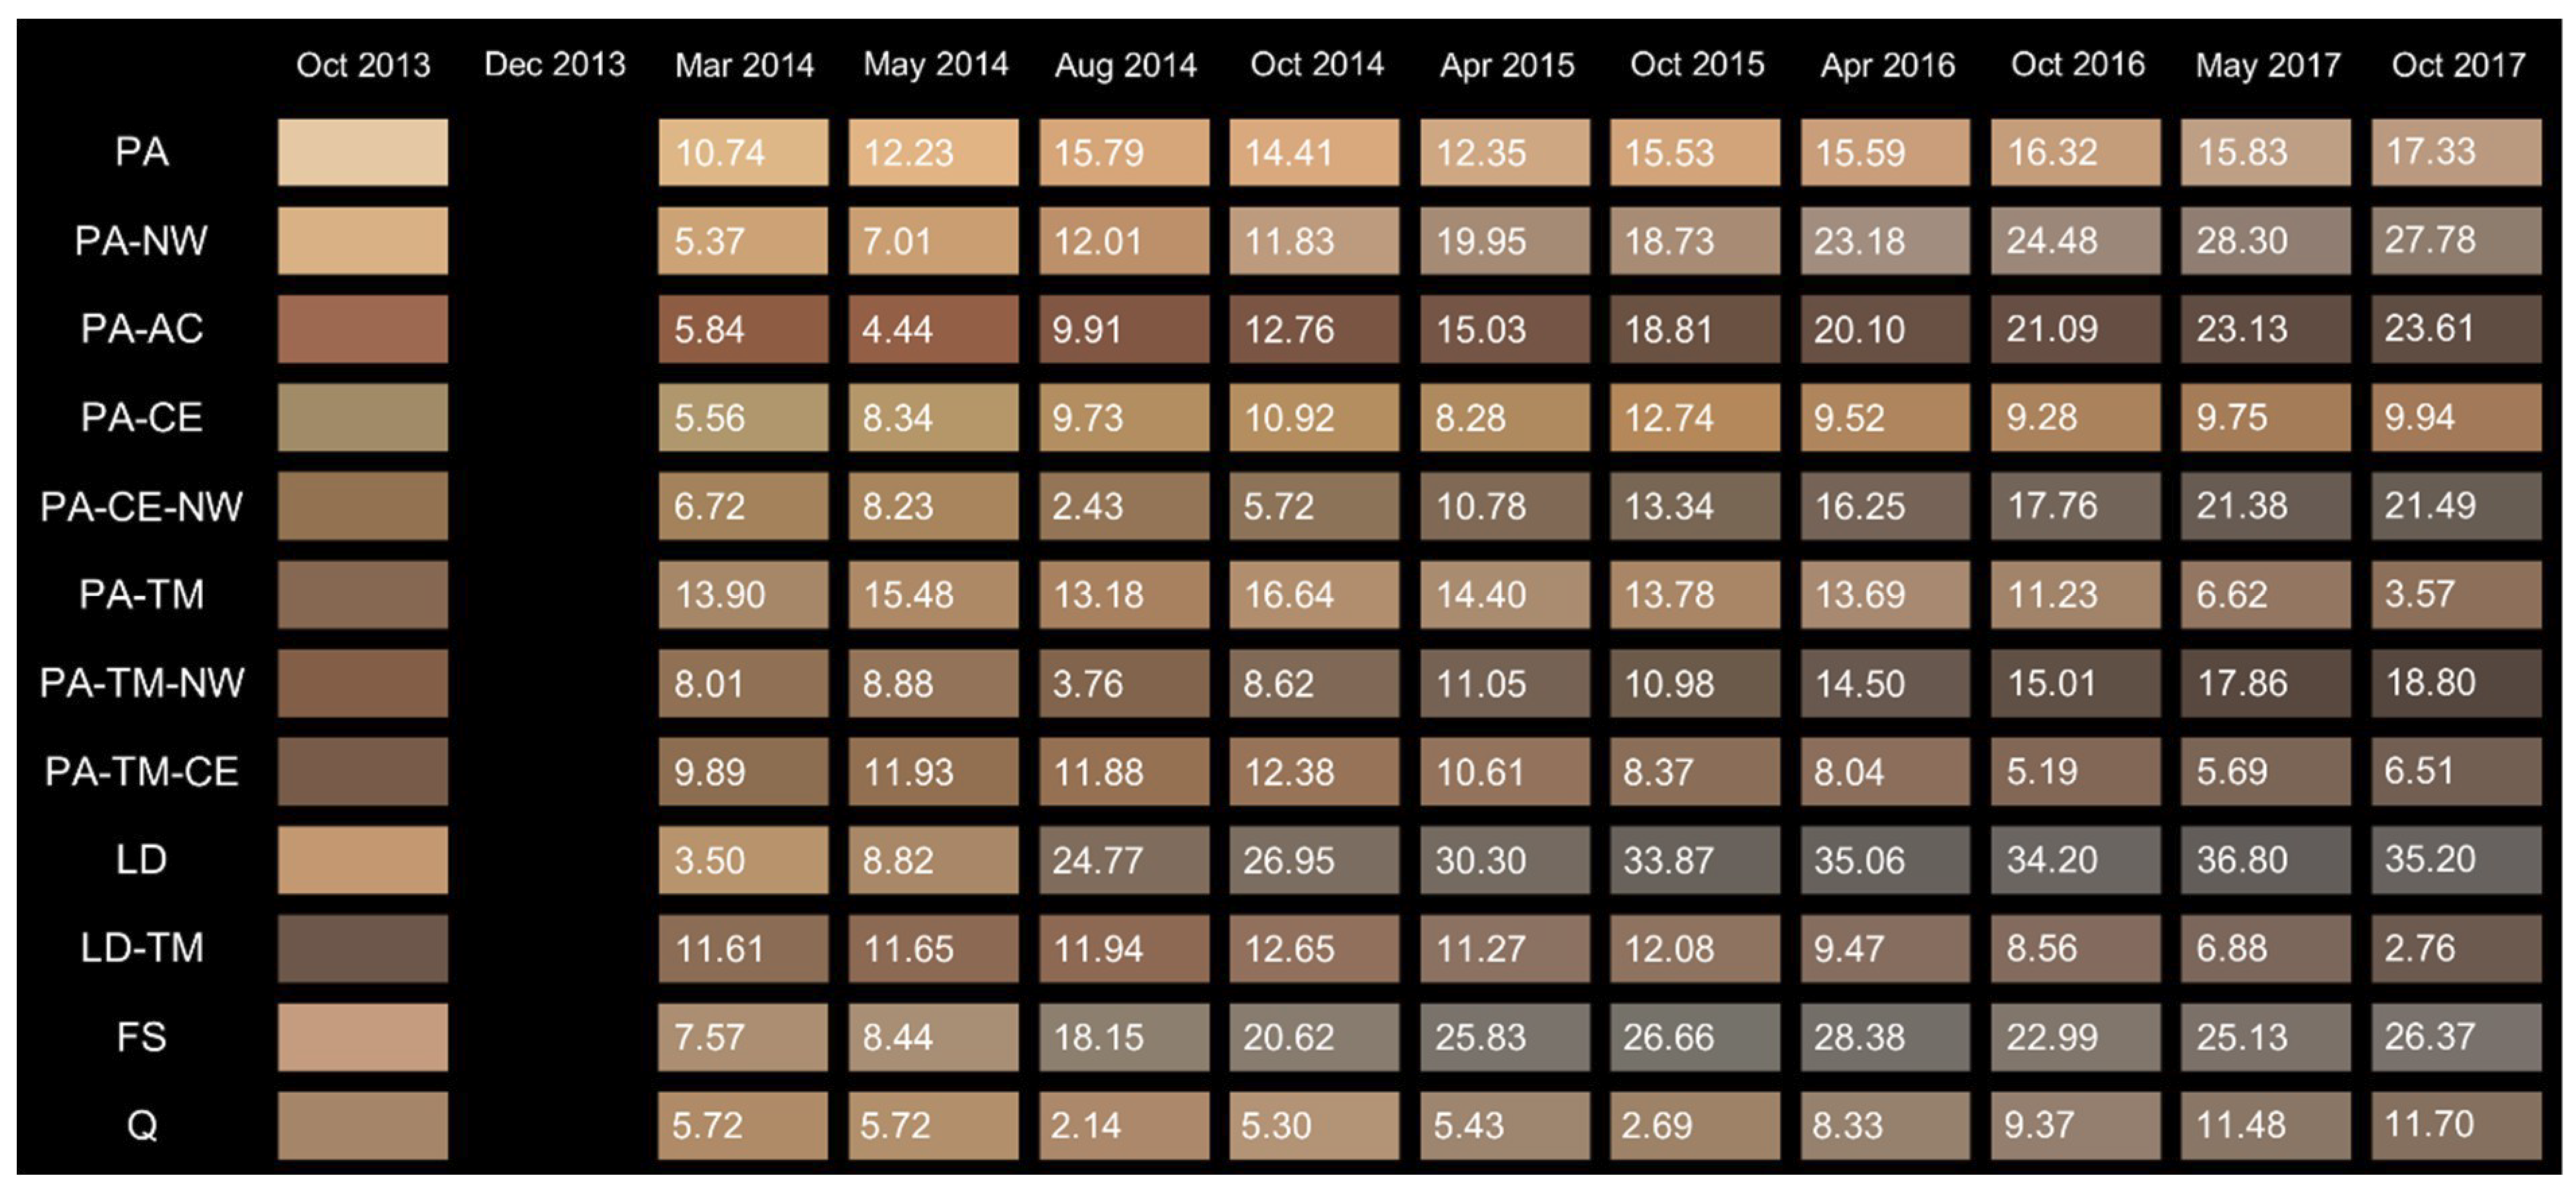
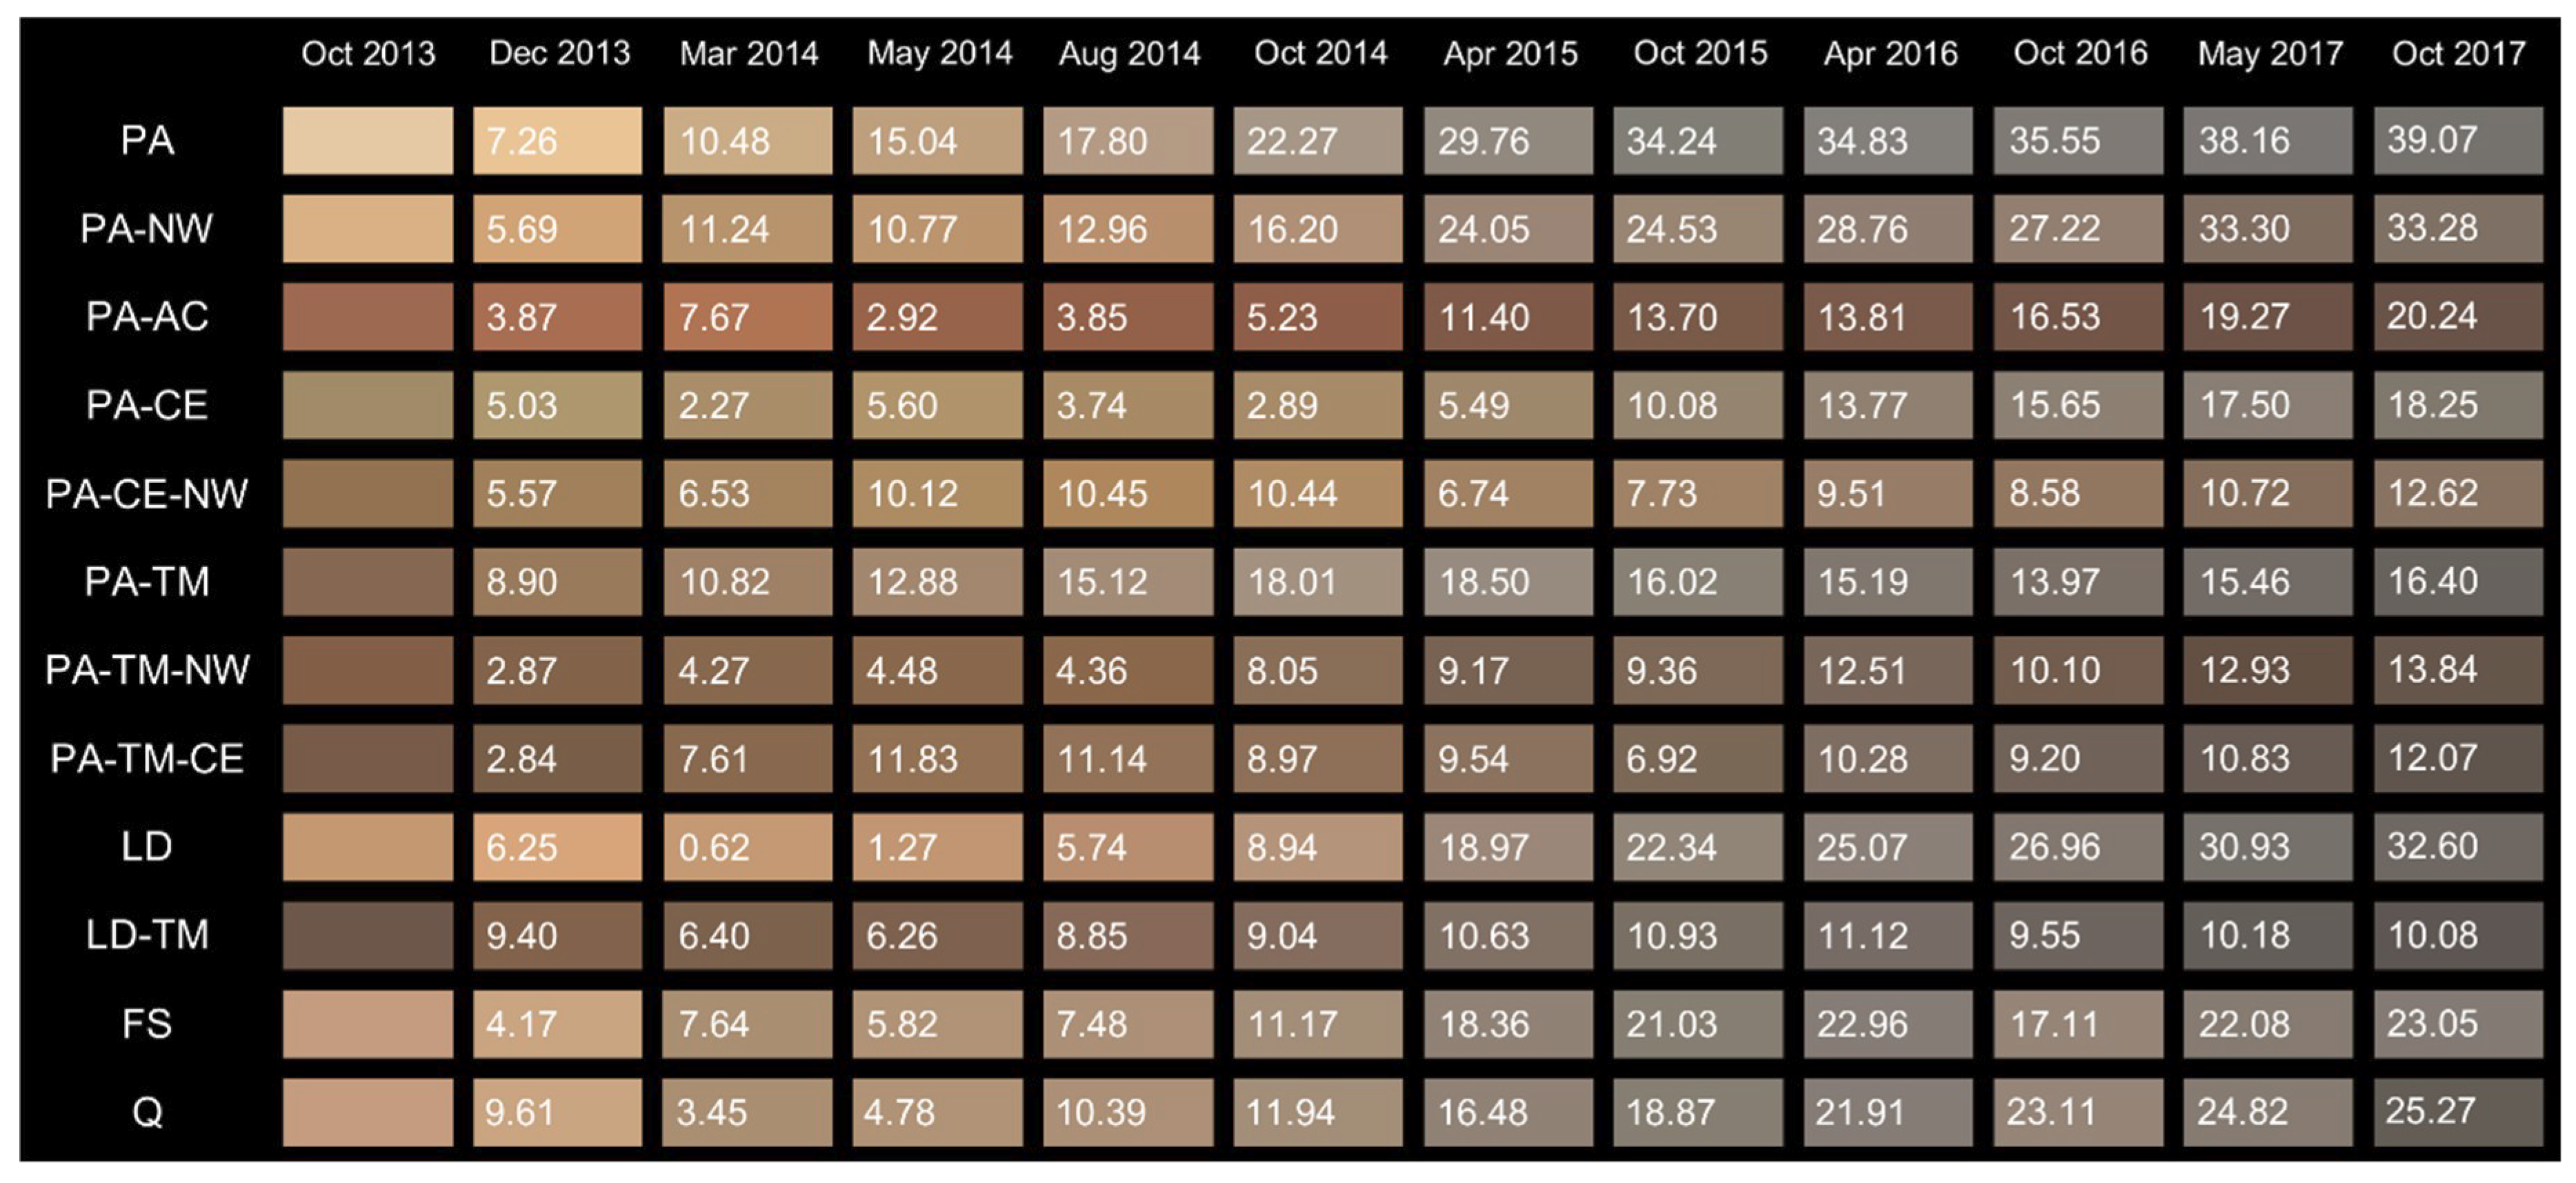
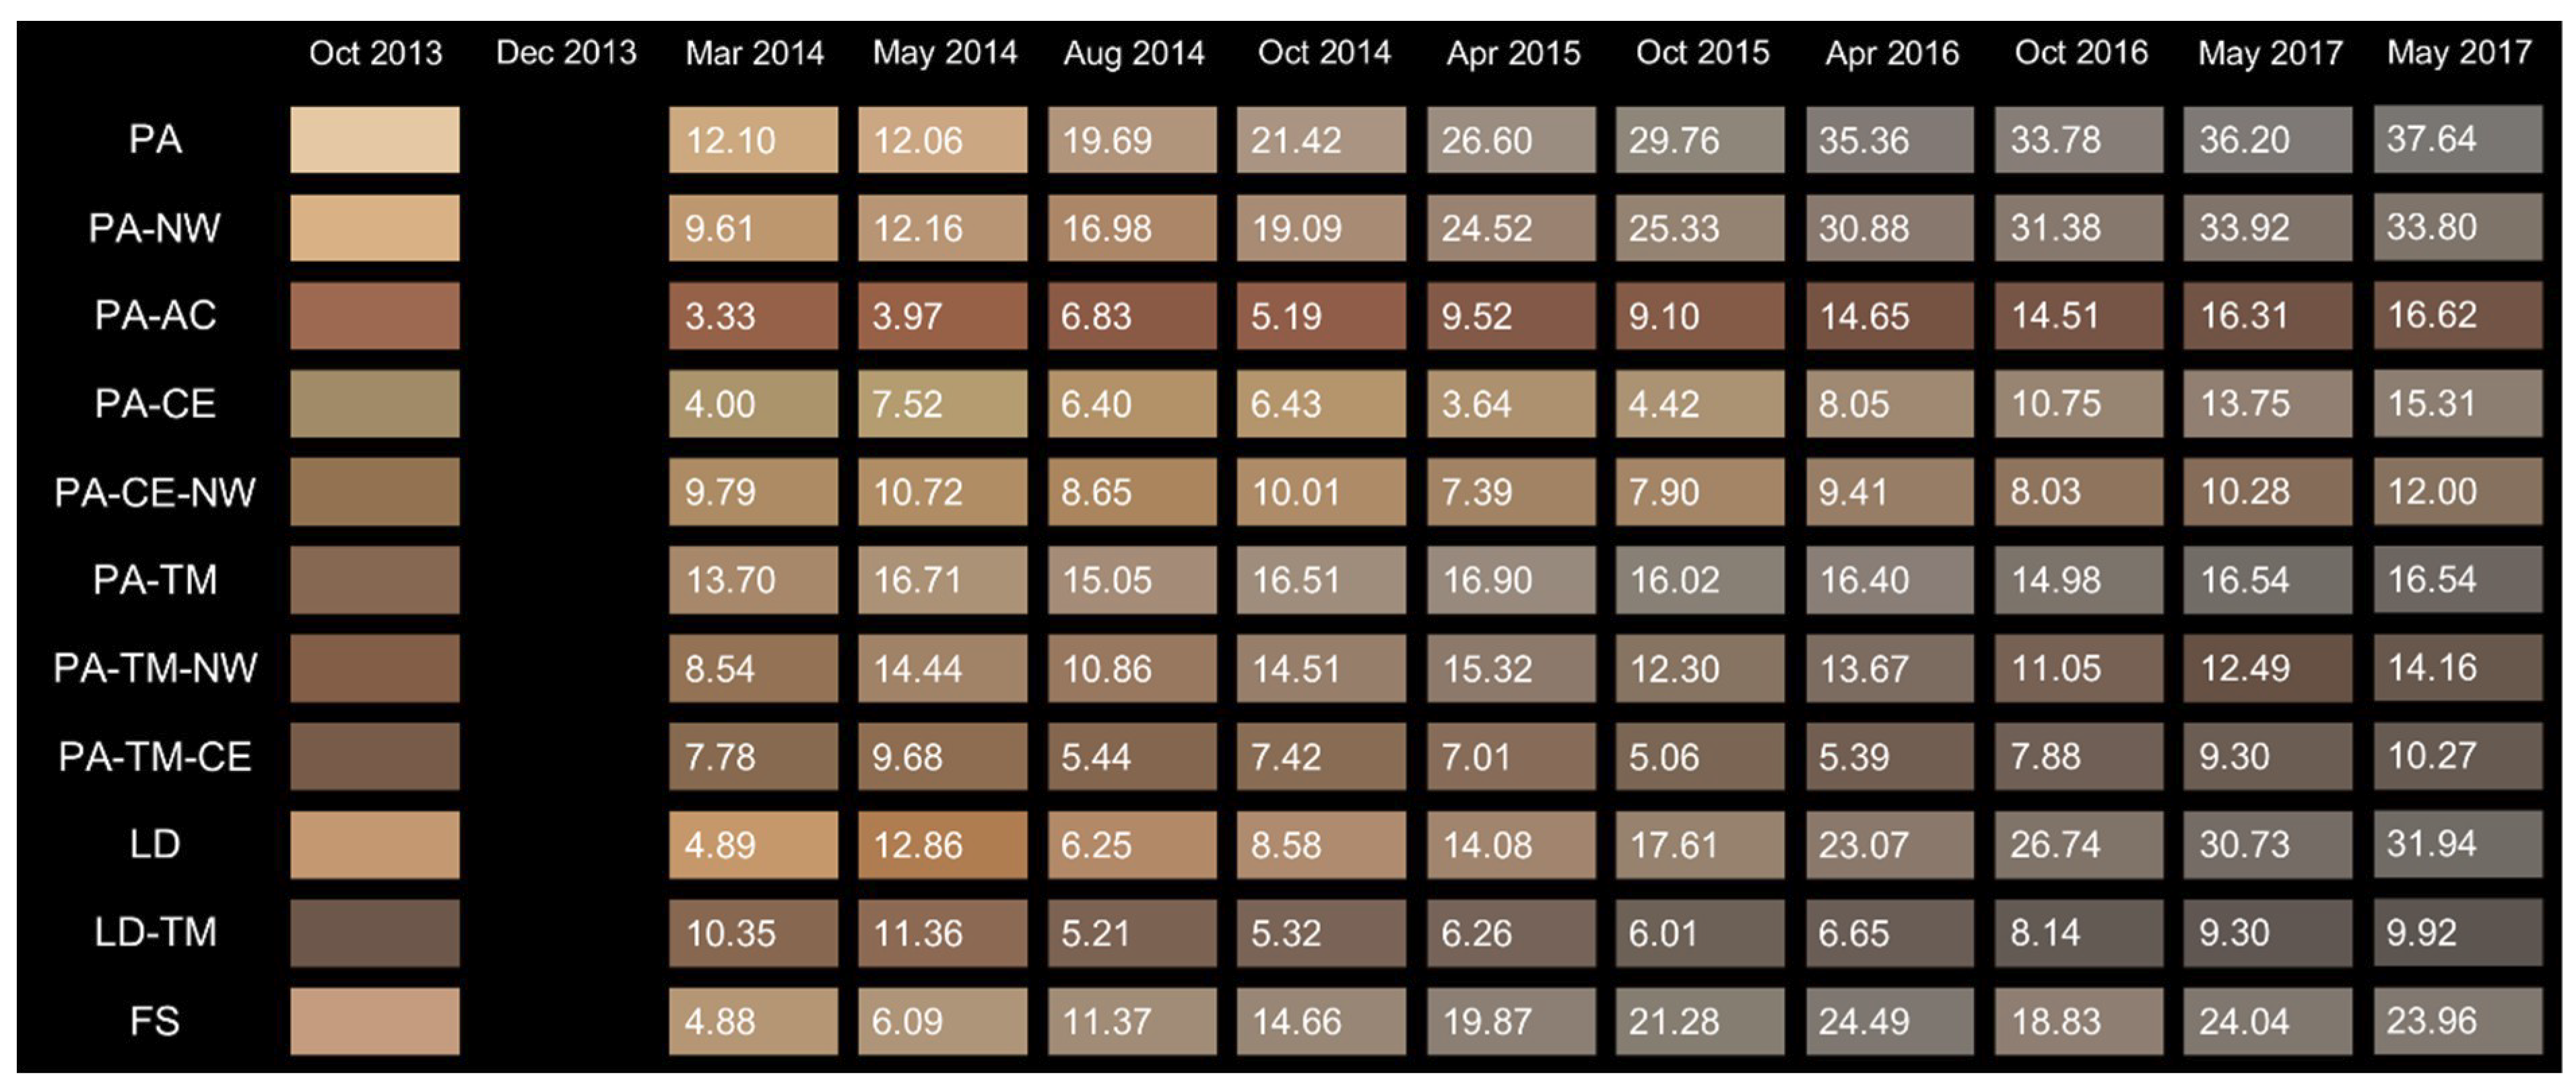
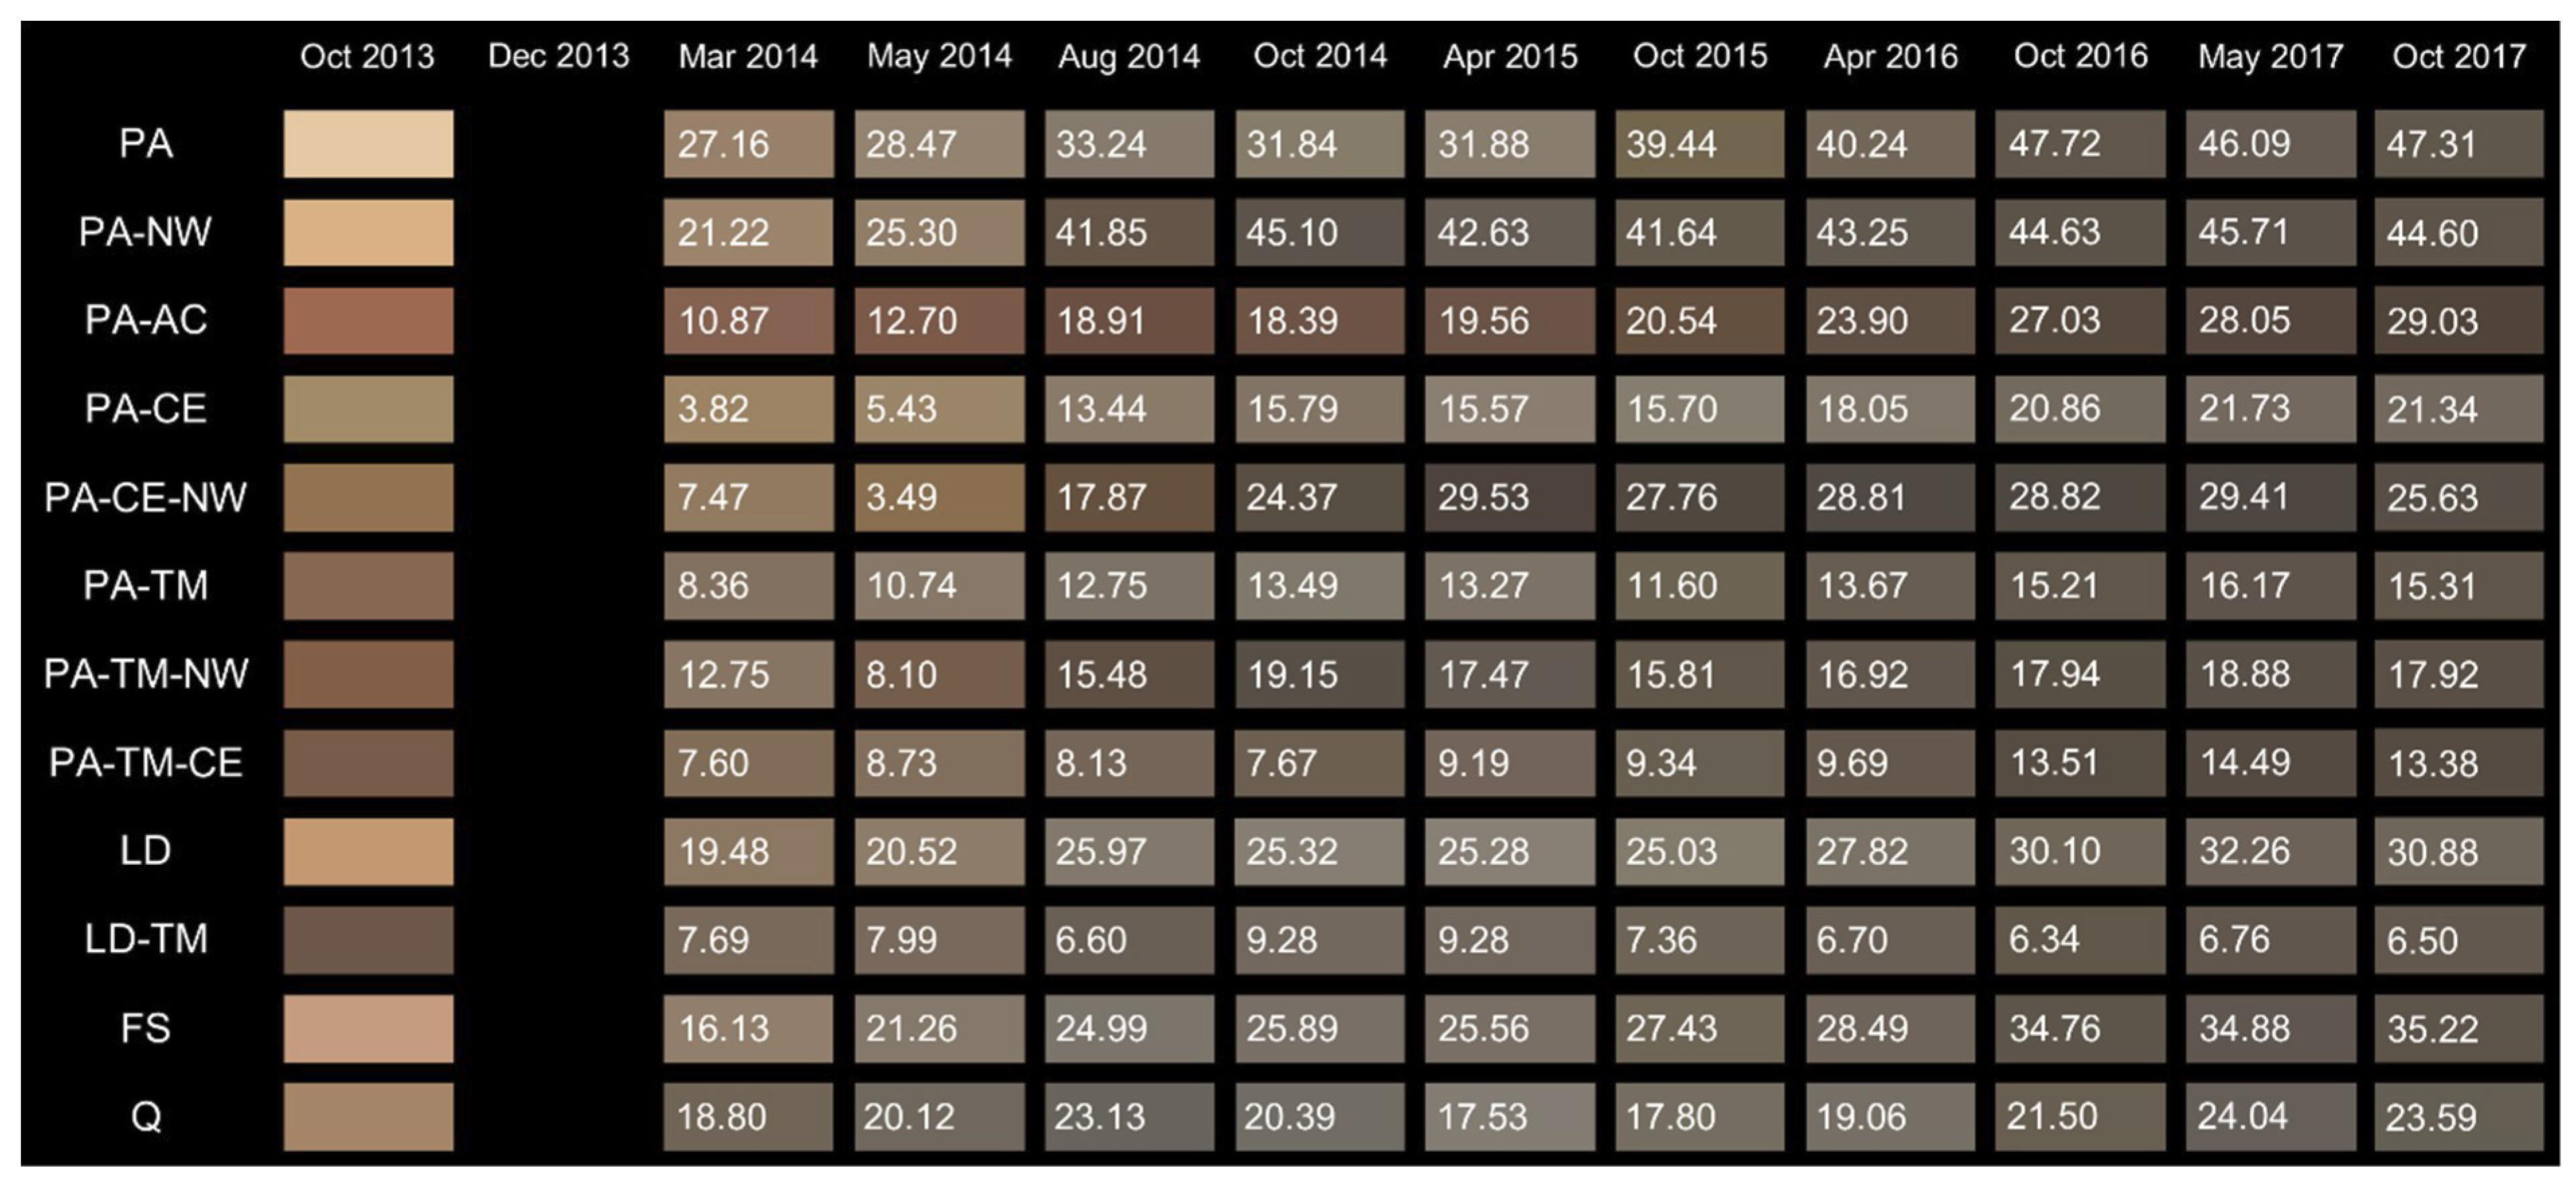
Figure 2, Figure 3, Figure 4, Figure 5 and Figure 6 show the averaged colour for each material and the calculated ΔE value (see Equation (1)), defined as the colour difference between the initial and the final stage. In general, the biggest colour difference was observed on the decking, with one exception, the thermally modified European larch (LD-TM), for which the ΔE was lowest on decking compared to other exposures. In addition, colour changes of thermally modified Norway spruce (PA-TM) on decking were not the most prominent; on the east and west façade, the colour difference was more notable. Generally, there was no correlation between which orientation of façade resulted in lower or higher colour changes. The prime reason for this was that the micro-positions of each material on respective façades differed, hence introducing an additional level of uncertainty. If individual materials were compared, it can be concluded that the lowest ΔE was observed on PA-TM-CE (copper-treated thermally-modified Norway spruce), followed by LD-TM (thermally-modified European larch) and PA-CE (copper-treated Norway spruce), and on the other side, the highest ΔE was measured on Norway spruce (PA), followed by wax treated Norway spruce (PA-NW) and European larch (LD). The modifications in wood structure occurring at high temperature were accompanied by several favourable changes in physical structure, i.e., enhanced weather resistance and a decorative, dark colour [47,48]. Values for ΣΔE (see Equation (2)) indicated that the course of the colour changes was fairly similar for all the exposure directions. One of the reasons for these observed differences originated in the initial colour. Norway spruce (PA), wax-treated Norway spruce (PA-NW), and European larch (LD) were lightly-coloured materials, so the development of the dark pigmented blue stain fungi was the most notable. On the other hand, the presence of fungicides (copper-based wood preservatives) prevented the development of the blue stain fungi (Table 2), whilst the presence of copper slowed down UV-induced degradation to a certain extent [49], which resulted in less noticeable colour differences (PA-CE and PA-TM-CE in Figure 2, Figure 3, Figure 4, Figure 5 and Figure 6).
The L*, a*, and b* values for all twelve materials in all exposure directions are shown in Figure 7. Grey and yellow rectangles mark the winter and summer months, respectively, to distinguish the predominant effect of each part of the year, e.g., darkening due to moulding in winter months and lightening due to UV irradiation in summer months (Table 2). On the north façade, the highest absolute ΔL* value after four years of natural weathering was calculated for Norway spruce (PA; 26.50), followed by European larch (LD; 17.29), wax-treated Norway spruce (PA-NW; 16.45), and European beech (FS; 14.07). These wood species are respectively classified as moderately, slightly, or not durable to attack by decay fungi according to EN 350 [50] and are susceptible if not treated to fungal disfigurement. All copper (II) ethanolamine impregnated samples, i.e., copper- and wax-treated Norway spruce (PA-CE-NW; 0.67), copper-treated Norway spruce (PA-CE; 3.25), and copper-treated thermally-modified Norway spruce (PA-TM-CE; 4.66), were among the materials with the lowest absolute ΔL*. The reason for the observed phenomena was mentioned previously and is assigned to the presence of copper-based active ingredients with a clearly proven fungicidal effect [51]. Acrylic-coated Norway spruce (PA-AC) stood out from all other materials with the highest a* values, but the Δa* value after four years of weathering was the lowest (0.92), because of the pigments in the acrylic coating. This proved that the pigments remained in the acrylic coating and effectively influenced the aesthetic performance of coated wood. On the other hand, the least prominent change of Δa* was determined to be copper-treated thermally-modified Norway spruce (PA-TM-CE; 1.05), whilst European beech (FS; 1.66) also had the slightest change. The main reason for the quite insignificant absolute Δa* change of beech wood specimens was the constant exposure of fresh beech wood due to wasps, which would constantly remove any degraded wood surface. It is a known fact that wasps construct paper covers for their nests using weathered wood [52]. The highest absolute Δa* was measured on thermally-modified Norway spruce (PA-TM; 7.59), followed by European larch (LD; 6.83) and copper-treated Norway spruce (PA-CE; 6.35). In general, a higher change was noted on the yellow-blue axis, i.e., the b* axis. The lowest difference in absolute Δb* was determined for acrylic-coated Norway spruce (PA-AC; 6.04), followed by copper-treated thermally-modified Norway spruce (PA-TM-CE; 6.07), thermally-modified European larch (LD-TM; 7.21), and thermally-modified wax-treated Norway spruce (PA-TM-NW; 11.99). With the exception of acrylic-coated wood, the other three materials belong to the group of thermally-modified materials, which clearly indicated their better colour stability on this blue–yellow chromatic axis. The better colour stability of thermally-modified wood is in accordance with previously published results [49]. In the respective article, a considerably lower colour change of thermally-modified wood during UV light exposure was determined when compared to that of non-modified wood. Both thermally-modified wood and non-treated wood showed similar, but less pronounced, changes visible from IR spectra, indicating that there is still some degradation of lignin and non-cellulosic polysaccharides, and formation of non-conjugated carbonyl groups, that ultimately resulted in some degree of colour change to light irradiated wood. A similar trend can be observed in all other exposure directions, but the ranking was also influenced by the precise position on the façade or decking, because of the additional protection by the roof overhang or shade from close-by trees, distance from the ground, and other factors that influence the weathering.
Blue staining assessment of the façade and decking elements of the model house was performed periodically (Table 2). As the samples were mounted, only the visible surface was assessed with the grades 0–4. Table 2 represents the changes after the first 20 months of exposure on the model house. Later assessments were not possible, as the grey colour of the fungal pigments was hard to distinguish from the grey surface of the weathered wood. During the study, it could be seen that the progression of blue staining processes was rather fast. The first materials were stained after the first month of exposure. Staining predominantly appeared (or was more visible) on light-coloured materials. Blue staining even continued through the following winter months, which was a result of a rather mild winter. After three months of exposure, only copper-treated materials were not affected by blue staining, i.e., copper-treated Norway spruce (PA-CE), copper- and wax-treated Norway spruce (PA-CE-NW), and thermally-modified copper treated Norway spruce (PA-TM-CE). After one year, only PA-CE and PA-TM-CE remained unaffected by staining fungi; however, after 18 months of exposure, at least some fungal disfigurement was evident on all tested materials. Because of the issues related to recognising fungal staining on weathered surfaces, visual evaluation was determined after 20 months of natural weathering.

3.2. Influence of Blue Staining and Artificial Weathering Test on Colour Changes

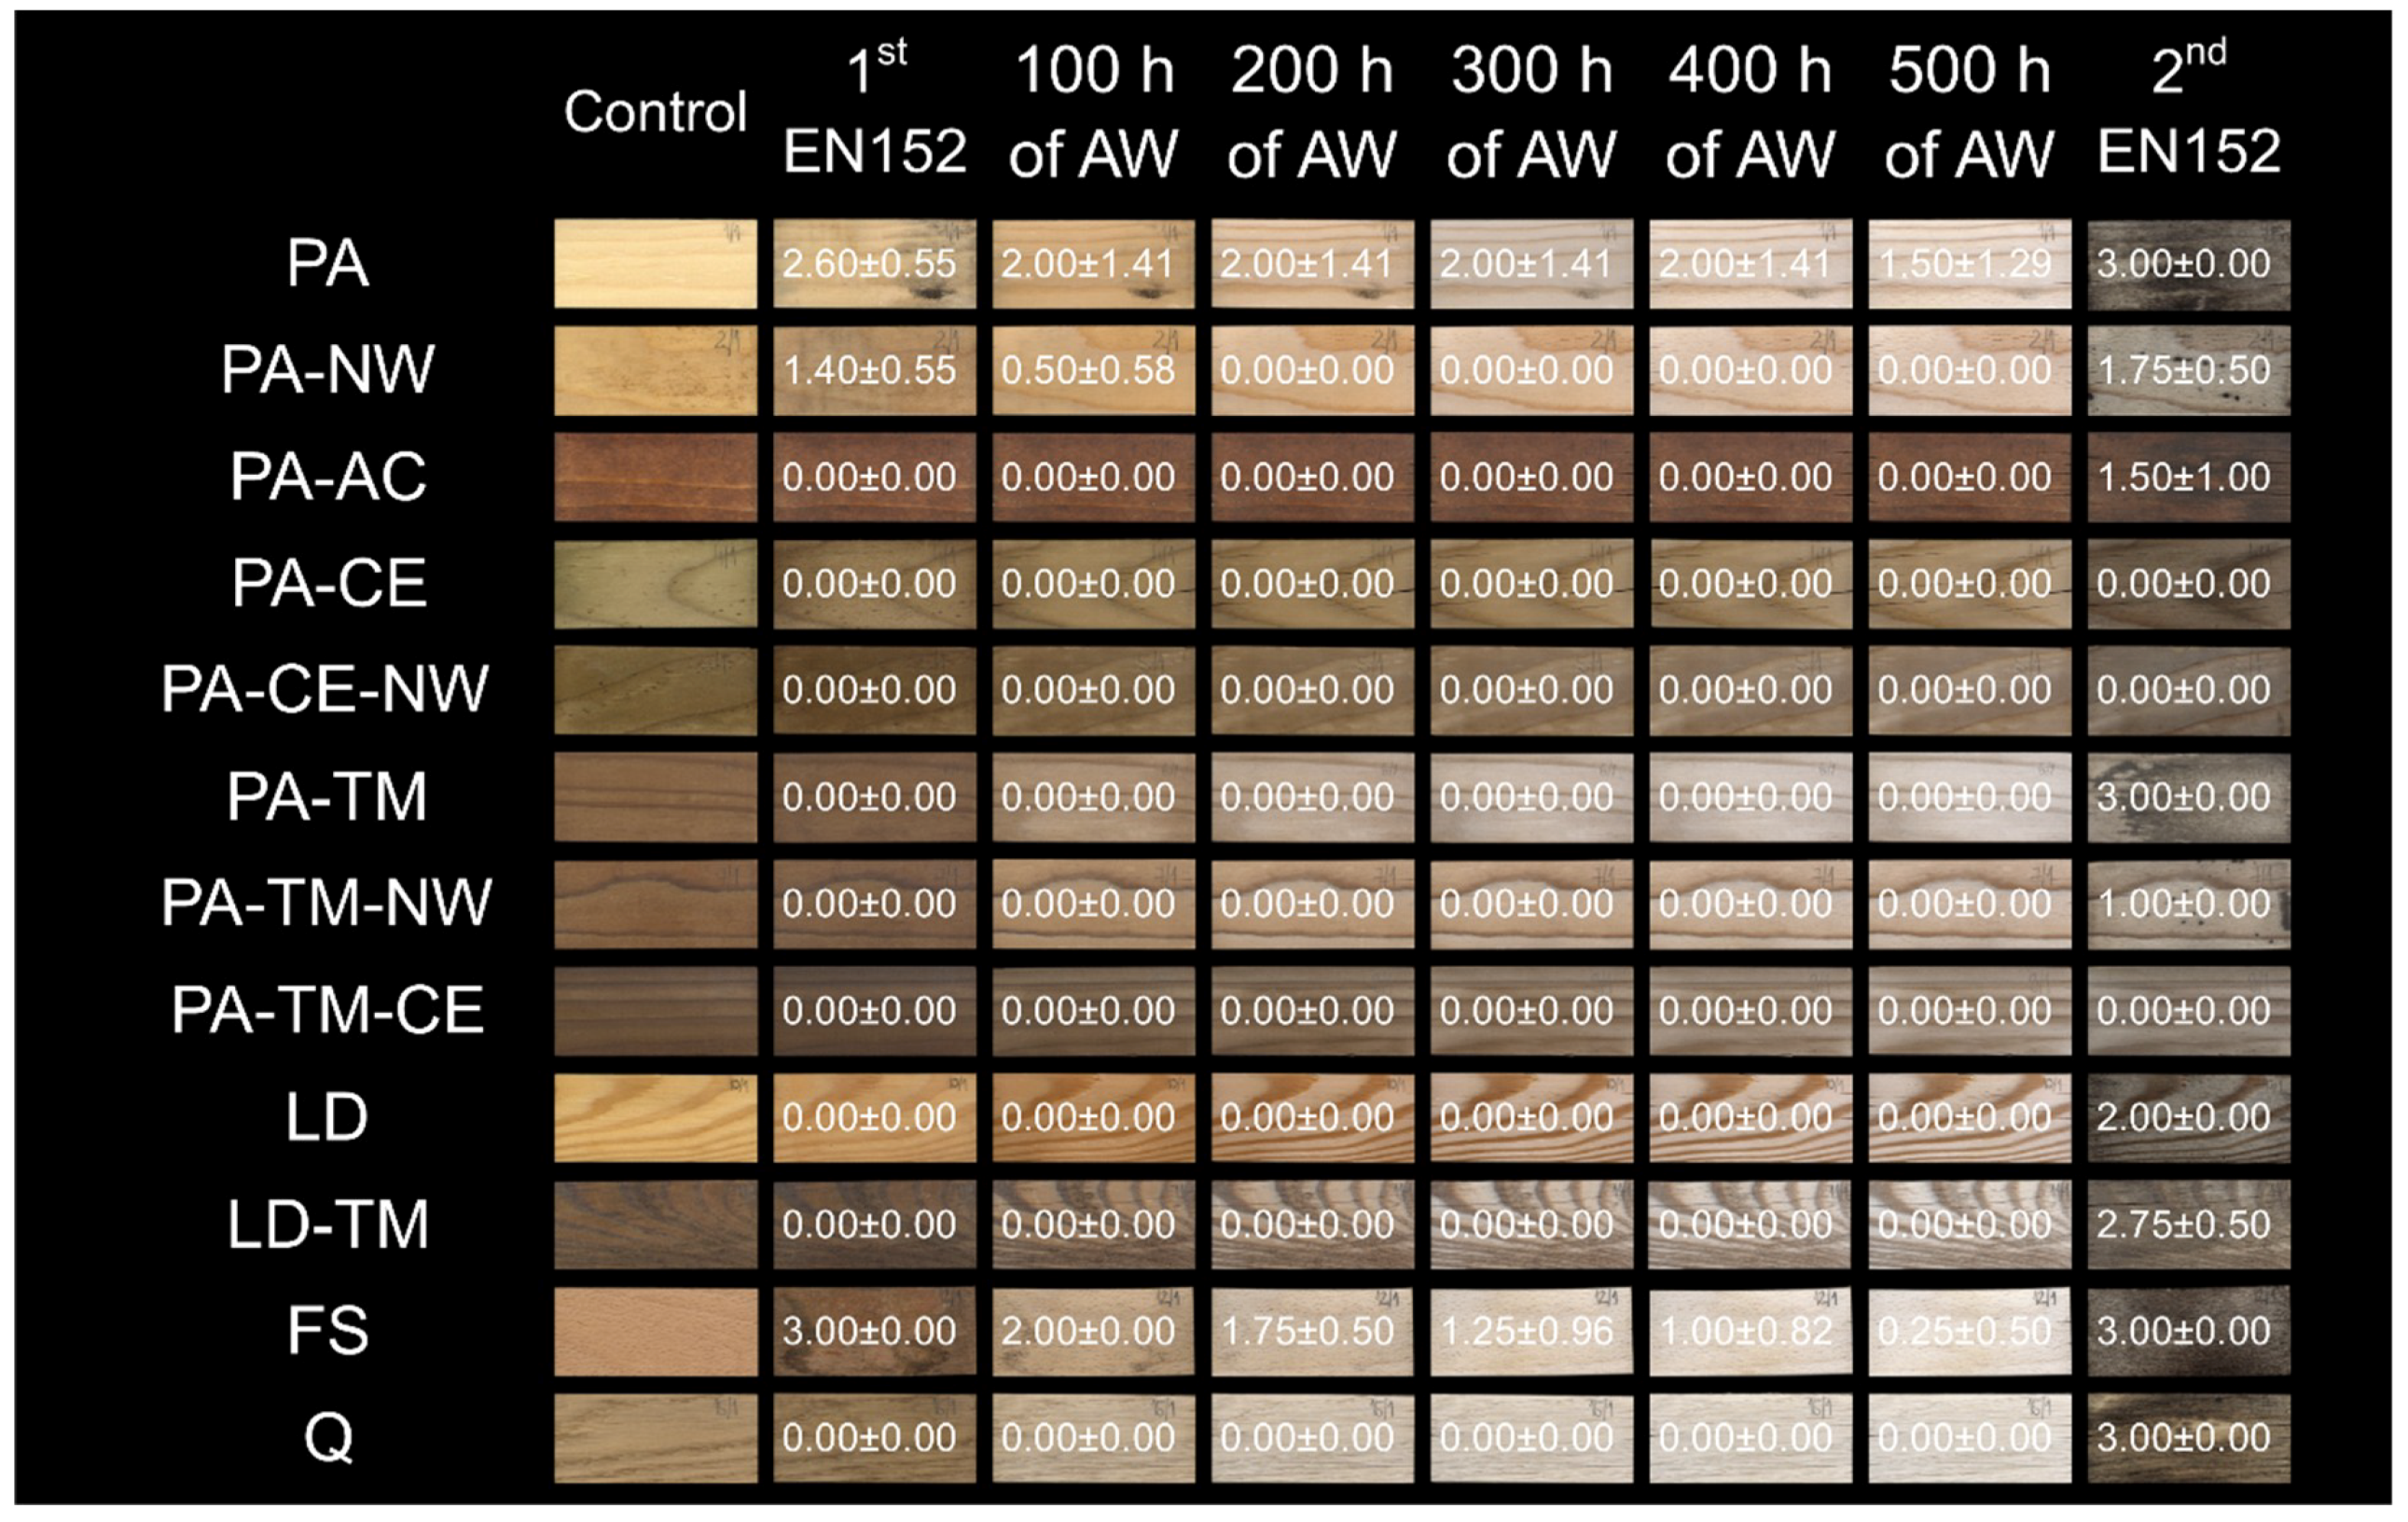
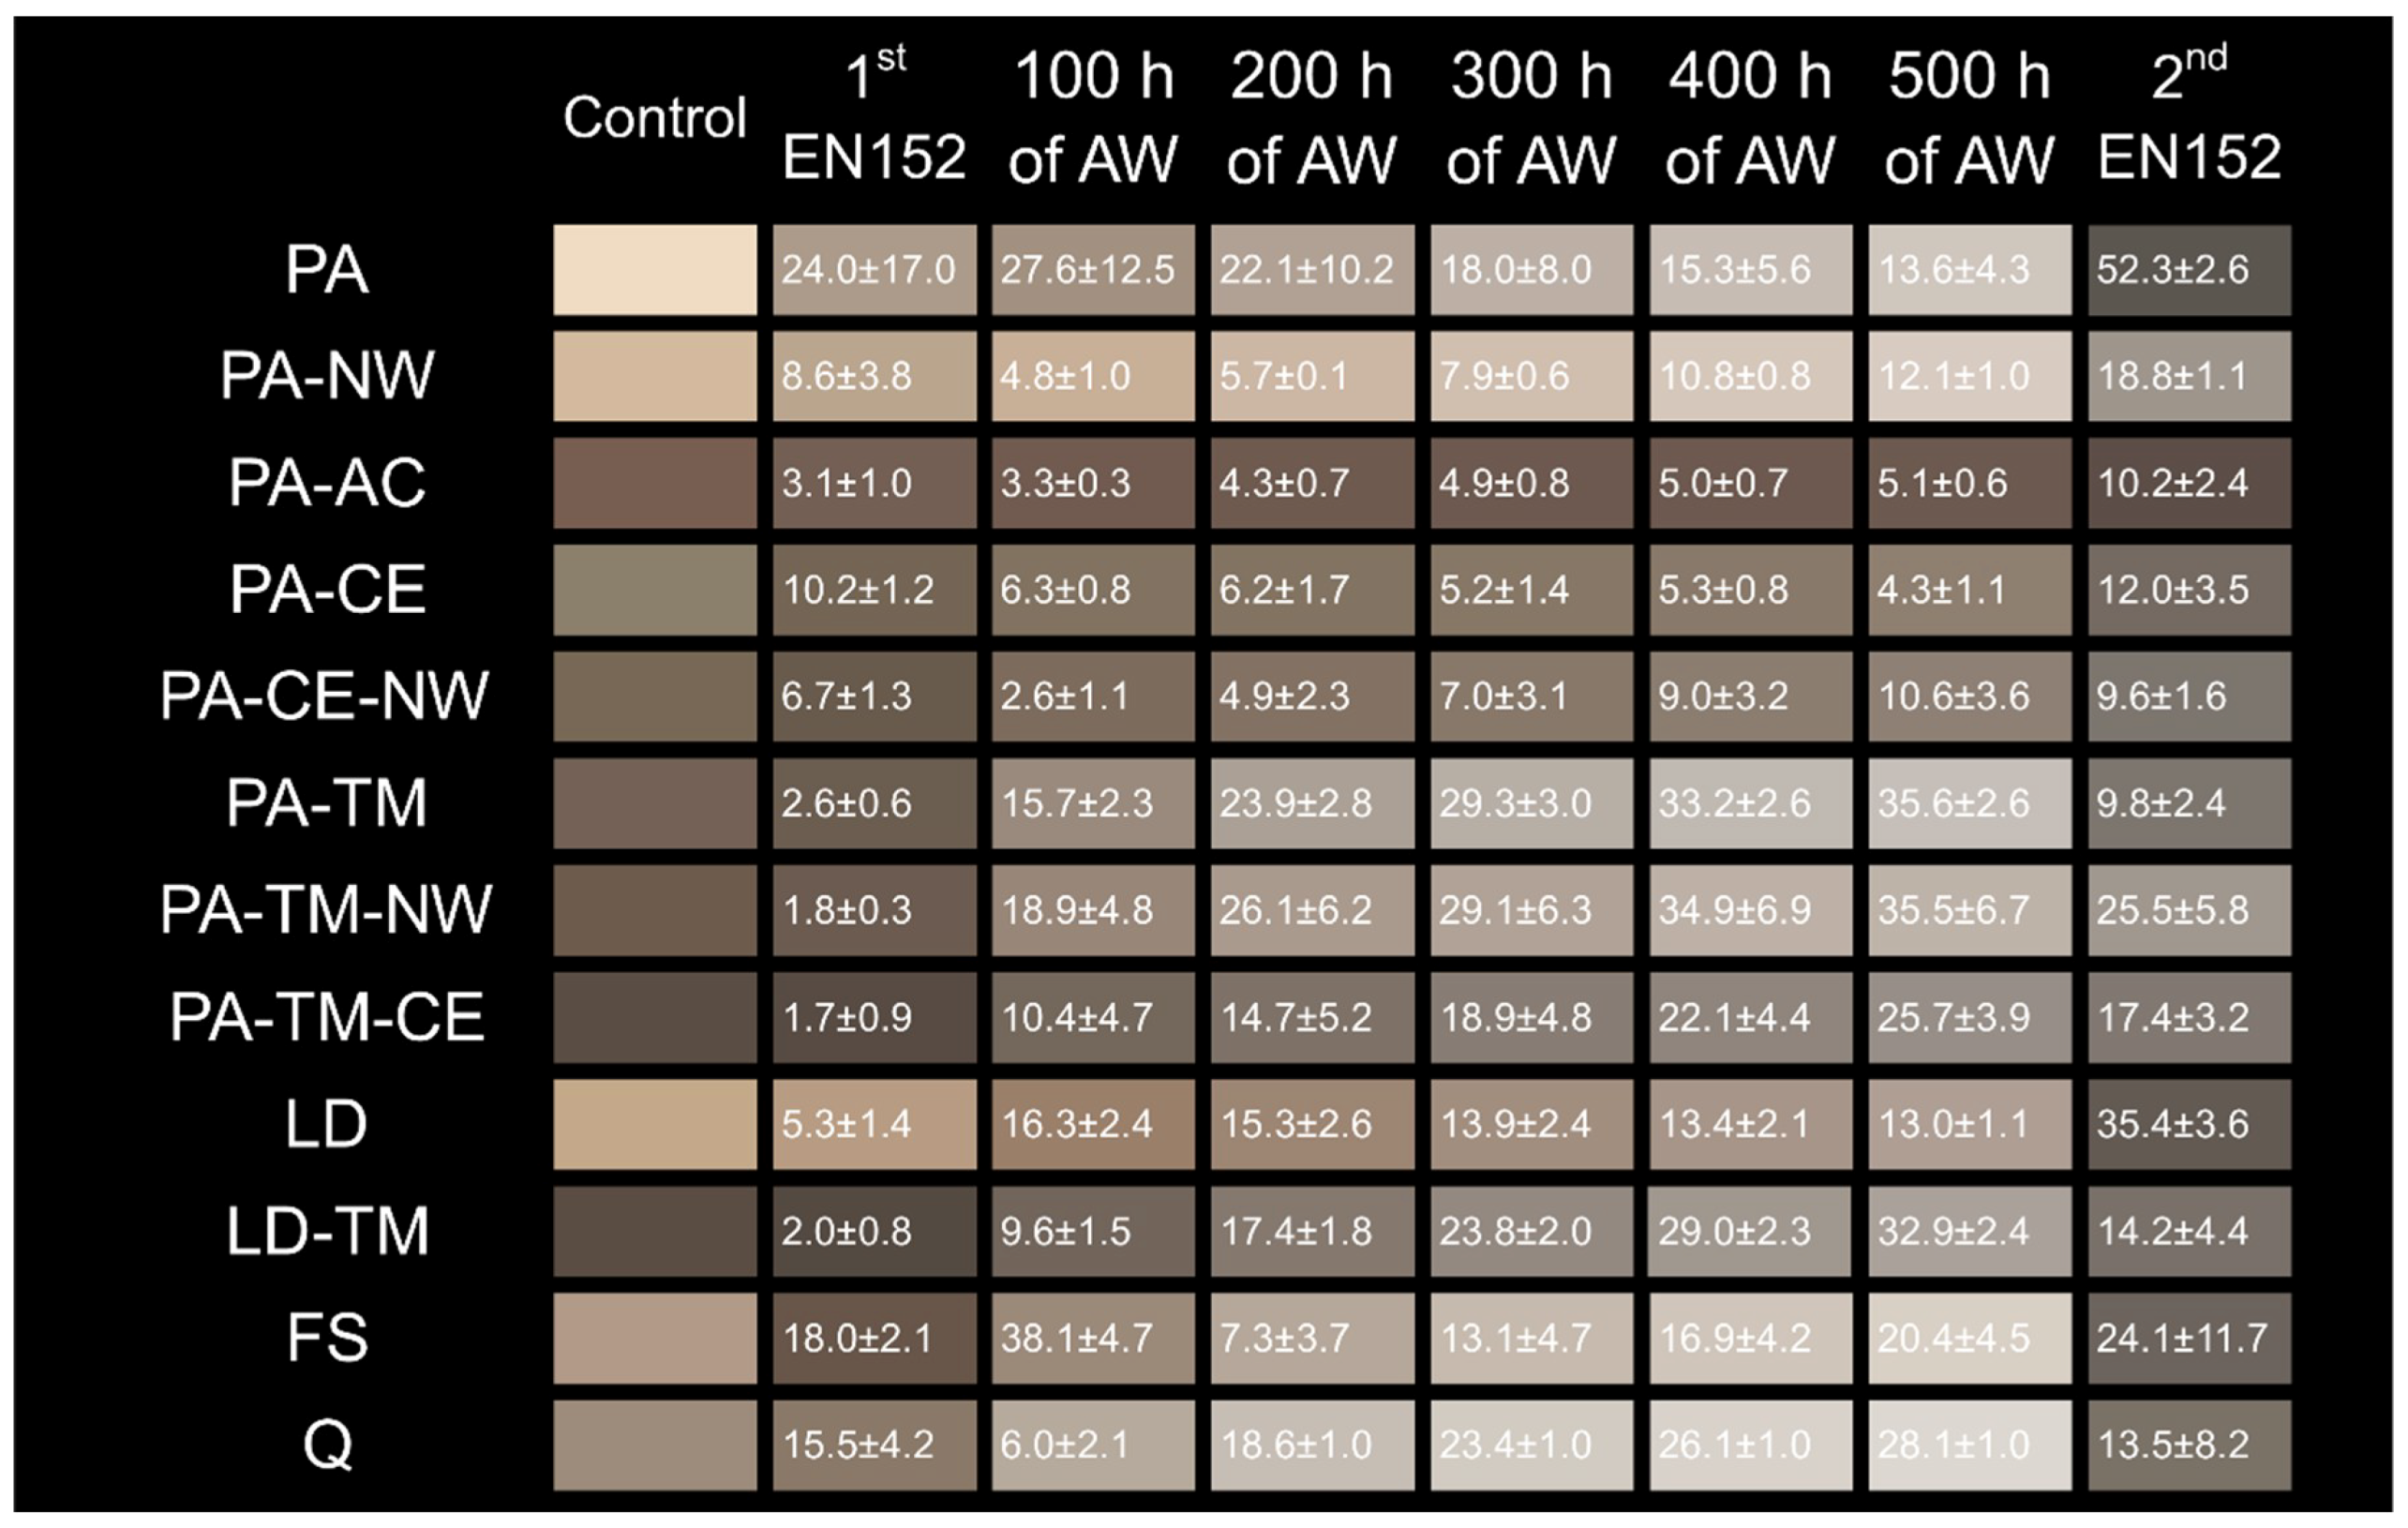
In the next part of the study, we decided to simulate weathering in the laboratory. Therefore, two types of tests were combined, namely exposure to blue stain fungi according to the EN 152 test [42] and artificial weathering. The EN 152 [42] standard test is designed for testing the efficacy of materials against blue staining organisms. The standard prescribes that the blue stained surface is evaluated with marks between 0 and 3 (Figure 8). After the first exposure of the samples to the suspension of fungal spores, only three out of twelve materials developed surface stains. Beechwood (FS) had the highest visual grade of blue stain discolouration (3.00 ± 0.00), followed by Norway spruce wood (PA; 2.60 ± 0.55) and wax-treated Norway spruce (PA-NW; 1.40 ± 0.55). As this type of evaluation is deterministic by its definition, we decided to evaluate blue staining with colour change measurements. Therefore, samples were scanned and their colour determined. Figure 9 shows colour changes of wood after the first blue staining, artificial weathering (AW), and the second blue staining. After the first exposure to blue stain fungi, the majority of the samples became considerably darker as a result of pigments from the micro-organisms, e.g., melanin, which is a dark, high-molecular-weight pigment within hyphal walls [7]. Only two materials, acrylic-coated Norway spruce (PA-AC) and thermally-modified wax-treated Norway spruce (PA-TM-NW), retained their original colours, predominately due to the dark colour of the thermally-modified wood (PA-TM-NW) and the dark colour of pigments in the acrylic coating (PA-AC). Considering all the colour changes expressed as a ΔE value in Figure 9, it can be clearly seen that the most prominent colour change was determined for light-coloured wood species; Norway spruce (PA; 24.0 ± 17.0) and European beech (FS; 18.0 ± 2.1). The least evident colour changes, where ΔE was lower than 3, were determined on thermally-modified wood. This is somehow expected, due to the dark colour of the thermally-modified wood. The respective difference is lower than the threshold (ΔE = 5) for the obvious difference in colour, as perceived by casual observations [53]. This result indicated that the original dark colour can make fungal disfigurement less notable.
In the second part of this study, an artificial weathering test (AW) was performed. Samples were exposed to water, UV, and IR light according to the prescribed regime described in Section 2.2. Specimens were visually assessed and scanned every 100 h of AW. As can be seen from Figure 8, it is notable that the staining became less visible. For example, European beech wood (FS) after 100 h of artificial weathering was downgraded from 3.00 ± 0.00 to 2.00 ± 0.00. A similar influence of artificial weathering was determined for Norway spruce (PA; 2.00 ± 1.41) and wax-treated Norway spruce (PA-NW; 0.50 ± 0.58). After the first 100 h of AW, all materials became lighter, with the exception of Norway spruce (PA), acrylic-coated Norway spruce (PA-AC), and European larch (LD). After 200 h of AW, fungal stains became even less visible; for example, wax-treated Norway spruce had no visible fungal stains (PA-NW; 0.00 ± 0.00). It can be deduced that wax-treated Norway spruce (PA-NW), acrylic-coated Norway spruce (PA-AC), and copper- and wax-treated Norway spruce (PA-CE-NW), after 100 h of AW, almost established the original colour prior to exposure. The rapid colour change observed during the first 200 h of irradiation is in line with other literature findings [49,54]. Srinivas and Pandey [30] reported that thermally-modified wood had a dark brown colour that lightened upon UV light exposure in contrast to the unmodified wood, which became darker. A similar trend was observed in this study, but only for Norway spruce (PA) and European larch (LD), not for European beech (FS) nor English oak (Q), and only after the first 100 h of UV irradiation. After 200 h, the lightness parameter (L*) increased on all twelve materials. The negative values of Δa* revealed a tendency for the samples to become greenish or to lose red pigmentation. In general (but with some exceptions), samples exhibited a lowering of the Δa* values throughout the experiment. It was also observed that more or less all the values showed negative values for Δb*, indicating a loss of yellow pigmentation and an increase of blue tones of weathered wood surfaces. Regarding the summed ΔE colour change (Equation (2)), throughout the whole test, acrylic-coated Norway spruce (PA-AC) was the most colour-stable material (ΣΔE = 11.90), followed by copper- and wax-treated Norway spruce (PA-CE-NW; ΣΔE = 28.84), copper-treated Norway spruce (PA-CE; ΣΔE = 30.83), and copper-treated thermally-modified Norway spruce (PA-TM-CE; ΣΔE = 37.32). On the other hand, European beech (FS; ΣΔE = 114.47), Norway spruce (PA; ΣΔE = 91.75), and English oak (Q; ΣΔE = 81.25) expressed the most prominent colour changes. The observed colour stability of coated Norway spruce can be associated with pigments used in coatings because they can absorb UV light and allow good colour retention by minimizing the degradation of the wood by UV light [55]. The value of summed ΔE of copper-treated Norway spruce (PA-CE) after 500 h of AW was 41.7 % less than the value of Norway spruce (PA), similar to the results presented in other studies [49,54]. Both studies explain better colour stability with the formation of phenolate and other complexes due to the interaction of copper ethanolamine with phenolic groups of lignin that inhibit the formation of free radicals. After the last 100 h of AW, the presence of fungal pigments became less and less visible and almost disappeared; in other words, Norway spruce (PA) was graded 1.50 ± 1.29 and European beech (FS) was 0.25 ± 0.50. A. pullulans, one of the most successful ascomycete fungi at colonizing weathered wood, has the ability to increase its production of melanin when exposed to UV radiation [8,56,57]. However, the conditions (UV exposure, heat) in the AW test were too harsh for fungi to survive, and consequently, the exposure to artificial weathering caused the degradation of polyphenolics (lignin) and depolymerisation of polysaccharides (cellulose, hemicelluloses) [17,58]. Wet cycles with water spray during AW washed out soluble degradation products from the wood surface and reduced the visibility of the discolouration previously caused by blue-stain fungi.
In the third part of the laboratory trial, EN 152 [42] was performed again on weathered wood samples and more prominent colour changes were noted for all exposed specimens, as shown in Figure 9. The greatest colour change was measured for Norway spruce (PA; 52.3 ± 2.6) and European larch (LD; 35.4 ± 3.6). It is obvious that artificial weathering makes the surface more susceptible to fungal disfigurement. There are several explanations for this phenomenon. Firstly, UV radiation and spraying degrade and leach coloured secondary metabolites from the surface. In addition, partial degradation of lignin and cellulose occurred, which made them more susceptible to fungal infestation. Average ΔE among all specimens after first exposure to blue-staining fungi was 13.3, while average ΔE after second exposure was considerably higher, at 20.2. This can be explained by the ability of A. pullulans to utilise products of lignocellulosic photo-degradation, due to the ability of the fungus to use lignin-breakdown products as a sole carbon and energy source [59,60]. In addition, grades of visual assessment also increased significantly. After the second exposure, three materials remained non-discoloured, namely: copper-treated Norway spruce (PA-CE), copper- and wax-treated Norway spruce (PA-CE-NW), and thermally-modified copper-treated Norway spruce (PA-TM-CE), all of which were impregnated with a copper-based preservative. This observation is in line with the in-service testing presented in Section 3.1. This indicates that only biocides can limit fungal discolouration after severe weathering.

3.3. Pearson’s Correlations Factors for Colour Change between In-Service and Laboratory Testing

One of the prime objectives of the respective manuscript was to determine the most predictable laboratory method for the simulation of colour changes on outdoor exposed wood. Table 3 gives the Pearson’s correlation factors for colour change (ΔE) for all twelve materials between the in-service results, i.e., natural weathering on the model house, and laboratory testing, i.e., the combination of EN 152 and artificial weathering. In general, the correlations were low or even negative for all exposure directions from one year of natural weathering (October 2014) or with the laboratory testing from 200 h of artificial weathering. South and west exposure presented good correlations with March and April 2014 and 200 h to 500 h of AW. In addition, the north exposure also exhibited quite high correlations with December 2013 to April 2014 and 200 h to 500 h of AW, but probably as a result of better protection against wetting and a lower moulding rate (Table 2). Decking gave the best correlations with the first and the second exposure to blue-stain fungi for almost all periods of in-service testing. This indicated that the staining was the predominant cause of colour changes in the respective application. East and west exposure sites also displayed good correlations with the first and the second exposure to blue-stain fungi, and north exposure only with the second exposure to the EN 152 test.
As shown in Table 4, a significant correlation between east and west exposure was observed for almost all the materials, with the highest values for Norway spruce (PA; r = 0.9812, p < 0.0001) and wax-treated Norway spruce (PA-NW; r = 0.9798, p < 0.0001). This can be explained, since the exposure locations on both façades are comparable, with the absence of roof overhang, i.e., the influence of UV radiation. Only one material had a negative correlation between the east and west direction: thermally-modified European larch (LD-TM; r = −0.5800, P = 0.0788). In addition, decking correlated quite well with all exposure sites for Norway spruce, acrylic-coated Norway spruce, European larch, and European beech (PA, PA-AC, LD, and FS), with a statistically significant correlation.
However, the most important objective of the respective research was to show how the in-service test correlated with the laboratory trial. The best correlations with the laboratory trial and in-service test (for each exposure site separately) were determined for wax-treated Norway spruce (PA-NW) with a south (r = 0.8643, P = 0.0264), east (r = 0.7957, P = 0.0324), and west (r = 0.9158, P = 0.0103) direction. A strong positive correlation was also found for acrylic-coated Norway spruce (PA-AC) between the south and laboratory trial (r = 0.8160, P = 0.0477), and for thermally-modified Norway spruce (PA-TM) between the east and laboratory trial (r = 0.7702, P = 0.0428).

4. Conclusions

The average summed ΔE for all materials exposed in the in-service experiment on a model house was the lowest for the south (40.82) and east (40.95) exposure directions. The highest average summed ΔE was determined on decking elements (48.64). In addition, material that exhibited the lowest summed ΔE for all exposure directions was acrylic-coated Norway spruce (PA-AC; 33.70), followed by thermally-modified and copper-treated Norway spruce (PA-TM-CE; 35.63) and European larch (LD-TM; 35.65). On the contrary, Norway spruce, PA, displayed the highest summed ΔE (55.94).
To some extent, colour measurements show the seasonal fluctuating pattern, especially for lightness (L* value). This phenomenon was tested with the laboratory test, where samples were exposed to artificial weathering (AW) for 500 h after performing the EN 152 test. At the end of AW, EN 152 was performed again, to see the effect of weathering on the growth of blue staining fungi. It was figured out that only three materials, Norway spruce (PA), wax-treated Norway spruce (PA-NW), and European beech (FS), were stained after the first EN 152 trial and that after 500 h of UV irradiation, almost all stains were bleached out. After the second EN 152 test, all but copper-ethanolamine treated samples were stained and to a significantly greater extent than after the first blue-staining test. This indicates that only biocides can limit fungal discolouration after severe weathering.
The aim of the respective work was to determine the correlations between the in-service test and the laboratory test. The results showed that there are some high correlations with statistical significance, but it would be impossible to precisely predict the level of colour change using only the described laboratory test. The best correlations between the laboratory trial and in-service test (for each exposure site separately) were determined for wax-treated Norway spruce (PA-NW) with south (r = 0.8643, P = 0.0264), east (r = 0.7957, P = 0.0324), and west (r = 0.9158, P = 0.0103) directions. A strong positive correlation was also found for acrylic-coated Norway spruce (PA-AC) between the south direction and laboratory trial (r = 0.8160, P = 0.0477), and for thermally-modified Norway spruce (PA-TM) between the east direction and laboratory trial (r = 0.7702, P = 0.0428).
Further to the work herein, the influence of the weather, e.g., relative humidity, surface temperature, and solar irradiation as described in Charisi et al. [61], on the colour change of different wood-based materials and the possibility of modelling and predicting the colour changes in an outdoor environment will be investigated.

Author Contributions

M.H. provided the overall idea for this research, provided founding, and designed the experiment. D.K. performed the majority of the laboratory experiments and data analysis and wrote a major part of the manuscript. M.H., B.L., D.K. and N.T. set up the model house and performed outdoor monitoring. All of the authors contributed to the discussion, commenting on, and editing of the paper.

Funding

The research was founded through the support of the Slovenian Research Agency within the framework of projects L4-5517, L4-7547, program P4-0015, and the infrastructural centre (IC LES PST 0481-09). Part of the research was supported by the program: Sustainable and innovative construction of smart buildings—TIGR4smart (C3330-16-529003).

Acknowledgments

Technical support of Samo Grbec and Andreja Žagar is acknowledged.

Conflicts of Interest

The authors declare no conflict of interest.

References

  1. Viitanen, H.; Toratti, T.; Makkonen, L.; Thelandersson, S.; Isaksson, T.; Früwald, E.; Jermer, J.; Englund, F.; Suttie, E. Modelling of service life and durability of wooden structures. In Proceedings of the 9th Nordic Symposium on Building Physics—NSB 2011, Tampere, Finland, 29 May–2 June 2011; Volume 2, pp. 925–932. [Google Scholar]
  2. Isaksson, T.; Thelandersson, S.; Brischke, C.; Jermer, J. Service Life of Wood in Outdoor above Ground Applications—Engineering Design Guidline; Report TVBK-3060; Division of Structural Engineering, Lund University: Lund, Sweden, 2011; Available online: http://www.kstr.lth.se/fileadmin/kstr/pdf_files/Guideline/TVBK3067.pdf (accessed on 29 November 2017).
  3. Burud, I.; Smeland, K.A.; Thiis, T.K.; Gobakken, L.R.; Sandak, A.; Sandak, J.; Liland, K.H. Modeling weather degradation of wooden facades using NIR hyperspectral imaging on thin wood samples. In Proceedings of the World Conference on Timber Engineering, Vienna, Austria, 22–25 August 2016; p. 8. [Google Scholar]
  4. Sandak, A.; Sandak, J. Prediction of service life—Does aesthetic matter? In Proceedings of the IRG Annual Meeting 2017, Ghent, Belgium, 4–8 June 2017.
  5. George, B.; Suttie, E.; Merlin, A.; Deglise, X. Photodegradation and photostabilisation of wood—The state of the art. Polym. Degrad. Stab. 2005, 88, 268–274. [Google Scholar] [CrossRef]
  6. Isaksson, T.; Brischke, C.; Thelandersson, S. Development of decay performance models for outdoor timber structures. Mater. Struct. 2013, 46, 1209–1225. [Google Scholar] [CrossRef]
  7. Zink, P.; Fengel, D. Studies on the Colouring Matter of Blue-stain Fungi. Part 1. General Characterization and the Associated Compounds. Holzforschung 1988, 42, 217–220. [Google Scholar] [CrossRef]
  8. Hernández, V.A.; Evans, P.D. Effects of UV radiation on melanization and growth of fungi isolated from weathered wood surfaces. In Proceedings of the IRG Annual Meeting 2015, Viña del Mar, Chile, 10–14 May 2015; pp. 1–12. [Google Scholar]
  9. Walther, T.; Reinsch, H.; Grosse, A.; Ostermann, K.; Deutsch, A.; Bley, T. Mathematical modeling of regulatory mechanisms in yeast colony development. J. Theor. Biol. 2004, 229, 327–338. [Google Scholar] [CrossRef] [PubMed]
  10. Van Den Bulcke, J.; Van Acker, J.; Stevens, M. Laboratory testing and computer simulation of blue stain growth on and in wood coatings. Int. Biodeterior. Biodegrad. 2007, 59, 137–147. [Google Scholar] [CrossRef]
  11. Humar, M.; Vek, V.; Bučar, B. Properties of blue-stained wood. Drv. Ind. 2008, 59, 75–79. [Google Scholar]
  12. Fojutowski, A. The influence of fungi causing blue—stain on absorptiveness of Scotch pine wood. In Proceedings of the IRG Annual Meeting 2005, Viña del Mar, Chile, 10–14 May 2005; pp. 1–5. [Google Scholar]
  13. Sharpe, P.R.; Dickinson, D.J. Blue stain in service on wood surface coatings. Part 1: The nutritional requirements of Aureobasidium pullulans. In Proceedings of the IRG Annual Meeting 1992, Harrogate, UK, 10–15 May 1992. [Google Scholar]
  14. Schmidt, O. Wood and Tree Fungi: Biology, Damage, Protection, and Use; Springer: Berlin/Heidelberg, Germany, 2006. [Google Scholar]
  15. Ayadi, N.; Lejeune, F.; Charrier, F.; Charrier, B.; Merlin, A. Colour stability of heat-treated wood during artificial weathering. Holz als Roh- und Werkstoff 2003, 61, 221–226. [Google Scholar] [CrossRef]
  16. Hayoz, P.; Peter, W.; Rogez, D. A new innovative stabilization method for the protection of natural wood. Prog. Org. Coat. 2003, 48, 297–309. [Google Scholar] [CrossRef]
  17. Feist, W.C. Outdoor Wood Weathering and Protection; Rowell, R.M., Barbour, R.J., Eds.; American Chemical Society: Washington, DC, USA, 1990; pp. 263–298. [Google Scholar] [CrossRef]
  18. Kalnins, M.A. Surface Characteristics of Wood as They Affect Durability of Finishes; United States Department of Agriculture, Forest Products Laboratory: Madison, WI, USA, 1966; 60p.
  19. Feist, W.C.; Hon, D.N.-S. Chemistry of weathering and protection. Chem. Solid Wood 1984, 207, 401–451. [Google Scholar]
  20. Hon, D.N.-S. Weathering and photochemistry of wood. Wood Cell. Chem. 2001, 2, 512–546. [Google Scholar]
  21. Kielmann, B.C.; Mai, C. Natural weathering performance and the effect of light stabilizers in water-based coating formulations on resin-modified and dye-stained beech-wood. J. Coat. Technol. Res. 2016, 13, 1065–1074. [Google Scholar] [CrossRef]
  22. Cogulet, A.; Blanchet, P.; Landry, V. The Multifactorial Aspect of Wood Weathering: A Review Based on a Holistic Approach of Wood Degradation Protected by Clear Coating. BioResources 2018, 13, 2116–2138. [Google Scholar] [CrossRef]
  23. Williams, R.S. Weathering of Wood. In Handbook of Wood Chemistry and Wood Composites; CRC Press: Boca Raton, FL, USA, 2005. [Google Scholar]
  24. Pánek, M.; Oberhofnerová, E.; Zeidler, A.; Šedivka, P. Efficacy of Hydrophobic Coatings in Protecting Oak Wood Surfaces during Accelerated Weathering. Coatings 2017, 7, 172. [Google Scholar] [CrossRef]
  25. Herrera, R.; Sandak, J.; Robles, E.; Krystofiak, T.; Labidi, J. Weathering Resistance of Thermally Modified Wood Finished with Coatings of Diverse Formulations. Prog. Org. Coat. 2018, 119, 145–154. [Google Scholar] [CrossRef]
  26. Pandey, K.K. A note on the influence of extractives on the photo-discoloration and photodegradation of wood. Polym. Degrad. Stab. 2005, 87, 375–379. [Google Scholar] [CrossRef]
  27. Oberhofnerová, E.; Pánek, M.; García-Cimarras, A. The Effect of Natural Weathering on Untreated Wood Surface. Maderas Cienc. Tecnol. 2017, 19, 173–184. [Google Scholar] [CrossRef]
  28. Ugovšek, A.; Šubic, B.; Starman, J.; Rep, G.; Humar, M.; Lesar, B.; Thaler, N.; Brischke, C.; Meyer-Veltrup, L.; Jones, D.; et al. Short-Term Performance of Wooden Windows and Facade Elements Made of Thermally Modified and Non-Modified Norway Spruce in Different Natural Environments. Wood Mater. Sci. Eng. 2018, 1–6. [Google Scholar] [CrossRef]
  29. Forsthuber, B.; Grüll, G. Prediction of Wood Surface Discoloration for Applications in the Field of Architecture. Wood Sci. Technol. 2018, 52, 1093–1111. [Google Scholar] [CrossRef]
  30. Srinivas, K.; Pandey, K.K. Photodegradation of thermally modified wood. J. Photochem. Photobiol. B Biol. 2012, 117, 140–145. [Google Scholar] [CrossRef] [PubMed]
  31. Rüther, P.; Jelle, B.P. Colour changes of wood and wood-based materials due to natural and artificial weathering. Wood Mater. Sci. Eng. 2013, 8, 13–25. [Google Scholar] [CrossRef]
  32. Pánek, M.; Reinprecht, L. Effect of vegetable oils on the colour stability of four tropical woods during natural and artificial weathering. J. Wood Sci. 2016, 62, 74–84. [Google Scholar] [CrossRef]
  33. Teacă, C.-A.; Roşu, D.; Bodîrlău, R.; Roşu, L. Structural Changes in Wood under Artificial UV Light Irradiation Determined by FTIR Spectroscopy and Color Measurements—A Brief Review. BioResources 2013, 8, 1478–1507. [Google Scholar] [CrossRef]
  34. Agresti, G.; Bonifazi, G.; Calienno, L.; Capobianco, G.; Lo Monaco, A.; Pelosi, C.; Picchio, R.; Serranti, S. Surface Investigation of Photo-Degraded Wood by Colour Monitoring, Infrared Spectroscopy, and Hyperspectral Imaging. J. Spectrosc. 2013, 2013, 380536. [Google Scholar] [CrossRef]
  35. Pandey, K.K. Study of the Effect of Photo-Irradiation on the Surface Chemistry of Wood. Polym. Degrad. Stab. 2005, 90, 9–20. [Google Scholar] [CrossRef]
  36. Rep, G.; Pohleven, F. Wood modification—A promising method for wood preservation. Drv. Ind. 2001, 52, 71–76. [Google Scholar]
  37. Rep, G.; Pohleven, F.; Bučar, B. Characteristics of thermally modified wood in vacuum. In Proceedings of the IRG Annual Meeting 2004, Ljubljana, Slovenia, 6–10 June 2004; p. 9. [Google Scholar]
  38. Humar, M.; Pohleven, F. Solution for Wood Preservation. European Patent EP 1791682 (B1), 3 September 2008. [Google Scholar]
  39. Thelandersson, S.; Isaksson, T.; Suttie, E.; Frühwald, E.; Toratti, T.; Grüll, G.; Viitanen, H.; Jermer, J. Quantitative design guideline for wood outdoors above ground applications. In Proceedings of the IRG Annual Meeting 2011, Queenstown, New Zealand, 8–12 May 2011; International research group on wood protection: Stockholm, Sweden, 2011; p. 19. Available online: http://lup.lub.lu.se/search/ws/files/5572865/2154681.pdf (accessed on 26 May 2018).
  40. Humar, M.; Kržišnik, D.; Lesar, B.; Thaler, N.; Ugovšek, A.; Zupančič, K.; Žlahtič, M. Thermal modification of wax-impregnated wood to enhance its physical, mechanical, and biological properties. Holzforschung 2017, 71, 57–64. [Google Scholar] [CrossRef]
  41. Johansson, P.; Ekstrand-Tobin, A.; Svensson, T.; Bok, G. Laboratory study to determine the critical moisture level for mould growth on building materials. Int. Biodeterior. Biodegrad. 2012, 73, 23–32. [Google Scholar] [CrossRef]
  42. CEN. European Standard EN 152. Wood Preservatives. Determination of the protective effectiveness of a preservative treatment against blue stain in wood in service. Laboratory method. In Proceedings of the B/515, Brussels, Belgium, 2012; BSI: London, UK, 2012; Available online: https://shop.bsigroup.com/ProductDetail/?pid=000000000030212121 (accessed on 12 October 2014).
  43. Raspor, P.; Smole-Možina, S.; Podjavoršek, J.; Pohleven, F.; Gogala, N.; V Nekrep, F.; Rogelj, I.; Hacin, J. ZIM: Zbirka Industrijskih Mikroorganizmov. Katalog Biokultur; Biotehniška fakulteta, Katedra za Biotehnologijo: Ljubljana, Slovenia, 1995. [Google Scholar]
  44. CEN. Paints and varnishes—Methods of exposure to laboratory light sources—Part 1: General guidance. In Proceedings of ISO/TC 35/SC 9 General Test Methods for Paints and Varnishes, Brussels, Belgium, 2013; BSI: London, UK, 2013; Available online: https://www.iso.org/obp/ui/#iso:std:iso:16474:-1:ed-1:v1:en (accessed on 12 October 2014).
  45. CIE, Colourimetry—Part 4: CIE 1976 L*a*b* Colour Space. 2007. Available online: http://www.cie.co.at/publications/colorimetry-part-4-cie-1976-lab-colour-space (accessed on 12 October 2014).
  46. Humar, M.; Kržišnik, D.; Lesar, B.; Ugovšek, A.; Rep, G.; Šubic, B.; Thaler, N.; Žlahtič, M. Performance of window, door, decking and façade elements made of thermally modified spruce wood on model house in Ljubljana. In Proceedings of the 27th International Conference on Wood Science and Technology (ICWST) Implementation of Wood Science in Woodworking Sector, Zagreb, Croatia, 13–14 October 2016; pp. 75–82. [Google Scholar]
  47. Yildiz, S.; Gümüşkaya, E. The effects of thermal modification on crystalline structure of cellulose in soft and hardwood. Build. Environ. 2007, 42, 62–67. [Google Scholar] [CrossRef]
  48. Yildiz, S.; Tomak, E.D.; Yildiz, U.C.; Ustaomer, D. Effect of artificial weathering on the properties of heat treated wood. Polym. Degrad. Stab. 2013, 98, 1419–1427. [Google Scholar] [CrossRef]
  49. Deka, M.; Humar, M.; Rep, G.; Kričej, B.; Šentjurc, M.; Petrič, M. Effects of UV light irradiation on colour stability of thermally modified, copper ethanolamine treated and non-modified wood: EPR and DRIFT spectroscopic studies. Wood Sci. Technol. 2008, 42, 5–20. [Google Scholar] [CrossRef]
  50. CEN. EN 350–Durability of wood and wood-based products. Testing and classification of the durability to biological agents of wood and wood-based materials. In Proceedings of the B/515, October, 2016; BSI: London, UK, 2016. [Google Scholar]
  51. Thaler, N.; Lesar, B.; Humar, M. Performance of Copper-Ethanolamine-impregnated Scots Pine Wood during Exposure to Terrestrial Microorganisms. Bioresources 2013, 8, 3299–3308. [Google Scholar] [CrossRef]
  52. Schmolz, E.; Brüders, N.; Daum, R.; Lamprecht, I. Thermoanalytical investigations on paper covers of social wasps. Thermochim. Acta 2000, 361, 121–129. Available online: https://ac.els-cdn.com/S0040603100005530/1-s2.0-S0040603100005530-main.pdf?_tid=ad8fc58b-6cd3-4df1-b1a0-34deaf292e7c&acdnat=1520343132_d977f0f4bb497addb1bfa7223354e1e9 (accessed on 6 March 2018). [CrossRef]
  53. Mokrzycki, W.S.; Tatol, M. Colour difference Delta E—A survey. Mach. Graph. Vis. 2011, 20, 383–411. [Google Scholar]
  54. Kamdem, D.P.; Grelier, S. Surface Roughness and Colour Change of Copper Amine and UV Absorber-Treated Red Maple (Acer rubrum) Exposed to Artificial Ultraviolet Ligh. Holzforschung 2002, 56, 473–478. Available online: https://www.degruyter.com/downloadpdf/j/hfsg.2002.56.issue-5/hf.2002.073/hf.2002.073.pdf (accessed on 22 November 2017). [CrossRef]
  55. Landry, V.; Blanchet, P. Weathering resistance of opaque PVDF-acrylic coatings applied on wood substrates. Prog. Org. Coat. 2012, 75, 494–501. [Google Scholar] [CrossRef]
  56. Hernández, V.A.; Evans, P.D. Technical Note: Melanization of the wood-staining fungus Aureobasidium pullulans in response to UV radiation. Wood Fiber Sci. 2015, 47, 120–124. [Google Scholar]
  57. Hernández, V.A. Role of Non-Decay Fungi on the Weathering of Wood. Ph.D. Thesis, The University of British Columbia, Vancouver, BC, Canada, September 2012. [Google Scholar]
  58. Evans, P.D.; Thay, P.D.; Schmalzl, K.J. Degradation of wood surfaces during natural weathering. Effects on lignin and cellulose and on the adhesion of acrylic latex primers. Wood Sci. Technol. 1996, 30, 411–422. [Google Scholar] [CrossRef]
  59. Schoeman, M.; Dickinson, D.J. Growth of Aureobasidium pullulans on lignin breakdown products at weathered wood surfaces. Mycologist 1997, 11, 168–172. [Google Scholar] [CrossRef]
  60. Evans, P.D. Wood Products: Weathering. Encycl. Mater. Sci. Technol. 2001, 9716–9721. [Google Scholar] [CrossRef]
  61. Charisi, S.; Thiis, T.K.; Stefansson, P.; Burud, I. Prediction model of microclimatic surface conditions on building façades. Build. Environ. 2018, 128, 46–54. [Google Scholar] [CrossRef]
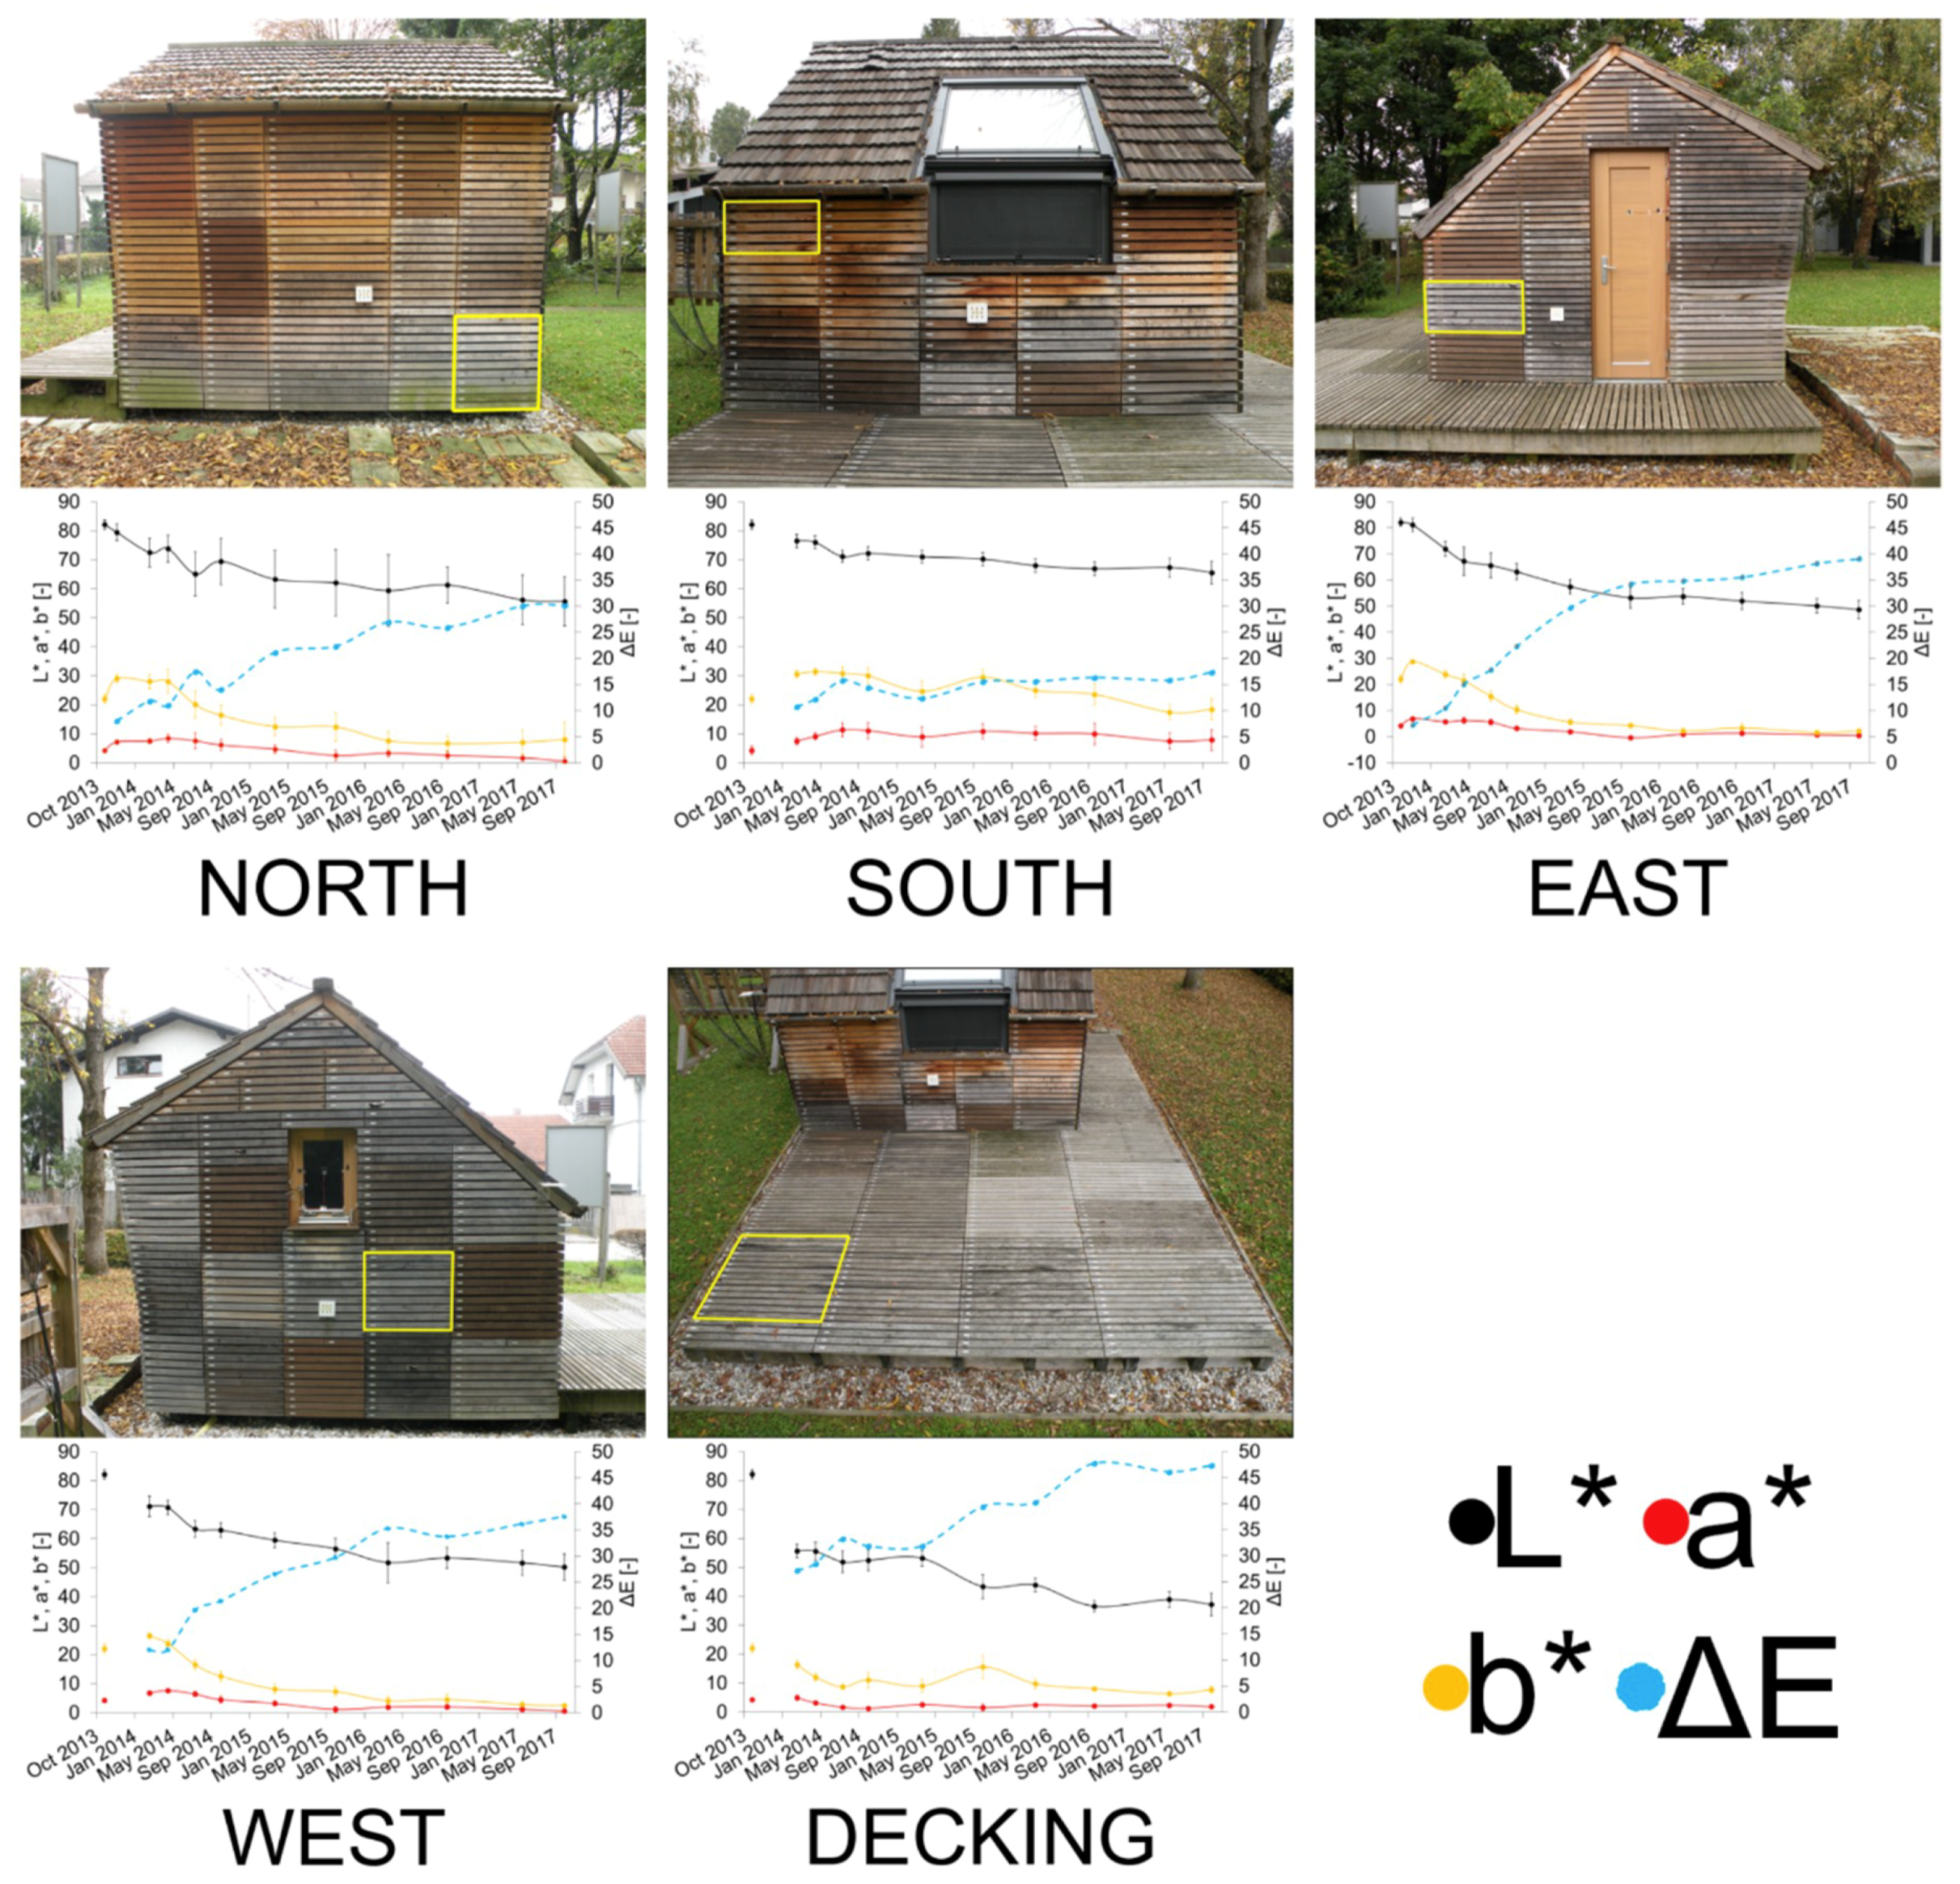
Figure 1. Exposure sites on the wooden model house unit in October 2017, after four years of weathering. In yellow frames, the samples of Norway spruce (PA) are shown and under the pictures, graphs showing the measured values of L*, a*, and b* plotted against exposure time and calculated ΔE are presented.
Forests 09 00488 g001
Figure 2. North façade of the model house. Colour representations are averaged colour measurements. Presented values are ΔE.
Forests 09 00488 g002
Figure 3. South façade of the model house. Colour representations are averaged colour measurements. Presented values are ΔE.
Forests 09 00488 g003
Figure 4. East façade of the model house. Colour representations are averaged colour measurements. Presented values are ΔE.
Forests 09 00488 g004
Figure 5. West façade of the model house. Colour representations are averaged colour measurements. Presented values are ΔE.
Forests 09 00488 g005
Figure 6. Decking of the model house. Colour representations are averaged colour measurements. Presented values are ΔE.
Forests 09 00488 g006
Figure 7. Twelve materials’ colour values (L*, a*, and b*) for outdoor exposure for all exposure directions.
Forests 09 00488 g007
Figure 8. Scanned samples of surface blue staining and the artificial weathering test. Presented values are visual grades with standard deviation.
Forests 09 00488 g008
Figure 9. Colour changes of twelve materials under two types of tests; exposure to blue stain fungi according to EN 152 and artificial weathering. Colour representations are averaged colour measurements. Presented values are ΔE with standard deviation.
Forests 09 00488 g009
Table 1. Twelve different investigated wood species and wood-based products.
Wood SpeciesTreatment
Norway Spruce (Picea abies)European Larch (Larix decidua)European Beech (Fagus sylvatica)English Oak (Quercus robur)Thermal ModificationImpregnation with Suspension of NATURAL WaxCopper-Ethanolamine ImpregnationWater Borne Acrylic Surface Coating
AbbreviationPALDFSQTMNWCEAC
PA×
PA-NW× ×
PA-AC× ×
PA-CE× ×
PA-CE-NW× ××
PA-TM× ×
PA-TM-NW× ××
PA-TM-CE× × ×
LD ×
LD-TM × ×
FS ×
Q ×
Table 2. Visual evaluation of surface mould growth on the façade and decking of the model house in Ljubljana with the standard deviations.
MaterialExposure Direction1st Evaluation2nd Evaluation3rd Evaluation4th Evaluation5th Evaluation6th Evaluation
29 November 20137 January 201418 March 20145 June 20147 October 20143 July 2015
PAnorth0.18 ± 0.601.09 ± 1.222.73 ± 1.103.18 ± 0.983.14 ± 1.463.00 ± 0.89
south0.00 ± 0.000.00 ± 0.000.00 ± 0.000.20 ± 0.450.20 ± 0.450.20 ± 0.45
east0.00 ± 0.001.57 ± 0.791.86 ± 1.072.14 ± 1.072.29 ± 0.95-
west0.00 ± 0.001.67 ± 0.712.44 ± 0.732.67 ± 0.713.50 ± 0.582.25 ± 0.46
decking1.79 ± 1.312.50 ± 1.16----
PA-NWnorth0.36 ± 0.810.73 ± 0.791.00 ± 1.101.36 ± 1.431.73 ± 1.352.73 ± 1.01
south0.80 ± 1.102.00 ± 0.713.20 ± 0.453.60 ± 0.553.40 ± 0.553.40 ± 0.55
east0.00 ± 0.001.75 ± 0.462.00 ± 0.002.00 ± 0.002.00 ± 0.001.75 ± 0.46
west0.73 ± 0.791.91 ± 0.833.36 ± 0.503.64 ± 0.502.33 ± 2.08-
decking1.36 ± 1.602.14 ± 1.03----
PA-ACnorth0.00 ± 0.000.00 ± 0.000.00 ± 0.000.00 ± 0.000.00 ± 0.00-
south0.00 ± 0.000.40 ± 0.890.40 ± 0.890.40 ± 0.890.00 ± 0.00-
east0.00 ± 0.000.71 ± 0.490.71 ± 0.490.29 ± 0.490.14 ± 0.38-
west0.00 ± 0.000.73 ± 1.101.27 ± 1.621.27 ± 1.621.27 ± 1.621.00 ± 1.18
decking0.00 ± 0.000.43 ± 0.650.36 ± 0.500.50 ± 0.650.00 ± 0.000.00 ± 0.00
PA-CEnorth0.00 ± 0.000.00 ± 0.000.00 ± 0.000.00 ± 0.000.00 ± 0.000.83 ± 0.98
south0.00 ± 0.000.00 ± 0.000.00 ± 0.000.00 ± 0.000.00 ± 0.000.00 ± 0.00
east0.00 ± 0.000.00 ± 0.000.00 ± 0.000.00 ± 0.000.00 ± 0.000.00 ± 0.00
west0.00 ± 0.000.00 ± 0.000.00 ± 0.000.00 ± 0.000.00 ± 0.000.78 ± 0.83
decking0.00 ± 0.000.00 ± 0.00----
PA-CE-NWnorth0.00 ± 0.000.00 ± 0.000.00 ± 0.000.00 ± 0.000.00 ± 0.000.00 ± 0.00
south0.00 ± 0.000.00 ± 0.000.20 ± 0.450.20 ± 0.451.00 ± 1.003.00 ± 0.00
east0.00 ± 0.000.00 ± 0.000.56 ± 0.880.56 ± 0.880.00 ± 0.000.00 ± 0.00
west0.00 ± 0.000.08 ± 0.280.23 ± 0.600.00 ± 0.000.00 ± 0.002.31 ± 0.48
decking0.00 ± 0.000.00 ± 0.00----
PA-TMnorth0.00 ± 0.000.00 ± 0.000.00 ± 0.001.67 ± 0.822.80 ± 0.453.00 ± 0.00
south0.00 ± 0.000.40 ± 0.551.60 ± 1.141.80 ± 0.842.00 ± 0.712.00 ± 0.71
east0.00 ± 0.000.00 ± 0.000.00 ± 0.000.83 ± 0.391.50 ± 0.522.18 ± 0.40
west0.00 ± 0.000.36 ± 0.670.64 ± 0.810.91 ± 0.941.40 ± 0.842.67 ± 0.50
decking0.00 ± 0.000.00 ± 0.000.00 ± 0.000.00 ± 0.00--
PA-TM-NWnorth0.00 ± 0.000.83 ± 0.751.50 ± 0.841.50 ± 0.841.50 ± 0.840.50 ± 0.84
south0.00 ± 0.000.40 ± 0.550.80 ± 0.451.00 ± 0.00--
east0.00 ± 0.000.00 ± 0.000.83 ± 0.411.00 ± 0.001.17 ± 0.410.33 ± 0.52
west0.00 ± 0.001.00 ± 0.001.00 ± 0.001.30 ± 0.48--
decking0.14 ± 0.530.14 ± 0.53----
PA-TM-CEnorth0.00 ± 0.000.00 ± 0.000.00 ± 0.000.00 ± 0.000.00 ± 0.000.00 ± 0.00
south0.00 ± 0.000.00 ± 0.000.00 ± 0.000.00 ± 0.000.00 ± 0.000.00 ± 0.00
east0.00 ± 0.000.00 ± 0.000.00 ± 0.000.00 ± 0.000.00 ± 0.000.00 ± 0.00
west0.00 ± 0.000.00 ± 0.000.00 ± 0.000.00 ± 0.000.00 ± 0.000.40 ± 0.84
decking0.00 ± 0.000.00 ± 0.000.00 ± 0.000.00 ± 0.000.00 ± 0.00-
LDnorth0.00 ± 0.000.36 ± 0.921.00 ± 1.102.82 ± 0.403.27 ± 0.653.67 ± 0.82
south0.00 ± 0.001.00 ± 0.711.00 ± 0.710.80 ± 0.84--
east0.00 ± 0.001.29 ± 0.492.00 ± 0.002.00 ± 0.002.86 ± 0.383.00 ± 0.58
west0.00 ± 0.000.33 ± 0.592.00 ± 0.692.56 ± 0.703.22 ± 0.814.00 ± 0.00
decking0.70 ± 0.821.00 ± 0.00----
LD-TMnorth0.00 ± 0.000.00 ± 0.000.00 ± 0.000.00 ± 0.000.00 ± 0.001.27 ± 0.79
south0.00 ± 0.000.00 ± 0.000.00 ± 0.000.00 ± 0.000.00 ± 0.000.00 ± 0.00
east0.00 ± 0.000.14 ± 0.380.57 ± 0.530.71 ± 0.760.86 ± 0.692.00 ± 1.00
west0.00 ± 0.000.00 ± 0.000.45 ± 0.520.90 ± 0.320.80 ± 0.452.17 ± 0.41
decking0.00 ± 0.000.00 ± 0.00----
FSnorth0.00 ± 0.000.00 ± 0.000.00 ± 0.000.09 ± 0.300.45 ± 0.521.80 ± 0.92
south0.80 ± 1.102.20 ± 0.453.20 ± 0.453.20 ± 0.45--
east0.00 ± 0.002.57 ± 0.792.86 ± 0.383.71 ± 0.493.71 ± 0.493.00 ± 0.00
west0.00 ± 0.002.64 ± 0.503.64 ± 0.504.00 ± 0.004.00 ± 0.004.00 ± 0.00
decking1.00 ± 0.001.29 ± 0.47----
Qnorth0.00 ± 0.000.00 ± 0.000.20 ± 0.450.80 ± 0.451.00 ± 0.713.40 ± 0.55
south0.00 ± 0.001.00 ± 0.002.00 ± 0.002.40 ± 0.552.33 ± 0.58-
east0.00 ± 0.000.00 ± 0.003.00 ± 0.823.14 ± 0.900.00 ± 0.00-
decking0.00 ± 0.003.38 ± 0.81----
Table 3. Pearson correlation for colour change (ΔE) between the in-service test and artificial weathering test for five different exposures. Asterisks represent the significance of Pearson correlation (**** p < 0.0001, *** p < 0.001, ** p < 0.01, * p < 0.05).
December 2013March 2014May 2014August 2014October 2014April 2015October 2015October 2016October 2016May 2017October 2017
North1st EN1520.25320.37950.30510.5954 *0.41080.25750.36220.51250.45330.5986 *0.6380 *
100 h of AW0.08380.13500.10400.27420.27100.34200.41730.52280.42780.48290.4105
200 h of AW0.47150.52560.48370.20420.32760.42100.27510.20820.28130.25660.1982
300 h of AW0.50050.51240.50610.05070.25030.16690.0308−0.03570.02410.0288−0.0299
400 h of AW0.44990.44020.4747−0.03030.19480.0340−0.0809−0.1663−0.1129−0.1085−0.1532
500 h of AW0.43770.41930.4641−0.06970.1709−0.0456−0.1422−0.2292−0.1820−0.1724−0.2220
2nd EN1520.14680.26830.21060.6746 *0.44680.8077 **0.7820 **0.8716 ***0.8840 ***0.8622 ***0.7754 **
South1st EN152 −0.1013−0.10730.15100.04450.04390.07720.12560.12280.13060.2097
100 h of AW 0.27860.34900.52950.55550.46270.42250.38730.23170.15640.1929
200 h of AW 0.57350.5999 *−0.00730.0354−0.2184−0.2998−0.2910−0.3103−0.3887−0.4064
300 h of AW 0.6487 *0.5906 *−0.1047−0.0331−0.2384−0.3832−0.3564−0.4190−0.4867−0.5196
400 h of AW 0.6298 *0.5395−0.1745−0.0882−0.2370−0.4036−0.3652−0.4380−0.4883−0.5261
500 h of AW 0.6380 *0.5296−0.1764−0.0916−0.2198−0.4034−0.3659−0.4557−0.5006−0.5423
2nd EN152 0.00980.21040.53230.44620.35850.39090.38060.38580.34250.3813
East1st EN1520.20840.14460.24780.38500.48750.6086 *0.7382 **0.7495 **0.6927 *0.6772 *0.6768 *
100 h of AW−0.11150.15310.11290.16710.37530.47820.48600.45020.26830.29520.3039
200 h of AW0.35240.00360.20010.33830.41790.25320.14610.09630.07190.0009−0.0056
300 h of AW0.37840.05740.16310.29890.34000.1196−0.0361−0.0889−0.1648−0.2186−0.2331
400 h of AW0.32020.06470.11900.22420.25410.0146−0.1564−0.1986−0.3007−0.3362−0.3545
500 h of AW0.31050.09380.12190.22040.2247−0.0255−0.2096−0.2513−0.3697−0.3977−0.4172
2nd EN152−0.03280.04210.18450.31220.49600.6795 *0.7399 **0.7440 **0.7077 *0.6954 *0.7081 *
West1st EN152 0.0362−0.20750.59390.57670.6030 *0.6915 *0.7063 *0.6259 *0.6614 *0.6732 *
100 h of AW 0.05590.05950.39510.50870.57580.57870.50880.35880.40680.4027
200 h of AW 0.59740.7549 **0.29140.36150.27210.18870.07700.05420.00300.0179
300 h of AW 0.6130 *0.7152 *0.18060.27080.16920.0518−0.0928−0.1549−0.1975−0.2008
400 h of AW 0.57540.6723 *0.11060.21410.1030−0.0326−0.1841−0.2628−0.2999−0.3098
500 h of AW 0.55570.6147 *0.05560.16300.0576−0.0792−0.2359−0.3209−0.3525−0.3685
2nd EN152 0.13330.21830.47930.53780.6494 *0.7102 *0.7152 *0.7255*0.7227 *0.7533 **
Decking1st EN152 0.6605 *0.6882 *0.5994 *0.51020.48120.6223 *0.6000 *0.6865 *0.6686 *0.6978 *
100 h of AW 0.42340.45390.19970.13910.10520.21820.19430.30510.27160.3101
200 h of AW 0.21490.0812−0.2044−0.2799−0.3676−0.3100−0.3345−0.3031−0.3180−0.2944
300 h of AW 0.0447−0.0419−0.3443−0.3986−0.4915−0.4749−0.5086−0.4884−0.4987−0.4800
400 h of AW −0.0568−0.1314−0.3935−0.4171−0.5091−0.5248−0.5618−0.5569−0.5644−0.5525
500 h of AW −0.1110−0.1624−0.4270−0.4432−0.5274−0.5538−0.5950 *−0.5917 *−0.5986 *−0.5897 *
2nd EN152 0.7716 **0.6711 *0.51010.42510.40020.53740.51550.5883 *0.56320.5897 *
Table 4. Pearson correlation between the in-service test and artificial weathering test for five different exposures for each tested material regarding the colour change for the full test span. Asterisks represent the significance of Pearson correlation (**** p < 0.0001, *** p < 0.001, ** p < 0.01, * p < 0.05).
PANorthSouthEastWestDeckingAWPA-TM-NWNorthSouthEastWestDeckingAW
North1.0000 North1.0000
South0.7852 **1.0000 South0.54131.0000
East0.9474 ****0.7579 *1.0000 East0.6711 *0.9185 ***1.0000
West0.9621 ****0.8020 **0.9812 ****1.0000 West0.50530.27180.39181.0000
Decking0.9246 ***0.8600 **0.9035 ***0.9234 ***1.0000 Decking0.37240.47590.7005 *0.16091.0000
AW0.31430.27600.35230.34950.63081.0000AW0.62770.14500.69980.80330.64701.0000
PA-NWNorthSouthEastWestDeckingAWPA-TM-CENorthSouthEastWestDeckingAW
North1.0000 North1.0000
South0.8407 **1.0000 South−0.46731.0000
East0.8482 ***0.9844 ****1.0000 East0.2749−0.01881.0000
West0.8201 **0.9928 ****0.9798 ****1.0000 West−0.0889−0.24880.52961.0000
Decking0.56520.7771 **0.71210.8043 **1.0000 Decking0.4215-0.8985 ***0.35120.50731.0000
AW0.42040.8643 *0.7957 *0.9158 *0.68761.0000AW0.51390.25430.6927−0.29580.35481.0000
PA-ACNorthSouthEastWestDeckingAWLDNorthSouthEastWestDeckingAW
North1.0000 North1.0000
South0.7681 **1.0000 South0.8302 **1.0000
East0.7699 **0.9249 ***1.0000 East0.9782 ****0.8900 ***1.0000
West0.8656 **0.9435 ****0.9196 ***1.0000 West0.9465 ****0.7199 *0.9278 ***1.0000
Decking0.8193 **0.9583 ****0.8645 **0.9603 ****1.0000 Decking0.8970 ***0.8885 ***0.8945 ***0.8453 **1.0000
AW−0.14640.8160 *0.73290.68140.66531.0000AW0.59080.36990.57540.63340.11411.0000
PA-CENorthSouthEastWestDeckingAWLD-TMNorthSouthEastWestDeckingAW
North1.0000 North1.0000
South0.7422 *1.0000 South0.32211.0000
East0.58990.31931.0000 East−0.2922−0.32751.0000
West0.48700.17060.8410 **1.0000 West−0.1847−0.4317−0.58001.0000
Decking0.61920.58410.7878 **0.6476 *1.0000 Decking0.54290.5844−0.2029−0.21841.0000
AW0.36910.56950.7043−0.20400.12351.0000AW0.66650.07450.2824−0.61440.58731.0000
PA-CE-NWNorthSouthEastWestDeckingAWFSNorthSouthEastWestDeckingAW
North1.0000 North1.0000
South0.28181.0000 South0.60381.0000
East0.49460.30701.0000 East0.7403 **0.9003 ***1.0000
West0.44910.25110.7293*1.0000 West0.7271 *0.9673 ****0.9678 ****1.0000
Decking0.08950.58940.0820−0.34571.0000 Decking0.8100 **0.7687**0.7618*0.8357 **1.0000
AW0.2101−0.02410.6212−0.32880.67041.0000AW−0.2983−0.08570.2286−0.0450−0.47721.0000
PA-TMNorthSouthEastWestDeckingAWQNorthSouthEastWestDeckingAW
North1.0000 North1.0000
South−0.7545 *1.0000 South0.54161.0000
East0.1603−0.05711.0000 East0.04480.6575 *1.0000
West0.2688−0.11260.7073 *1.0000 West 1.0000
Decking0.3617−0.62230.57050.49521.0000 Decking0.7403 *0.52330.3485 1.0000
AW−0.25300.40510.7702*0.46950.70501.0000AW−0.3479−0.03950.4405 0.25661.0000