Provenance Variation in Pinus palustris Foliar δ13C


Abstract
1. Introduction
2. Materials and Methods
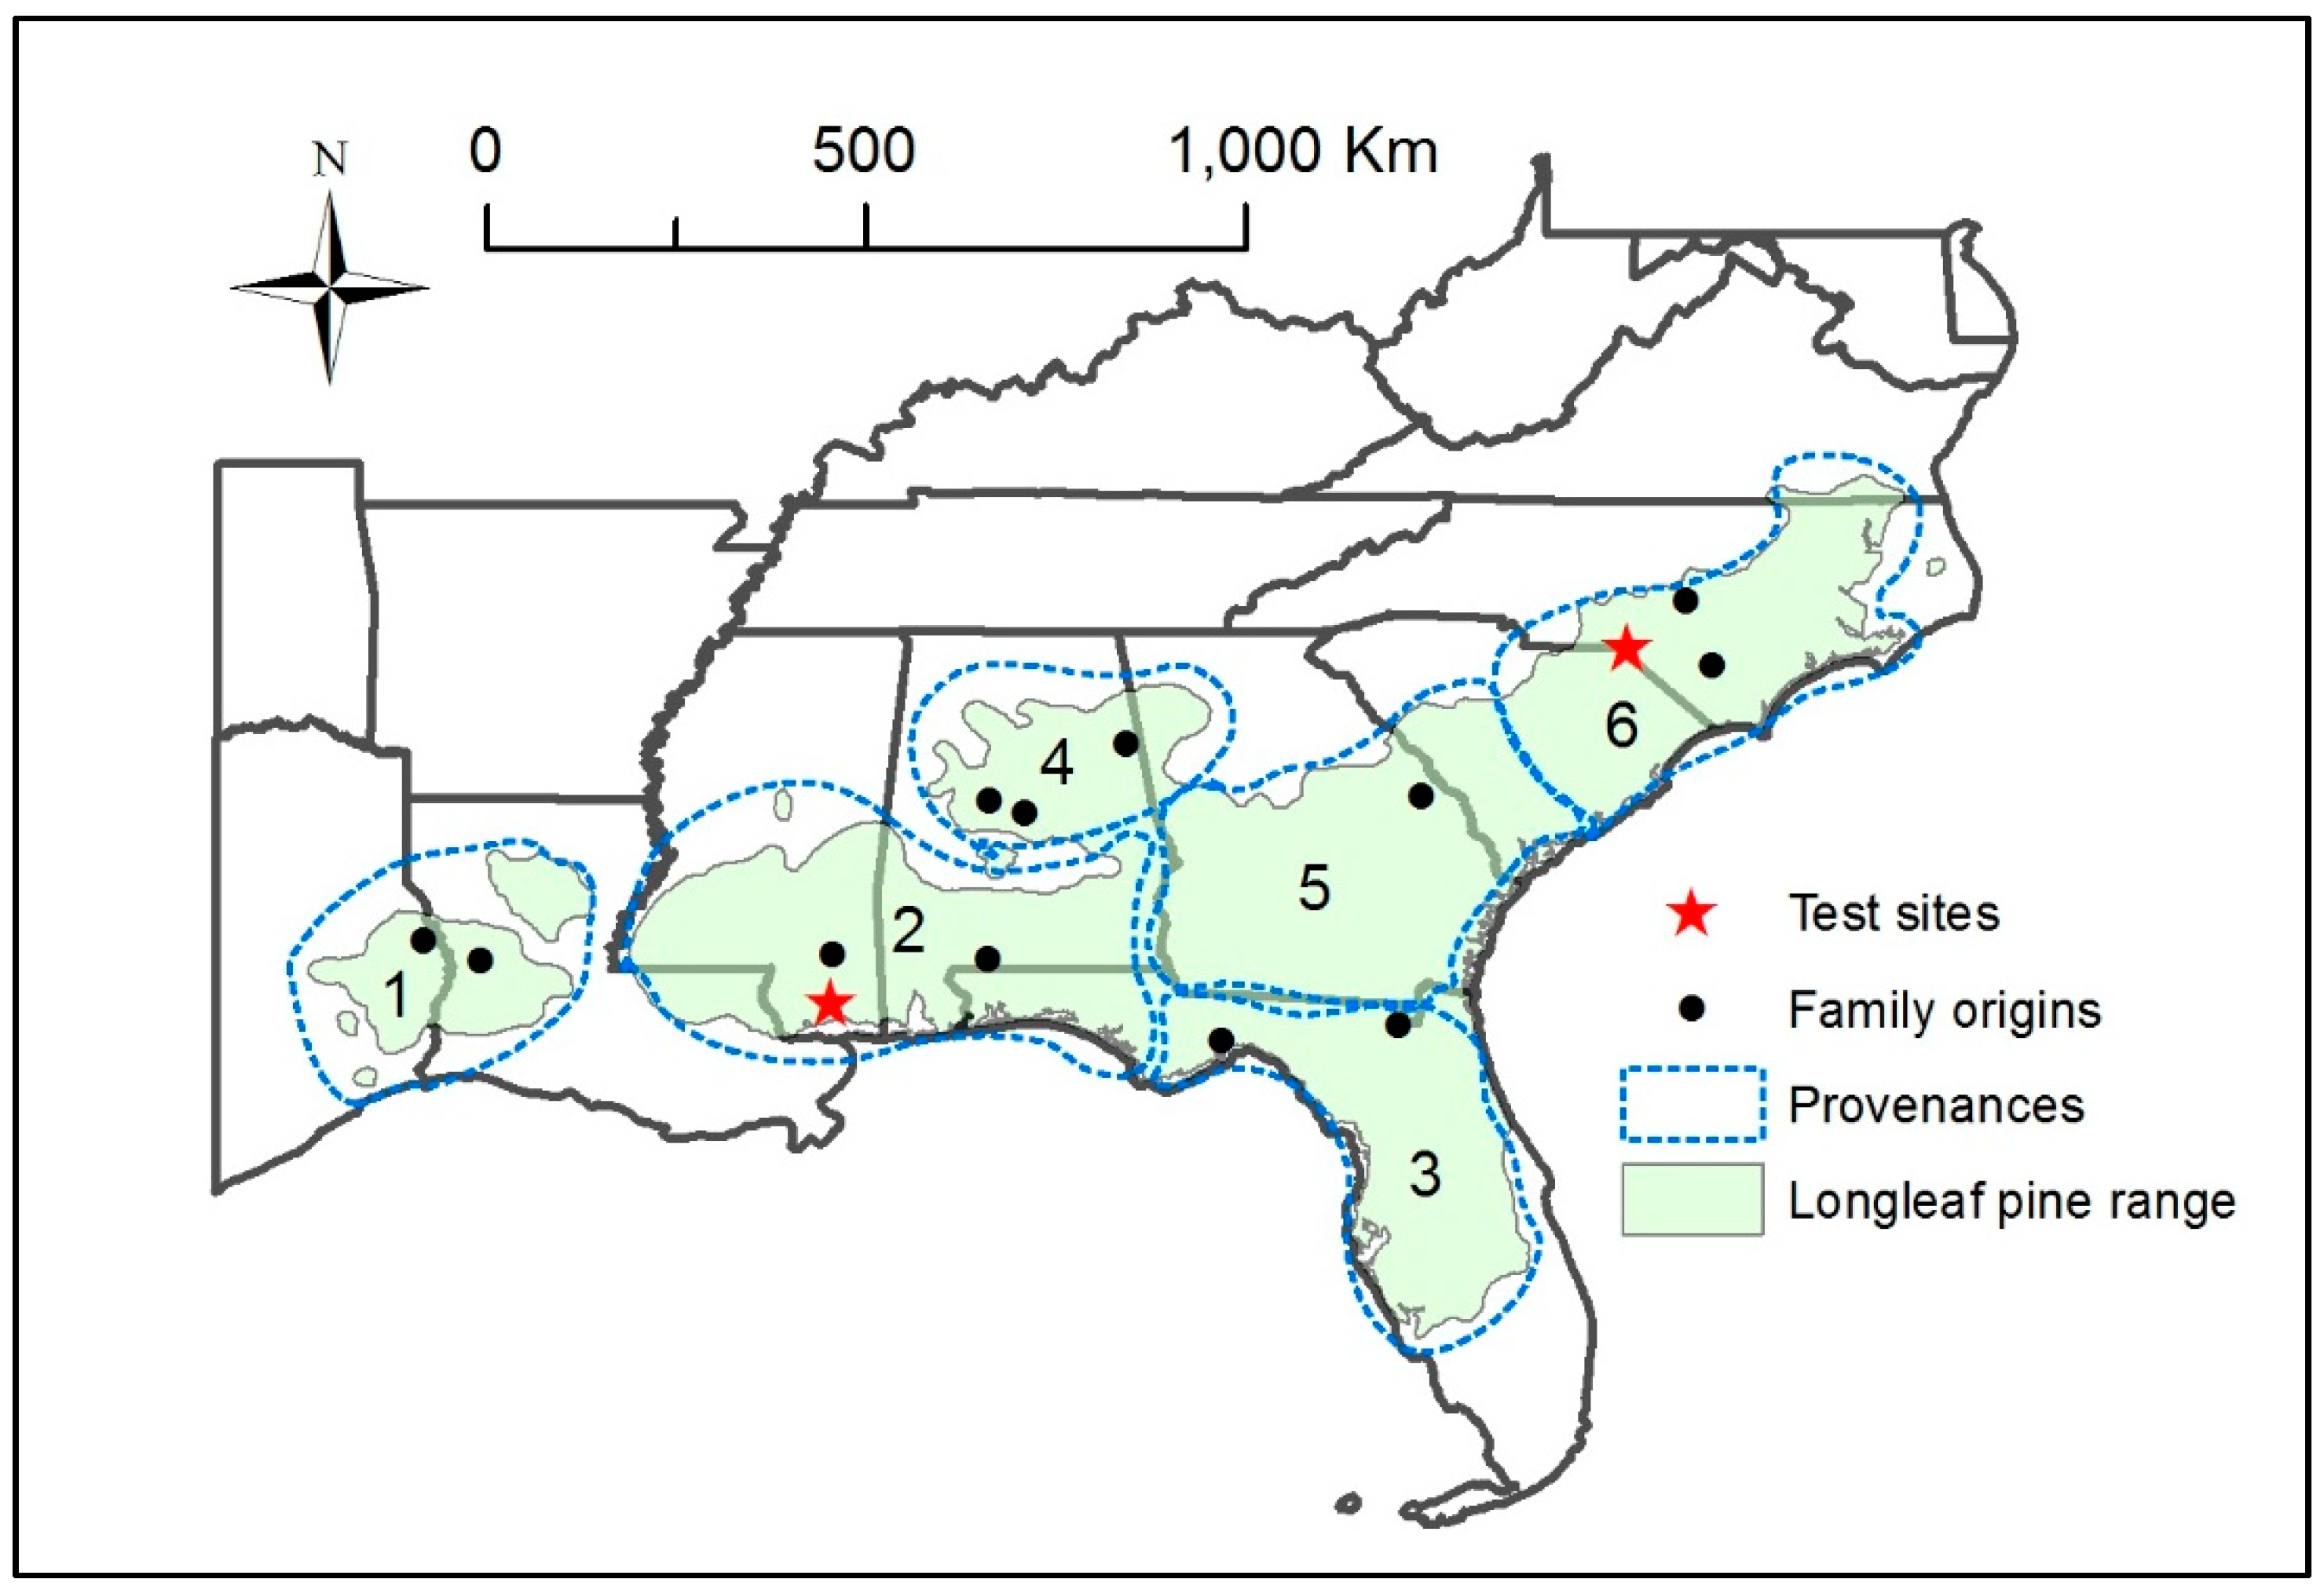
2.1. MS and NC Provenance Tests
2.2. Measurements
2.3. Data Analyses
3. Results
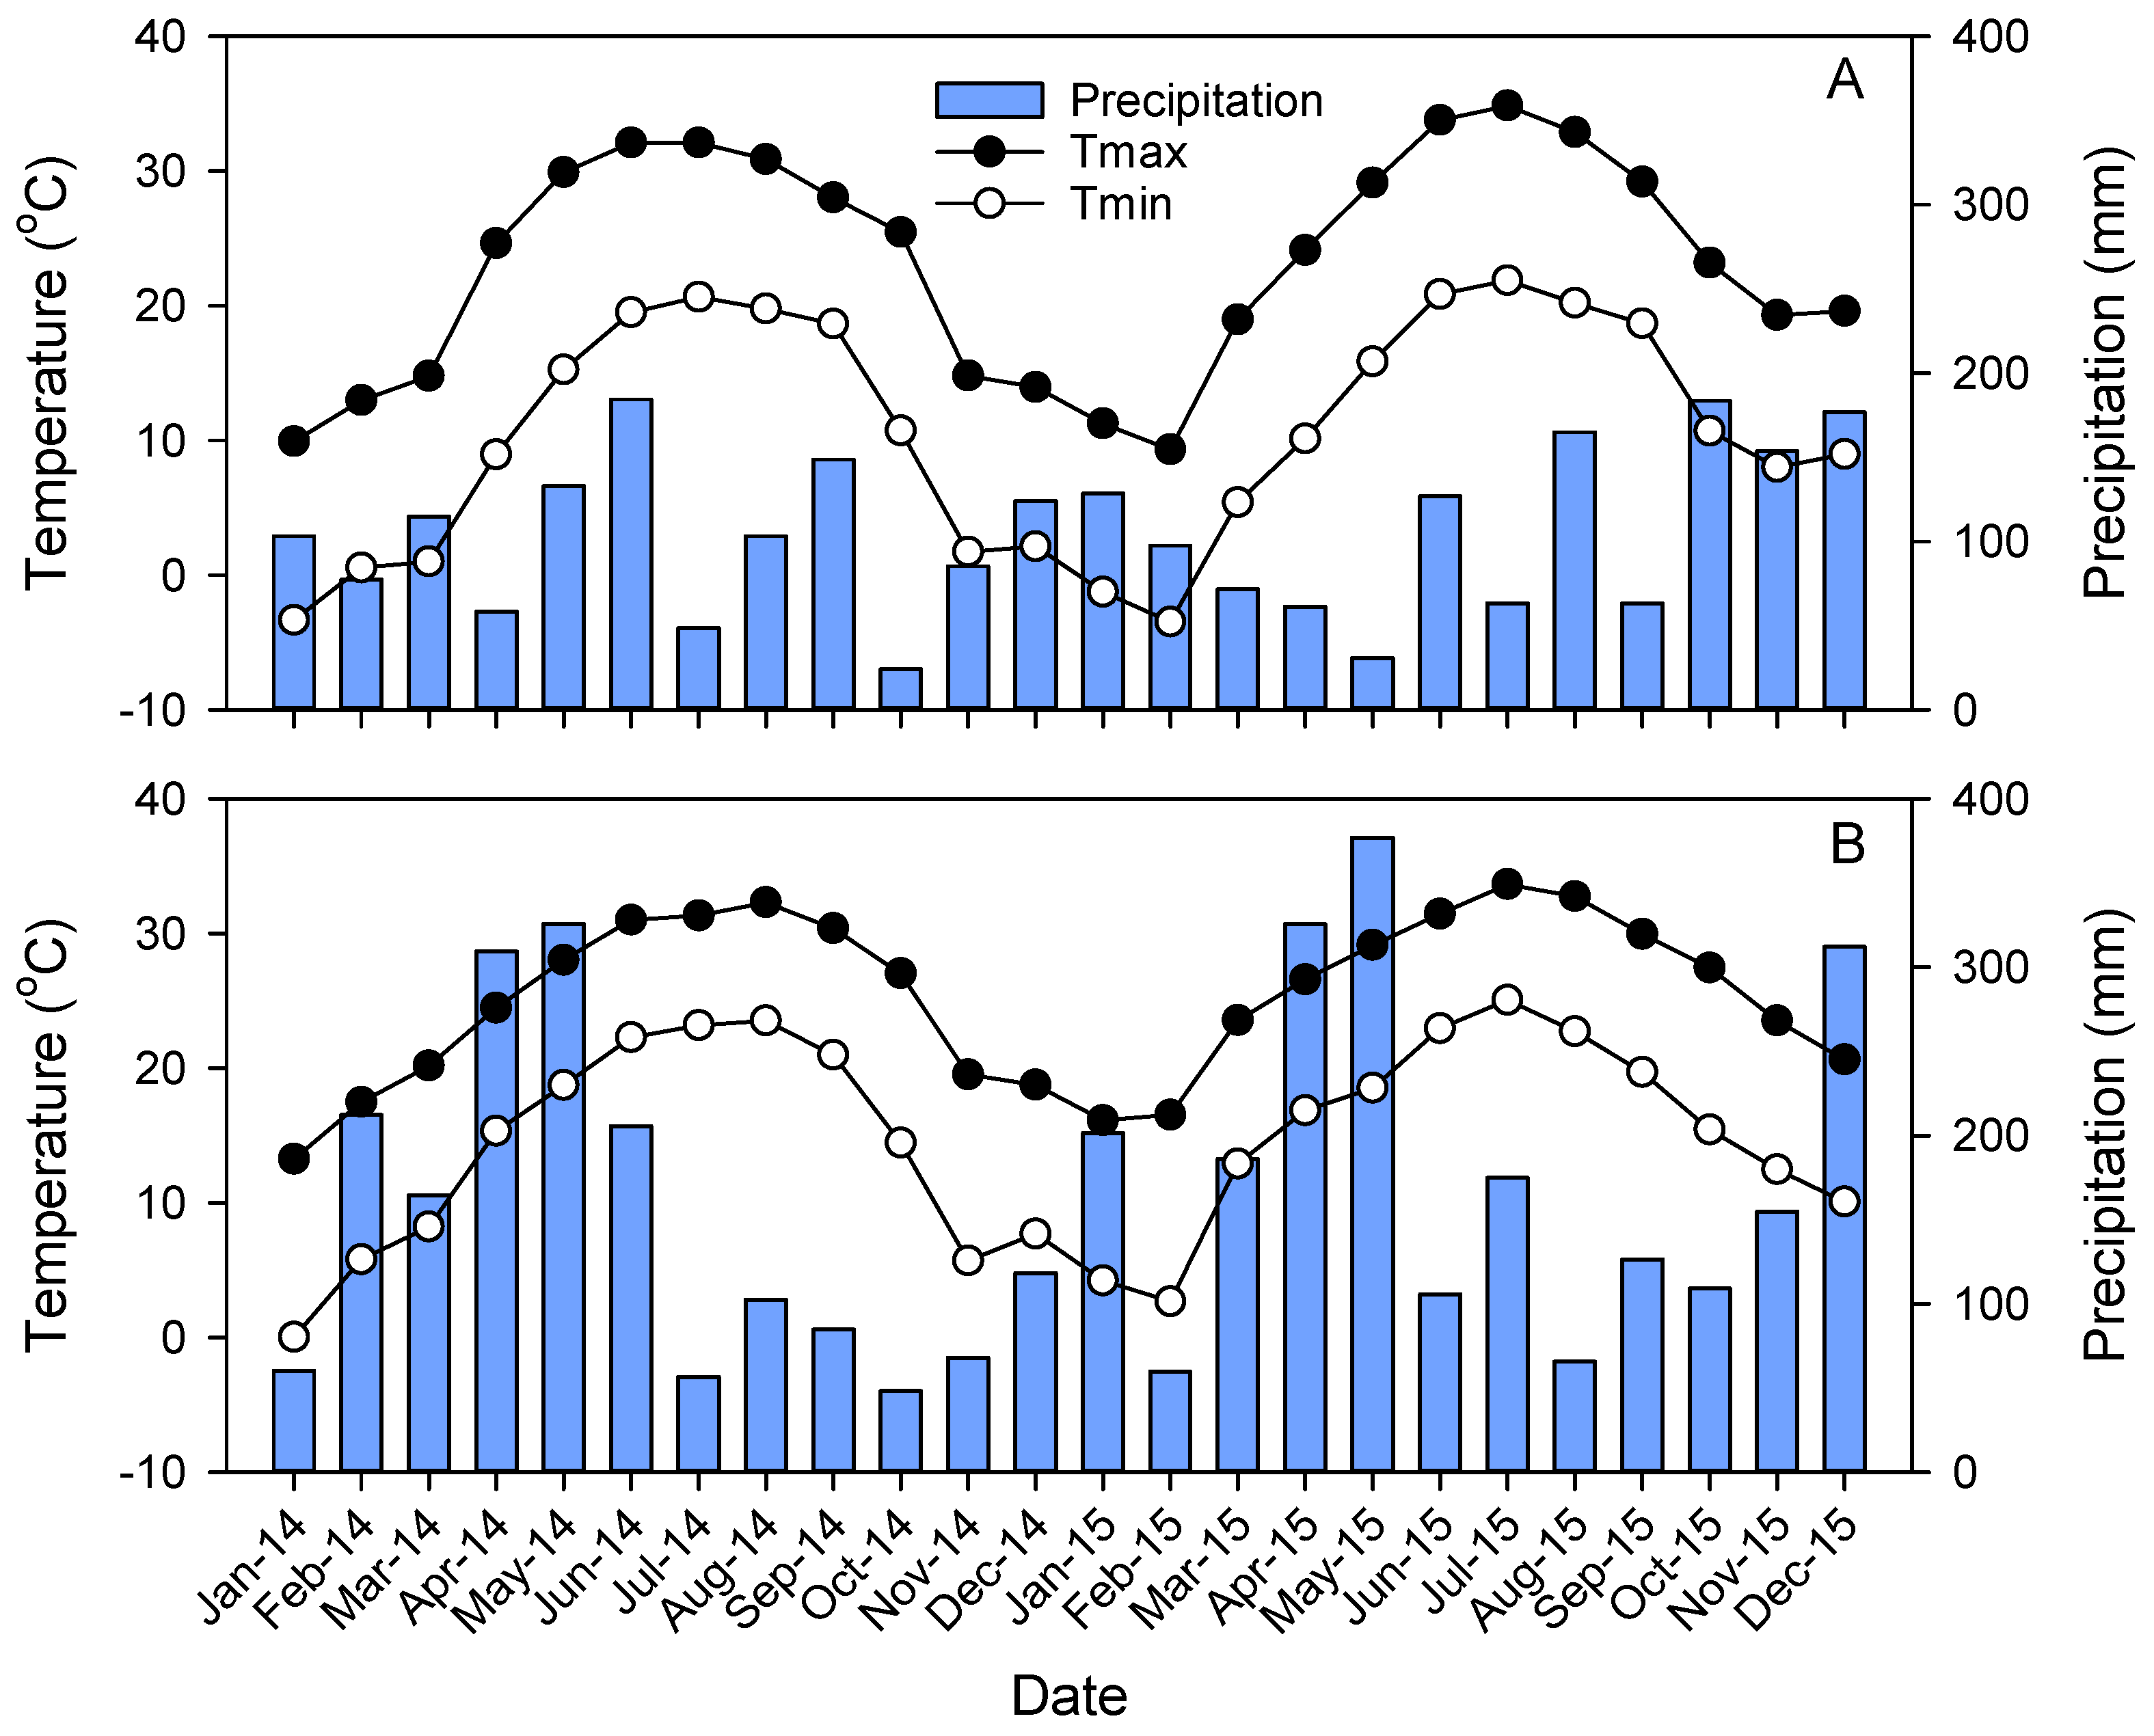
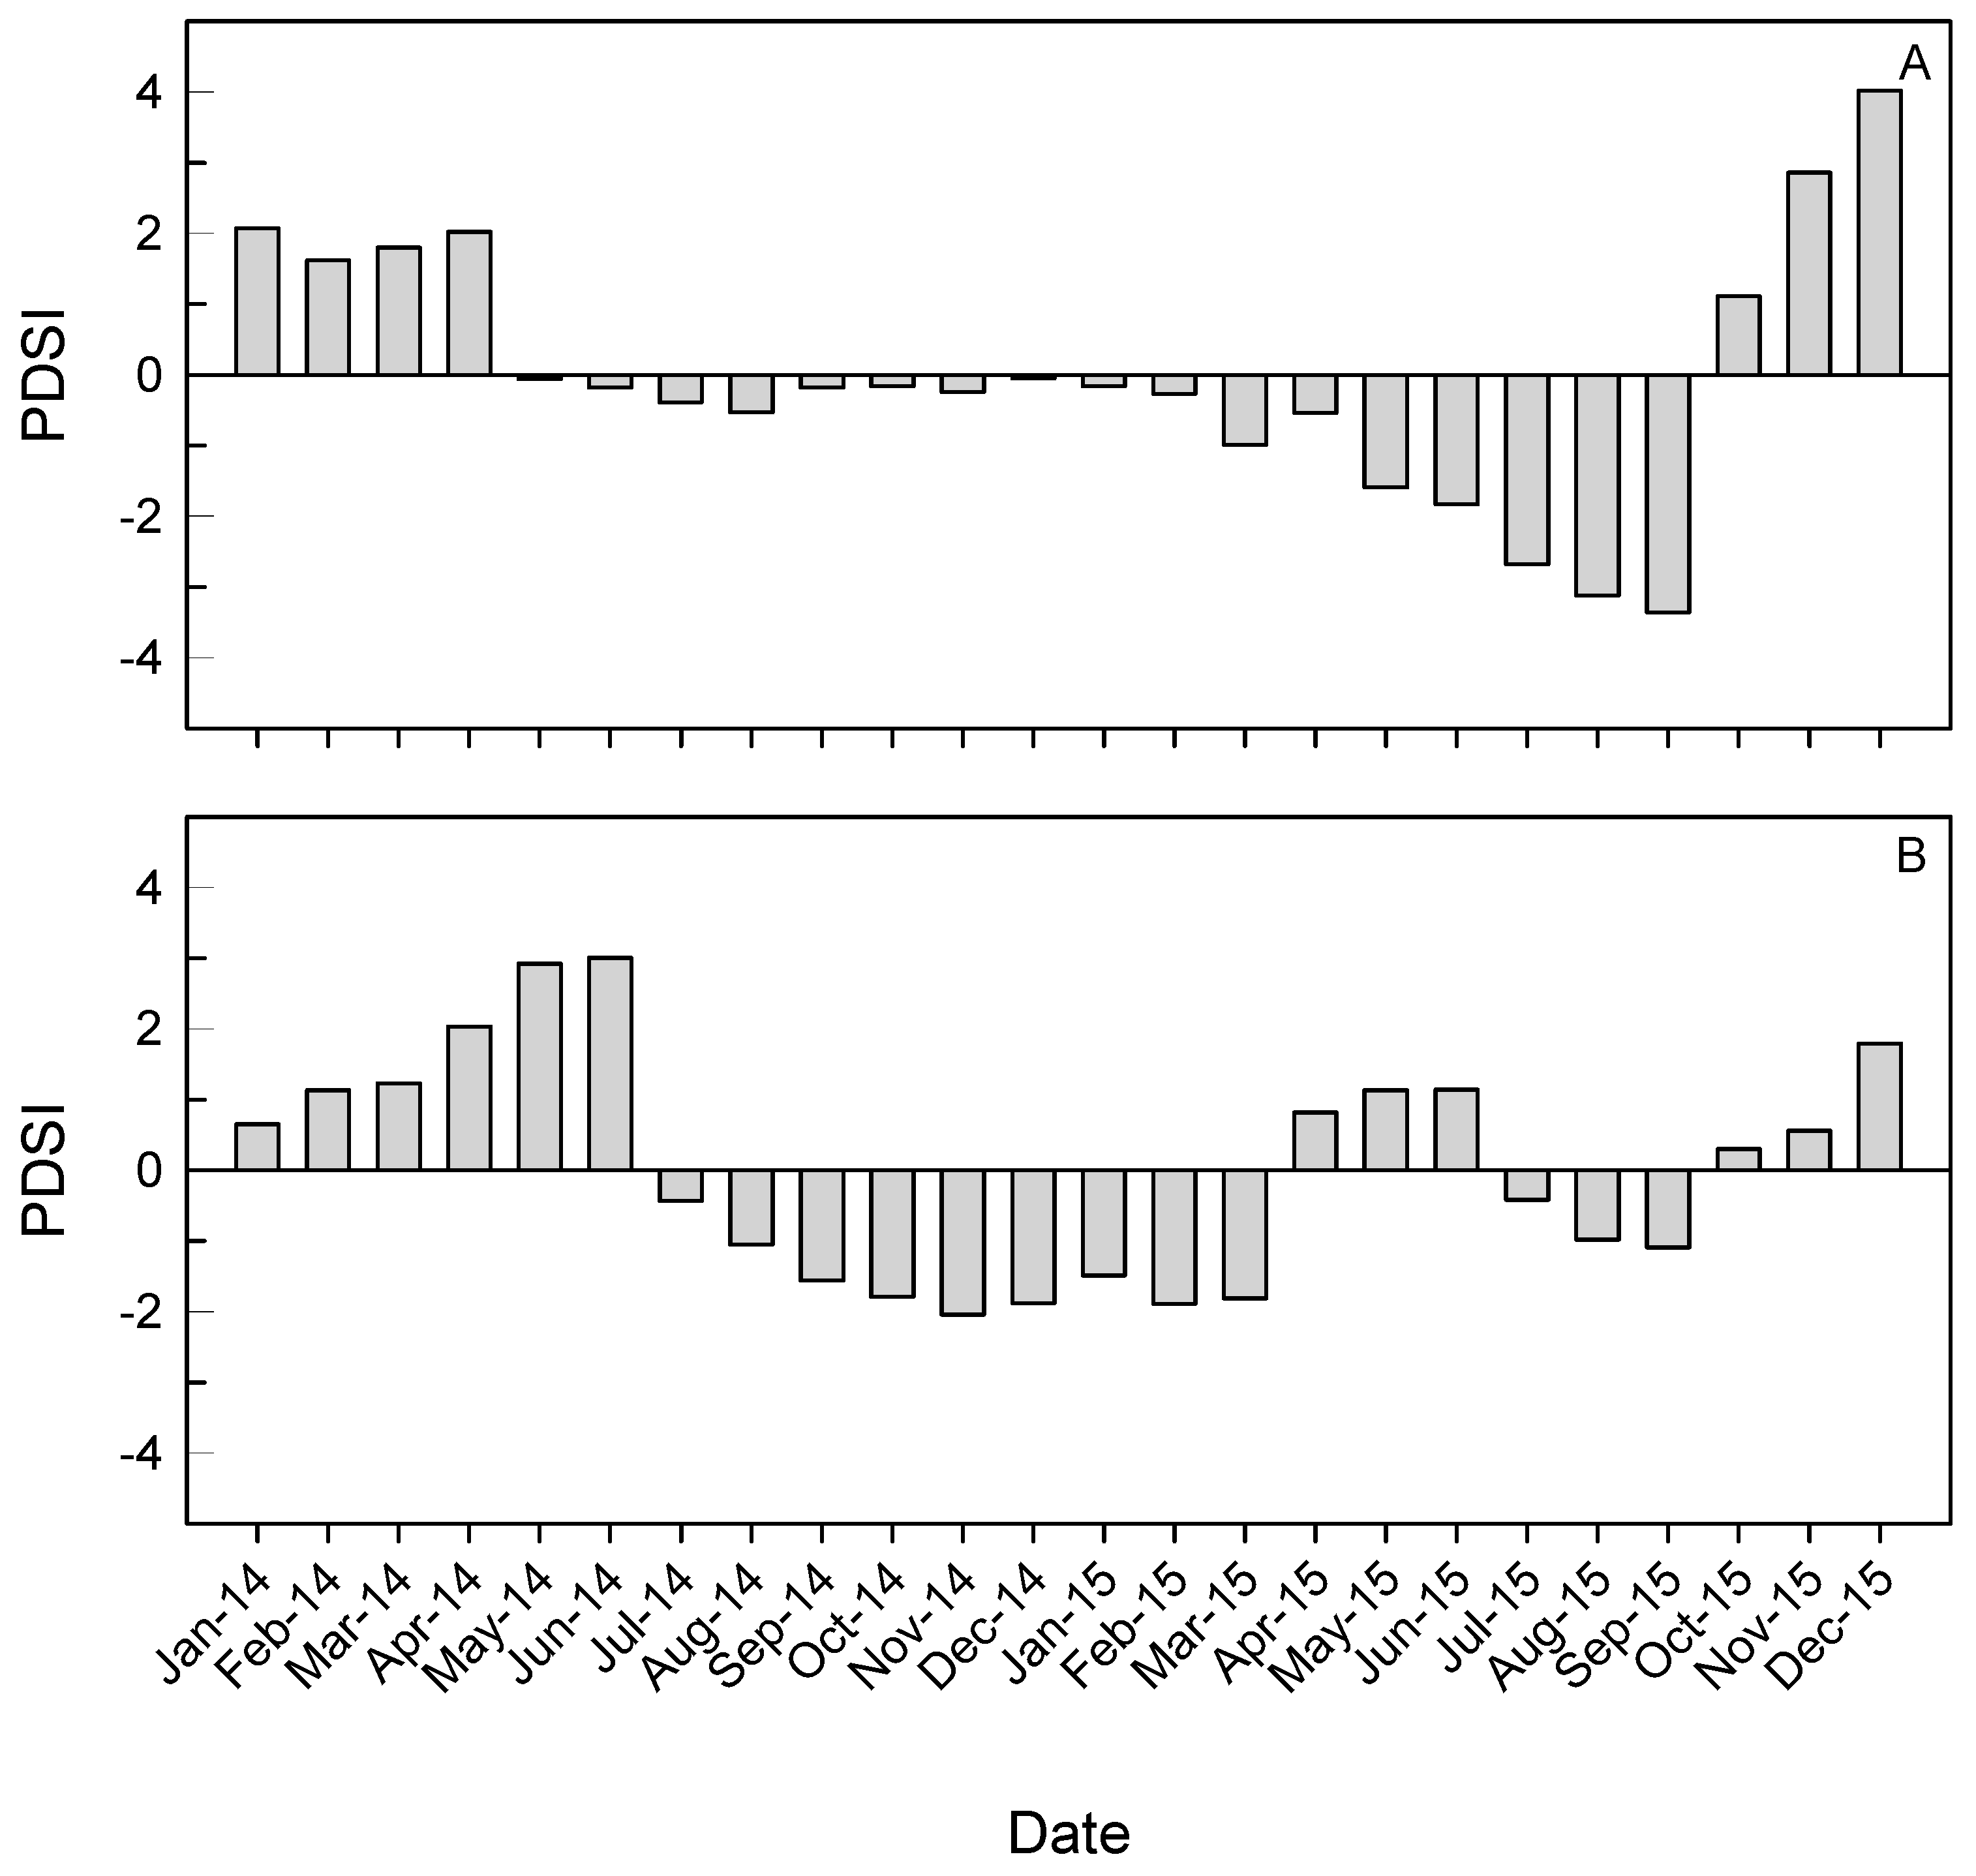
3.1. Climate
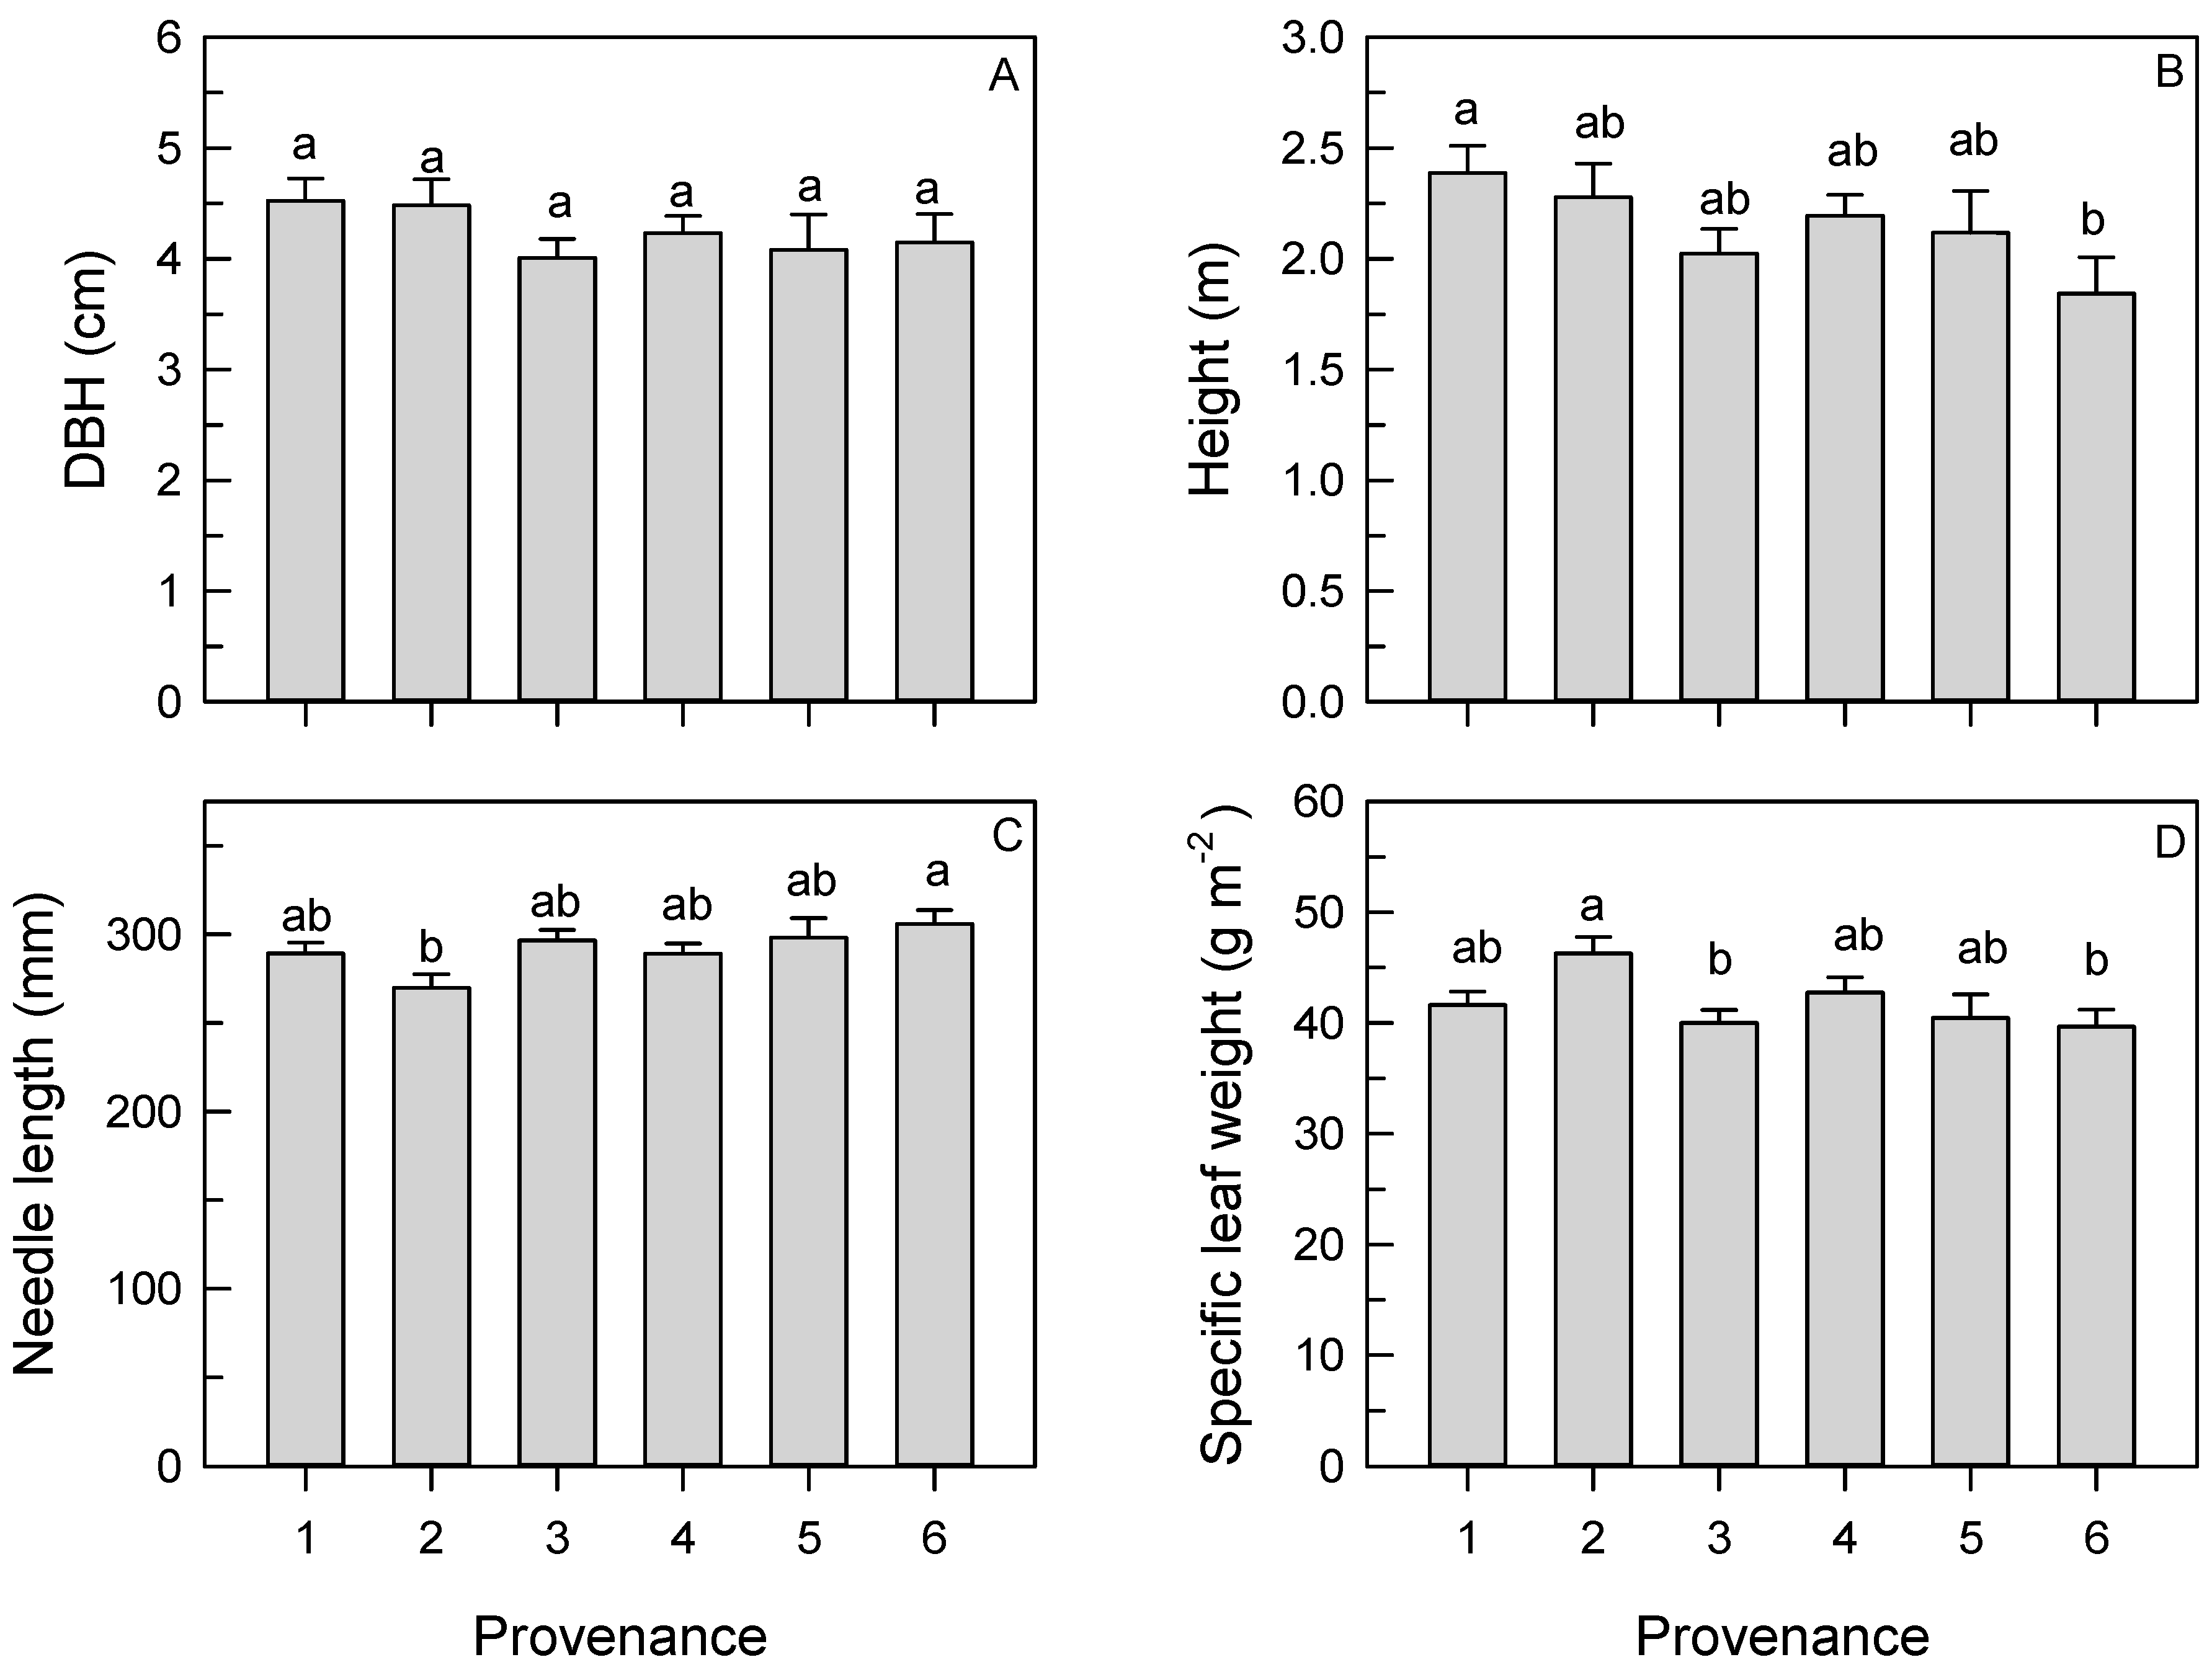
3.2. Tree Growth
3.3. Needle Length and Specific Leaf Weight
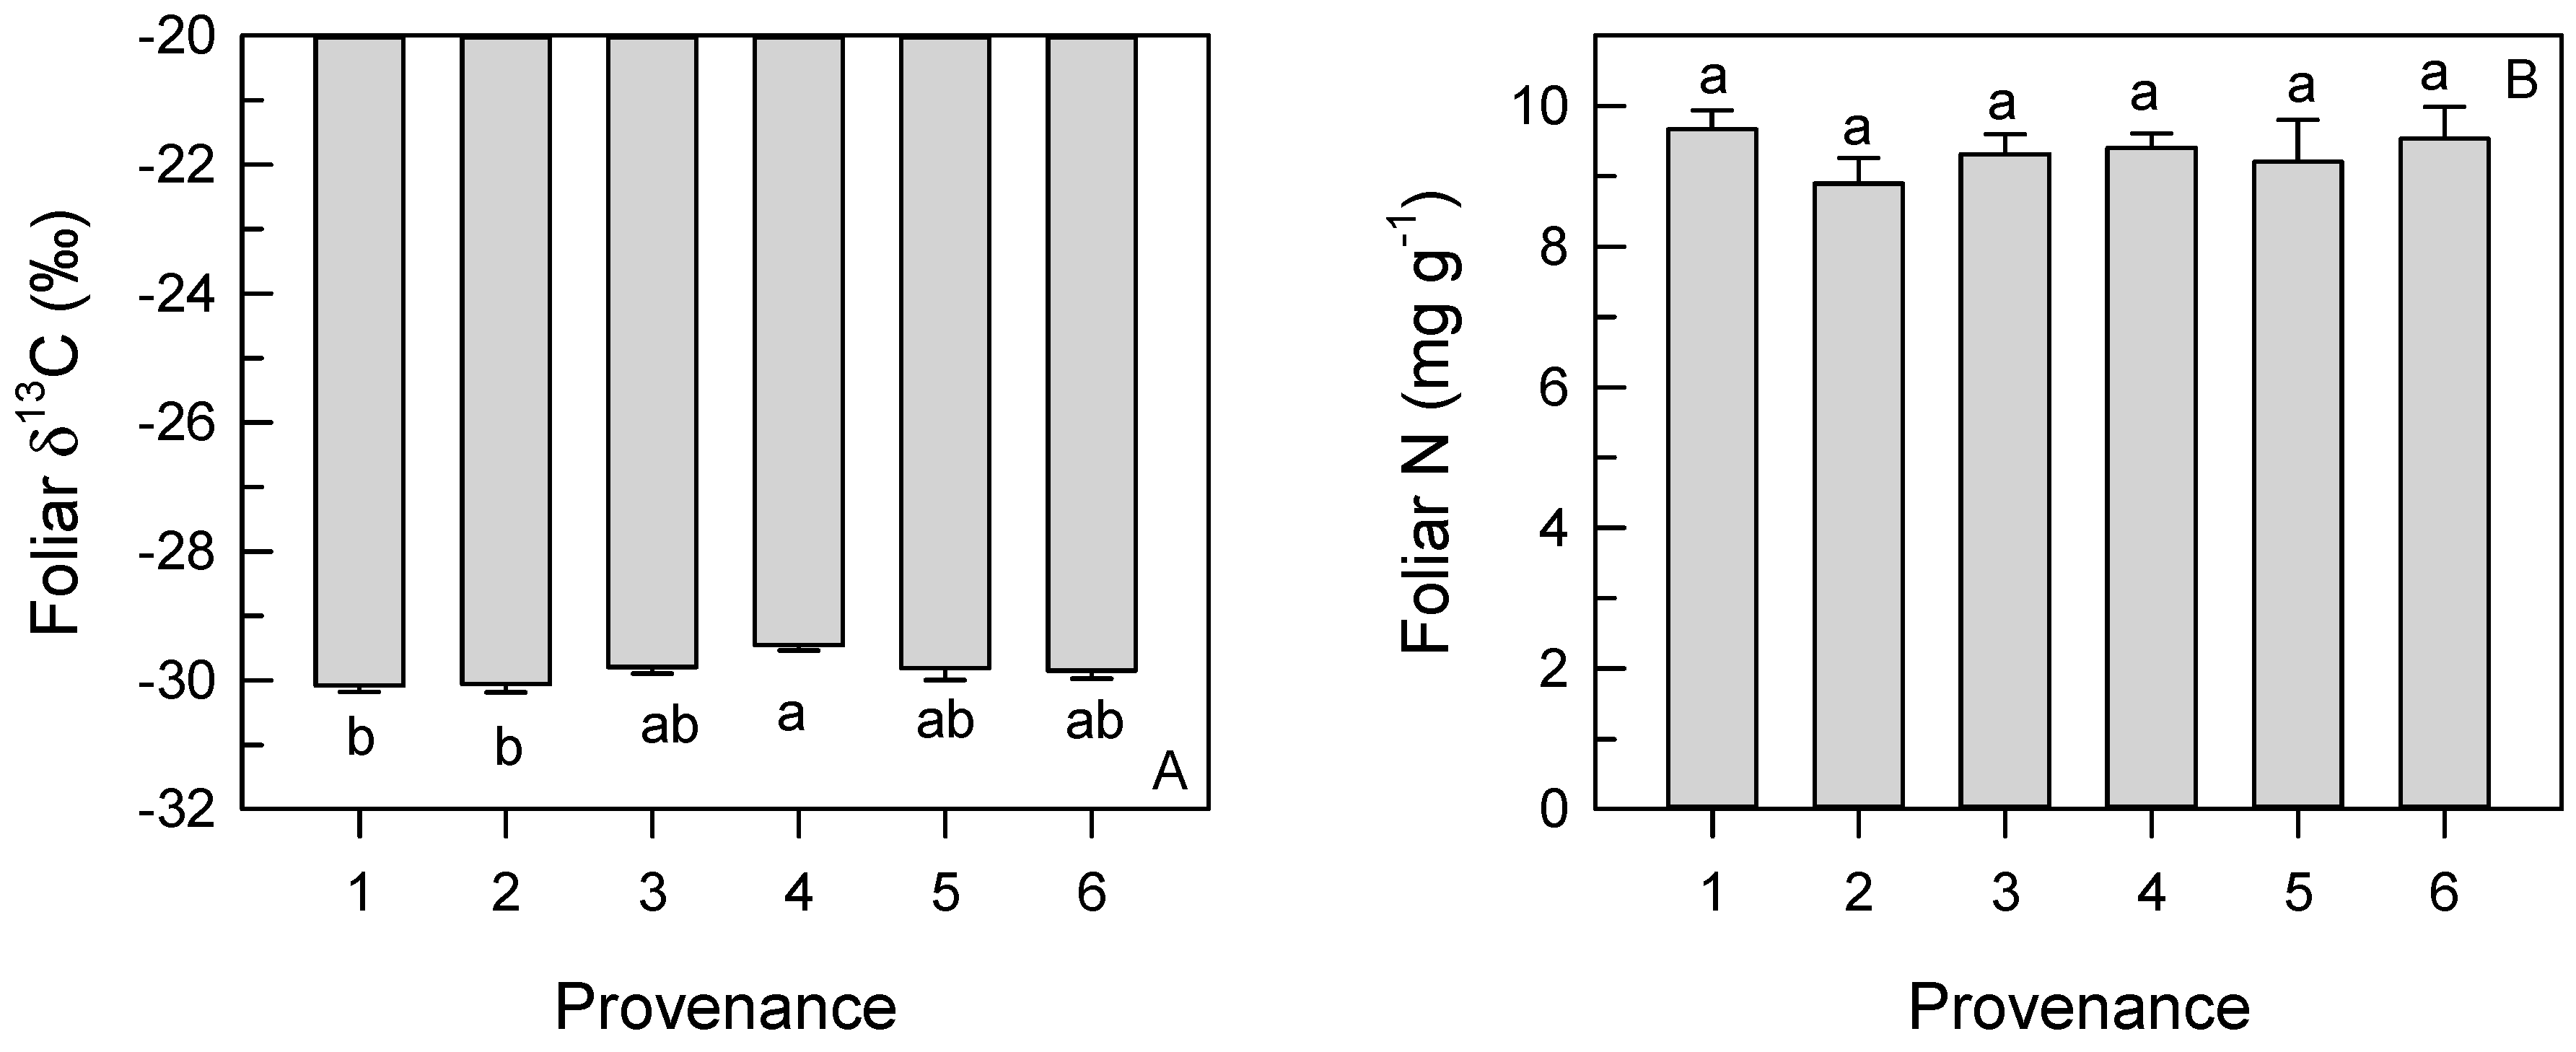
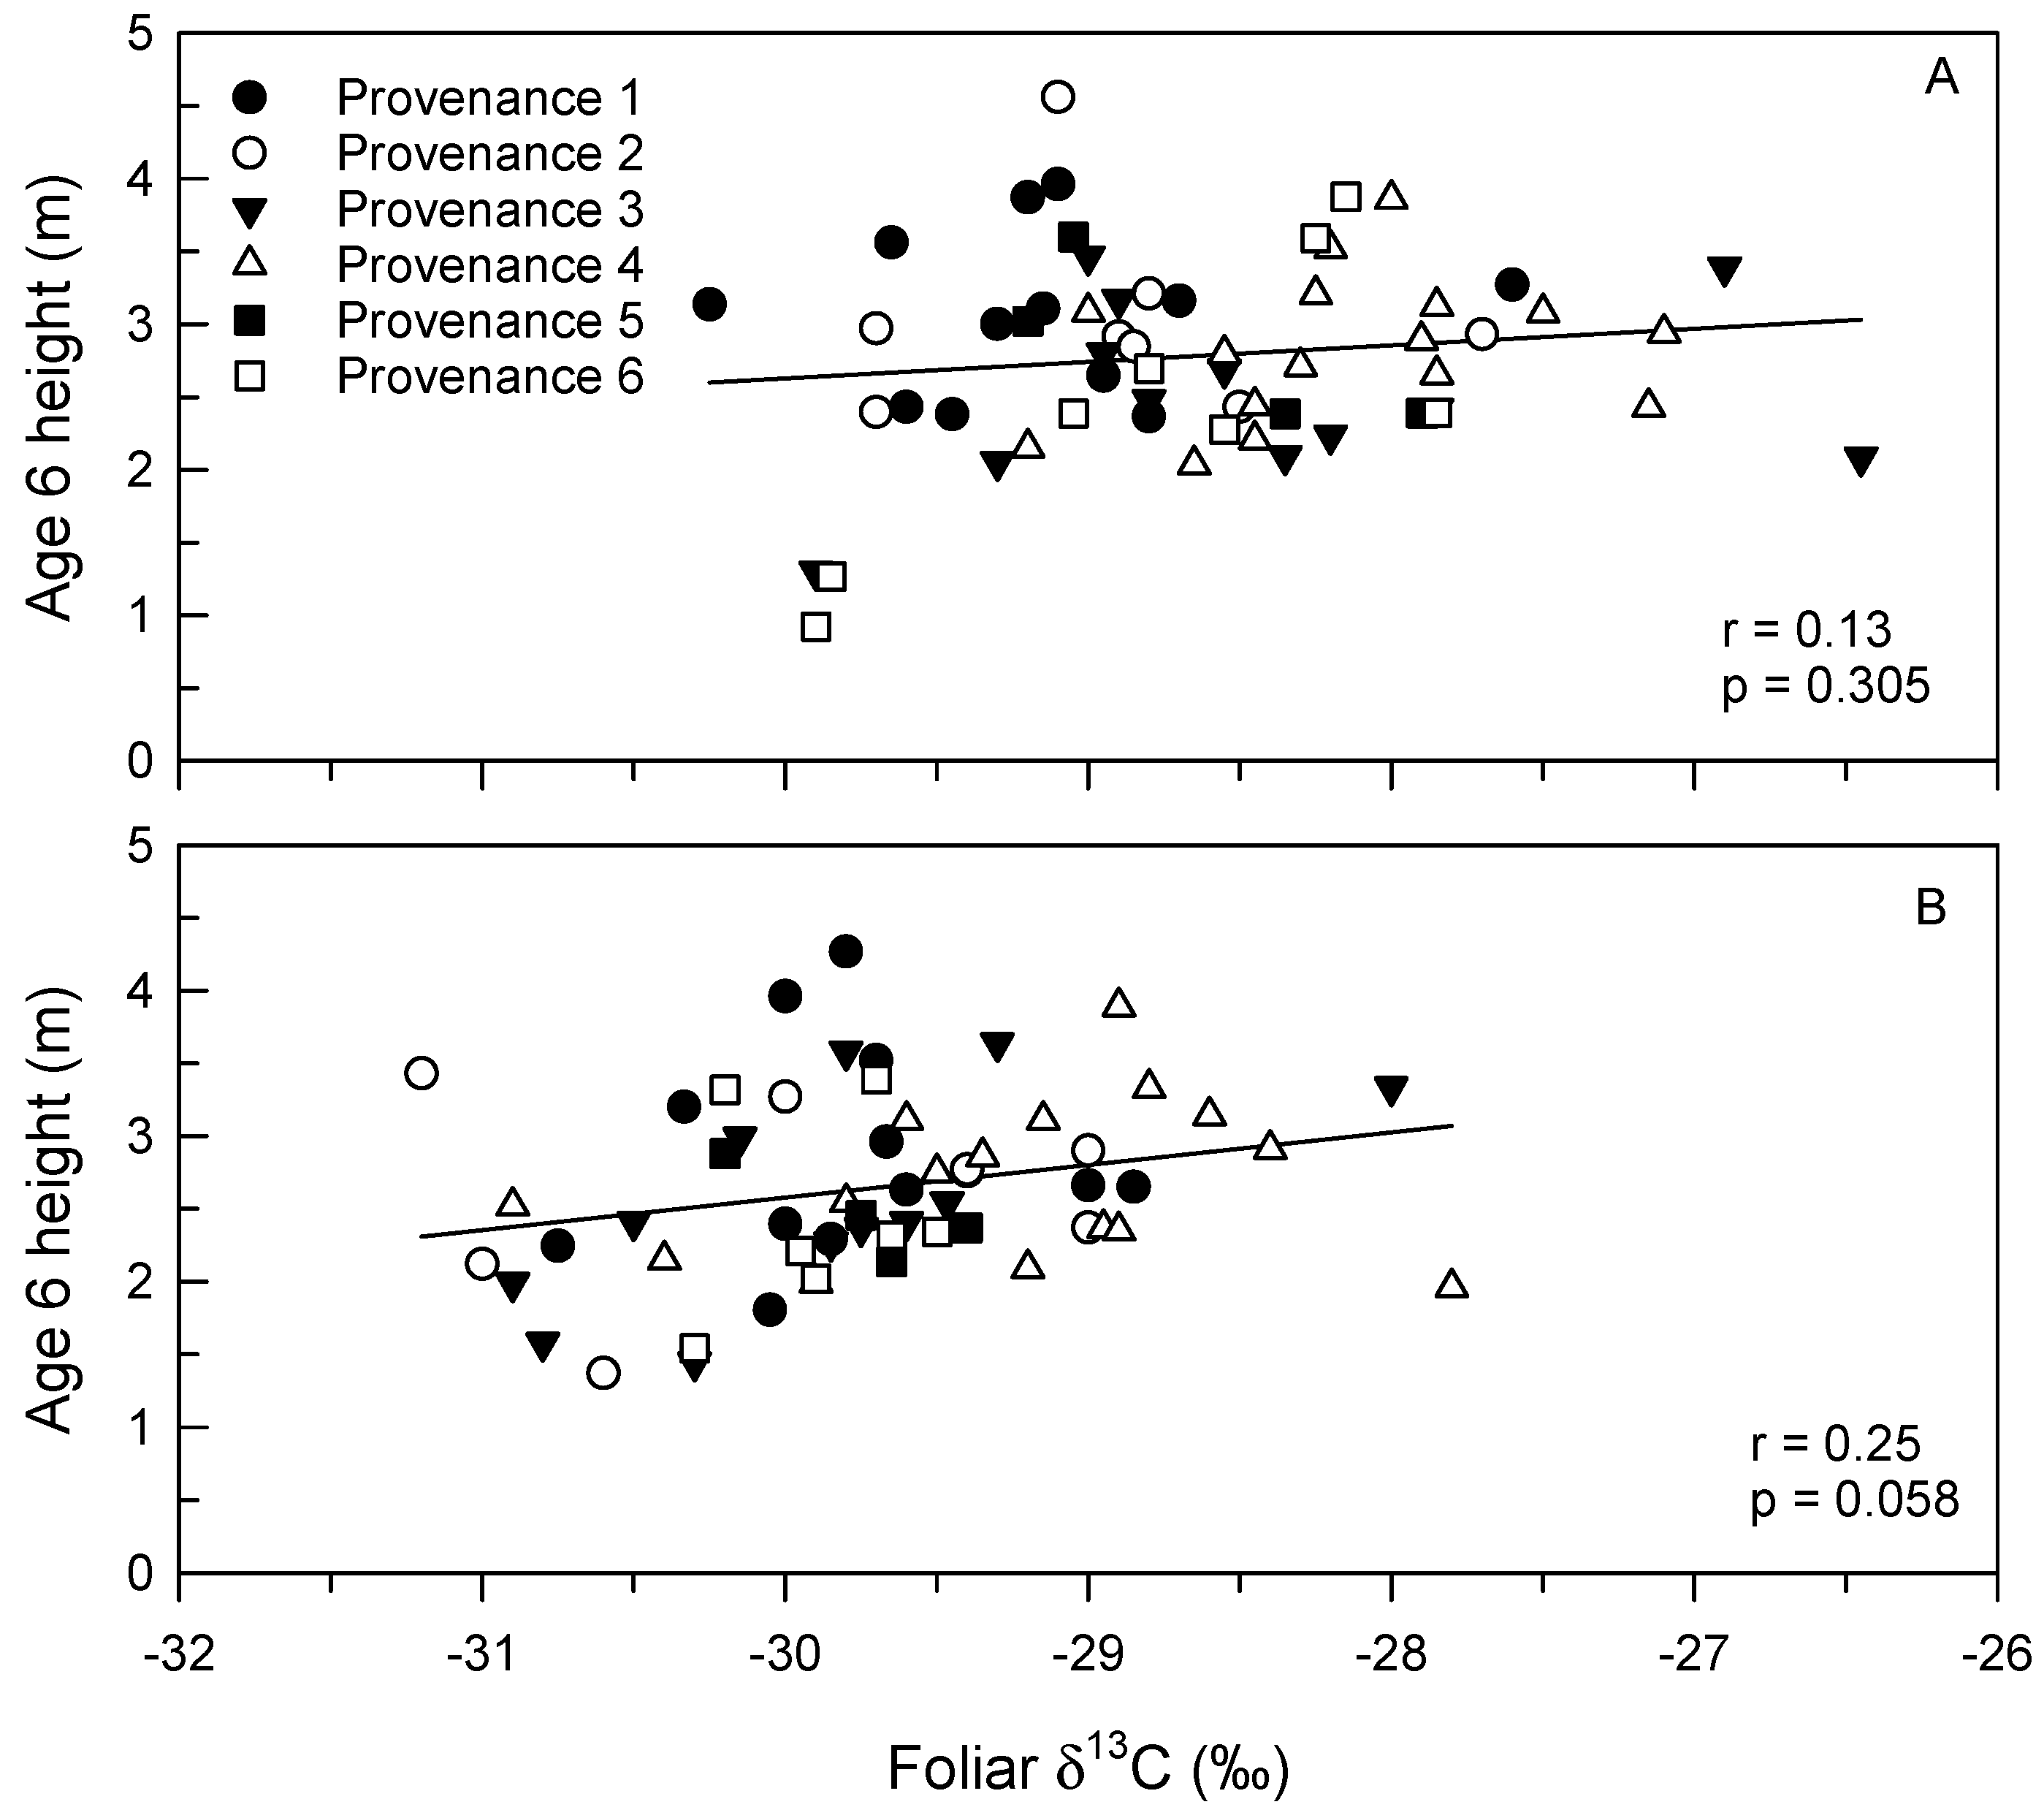
3.4. Foliar δ13C and N Concentration
4. Discussion
5. Conclusions
Author Contributions
Funding
Acknowledgments
Conflicts of Interest
References
- Schmidtling, R.C. Southern Pine Seed Sources; USDA Forest Service, Southern Research Station: Asheville, NC, USA, 2001; 26p.
- Noss, R.F.; LaRoe, E.T.; Scott, J.M. Endangered Ecosystems of the United States: A Preliminary Assessment of Loss and Degradation; USDI National Biological Services: Washington, DC, USA, 1995.
- Diop, A.; Palola, E.; Staudt, A.; Stein, B. Standing tall: How Restoring Longleaf Pine Can Help Prepare the Southeast for Global Warming; National Wildlife Federation: Reston, VA, USA, 2009. [Google Scholar]
- Johnsen, K.H.; Butnor, J.R.; Kush, J.S.; Schmidtling, R.C.; Nelson, C.D. Longleaf pine displays less wind damage than loblolly pine. South. J. App. For. 2009, 33, 178–181. [Google Scholar]
- Ledig, F.T.; Kitzmiller, J.H. Genetic strategies for reforestation in the face of global climate change. For. Ecol. Manag. 1992, 50, 153–169. [Google Scholar] [CrossRef]
- Dorman, K.W. The Genetics and Breeding of Southern Pines; USDA Forest Service: Washington, DC, USA, 1976; 407p.
- Schmidtling, R.C.; Sluder, E.R. Seed transfer and genecology of longleaf pine. In Proceedings of the 23rd Southern Tree Improvement Conference, Asheville, NC, USA, 20–22 June 1995; Southern Forest Tree Improvement Committee, Ed.; National Technical Information Service: Springfield, VA, USA, 1995. [Google Scholar]
- Wells, O.; Wakeley, P.C. Variation in longleaf pine from several geographic sources. For. Sci. 1970, 16, 28–42. [Google Scholar]
- Boshier, D.; Broadhurts, L.; Cornelius, J.; Gallo, L.; Koskela, J.; Loo, J.; Petrokosfsky, G.; St Clair, B. Is local best? Examining the evidence for local adaptation in trees and its scale. Environ. Evid. 2015, 4, 20. [Google Scholar] [CrossRef]
- Farquhar, G.D.; O’Leary, M.H.; Berry, J.A. On the relationship between carbon isotope discrimination and the intercellular carbon dioxide concentration in leaves. Aust. J. Plant Physiol. 1982, 9, 121–137. [Google Scholar] [CrossRef]
- Ehleringer, J.R. 13C/12C Fractionation and its utility in terrestrial plant studies. In Carbon Isotope Techniques; Coleman, D.C., Fry, B., Eds.; Academic Press, Inc.: San Diego, CA, USA, 1991; pp. 187–200. ISBN 0-12-179731-7. [Google Scholar]
- Correia, I.; Almeida, M.H.; Aguiar, A.; Alia, R.; Davis, T.S.; Pereira, J.S. Variations in growth, survival and carbon isotope discrimination (δ13C) among Pinus pinaster populations of different geographic origins. Tree Physiol. 2008, 28, 1545–1552. [Google Scholar] [CrossRef] [PubMed]
- Zhang, J.; Marshall, J.D.; Jaquish, B.C. Genetic differentiation in carbon isotope discrimination and gas exchange in Pseudotsuga menziesii. Oecologia 1993, 93, 80–87. [Google Scholar] [CrossRef] [PubMed]
- Xue, J.M.; Clinton, P.W.; Davis, M.R.; Siddiqui, T.; Beets, P.N.; Leckie, A.C. Genotypic variation in foliar nutrient concentrations, δ13C and chlorophyll fluorescence in relation to tree growth of radiata pine clones in a serpentine soil. J. Plant Nutr. Soil Sci. 2013, 176, 724–733. [Google Scholar] [CrossRef]
- Olivas-Garcia, J.M.; Cregg, B.M.; Hennessey, T.C. Genotypic variation in carbon isotope discrimination and gas exchange of ponderosa pine seedlings under two levels of water stress. Can. J. For. Res. 2000, 30, 1581–1590. [Google Scholar] [CrossRef]
- Johnsen, K.H.; Flanagan, L.B.; Huber, D.A.; Major, J.E. Genetic variation in growth and carbon isotope discrimination in Picea mariana: Analyses from a half-diallel mating design using field grown trees. Can. J. For. Res. 1999, 29, 1727–1735. [Google Scholar] [CrossRef]
- Moran, E.; Lauder, J.; Musser, C.; Stathos, A.; Shu, M. The genetics of drought tolerance in conifers. New Phytol. 2017, 216, 1034–1048. [Google Scholar] [CrossRef] [PubMed]
- Gonzalez-Benecke, C.A.; Martin, T.A. Water availability and genetic effects on water relations of loblolly pine (Pinus taeda) stands. Tree Physiol. 2010, 30, 376–392. [Google Scholar] [CrossRef] [PubMed]
- Baltunis, B.; Martin, T.A.; Huber, D.A.; Davis, J.M. Inheritance of foliar stable carbon isotope discrimination and third-year height in Pinus taeda clones on contrasting sites in Florida and Georgia. Tree Genet. Genome 2008, 4, 797–807. [Google Scholar] [CrossRef]
- Aitken, S.N.; Yeaman, J.A.; Holliday, T.; Wang, T.; Curtis-McLane, S. Adaptation, migration or extirpation: Climate change outcomes for tree populations. Evol. Appl. 2008, 1, 95–111. [Google Scholar] [CrossRef] [PubMed]
- Schmidtling, R.C. Use of provenance tests to predict response to climatic change: Loblolly pine and Norway spruce. Tree Physiol. 1994, 14, 805–817. [Google Scholar] [CrossRef] [PubMed]
- Thomson, A.M.; Parker, W.H. Boreal forest provenance tests used to predict optimal growth and response to climate change. 1. Jack pine. Can. J. For. Res. 2008, 38, 157–170. [Google Scholar] [CrossRef]
- Farjat, A.; Reich, B.J.; Guinness, J.; Whetten, R.; Mckeand, S.; Isik, F. Optimal seed deployment under climate change using spatial models: application to loblolly pine in the southeastern US. J. Am. Stat. Assoc. 2017, 112, 909–920. [Google Scholar] [CrossRef]
- Craul, P.J.; Kush, J.S.; Boyer, W.D. Longleaf Pine Site Zones; USDA Forest Service, Southern Research Station: Ashville, NC, USA, 2005; 23p.
- Aspinwall, M.J.; King, J.S.; Domec, J.-C.; McKeand, S.E.; Isik, F. Genetic effects on transpiration, canopy conductance, stomatal sensitivity to vapour pressure deficit, and cavitation resistance in loblolly pine. Ecohydrology 2011, 4, 168–182. [Google Scholar] [CrossRef]
- Zhang, J.; Bregg, B.M. Growth and physiological responses to varies environments among populations of Pinus ponderosa. For. Ecol. Manag. 2005, 219, 1–12. [Google Scholar] [CrossRef]
- Siebt, U.; Rajabi, A.; Griffiths, H.; Berry, J.A. Carbon isotopes and water use efficiency: Sense and sensitivity. Oecologia 2008, 155, 441–454. [Google Scholar] [CrossRef] [PubMed]
- Nelson, C.D.; Boyd, G.; Rousseau, R.J.; Crane, B.S.; Echt, G.S.; Johnsen, K.H. Participatory genetic improvement: Longleaf pine. In Proceedings of the 17th Biennial Southern Silvicultural Research Conference, Shreveport, LA, USA, 5–7 March 2015; Gordon, H.A., Connor, K.F., Haywood, J.D., Eds.; USDA Forest Service, Southern Research Station: Ashville, NC, USA, 2015. [Google Scholar]
- Peet, R.K. Ecological classification of longleaf pine woodlands. In The longleaf Pine Ecosystem: Ecology Silviculture, and Restoration; Jose, S., Jokela, E.J., Miller, D.L., Eds.; Springer: New York, NY, USA, 2006; pp. 51–93. ISBN 978-0-387-29655-5. [Google Scholar]
- National Centers for Environmental Information: National Oceanic and Atmospheric Administration. Available online: https://www.ncdc.noaa.gov/data-access/land-based-station-data (accessed on 7 May 2018).
- National Centers for Environmental Information: National Oceanic and Atmospheric Administration. Available online: https://www.ncdc.noaa.gov/cdo-web/datasets/GHCND/stations/GHCND:USC00227840/detail (accessed on 7 May 2018).
- National Centers for Environmental Information: National Oceanic and Atmospheric Administration. Available online: https://www1.ncdc.noaa.gov/pub/orders/CDODiv2809097640256.txt (accessed on 7 May 2018).
- National Centers for Environmental Information: National Oceanic and Atmospheric Administration. Available online: https://www.ncdc.noaa.gov/cdo-web/datasets/GHCND/stations/GHCND:USC00314860/detail (accessed on 7 May 2018).
- National Centers for Environmental Information: National Oceanic and Atmospheric Administration. Available online: https://www1.ncdc.noaa.gov/pub/orders/CDODiv8050857640243.txt (accessed on 7 May 2018).
- Samuelson, L.J.; Seiler, J.R.; Feret, P.P. Gas exchange and canopy structure of 9-year-old loblolly pine, pitch pine, and pitch x loblolly hybrids. Trees 1992, 6, 28–31. [Google Scholar] [CrossRef]
- Grulke, N.E. Plasticity in physiological traits in conifers: Implications for response to climate change in the western U.S. Environ. Pollut. 2010, 158, 2032–2042. [Google Scholar] [CrossRef] [PubMed]
- Niinemets, U.; Ellsworth, D.S.; Lukjanovan, A.; Tobias, M. Dependence of needle architecture and chemical composition on canopy light availability in three North American Pinus species with contrasting needle length. Tree Physiol. 2002, 22, 747–761. [Google Scholar] [CrossRef] [PubMed]
- Eimil-Fraga, C.; Sánchez-Rodríguez, F.; Álvarez-Rodríguez, E.; Rodríguez-Soalleiro, R. Relationships between needle traits, needle age and site and stand parameters in Pinus pinaster. Trees 2015, 29, 1103–1113. [Google Scholar] [CrossRef]
- Raison, R.J.; Myers, B.J.; Benson, M.L. Dynamics of Pinus radiata foliage in relation to water and nitrogen stress: I. Needle production and properties. For. Ecol. Manag. 1992, 52, 139–158. [Google Scholar] [CrossRef]
- Wright, G.C.; Rao, R.C.N.; Farquhar, G.D. Water use efficiency and carbon isotope discrimination in peanut under water deficit conditions. Crop Sci. 1994, 34, 92–97. [Google Scholar] [CrossRef]
- Schmidtling, R.C.; Hipkins, V. Genetic diversity in longleaf pine (Pinus palustris): Influence of historical and prehistoric events. Can. J. For. Res. 1998, 28, 1135–1145. [Google Scholar] [CrossRef]
- Cregg, B.M. Carbon allocation, gas exchange, and needle morphology of Pinus ponderosa genotypes known to differ in growth and survival under drought. Tree Physiol. 1994, 14, 883–889. [Google Scholar] [CrossRef] [PubMed]
- Warren, C.R.; Adams, M.A. Internal conductance does not scale with photosynthetic capacity: Implications for carbon isotope discrimination and the economics of water and nitrogen use in photosynthesis. Plant Cell Environ. 2006, 29, 192–201. [Google Scholar] [CrossRef] [PubMed]
- Milla-Morena, E.A.; McKown, A.D.; Guy, R.D.; Soollanayakanahally, R.Y. Leaf mass per area predicts palisade structural properties linked to mesophyll conductance in balsam poplar (Populus balsamifera L.). Botany 2016, 94, 225–239. [Google Scholar] [CrossRef]
- Vitousek, P.M.; Field, C.B.; Matson, P.M. Variation in foliar δ13C in Hawaiian Metrosidieros polymorpha: A case of internal resistance? Oecologia 1990, 84, 362–370. [Google Scholar] [CrossRef] [PubMed]
- Sun, Z.L.; Livingston, N.J.; Guy, R.D.; Ethier, G.J. Stable carbon isotopes as indicators of increased water use efficiency and productivity in white spruce (Picea glauca (Moench) Voss) seedlings. Plant Cell Environ. 1996, 19, 887–894. [Google Scholar] [CrossRef]
- Korol, R.L.; Kirschbaum, M.U.F.; Farquhar, G.D.; Jeffreys, M. Effects of water status and soil fertility on the C-isotope signature in Pinus radiata. Tree Physiol. 1999, 19, 551–562. [Google Scholar] [CrossRef] [PubMed]
- Cregg, B.M.; Zhang, J.W. Physiology and morphology of Pinus sylvestris seedlings from diverse sources under cyclic drought stress. For. Ecol. Manag. 2001, 154, 131–139. [Google Scholar] [CrossRef]
- Nelson, C.D.; Weng, C.; Kubisiak, T.L.; Stine, M.; Brown, C.L. On the number of genes controlling the grass stage in longleaf pine. J. Heredity 2003, 94, 392–398. [Google Scholar] [CrossRef]
- Xue, J.; Dungey, H.S.; Clinton, P.W.; Henley, D.; Niollet, S.; Leckie, A. The Potential for Using Foliar Carbon Isotopic Signature to Screen for Drought Tolerant Radiata Pine Genotypes for Dryland Plantation Forests in New Zealand; MPI Technical Paper No. 2013/38; Ministry for Primary Industries: Wellington, New Zealand, 2013.
- Prasolova, N.V.; Xu, Z.H.; Lundvist, K.; Faruhar, G.D.; Dieters, M.J.; Walker, S.; Saffigna, P.G. Genetic variation in foliar carbon isotope composition in relation to tree growth and foliar nitrogen concentration in clones of the F1 hybrid between slash pine and Caribbean pine. For. Ecol. Manag. 2003, 172, 145–160. [Google Scholar] [CrossRef]
- Kerr, K.L.; Meizer, F.C.; McCulloch, K.A.; Woodruff, D.R.; Marias, D.E. Expression of functional traits during seedling establishment in two populations of Pinus ponderosa from contrasting climates. Tree Physiol. 2015, 35, 535–548. [Google Scholar] [CrossRef] [PubMed]
- Samuelson, L.J.; Kane, M.; Markewitz, D.; Teskey, R.; Akers, M.; Stokes, T.; Pell, C.; Qi, J. Fertilization increased leaf water use efficiency and growth of Pinus taeda subjected to five years of throughfall reduction. Can. J. For. Res. 2018, 48, 236–245. [Google Scholar] [CrossRef]
- Johnsen, K.H.; Creighton, J.L.; Maier, C.A. Longleaf pine grown in Virginia: A provenance test. In Proceedings of the 17th Biennial Southern Silvicultural Research Conference, Shreveport, LA, USA, 5–7 March 2015; Gordon, H.A., Connor, K.F., Haywood, J.D., Eds.; USDA Forest Service, Southern Research Station: Ashville, NC, USA, 2015. [Google Scholar]


| Provenance | Provenance Physiographic Province 1 | Family Origin | Latitude, Longitude (Degrees) | Number of Families | Mean Minimum Temperature 2 (°C) |
|---|---|---|---|---|---|
| 1 | WGCP | Sabine Co., TX | 31.3432, −93.8518 | 1 | 12.9 |
| Vernon Parish, LA | 31.1083, −93.1842 | 2 | 12.1 | ||
| 2 | EGCP | Perry Co., MS | 31.1720, −88.9923 | 1 | 11.6 |
| Escambia Co., AL | 31.1261, −87.1616 | 1 | 11.7 | ||
| 3 | SCP | Baker Co., FL | 30.3311, −82.2846 | 1 | 14.2 |
| Wakulla Co., FL | 30.1478, −84.3756 | 2 | 13.2 | ||
| 4 | P, MU | Chilton Co., AL | 32.8479, −86.7188 | 1 | 10.3 |
| Bibb Co., AL | 32.9986, −87.1264 | 2 | 9.4 | ||
| Cleburne Co., AL | 33.6746, −85.5188 | 1 | 10.0 | ||
| 5 | EGCP, ACP | Burke Co., GA | 33.0612, −82.0080 | 2 | 11.2 |
| 6 | ACP, FS | Harnett Co., NC | 35.3686, −78.8693 | 1 | 11.1 |
| Bladen Co., NC | 34.6143, −78.5632 | 1 | 9.9 |
| Source of Variation | Height | DBH | Needle Length | SLW | Foliar δ13C | Foliar N |
|---|---|---|---|---|---|---|
| Year | <0.001 | <0.001 | <0.001 | |||
| Site | 0.004 | <0.001 | 0.235 | 0.001 | <0.001 | 0.012 |
| Provenance | 0.022 | 0.107 | 0.028 | 0.014 | <0.001 | 0.502 |
| Family (Provenance) | <0.001 | 0.076 | 0.683 | 0.557 | 0.318 | 0.779 |
| Site × Provenance | 0.749 | 0.981 | 0.818 | 0.576 | 0.462 | 0.132 |
| Site × Family (Provenance) | 0.982 | 0.992 | 0.652 | 0.521 | 0.691 | 0.337 |
| Year × Site | 0.001 | 0.017 | 0.276 | |||
| Year × Family (Provenance) | 0.200 | 0.081 | 0.435 | |||
| Year × Site × Provenance | 0.840 | 0.575 | 0.678 | |||
| Year × Site × Family (Provenance) | 0.905 | 0.624 | 0.314 |
© 2018 by the authors. Licensee MDPI, Basel, Switzerland. This article is an open access article distributed under the terms and conditions of the Creative Commons Attribution (CC BY) license (http://creativecommons.org/licenses/by/4.0/).
Share and Cite
Samuelson, L.; Johnsen, K.; Stokes, T.; Anderson, P.; Nelson, C.D. Provenance Variation in Pinus palustris Foliar δ13C. Forests 2018, 9, 466. https://doi.org/10.3390/f9080466
Samuelson L, Johnsen K, Stokes T, Anderson P, Nelson CD. Provenance Variation in Pinus palustris Foliar δ13C. Forests. 2018; 9(8):466. https://doi.org/10.3390/f9080466
Chicago/Turabian StyleSamuelson, Lisa, Kurt Johnsen, Tom Stokes, Peter Anderson, and C. Dana Nelson. 2018. "Provenance Variation in Pinus palustris Foliar δ13C" Forests 9, no. 8: 466. https://doi.org/10.3390/f9080466
APA StyleSamuelson, L., Johnsen, K., Stokes, T., Anderson, P., & Nelson, C. D. (2018). Provenance Variation in Pinus palustris Foliar δ13C. Forests, 9(8), 466. https://doi.org/10.3390/f9080466