Article

Modeling Hydrological Appraisal of Potential Land Cover Change and Vegetation Dynamics under Environmental Changes in a Forest Basin

1
College of Hydrometeorology, Nanjing University of Information Science & Technology, Nanjing 210044, China
2
School of Civil Engineering, Hefei University of Technology, Hefei 230009, China
3
Water Resources Research Center, Disaster Prevention Research Institute, Kyoto University, Uji, Gokasho 611-0011, Japan
*
Author to whom correspondence should be addressed.
Forests 2018, 9(8), 451; https://doi.org/10.3390/f9080451
Submission received: 9 May 2018 / Revised: 22 July 2018 / Accepted: 24 July 2018 / Published: 26 July 2018
(This article belongs to the Special Issue Afforestation and Reforestation: Drivers, Dynamics, and Impacts)

Abstract

:
An integrated multi-model approach to predict future land cover in the Da River Basin in Vietnam was developed to analyze future impacts of land cover change on streamflow and sediment load. The framework applied a land cover change model and an ecological model to forecast future land cover and leaf area index (LAI) based on the historical land cover change, and these data were then used in a calibrated distributed hydrological model and a new sediment rating curve model to assess hydrological changes and sediment load in the river basin. Results showed that deforestation would likely continue, and that forest area would decrease by up to 21.3% by 2050, while croplands and shrublands would replace forests and increase by over 11.7% and 10%, respectively. Streamflow and sediment load would generally increase due to deforestation in the Da River Basin in the 2050s, in both the wet and dry seasons, but especially in the wet season. In this case, the predicted annual sediment load was expected to increase by about 9.7% at the Lai Chau station. As deforestation increased, sediment load and reservoir siltation could likely shorten the lifespan of the recently constructed Son La Reservoir. The applied integrated modeling approach provides a comprehensive evaluation of land/forest cover change effects on the river discharge and sediment load, which is essential in understanding human impacts on the river environment and in designing watershed management policies.

Graphical Abstract

1. Introduction

Land cover change is a global phenomenon and has dramatically altered river basin environments in the past decades [1,2,3,4,5,6]. Although land cover pattern changes certainly provide many socioeconomic benefits, they are also a major driving force in the degradation of natural environments, local river inundation [7], and serious soil degradation [6,8,9]. Land cover change is directly linked to the watershed hydrological cycle, altering the balance between rainfall and evapotranspiration [2,3,5,10], and additionally affecting flow velocity [6], whether in the form of streams or overland flows, due to changes in slope or gradient [11]. Land cover change also modifies the overland flow resistance and soil erodibility, and consequently impacts the sediment load in river basins.
Many studies have been carried out to evaluate impacts of the land cover change or vegetation dynamics on streamflow [1,2,3,10] and sediment load [6,9,12,13] at different spatial and temporal scales. Generally, researchers have agreed that land cover change or vegetation dynamics can alter streamflow or sediment load [1,2,3,4,5,6,7,9,10,11,12]. Many studies also agreed on the vegetation effect on streamflow, i.e., the streamflow should increase along with deforestation and vegetation degradation [3], or decrease following afforestation and vegetation restoration [2]. However, a few case studies have shown that forest/vegetation could have some positive effects on river discharge [14,15]. Although it is generally agreed that land cover change has negative effects on river streams, its role and importance in altering streamflow is still argued about, especially for large basins [2,5,14,16].
Deforestation or vegetation degradation is considered to be a main risk factor for riverbanks and surface soil erosion, as it results in the increase of sediment transportation in surface runoff and streamflow velocity [8,9]. For example, Schmidt et al., using an isotope tracer technique, concluded that deforestation caused by agricultural expansion significantly increased the sediment yield of six rivers in western China [6]. Moreover, the response of sediment load to land cover change appears to be more complex than that of streamflow response [17,18,19]. Although streamflow and sediment load are strongly correlated in response to land cover change [20,21], the level or severity of the land cover change impacts on both of these parameters are still arguable [2,5,15,16,22]. Land cover change has a big impact on the river basin’s hydrological cycle, including many environmental issues, and thus it should be assessed as one unit for a better understanding of the overall impact to the catchment.
The Red River in the northwest of Vietnam is classified as one of the top ten rivers in terms of sedimentation load, and it is a well-known major agricultural area in Vietnam. Rapid land development in the upstream area and dam constrictions have changed the hydrological cycle, sediment load, and biodiversity in the area [23]. Land cover change was recognized as the major factor to alter streamflow and sediment flow in the upstream area of the Red River compared to climate change [21]. Satellite observation and model simulations suggested that the decrease in historical vegetation cover raised sediment load by 13.7% in the Red River Basin [24]. In addition, land cover change has caused significant variations in the peak river flow and velocity, increasing flood risk in the downstream area [23]. On the other hand, the sediment load has decreased, starting from the downstream area of the HoaBinh Dam since the construction of the dam, indicating that HoaBinh Reservoir has trapped half of the annual sediment [23,25]. Such a sediment load reduction and reservoir siltation issues have caused a re-evaluation of the HoaBinh Dam life span and its flooding prevention functions [26]. This example shows how sediment load evaluation in connection to land cover change is an important task for future dam construction design under rapidly changing conditions. Most studies have been focused separately on historical changes in streamflow or sediment load analysis in the Red River Basin, and few studies have combined river discharge and sediment load responses to analyses of future land cover change. However, streamflow and sediment load responses to land cover change are highly correlated, and it is essential to evaluate both variables simultaneously in order to provide useful information that will optimize the use of water resources and reservoir operation in the Red River Basin.
Defining future land cover change plays an important role in the impact assessment and it is crucial for future analyses of streamflow and sediment load. Currently, there are many studies that address this issue, and land use/cover change simulations based on the historical land change analysis are widely applied and well described. Several land use/cover change models have been developed and applied in various parts of the world, including CLUE-S [27], Dinamica EGO [28], GEOMOD [29], and the Land Change Model (LCM) [30]. Among these, the LCM was selected; this model could predict land cover more accurately in several sub-tropic forest-dominated areas, such as Bolivia [30], Mexico [31], and others. Although many studies have combined such land use/cover change models with hydrological models to predict future streamflow [1,32] or sediment load [13], only a few cases were carried out to predict future streamflow and sediment load simultaneously [33]. It is also important to point out that vegetation characteristics would change dynamically along with land cover conversion [5,34], and it is crucial not to overlook vegetation dynamics in the hydrological simulation. Hydrological response to land cover change or dynamic vegetation has therefore received increasing attention from both field observations and model simulations in the catchment area [1,2,3,17,18,19]. However, many studies have been focused on the individual effect of land cover change [2,13,17] or vegetation dynamics [12,24] on the hydrological cycle. Hence, both land cover change and dynamic vegetation impacts were considered in this research.
The main goal of this study was to evaluate the streamflow and the sediment load response to the changes in future land cover and vegetation dynamics in the Da River Basin, one of the largest sub-basins of the Red River Basin. We developed an integrated framework that included a land change model and an ecological model, coupled with a calibrated distributed hydrological model and a new sediment rating curve model. The system was applied in order to quantitatively assess future land cover change impacts in the Da River Basin.

2. Study Area and Data Description

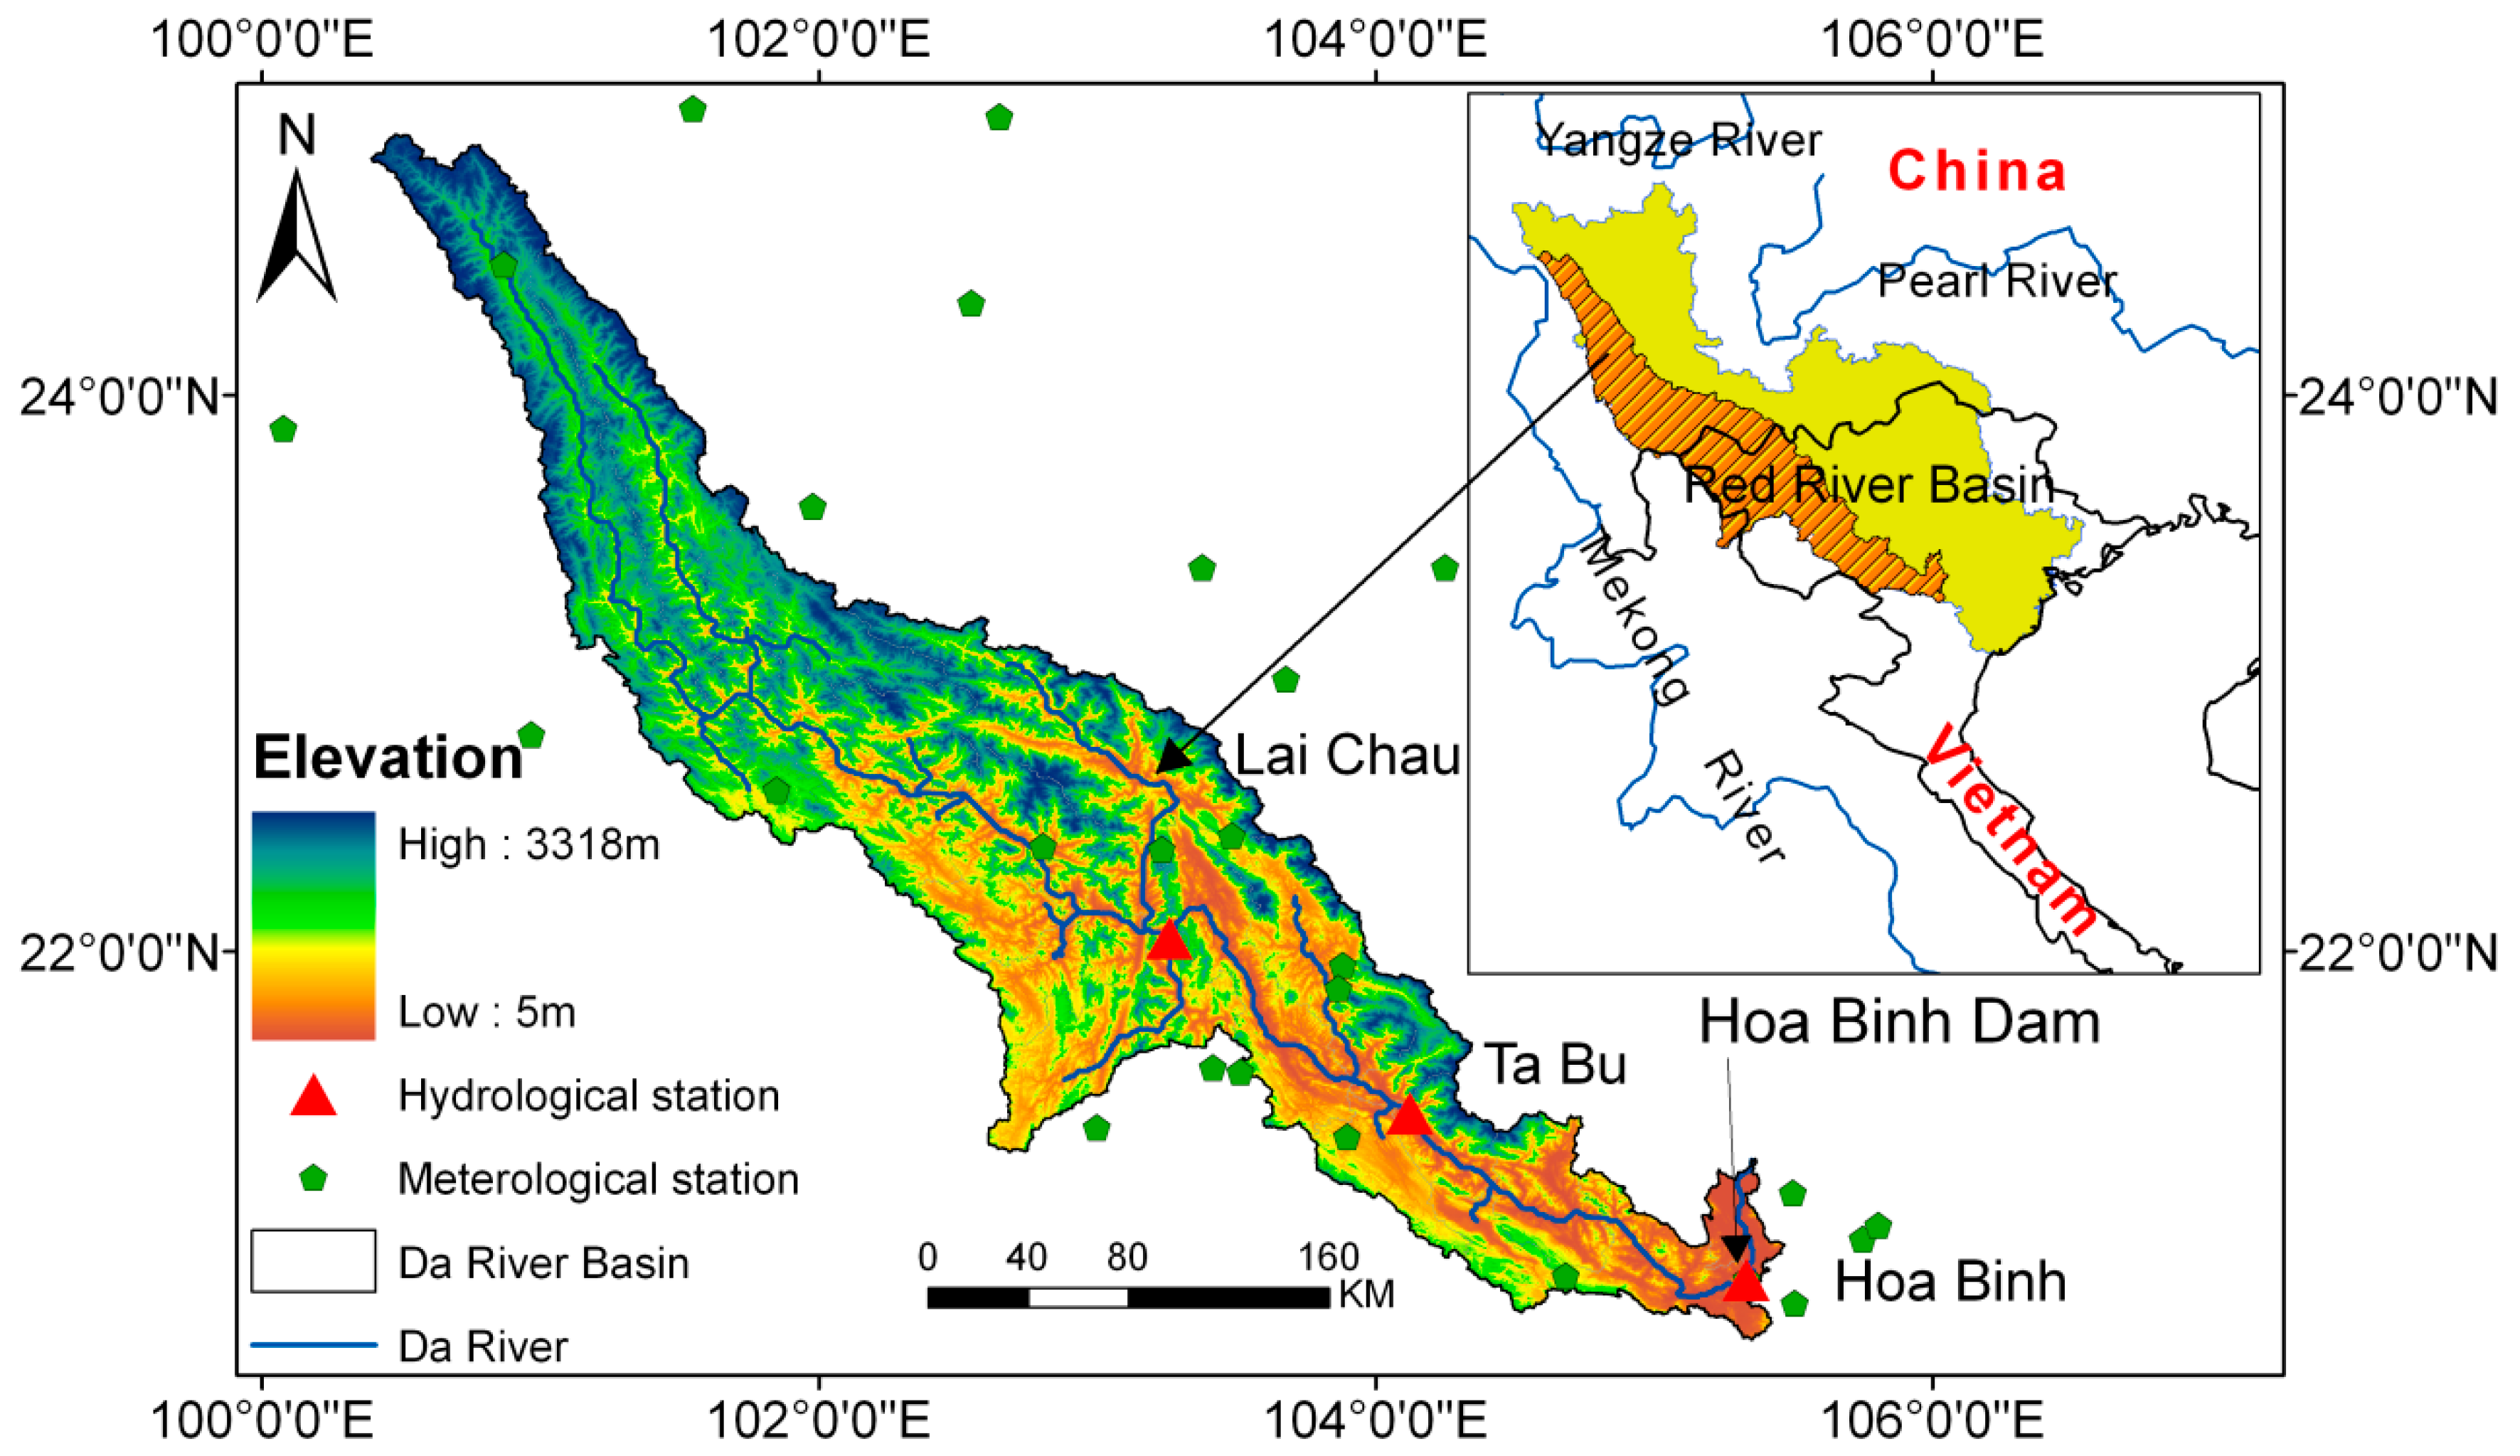
2.1. Study Area Description

The Da River (also known as the Black River) originates in the southeast of China and is one of the largest tributaries of the Red River. Both the Da River and the Red River are trans-boundary rivers shared between Vietnam and China (Figure 1). The catchment area of the Da River is approximately 55,000 km2. The upstream landscape is characterized with narrow and steep slopes with high erosion rates [23]. Climate is dominated by tropical monsoons, with an annual average precipitation of about 1320 mm, falling in two seasons, the rainy season (May to October), with 85% of total precipitation, and the cool dry season, with 15% of total precipitation [23,25]. The annual mean runoff from 1988 to 2004 was about 1168 m3/s at the Lai Chau station, and there was a total annual sediment load of about 40.1 × 10⁶ ton.
Sediment load of the river is important, as the Vietnamese government has decided to build a cascade of five dams and hydropower facilities in the Da River Basin (DRB) (Figure 1) for hydroelectric power, flood prevention, and agricultural irrigation. Up to now, two dams, the Son La and the HoaBinh, were constructed in the DRB. The Son La reservoir in the DRB, with an effective storage of 16.2 km3 [23], has just been completed in October 2012, and it has become the largest dam in Vietnam (Figure 1). Construction of the HoaBinh dam (V = 9.5 km3), located in the downstream area of the Son La dam, was completed in 1993 [23].
Deforestation has been a growing concern in the region, and for the upstream area of the DRB in particular. The region was originally dominated by forest: 70% of the entire DRB was covered by evergreen broadleaf forests, and the remaining area mainly comprised croplands and shrublands. The forest cover of the Chinese portion of the river basin has declined by half from 1950 to 1990 [35], the most severe decline being in 1993 due to unbridled logging and agricultural expansion activities [36]. The past forest cover decline in Vietnam has been even more rapid over the same time period, especially in the mountainous regions of the Sino-Vietnamese border, where forest cover had been reduced by more than 70% of the previous forest area [37]. Since 1995, several programs for forest rehabilitation have been established and the total forest area of Vietnam has been continuously increased; however, the Da River Basin is still limited in terms of forest plantations due to poor accessibility [38]. Compared with the original natural forests, young man-made forests have lower canopy density and shallower rooting depth, and they cannot play an equal role in soil conservation. Over the last 500 years, deforestation have raised the soil erosion rate by 15-fold, resulting in increased sediment load in the DRB [23].

2.2. Dataset Description
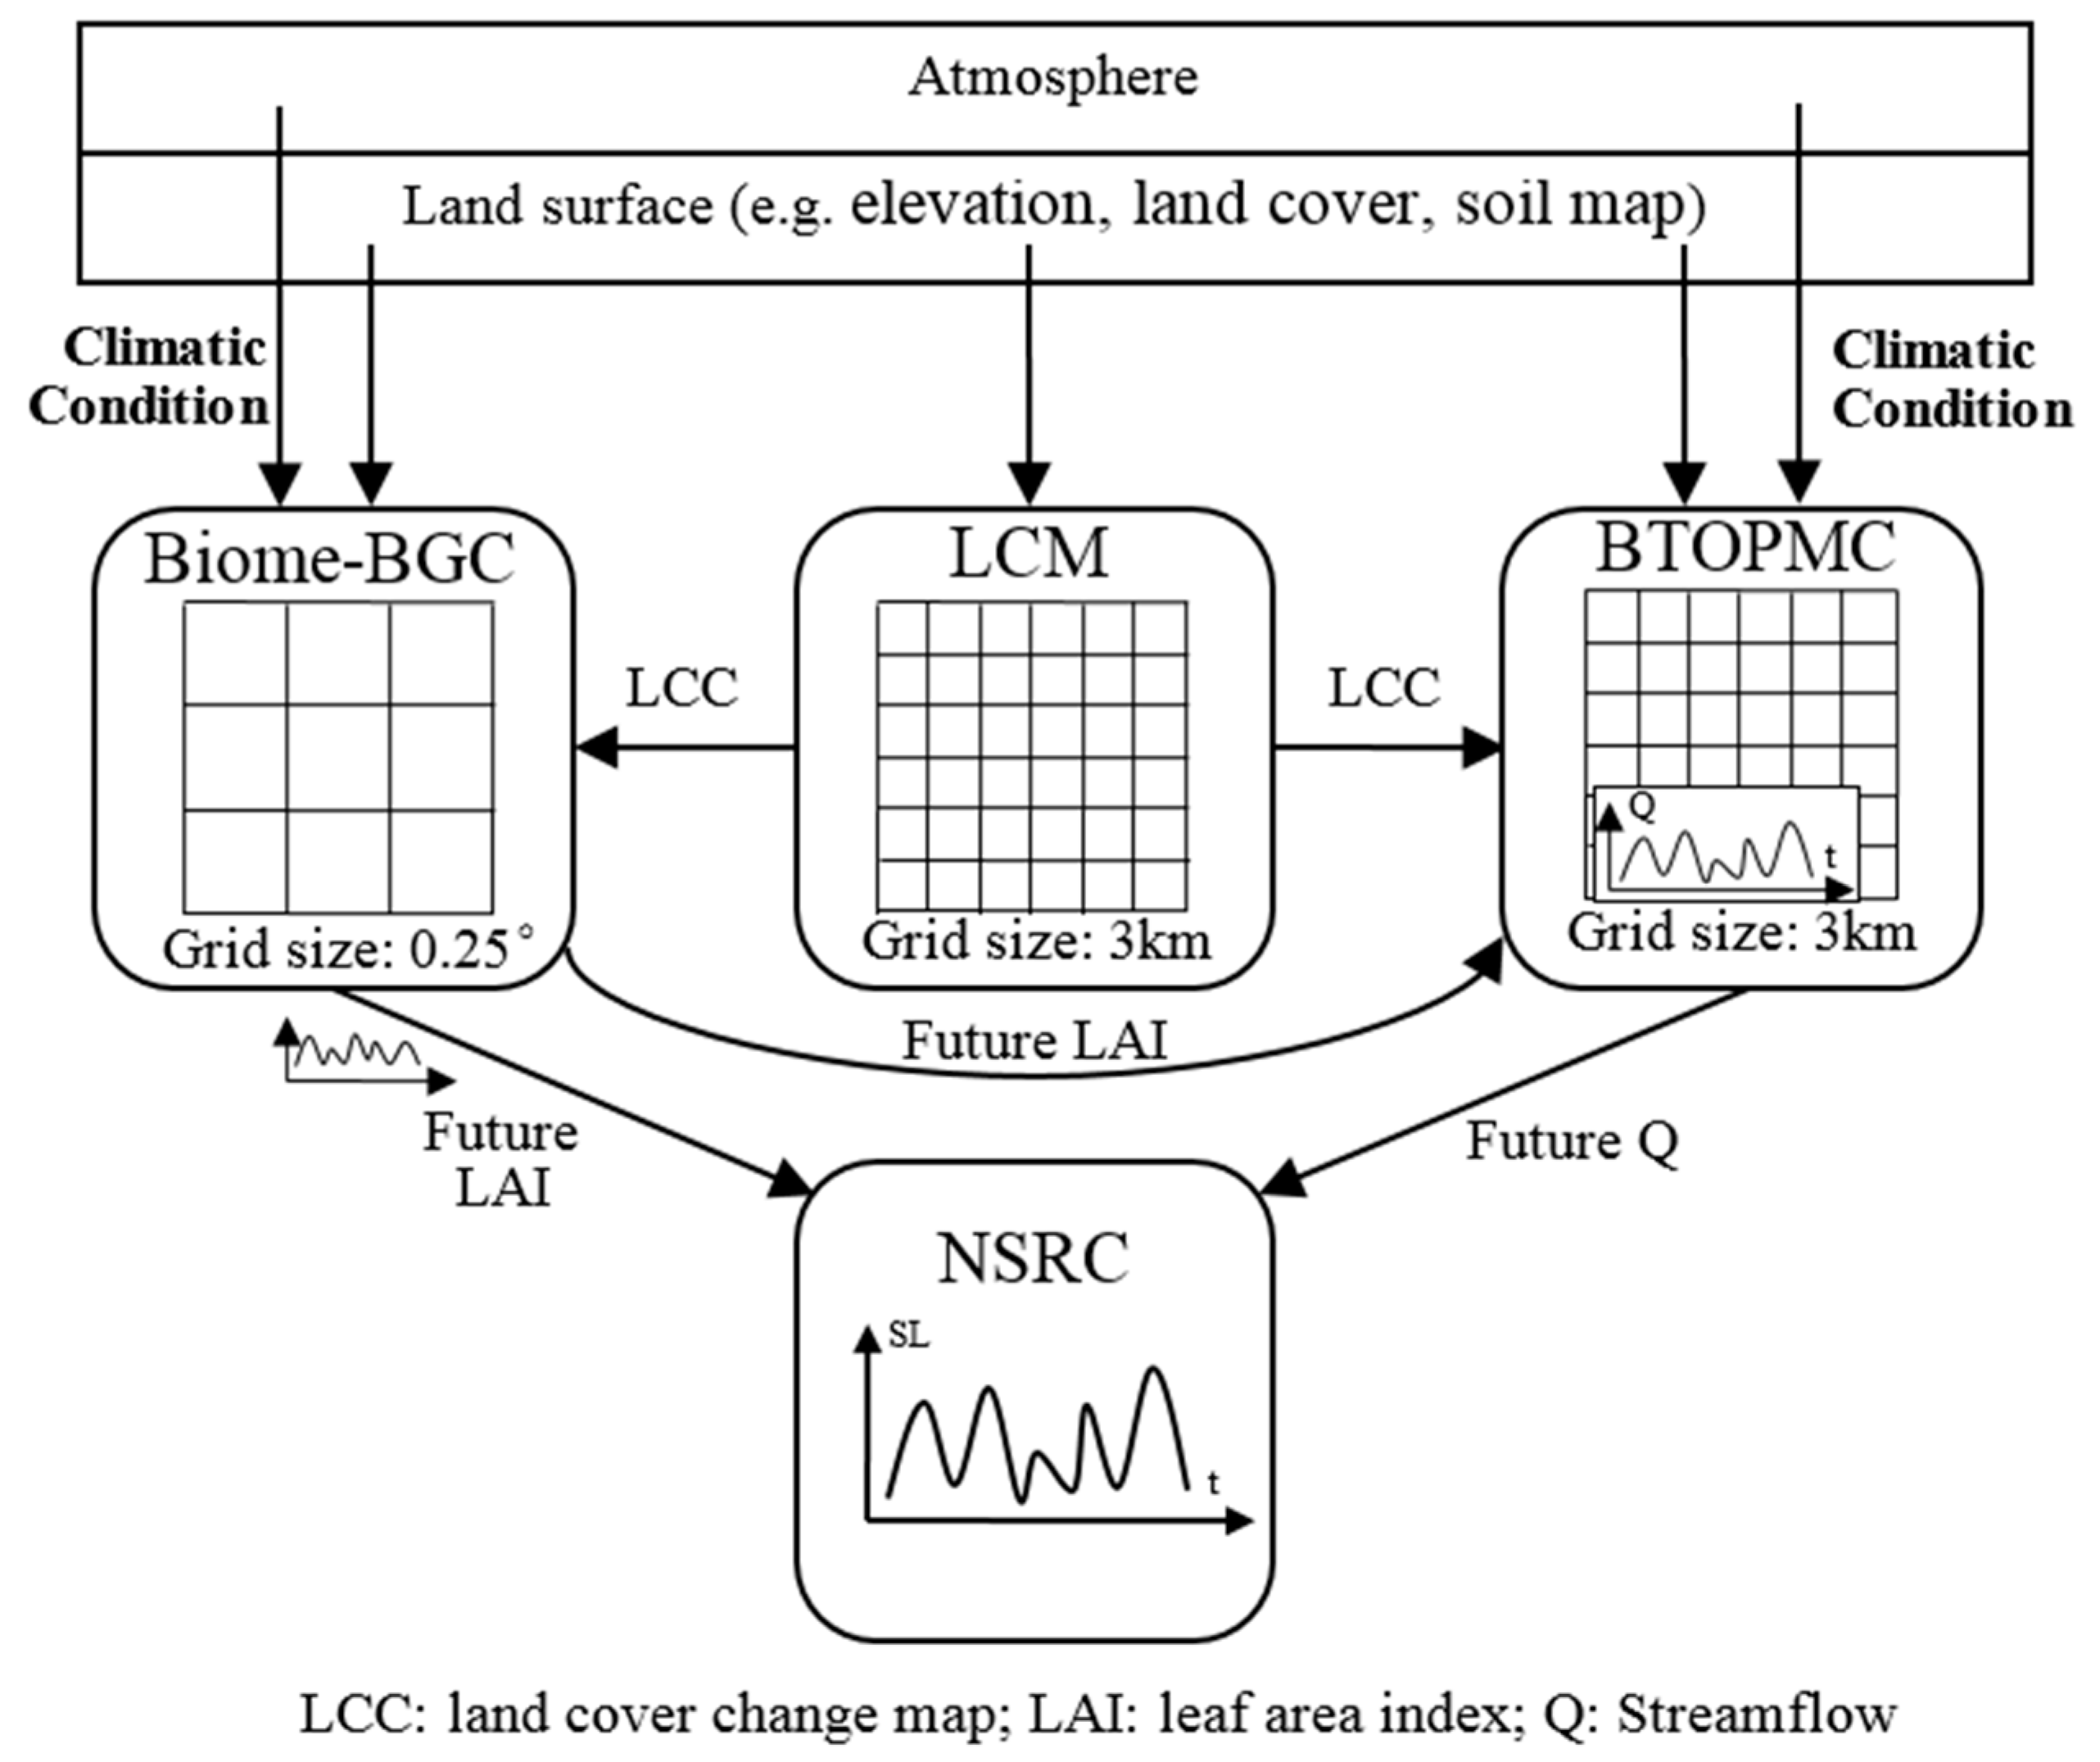
The hydrological and meteorological datasets for 1991–2000 were provided by the Vietnam Academy of Science and Technology and the China Meteorological Data Sharing Service Center. These datasets were used as inputs for hydrological modeling and sediment concentration calculations. Daily streamflow data collected at the Lai Chau (LC) and the Ta Bu (TB) stations in the DRB (Figure 1) were used in calibrating and validating the distributed hydrologic model. Monthly suspended sediment concentration (SSC) data were also available at LC station. Available meteorological stations were well distributed in the study area (Figure 1), providing daily precipitation, wind speed, relative humidity, and hours of sunshine, as well as maximum, minimum, and mean air temperatures of the DRB. To run the ecological model, observation data of precipitation, mean air temperature, relative humidity, and vapor pressure were interpolated to gridded datasets using the ordinary Kriging interpolation method [39,40]. Particularly, the altitude effect on air temperature (a lapse rate of 0.65 °C per 100 m) was considered in the process of the air temperature interpolation [5].
Geographical information (e.g., topography, land use, soil type, vegetation, population density) was used as inputs to the distributed hydrological model, the land change model, and the ecological model. Digital elevation data (GTOPO30) with a 30-arc-second spatial resolution was obtained from the U.S. Geological Survey (USGS) [41]. Soil type and soil properties were extracted from the FAO global soil map [42] with a spatial resolution of 5-arc minutes. Land cover data (from 2001 and 2011) were obtained from Moderate Resolution Imaging Spectroradiometer (MODIS) product [43]. Land cover has been regrouped into eight categories: water body, urban, bare land, forest, cropland, grassland, wetland, and shrublands. The global gridded population density in 2000, the global roads dataset, and the global Human Footprint (HF), provided by the data center in NASA’s Earth Observing System Data and Information System, the digital river network from the Vietnam Academy of Science and Technology, and basin rainfall trends as calculated from TRMM satellite data (TRMM_3A12), were also employed in this study (Table 1).
In addition, a 31-year long global dataset of vegetation leaf area index (LAI3g) from 1981 to 2012, derived from the third generation GIMMS NDVI3g dataset, was introduced to reflect the current LAI (vegetation cover), with a 1/12 degree resolution and 15-day composites [44].

3. Methodology

Four models were used to evaluate change in land cover and its impact on streamflow and sediment load in the DRB: the LCM, Biome-BioGeochemical Cycle (Biome-BGC) Model, Block wise use of TOPMODEL with Muskingum–Cunge routing model (BTOPMC) and New Sediment Rating Curve (NSRC). The models were coupled in a ‘one-way’ manner framework shown on Figure 2 and datasets used in these models were summarized in Table 1. In the initial step, the LCM was used to forecast scenarios of future potential land cover change (LCC); simulated land cover types from the LCM were used as inputs into the Biome-BGC to estimate future LAI. The scenarios of future potential land use types and LAI were then used in the validated BTOPMC for future streamflow analysis. Then, scenarios of future LAI and streamflow were used in the NSRC for future sediment load evaluation. A feedback loop was not included, as spatial changes in land cover and temporal dynamic changes in the LAI were reflected in the basin scale streamflow and sediment load simulations.

3.1. Land Cover Change Model

The Land Change Model, developed at Clark University [45], is a widely-used effective tool to simulate and forecast land cover change [46]. It allows for the determination of the transition potential of land use from one category to a different one, taking into account static or dynamic variables that may explain the change. For predicting the land cover change, protected areas (e.g., natural parks) that can limit the changes are also included. Through a three-stage process, the LCM can produce potential scenarios of future land cover changes based on an assessment of two time periods in the past [47].
Key features of the LCM used in this study were: (1) Land change analysis—to assess the net change and differences between the separated land classes; (2) Land transition potential modeling—to identify driving factors of land cover transition possibilities between different land cover types. In this study, the driving factors (e.g., distance to river network, distance to road, distance to urban area, distance to protected area, annual rainfall trend, basin slopes, human footprint, and population density) were selected in order to generate potential transition maps; and (3) Land change prediction—to calculate transition potential by a multi-layer perception neural network (MLP) [45]. The LCM model output was validated by quantitative comparison of the forecasted land cover map of 2011, obtained through the LCM with the actual map from MODIS. The strength of the model was evaluated by the kappa index (k) and mean error between simulated and observed land cover maps.
The kappa index can be used as a measure of agreement for land cover map comparisons, or to determine whether the values contained in an error matrix represent a result that is significantly better than random [48]. A kappa index ranging from 1 (accurate) to 0 (inaccurate) is computed as:
k = N i = 1 r x ii i = 1 r ( x i + × x + i ) N 2 i = 1 r ( x i + × x + i )
where N is the total number of pixels in the matrix, r is the number of rows in the matrix, xii is the number in row i and column i, x+i is the total for row i, and xi+ is the total for column i [49]. According to the suggestion from Monserud and Leemans [49], kappa index values that are greater than 0.85 indicate that the agreement between two maps is excellent.
In this study, actual land cover layers in 2001 and 2008 were used as inputs in assessing land cover change in the DRB. Land cover change was first analyzed, the transition potential of eight land classes (water body, urban area, bare land, forest, cropland, grassland, wetland, and shrublands) were then determined, and a future land cover likelihood map was simulated by the MLP neural network.

3.2. Ecological Model (Biome-BGC)

The Biome-BGC is a biogeochemical point simulation model developed by the University of Montana to estimate the storage and fluxes of carbon, nitrogen, and water within terrestrial ecosystems [49]. The Biome-BGC has been employed in calculating the future LAI combined with the LCM.
The Biome-BGC requires daily climatic data, soil types, vegetation types, site conditions, and parameters describing the eco-physiological characteristics of the vegetation. To achieve equilibrium conditions when the initial soil and plant compartment pools actually match the mass balance equations, Biome-BGC needs “spin-up” simulations. Among the numerous flux and state variables calculated by this model, the LAI was used in this study [5,21]. Ichii et al. [50] applied this model to simulate the carbon fluxes and gross primary productivity in Amazonian, African, and Asian terrestrial ecosystems. In order to obtain LAI values for all grids, we applied the point-based Biome-BGC model to each grid cell, with a spatial resolution of 0.25 degrees [21]. The model has been well validated in simulating potential LAI in the DRB [21].

3.3. Hydrological Model (BTOPMC)

The BTOPMC is a grid-based blockwise distributed model [51,52]. The model extends the TOPMODEL concept [53] by adopting the Muskingum-Cunge method for flow routing components on a grid basis, with sub-catchments serving as blocks [51]. This concept helps to address TOPMODEL’s limitation in flow timing and heterogeneity for modeling large river basins in warm humid regions [52,54]. For each grid, four vertical zones are considered: the vegetation zone, root zone, unsaturated zone and the saturated zone [51]. The model has been validated in several river basins with various scale resolutions using geographical data, remote sensing data, and global datasets on ungauged catchments, showing good performance [21,51,52,54]. For a more detailed description of the BTOPMC model and its underlying conceptualizations and parameters, the readers are referred to [51].
In this paper, the BTOPMC was applied to predict future streamflow under future land cover change and LAI change scenarios. The maximum water capacity of the root zone and LAI related to land cover changes were key parameters for evaluating land cover change effects on the streamflow. Following recommendations [55], three statistics were applied to assess the performance of the hydrological model:
(i)
Nash-Sutcliffe efficiency (NSE): NSE ranges between −∞ and 1.0 (1 inclusive), with NSE = 1 being the optimal value. Values between 0.0 and 1.0 are generally viewed as being at a satisfactory performance level:
NSE = 1 i = 1 n ( Qobs i Qsim i ) 2 i = 1 n ( Qobs i Qobs ¯ ) 2
(ii)
The ratio of the root mean squared error to the observations standard deviation (RSR): RSR varies from the optimal value of 0, which indicates perfect performance in the simulation, to a large positive value. A lower RSR represents better the model simulation performance:
RSR = RMSE STDEV obs = i = 1 n ( Qobs i Qsim i ) 2 i = 1 n ( Qobs i Qobs ¯ ) 2
(iii)
Percent bias (PBIAS): The PBIAS value should be close to zero. Positive values indicate the model contains underestimation bias and vice versa:
PBIAS = | Qsim ¯ Qobs ¯ | Qobs ¯ × 100 %
where Qsim is the simulated value, Qobs is the observed value, Qsim ¯ is the average simulated value, and Qobs ¯ is the average observed value.
An RSR less than 0.7 and a NSE greater than 0.5 suggest that there is good model performance for both streamflow and sediment load calculations [55]. However, values of PBIAS for streamflow and sediment load vary significantly. Moriasi [55] defined the PBIAS of less than 25% as being of satisfactory indication for the streamflow simulation, and PBIAS results of less than 55% were considered to be acceptable for the sediment load.

3.4. New Sediment Rating Curve (NSRC)

The calculation of sediment load (SL) requires both streamflow and sediment concentration data in river basins. Sediment concentration data are rare since data collection requires manual individual sampling taken at fixed temporal intervals. This type of data is still absent at most hydrological stations, especially in developing countries. Instead, physically-based models or sediment rating curves have been used to estimate the SSC. Physically-based models that are used to simulate the SSC tend to suffer from problems associated with the difficulty of a huge dataset and the identifiability of parameter values. Conversely, traditional sediment rating curves [56] generally represent a simple power functional relationship relating the SSC to streamflow; unfortunately they do not consider the temporal dynamic changes in vegetation cover. Vegetation cover, as discussed above, should have an important effect on soil erosion and sediment transport capacity by slowing the flow through friction losses [57]. Hence low intensity vegetation cover conditions should provide greater sediment flux for the same streamflow. The NSRC with vegetation dynamics information such as normalized difference vegetation index (NDVI) or LAI, could simulate SL well in Southeast Asia [23,58]. The SL was calculated by:
SL = Q × SSC
SSC = a(1 − MNDVI/LAIc)Qb
MNDVI = (NDVI − NDVImin)/(NDVImax − NDVImin)
MLAI = (LAI − LAImin)/(LAImax − LAImin)
in which a, b, and c are model parameters for a particular stream, Q (m3/s) is streamflow, SSC (g/m3) is suspended sediment concentration, MNDVI/LAI is standardized NDVI or LAI, and NDVImin/max and LAImin/max are the minimum and maximum NDVI or LAI values respectively.
To estimate sediment load from the streamflow and land cover change, the NSRC was developed based on the time series of MLAI and the streamflows from 1991 to 2000. To provide a comprehensive assessment of this sediment model performance and to indicate the accuracy of the calculated curve, the same statistics and evaluation rules as in the BTOPMC model were used. Based on the well-fitted NRSC, the impact of future land cover change on sediment load was evaluated.

4. Results

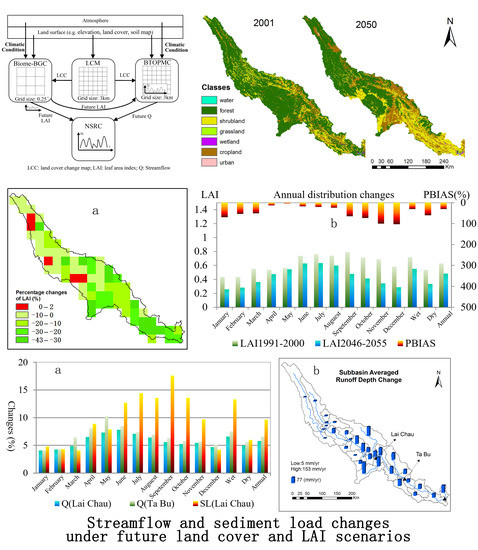
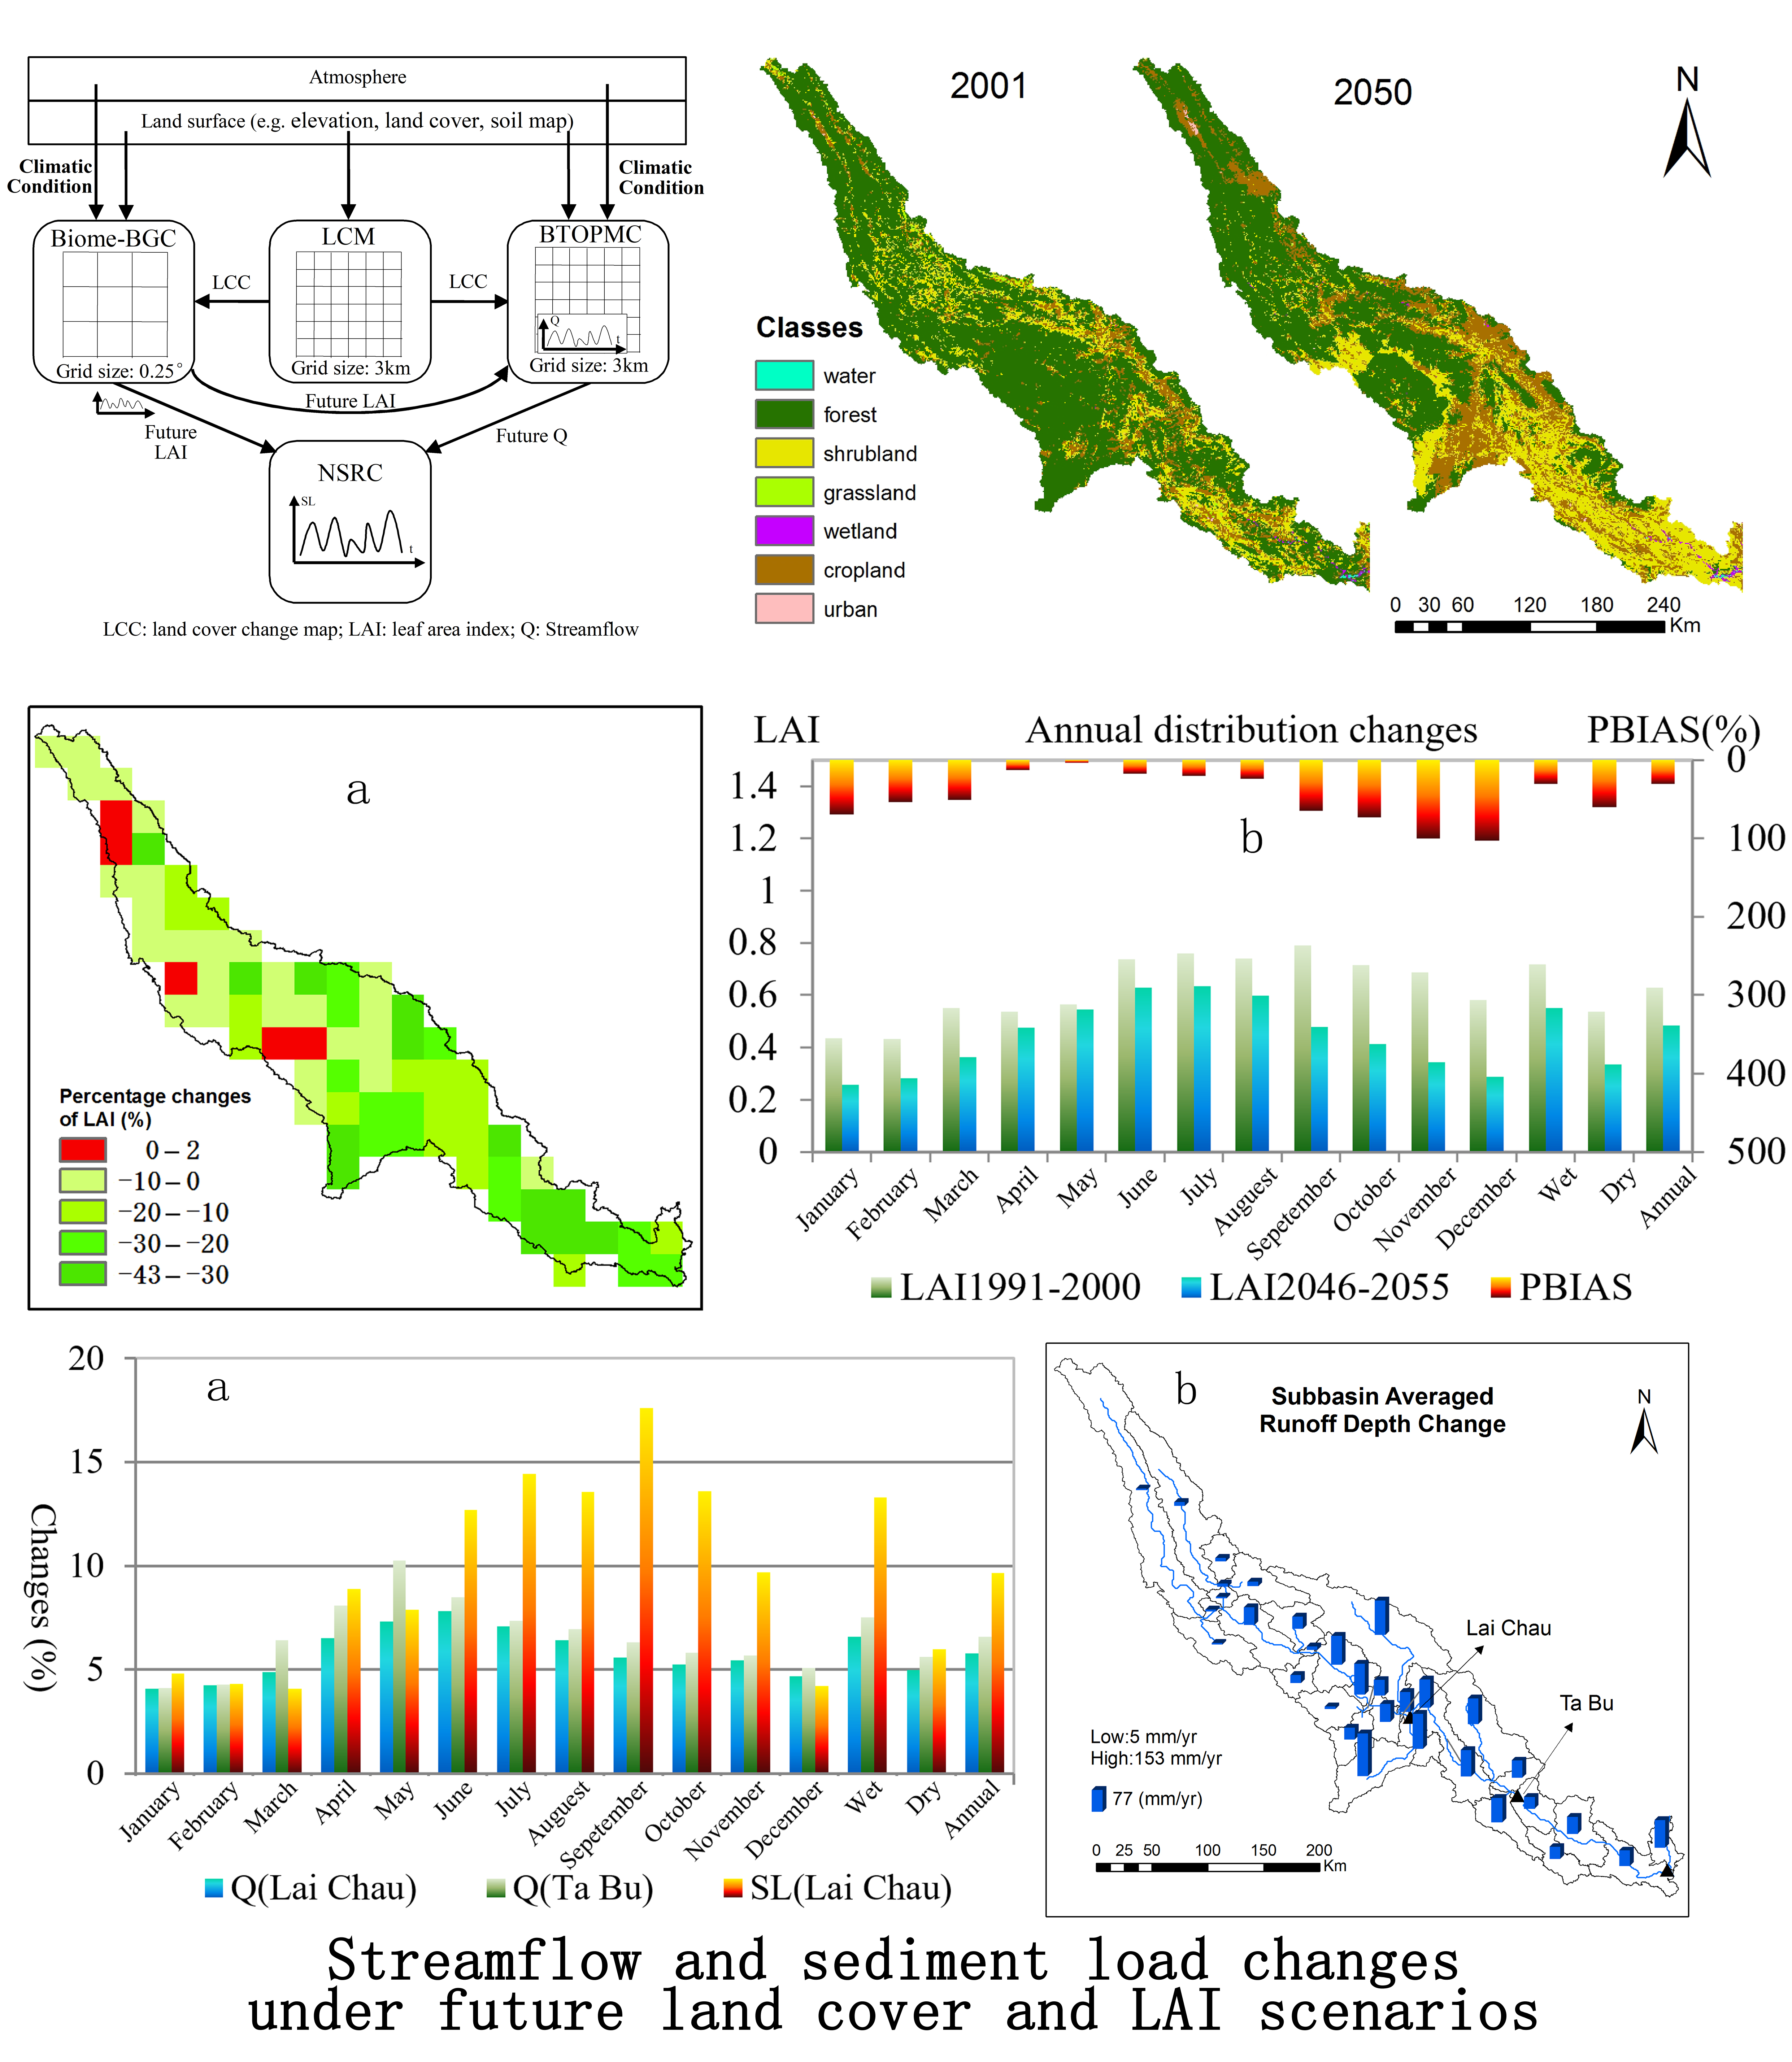
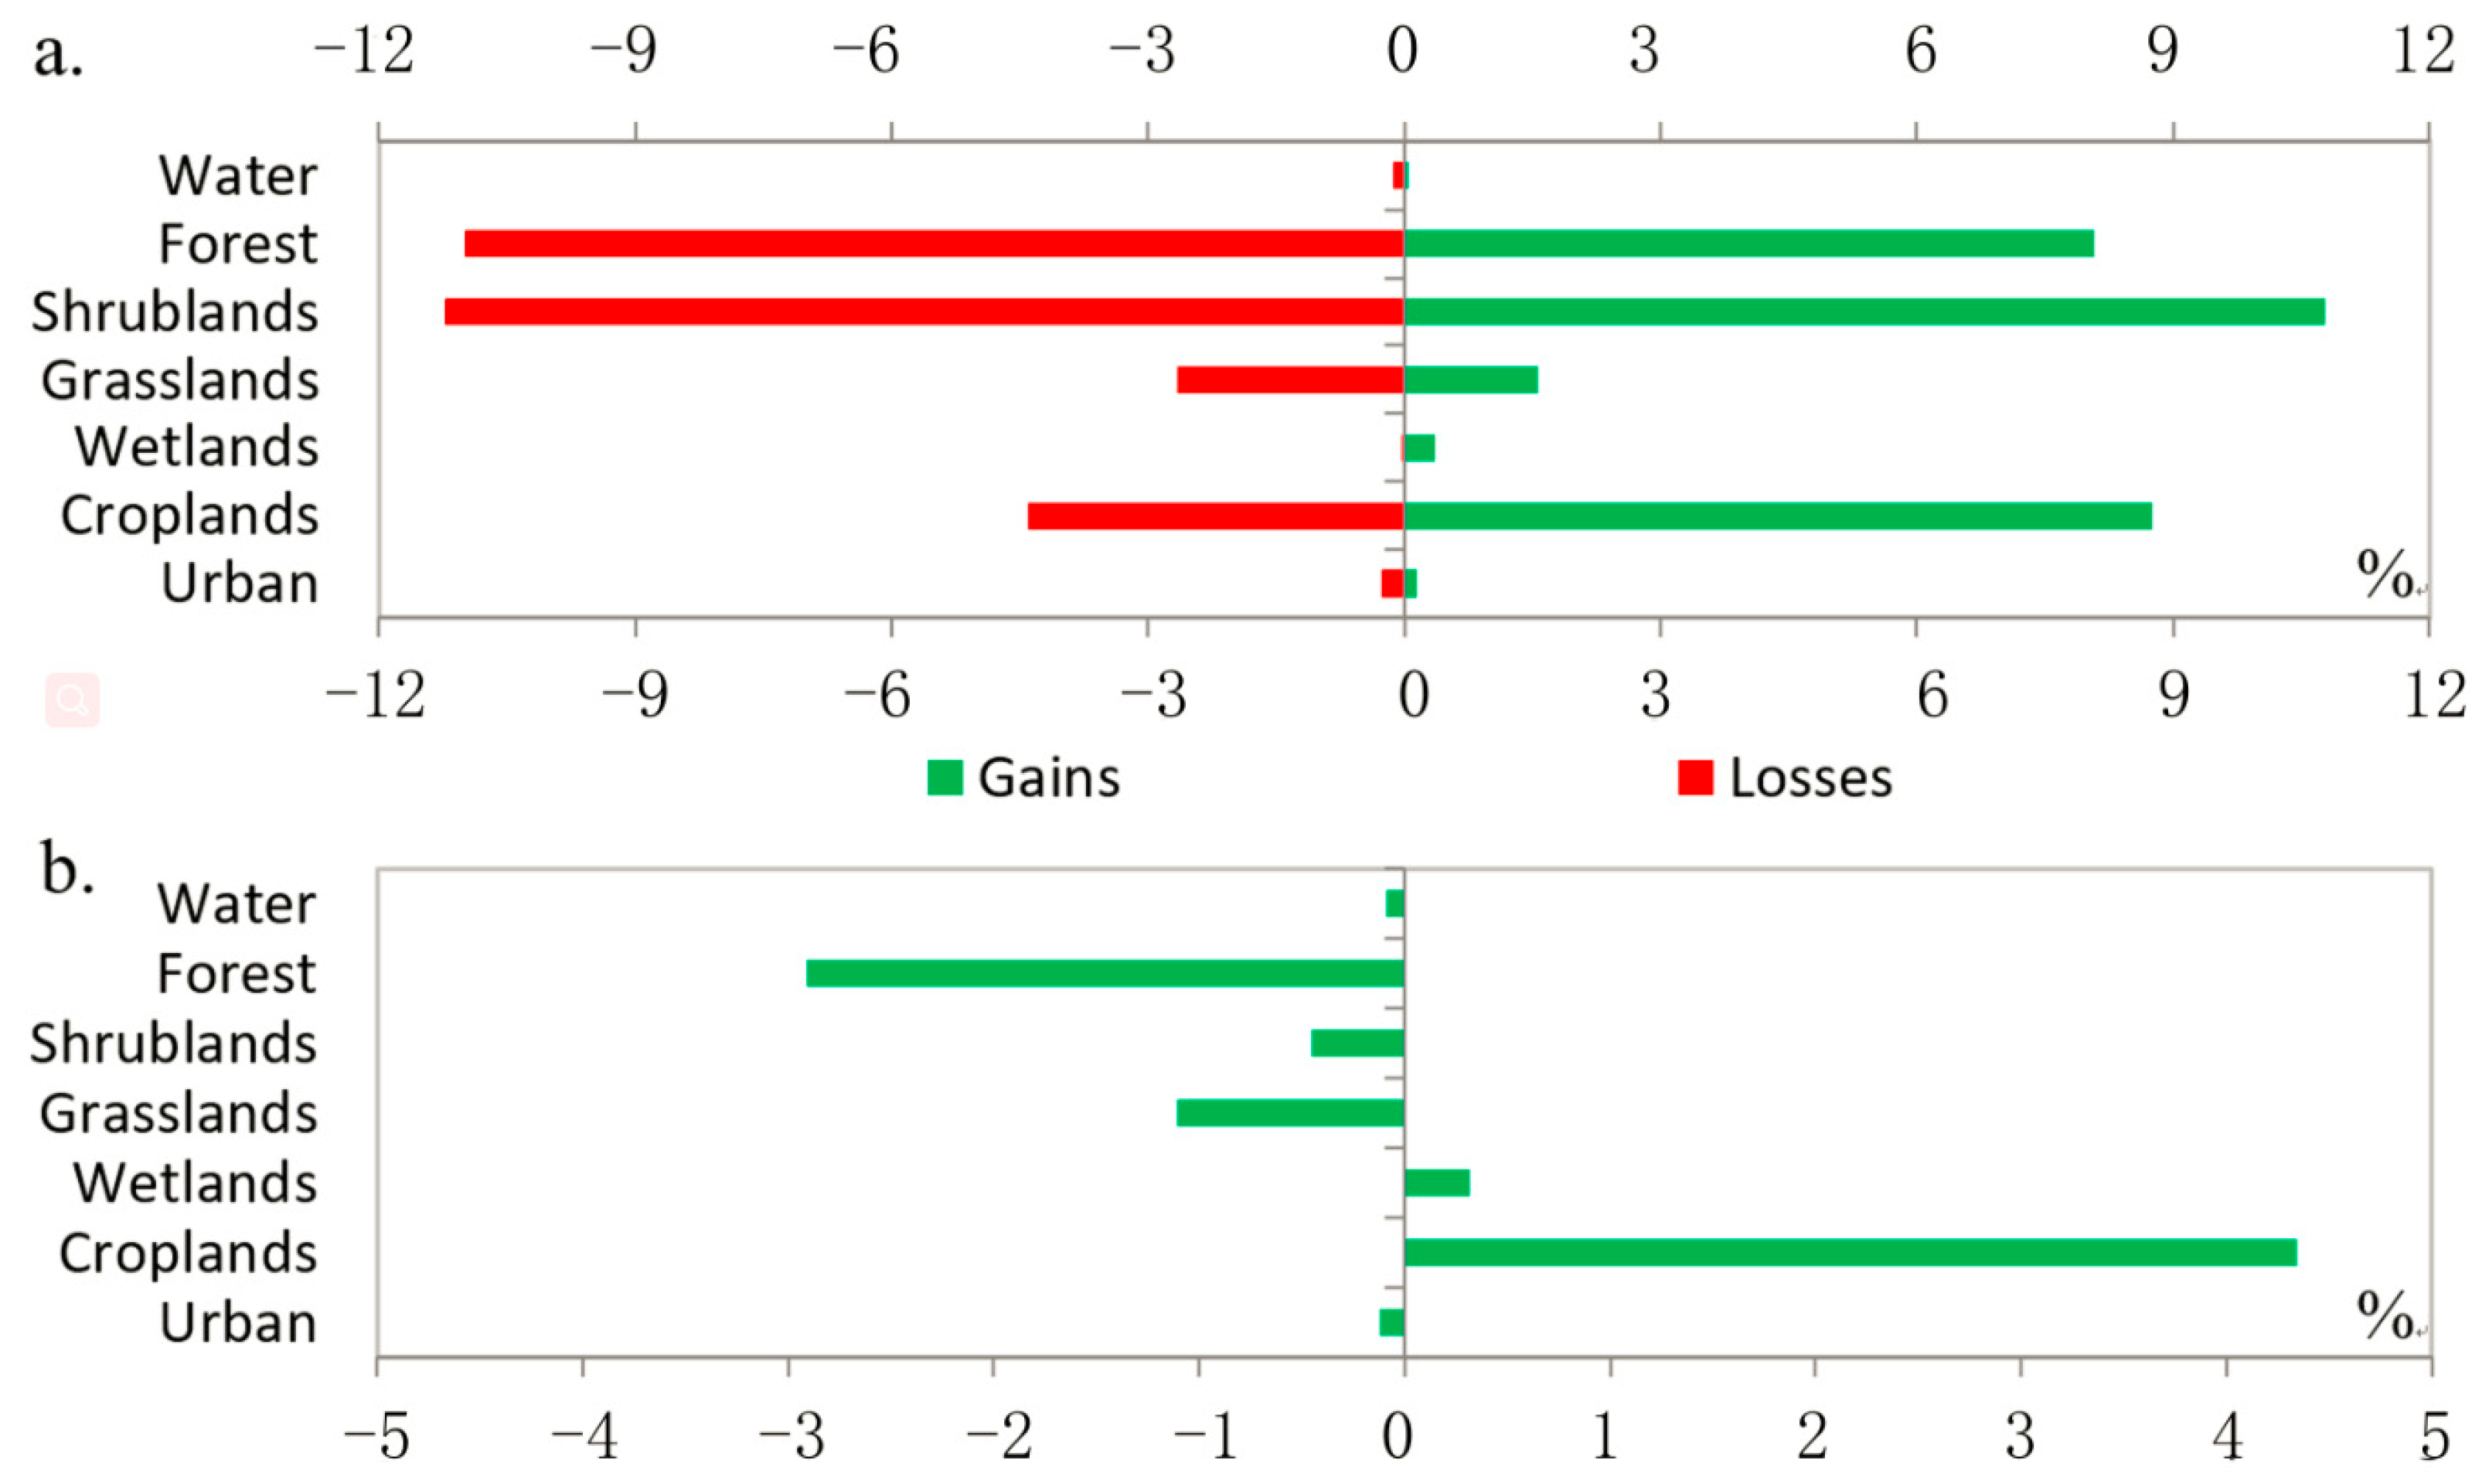
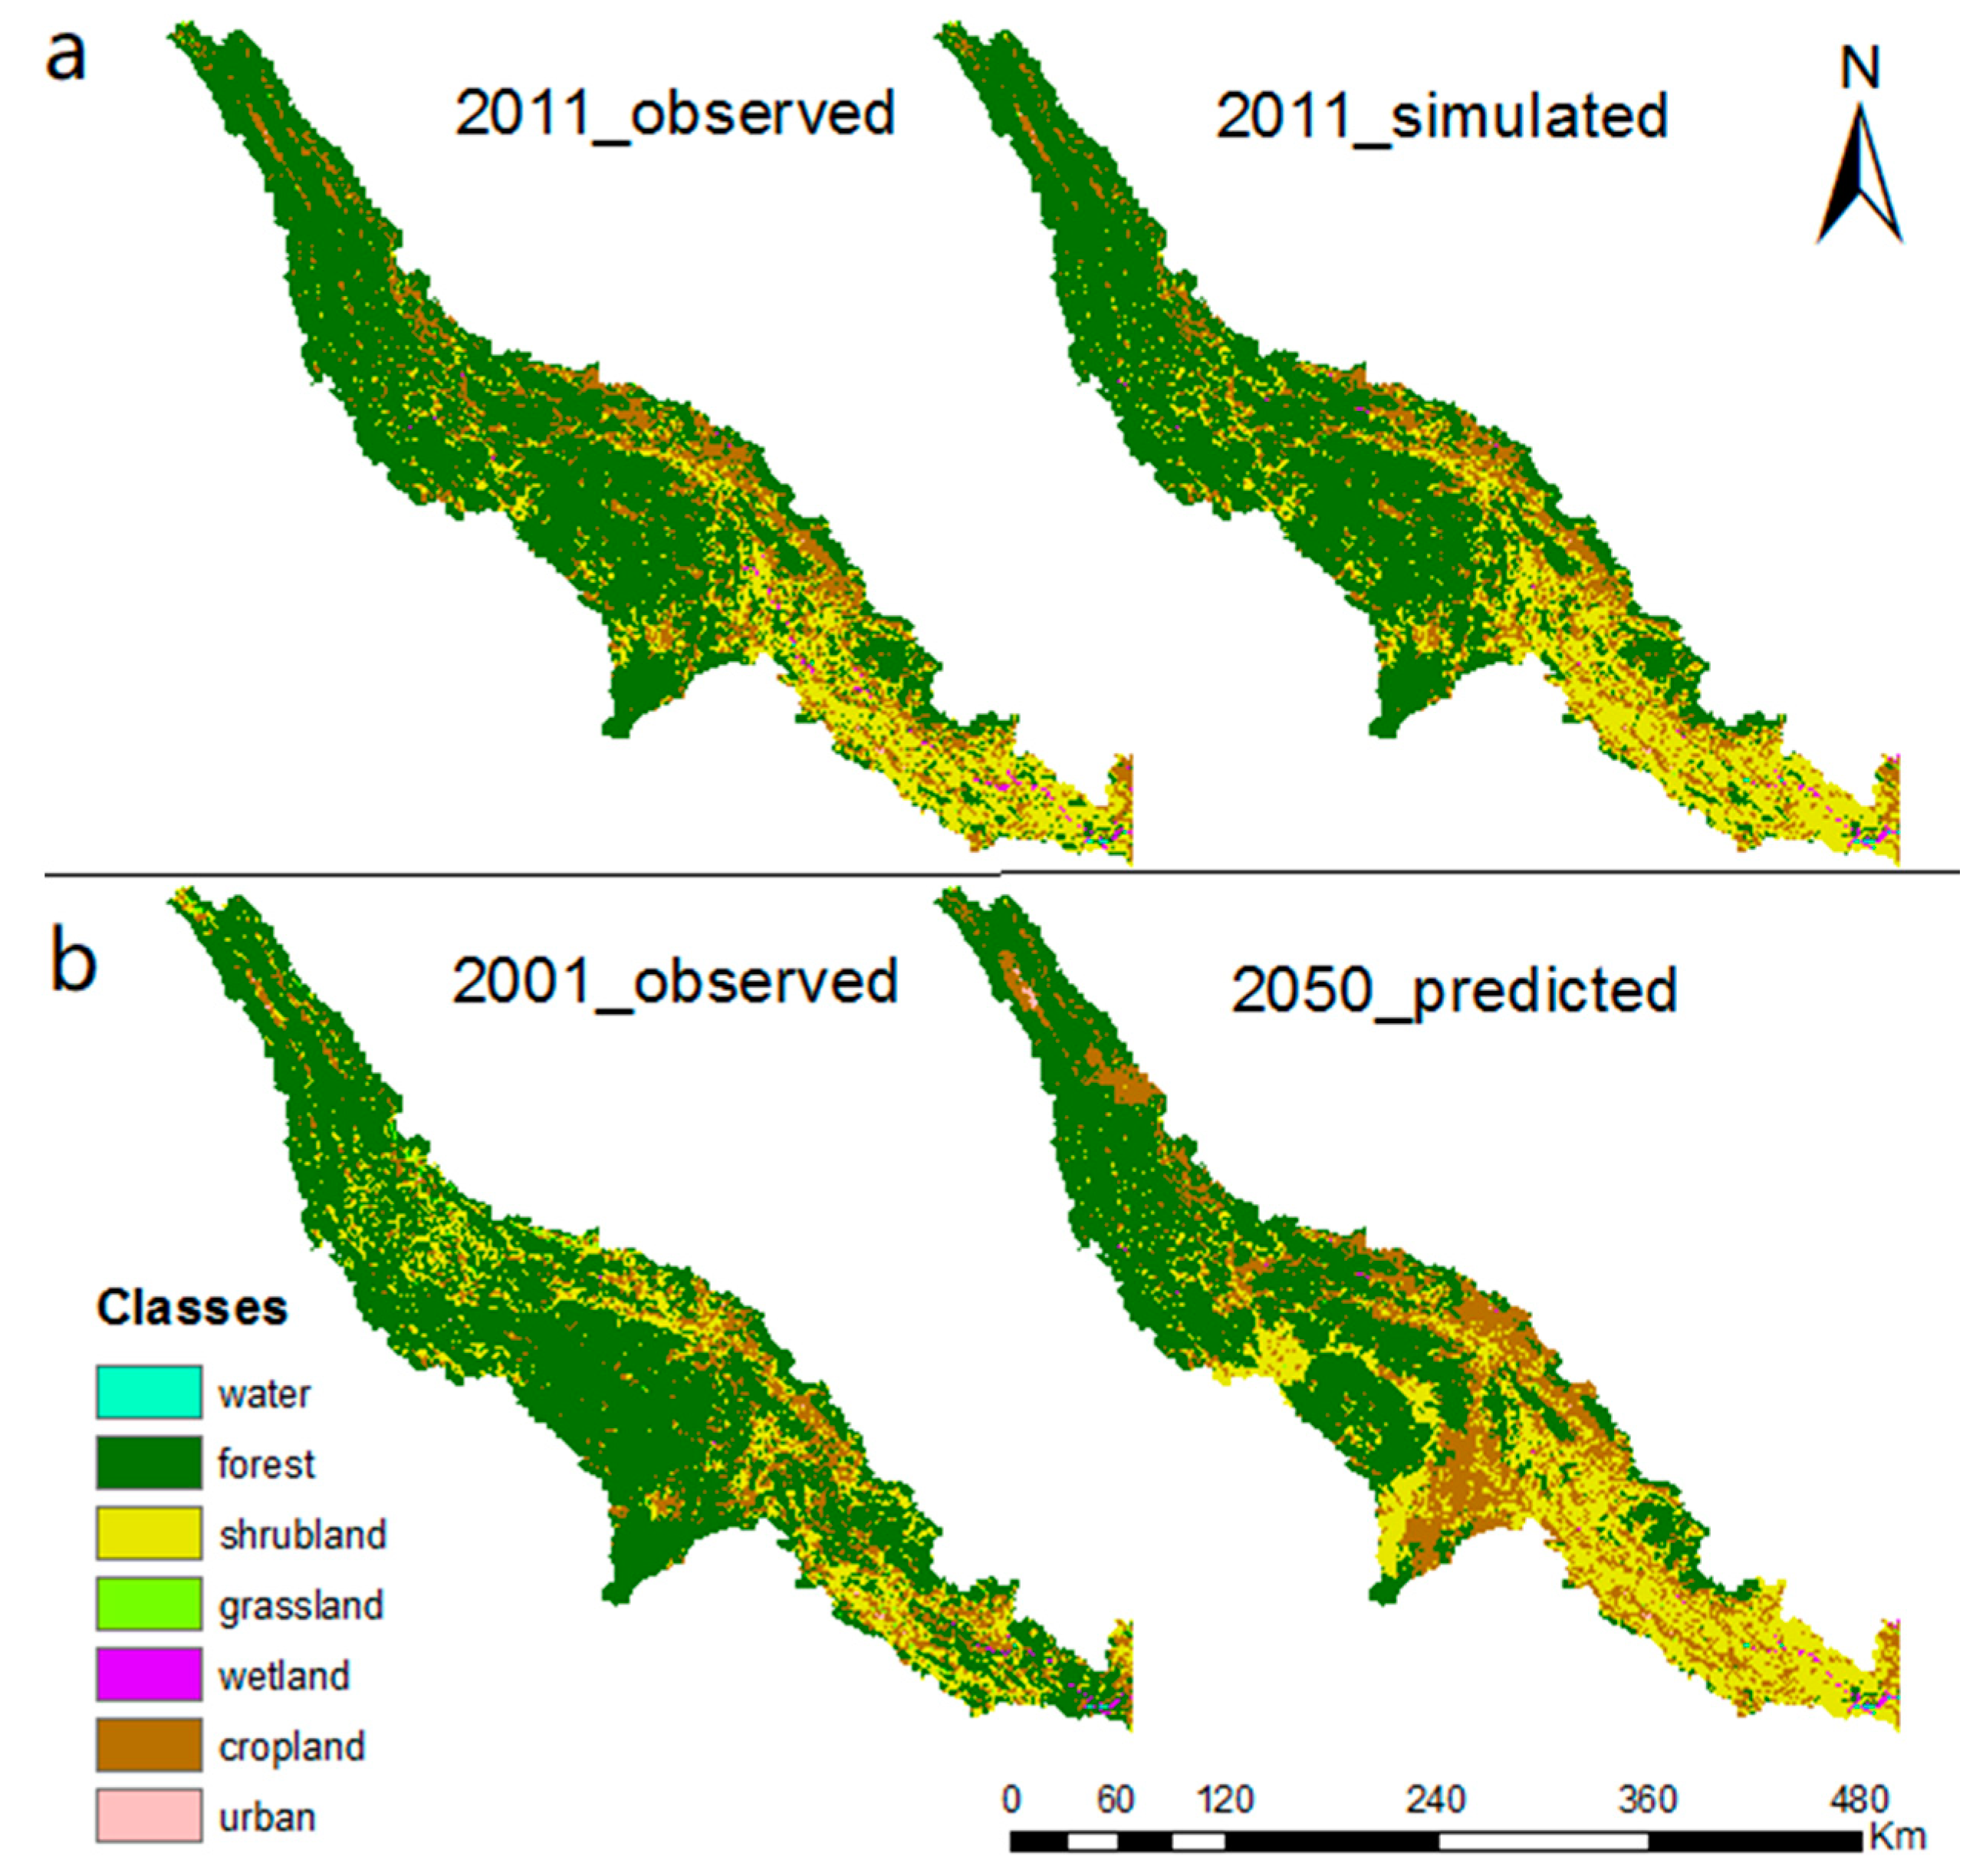
4.1. Future Land Cover Change Prediction

In order to predict future land cover, historical remote sensing maps of 2001 and 2008 for land cover change were investigated. Figure 3a presented gains and losses of the land cover between 2001 and 2008, showing that croplands, forest, shrublands, and grasslands had changed more than others. The net land cover change (Figure 3b) indicated that gains of croplands (+4.3%) mainly transferred from forest (−2.9%) and grassland (−1.1%) losses, other types of land cover showed less noticeable changes.
Results presented in Figure 4a showed consistency in spatial simulations and greater similarity in the water, forest, croplands, and urban areas; though areas covered by shrublands had been overestimated (14.8%) to a certain extent over the area of the grassland (−15%) (Table 2). Comparison of the observed and simulated value showed an acceptable level of likelihood and a very high kappa index of 0.94, which guaranteed good adjustment of the simulated map to the reference map. All these facts assured that the LCM may provide highly agreeable results for creating the future map of land cover in the DRB.
Finally, the land cover map for 2050 was generated by the LCM (Figure 4b). Land cover changes from 2001 to 2050 were found mainly in the downstream areas, with an obvious decrease in forest and an increase in the shrublands and cropland (Table 3). Results showed an increase in croplands to over 11.7% of the total area, as well as an increase in shrublands to almost 10%, replacing forest areas, which decreased to about 21% of the total area.

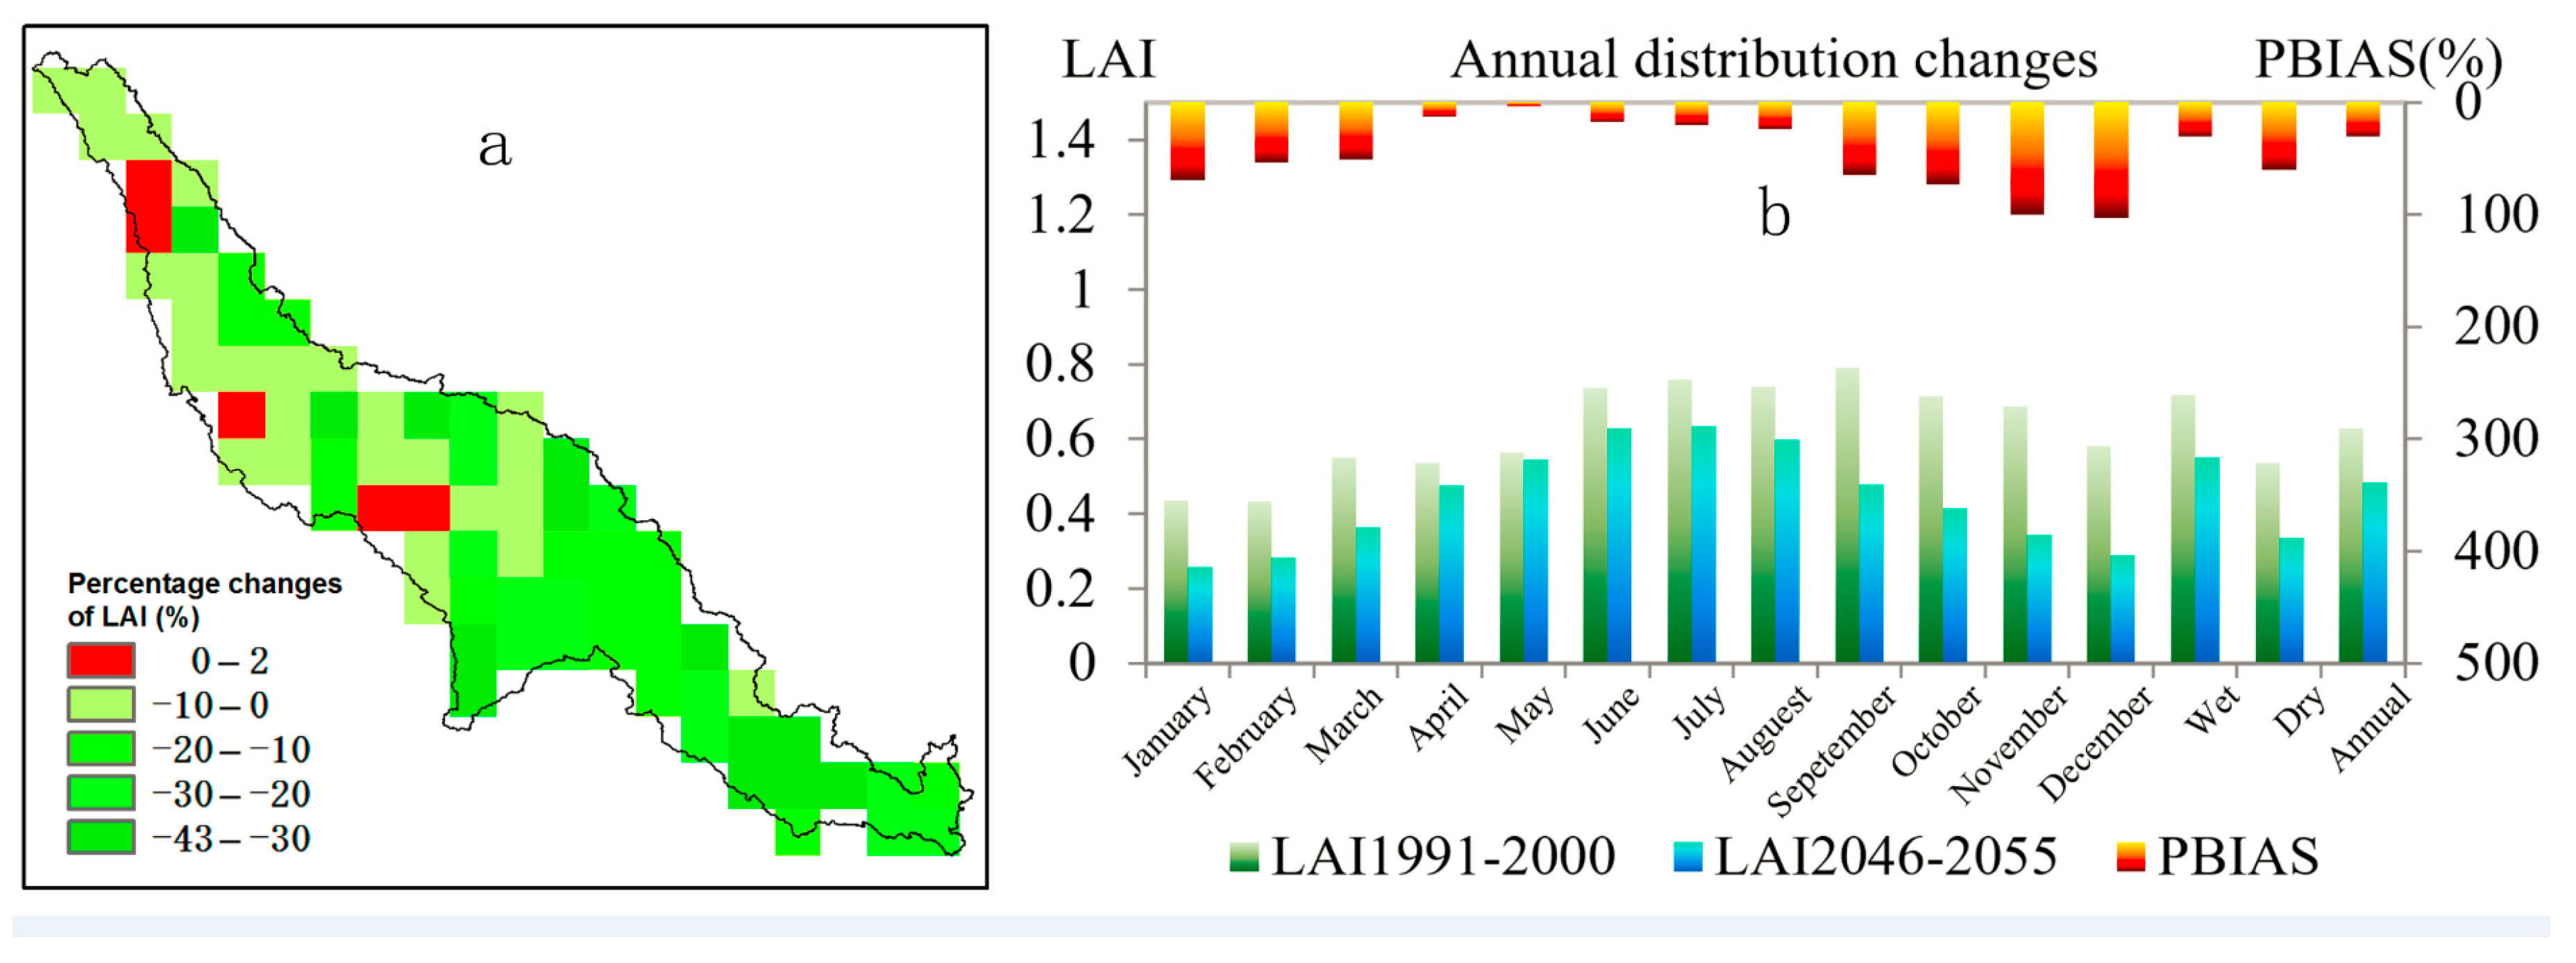
4.2. Future LAI Predictions

The Biome-BGC ecological model was driven by the current climate data from 1991 to 2000, and future land cover change scenarios, to calculate the future leaf area index for the decade of 2046 to 2055. The model extended the future land cover change from point-in-time to the temporal dynamic scale, as a result, the predicted future LAI stood for future vegetation cover without impacts of future climate change. Deforestation was the main factor in decrease in LAI. Annual maximum LAI decrease was estimated for the most grids in the DRB, especially in the middle and lower reaches with the highest percentage change of −43% (Figure 5). The dominant land cover change was a transfer from forest cover to croplands or shrublands, which would cause lower vegetation productivity. Seasonal vegetation cover (LAI) changes in this case would decrease by around 30% on average during the wet season (Figure 5), while the most drastic change, with a decrease of up to more than 60%, would happen during dry season as it was the best season for felling operations.

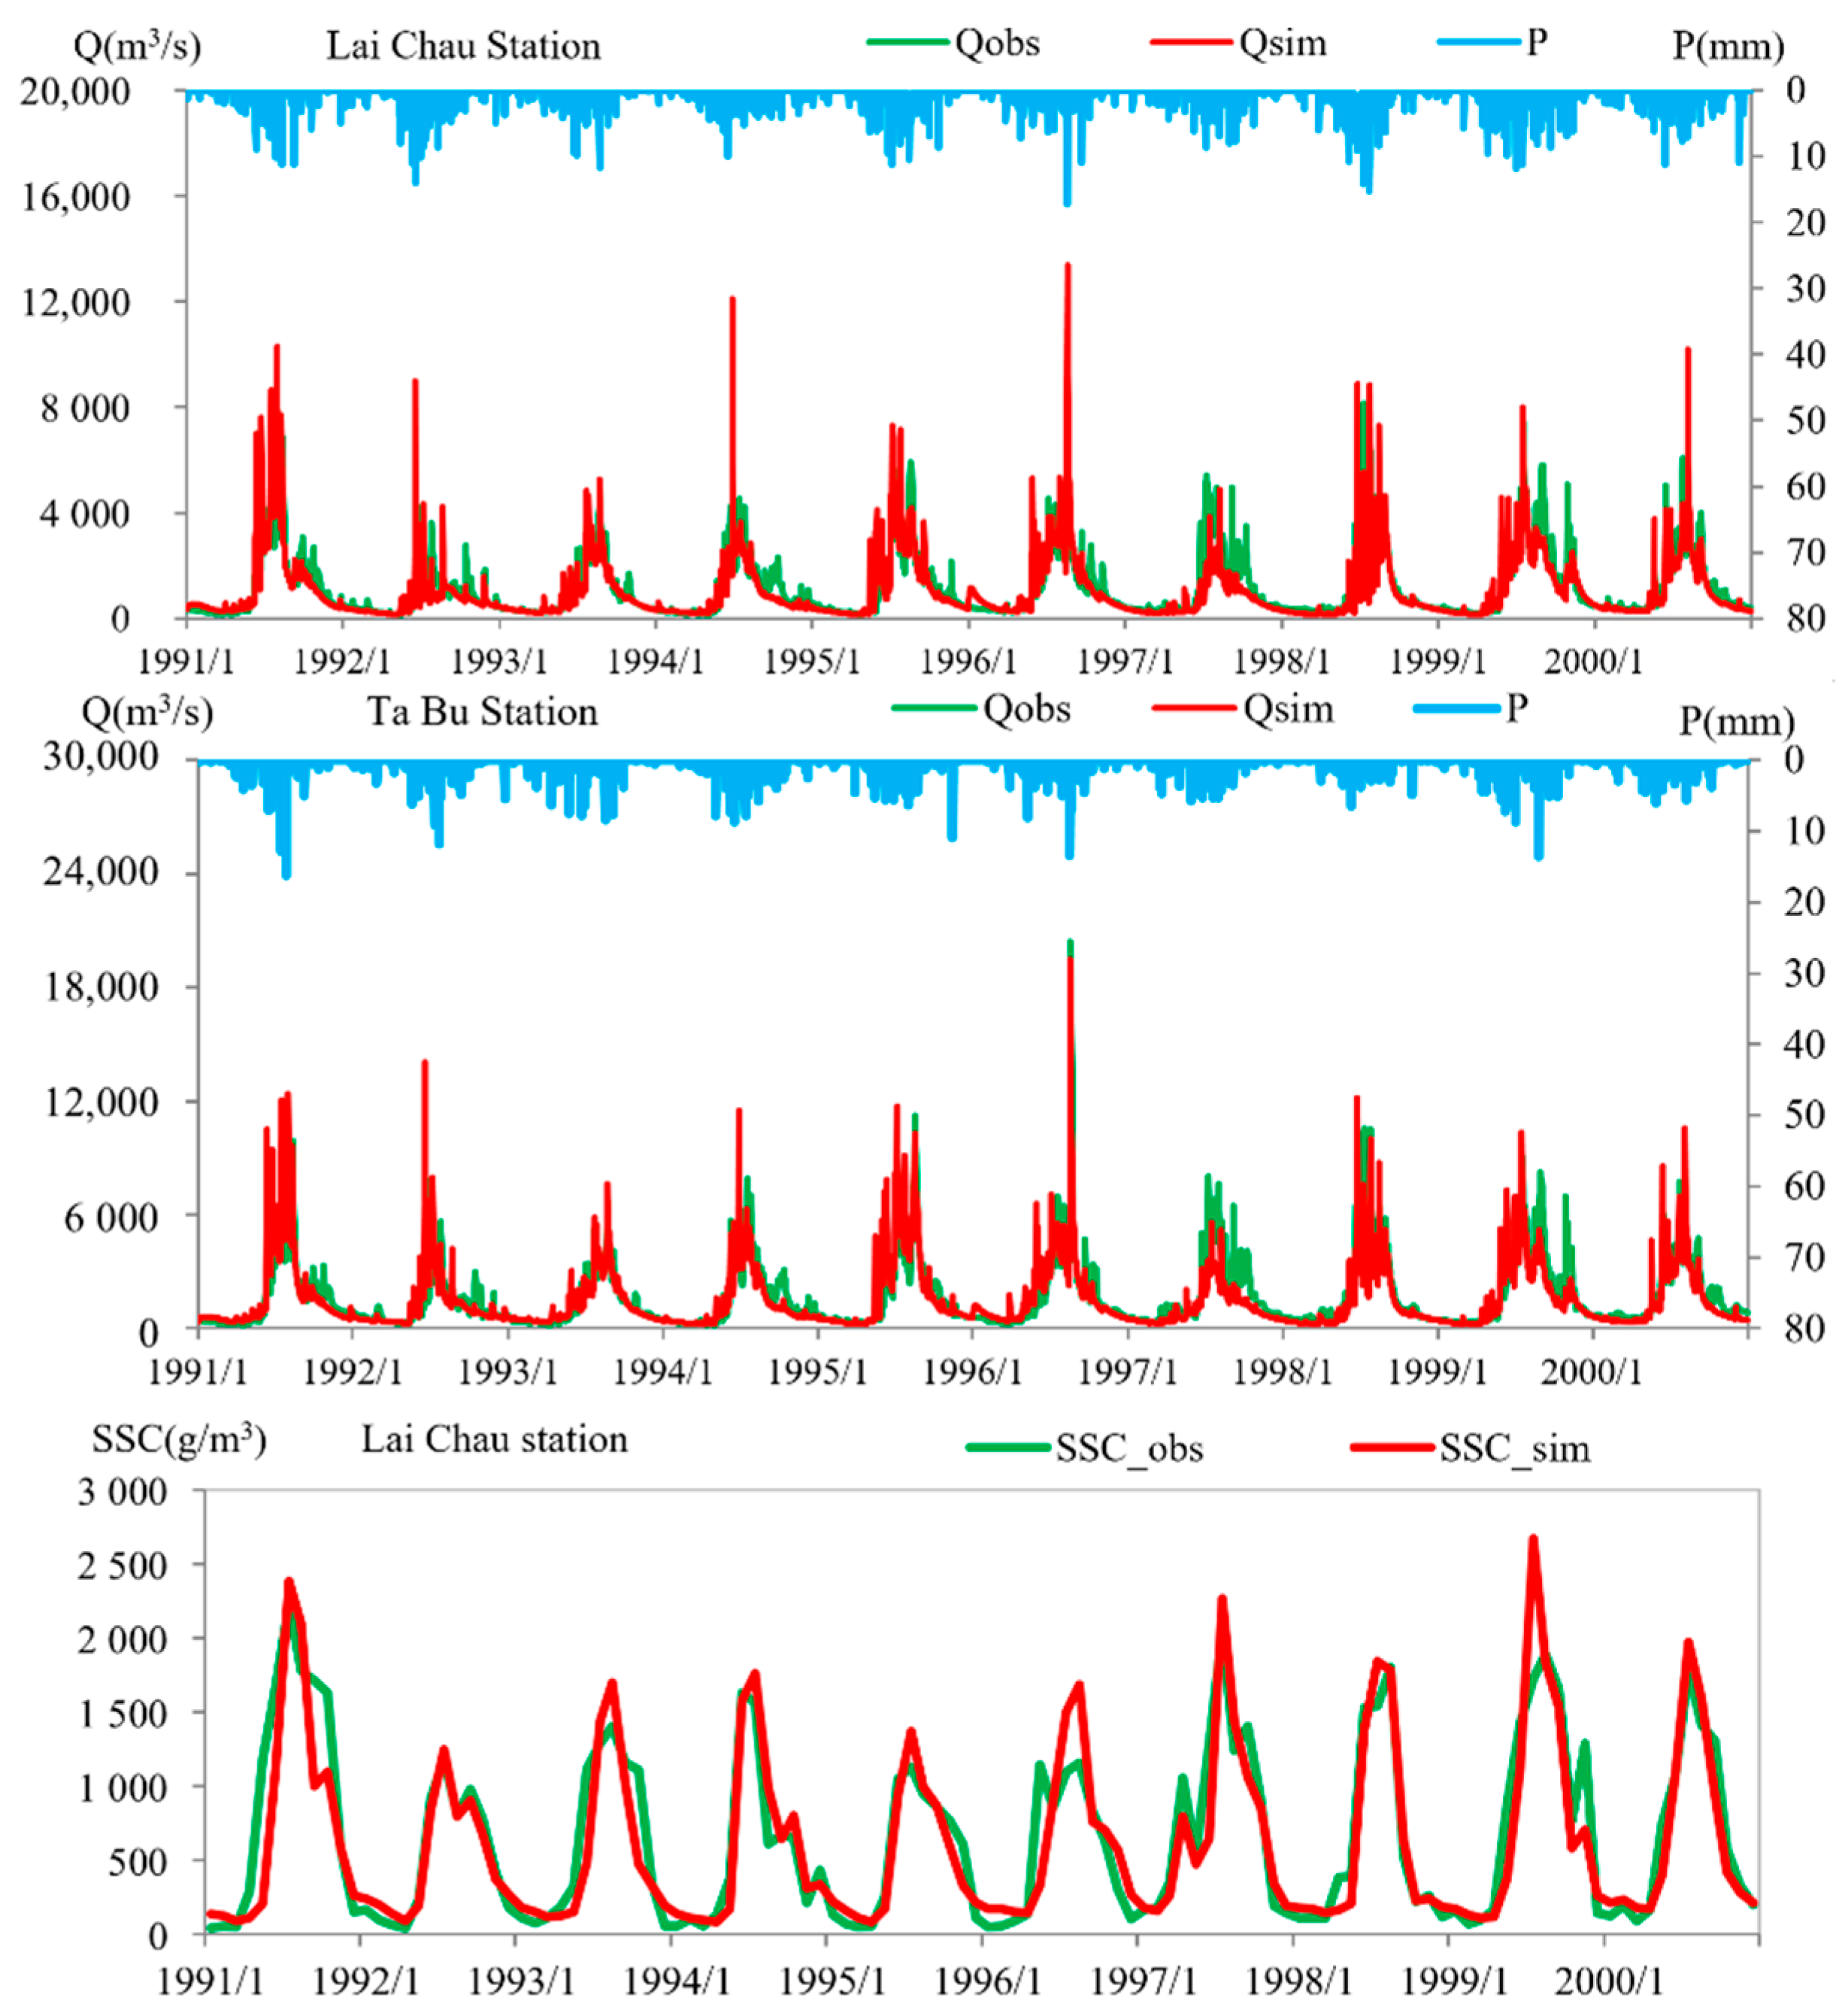
4.3. Hydrological Model and NSRC Model Simulation

In this study, the daily streamflow data for 1991–1995 were used for model calibration, and the data for 1996–2000 were used for validation of the BTOPMC hydrological model. The statistics for the evaluation of the BTOPMC model gave consistent results and good accuracy according to the established criteria (Table 4). Direct comparison of the simulated and observed daily streamflow in the baseline period showed a reasonable match within the established criteria at the Lai Chau and Ta Bu stations (Figure 6).
The NSRC model was also calculated for the period from 1991 to 2000, as by the following equation:
SSC = 0.41(1 − MLAI6.5)Q1.05
Our results showed a well-noted correlation between the simulated and observed monthly SSCs (Figure 6). For the low and medium values, the model showed very good results; the peak values for year of 1996 and 1999 were overestimated, but overall performance was considered to be good (Figure 6 and Table 4). In addition, the same three statistic criteria used to evaluate the new sediment rating curve were in good agreement with the established validation technique. The high NSE (0.85), low RSR, and PBIAS (Table 4) suggested that the NSRC could evaluate the SSC accurately at the Lai Chau station, and it could be used to evaluate future land cover change effects on the sediment load.

4.4. Future Land Cover Change Impacts on Streamflow and Sediment Load

Streamflow under potential land cover change increased in both the wet season and the dry season with different magnitudes. Annual streamflow in the Lai Chau catchment and the Ta Bu catchment increased by 5.8% and 6.6% respectively. The future monthly streamflow changes (Figure 7a) varied from 4.0% to 10.3%, the highest being in May (wet season). Spatial distribution of the average annual runoff depth change at the sub-basin scale was also analyzed to explore the impacts of spatial variations due to land cover change. As shown in Figure 7b, the annual runoff depth was expected to increase by 5–150 mm/year due to the different percentages of the changed land covers. Most of the sub-basins in the middle and the southeast parts of the watershed showed higher increases in runoff depth, caused by strong land cover changes from forest to croplands or shrublands (Figure 4b and Figure 5a). Moreover, land cover change impacts on individual water balance components, as given in Table 5, indicated an increase in surface runoff and total runoff, but a decrease in actual evapotranspiration and ground water in both upstream catchments (LC) and downstream catchments (TB) in the future. A reduction in the forest cover could decline the infiltration rate and lower the evapotranspiration rate, and so the potential forest cover changes mentioned above were considered as the main reason for water balance changes. Among all four water balance components, the surface runoff showed a maximum increase of more than 10%, which was the main contribution to total runoff growth. Compared with year of 2001, the future evapotranspiration in 2050 also exhibited a distinct decrease, ranging from −5.0% to −8.0% over different seasons and catchments. The projected evapotranspiration in the wet season decreased more than in the dry season in the LC and TB catchments. Spatially, all four water balance components showed higher changes in the downstream area, which agreed with the serious potential for future deforestation in this area.
Sediment load would increase significantly in the wet season and only slightly in the dry season, by 13.3% and 6.0%, respectively. The total annual sediment load rate was expected to increase to 9.7% at the Lai Chau station (Figure 7a). The future sediment load change varied from 4.0% to 14.5% over different months, with very high percentage changes from June to October. High growth rates of the sediment load compared with streamflow changes clearly indicated that the sediment load was more easily altered by the means of the land cover pattern changes. Overall, both streamflow and sediment load showed a tendency to increase as an outcome of the land cover change impacts in future.

4.5. Discussion

4.5.1. Combination of Future Land Cover and LAI Changes

In this study, the effects of future land cover changes and corresponding LAI changes were investigated. A future land cover change scenario for 2050 was predicted by the LCM, based on the historical trend of land cover changes from 2001 to 2008. Main variables [1,30,31,59] for land cover predictions were included in the model, such as basin slopes, distance to the river network, distance to urban areas, distance to protected area, human footprint, population density, rainfall trends, etc. The model was able to produce convincing maps of future land cover in the river basin as supported by established criteria (Table 2).
Although a series of driving factors reflecting current human activities were used to predict potential land cover change, future changes in government policy [33] (construction of new dam, afforestation efforts, and others) were hard to predict. It is also impossible to consider future climate change impacts and responses to these impacts on the policy level. These limitations are quite important and should have major impacts on the river stream operation, but they are more uncertain than factors such as relatively moderate population growth, urbanization, and population density, which were also used as input data for the study. There were some areas on the simulated map that were overestimated or underestimated; these errors were hard to neglect. For example, areas covered by shrublands were overestimated (14.8%) to a certain extent, and grasslands were underestimated (−15%) (Table 2); predictions over a large basin with coarse resolution can produce such outcomes due to the low resolution, the lack of government policy, and other factors. The most important factor that was also captured well in the scenario was the change from natural forest cover to human-induced forest in the DRB. This impact was observed as deforestation near the urban areas. In this study, the trend in the reduction of forest cover over the basin was predicted well and it was supported by comparative analysis. Deforestation occurred easily in areas with high population densities and a strong human footprint [13]. In our prediction, analysis of the satellite maps showed quite clearly that a great portion of forest cover was converted to shrublands and croplands in the downstream area of the DRB as a response to its rapid development and population growth, while almost no changes occurred in the middle-west portion of the basin, due to the presence of national nature reserves. Simulated maps and real data from the MODIS satellite in 2011 matched quite well and were accepted by established criteria. Results showed that the forest area in 2050 would decrease by 21% compared to the forest cover of 2001 (Figure 3); meanwhile, shrublands and cropland areas were expected to increase by 10% and 12% respectively. To improve the evaluation of the future land cover change impacts, historical land cover change maps and LAI changes were crucial [13,32,33].
Land cover changes produce further changes in vegetation coverage [21], and many reports have pointed that evaluation of the land cover changes on the hydrology of the basin should also include the impact of the vegetation cover dynamics [5,21,34]. In this study, LAI was considered to be a suitable parameter to reflect vegetation cover dynamics [5,21]. The results of the ecological model have been validated previously and they showed a good match with satellite observed data [21]. The outcome had also pointed towards deforestation as a main cause of the LAI decreasing trends. Such correlations were observed in the downstream area of the DRB, which was severely affected by deforestation, where the LAI values also declined significantly. Areas with unchanged land cover have shown positive vegetation dynamics trends. For example, the land cover in the western area of the DRB remained mostly intact, and LAI values showed an increased trend in response to the increasing rainfall that promoted vegetation growth [34]. The accuracy of the land cover map and LAI predictions was important for further evaluating the impacts of land cover changes on streamflow and sediment load [1,13,33].

4.5.2. Impacts of Forest Cover Changes on Streamflow

Impacts of deforestation on streamflow were analyzed by the BTOPMC hydrological model simulation. Our results have shown that both land cover and LAI have contributed to changes in streamflow.
There have been many arguments over the impacts of forest cover on streamflow in the large basins/regions. Though most researchers have agreed that forest degradation increases the streamflow or water yield [5,60,61,62], some have argued that the same forest cover changes had weak effects on streamflow in large basins due to their high water retention capacity [16]. Liu et al. [5] concluded that afforestation could reduce streamflow, while deforestation could increase streamflow at both grid and river basin scales in China. Moreover, Wang et al. [15] on the other hand indicated that forest cover had positive impacts on runoff generation in northeast China. Our results agreed with the mainstream view [60,61,62]; deforestation (21.3%) was the main reason for an increase in annual streamflow (6.7%) and surface runoff (15.8%), along with the decrease in ET (7%) and ground water (6%) through the whole basin. The consistency of spatial variation among runoff depth (Figure 7b), land cover changes (Figure 4b), and LAI changes (Figure 5) supported the same opinion as the majority of other studies [5,61].
LAI values mainly affect the ET [2,5,51,52] and the canopy interception [51,52]; the maximum storage capacity of the root zone (Srmax) is also important as it reflects the available water in the root zone, which is used for evapotranspiration and infiltration to the ground water [2,48,63]. In our hydrological simulation, deforestation decreased LAI values, and this would consequentially produce less ET [5] and canopy interception [51] on different scales. Meanwhile, Srmax was reduced from 0.05 m (forest) to 0.3 m (shrublands) or 0.2 m (croplands) respectively, which would further decrease ET and groundwater values. All of these behaviors were caused by deforestation, affected the water balance of the river basin, and increased streamflow in the river basin.
Additionally, many researchers [7,64] have revealed that land cover changes have significant influences on flood discharge. An increase in the streamflow due to forest degradation would be highly likely to increase flood risk in the Red River [64]; however, a shortage of hourly flood event data limited detailed analysis into the flood risk in this study.

4.5.3. Impacts of Increased Sediment Load on Reservoir Lifetime

Deforestation is known for increasing soil erosion and suspended sediment transportation in rivers of southeast Asian countries [21,23,24,65]. A decrease in LAI and an increase in streamflow due to deforestation would further increase sediment loads [21,25]. This study indicated that the predicted annual sediment load was expected to increase by 9.7% by the 2050s at the Lai Chau station of the DRB. It is also well known that large reservoirs trap suspended sediment from upstream areas, and so increasing sediment load would aggravate reservoir siltation and shorten the life span of the reservoir. The HoaBinh Reservoir has decreased its total suspended load to almost 70% [23]. Wang et al. [21] concluded that land cover change was the main factor for the sedimentation load in the reservoir inflow. This effect has caused a reevaluation of the HoaBinh Dam’s operation, reducing its lifetime from more than 100 years to about 50 years [26]. Many observers have feared that the newly constructed the Son La Dam could suffer the same situation.
The Son La Reservoir’s sediment trapping efficiency (TE), used to estimate the siltation of the dam, can be evaluated by the hydraulic retention time (HRT) [66,67]. The HRT allows the calculation of the average length period of sediment compounds remaining in the reservoir; it is calculated as a volume of the effective storage divided by the average streamflow into the reservoir. The TE is the percentage of the sediment compounds retained by reservoir, calculated as follows [66]:
TE = 1 0.05 HRT
where HRT is water residence time (year) and TE is the trapping efficiency (%). The Son La Reservoir effective storage is equal to 16.2 km3; the calculated HRT is averaged to about 103 days, that is, 28.3% of a year. Thus, the annual average TE of the Son La Reservoir was estimated to be equal to 90.6%. SSC at the Lai Chau station was used to calculate sediment load into the Son La Reservoir, as SSC was not available at the Son La Dam. The mean annual sediment settlement of the Son La Dam was evaluated to be equal to 17 Mt/year without land cover changes, and 19 Mt/year with land cover changes. The increase in sediment load by about 10% as a result of land cover change would reduce the useful lifetime of the Son La Reservoir ahead of the designed time. The subsequent vital problems of possible sedimentation in reservoirs are declines in dam lifetime, increases in flood risk, and reduction in hydropower generation.

4.5.4. Uncertainties Analysis

Impacts of land cover change and vegetation dynamics were considered at the same time. However, as only aggregated results were generated and there were no mechanism-based combinations, the prediction models were also full of uncertainties. Although a series of driving factors reflecting both human activities and climate were used to drive the land cover change model to predict potential changes, changes in government policy were hard to oversee and predict. Overall uncertainties may come from potential errors in input datasets and model parameters, and simplification of ecological or hydrological process [59,60]. In addition, the future increase in CO2 concentration was not used to simulate future dynamics of LAI changes, and this should be addressed in the future [5]. All of the uncertainties above would bring prediction errors in land cover change and this may cause a deceptive evaluation of impacts. Therefore, in-depth surveys of government policy and physical-based ecohydrological processes should be investigated, in order to reduce uncertainties in future research.

5. Conclusions

In this study, modeling hydrological appraisal of future potential land cover change and vegetation dynamics under environmental changes was carried out. This study indicated that deforestation pressure in the study basin would continue to rise by 2050. The forest area was expected to decrease to about 22% of the total area by 2050, with a lower LAI during the dry season. The streamflow and sediment yield in the DRB would generally increase in the 2050s in both the wet season and dry season, due to deforestation. Streamflow changes in the wet season showed higher rates than that in the dry season, and this poses flood risks in the future. The increase of the sediment load to 2 million tons per year and the high sediment trapping efficiency of the Son La Reservoir would likely shorten the designed reservoir operation time. It is important to analyze the impacts of the land cover change on all characteristics of the river, including impacts on sediment load and streamflow change, for a better understanding of this phenomenon. This information could be helpful for policy makers and water resource managers with regards to dam operation and vegetation cover protection, in a rapidly changing environment.

Author Contributions

This manuscript was primarily designed and written by J.W.; S.N. contributed to its model simulation and calculation; T.K. contributed to the results analysis and polished the English writing of this draft.

Funding

This research was supported by the National Natural Science Foundation of China (Grant No. 41501029, No. 41671022, No. 51709071, No. 51709148), the Huaihe Meteorology Research Open Foundation (HRM201703), and the Startup Foundation for Introducing Talent of NUIST (Jie Wang).

Acknowledgments

The authors are also thankful to the Vietnam Academy of Science and Technology and the China Meteorological Data Sharing Service Center for providing the hydro-meteorological data. We would like to express our thanks to Hiroshi Ishidaira for his guidance in the writing process of this paper. We also express our thanks to the academic editor and the reviewers for their useful comments.

Conflicts of Interest

The authors declare no conflict of interest.

Abbreviations

The following abbreviations are used in this manuscript:
DRBDa River Basin
LCMLand Change Model
Biome-BGCBiome-BioGeochemical Cycle Model
BTOPMCBlock wise use of TOPMODEL with Muskingum–Cunge routing model
NSRCNew Sediment Rating Curve
SSCSuspended Sediment Concentration
SLSediment Load
LAILeaf Area Index
LCLai Chau
TBTa Bu

References

  1. Gashaw, T.; Tulu, T.; Argaw, M.; Worqlul, A.W. Modeling the hydrological impacts of land use/land cover changes in the Andassa watershed, Blue Nile Basin, Ethiopia. Sci. Total Environ. 2018, 619–620, 1394–1408. [Google Scholar] [CrossRef] [PubMed]
  2. Zhang, L.; Hickel, K.; Shao, Q.X. Predicting afforestation impacts on monthly streamflow using the DWBM model. Ecohydrology 2017, 10. [Google Scholar] [CrossRef]
  3. Wiekenkamp, I.; Huisman, J.A.; Bogena, H.R.; Graf, A.; Lin, H.S.; Drüe, C.; Vereecken, H. Changes in measured spatiotemporal patterns of hydrological response after partial deforestation in a headwater catchment. J. Hydrol. 2016, 542, 648–661. [Google Scholar] [CrossRef]
  4. Sun, S.L.; Chen, H.S.; Ju, W.M.; Hua, W.J.; Yu, M.; Yin, Y.X. On the attribution of changing hydrological cycle in Poyang Lake Basin, China. J. Hydrol. 2014, 514, 214–225. [Google Scholar] [CrossRef]
  5. Liu, Y.B.; Xiao, J.F.; Ju, W.M.; Xu, K.; Zhou, Y.L.; Zhao, Y.T. Recent trends in vegetation greenness in China significantly altered annual evapotranspiration and water yield. Environ. Res. Lett. 2016, 11, 094010. [Google Scholar] [CrossRef] [Green Version]
  6. Schmidt, A.H.; Gonzalez, V.S.; Bierman, P.R.; Thomas, B.N.; Dylan, H.R. Agricultural land use doubled sediment loads in western China’s rivers. Anthropocene 2017, 21, 95–106. [Google Scholar] [CrossRef]
  7. Ward, P.J.; Renssen, H.; Aerts, J.C.J.H.; Van Balen, R.T.; Vandenberghe, J. Strong increases in flood frequency and discharge of the River Meuse over the late Holocene: Impacts of long-term anthropogenic land use change and climate variability. Hydrol. Earth Syst. Sci. 2008, 12, 159–175. [Google Scholar] [CrossRef] [Green Version]
  8. Doyle, M.; Harbor, J.; Rich, C.; Spacie, A. Examining the effects of urbanization on streams using indicators of geomorphic stability. Phys. Geogr. 2000, 21, 155–181. [Google Scholar]
  9. Garcia-Ruiz, J.M.; Lana-Renault, N. Hydrological and erosive consequences of farmland abandonment in Europe, with special reference to the Mediterranean region—A review. Agric. Ecosyst. Environ. 2011, 140, 317–338. [Google Scholar] [CrossRef]
  10. Costa, M.H.; Botta, A.; Cardille, J.A. Effects of large-scale changes in land cover on the discharge of the Tocantins Rivers, Southeastern Amazonia. J. Hydrol. 2003, 283, 206–217. [Google Scholar] [CrossRef]
  11. Wardrop, D.H.; Brooks, R.P. The Occurrence and impact of sedimentation in central Pennsylvania wetlands. Environ. Monit. Assess. 1998, 51, 119–130. [Google Scholar] [CrossRef]
  12. María, J.M.; Ramón, B.; Luis, J.; Raquel, P. Effect of vegetal cover on runoff and soil erosion under light intensity events. Rainfall simulation over USLE. Sci. Total Environ. 2007, 378, 161–165. [Google Scholar]
  13. Leh, M.; Bajwa, S.; Chaubey, I. Impact of land use change on erosion risk: An integrated remote sensing, geographic information system and modeling methodology. Land Degrad. Dev. 2013, 24, 409–421. [Google Scholar] [CrossRef]
  14. Zhou, G.X.; Wei, X.; Luo, Y.; Zhang, M.; Li, Y.; Qiao, Y.; Liu, H.G.; Wang, C.L. Forest recovery and river discharge at the regional scale of Guangdong province, China. Water Resour. Res. 2010, 46, w09503. [Google Scholar] [CrossRef]
  15. Wang, S.; Fu, B.J.; He, C.S.; Sun, G.; Gao, G.Y. A comparative analysis of forest cover and catchment water yield relationships in northern China. For. Ecol. Manag. 2011, 262, 1189–1198. [Google Scholar] [CrossRef] [Green Version]
  16. Zhou, G.; Wei, X.; Chen, X.; Zhou, P.; Liu, X.; Xiao, Y. Global pattern for the effect of climate and land cover on water yield. Nat. Commun. 2015, 6, 5918. [Google Scholar] [CrossRef] [PubMed] [Green Version]
  17. Tang, L.H.; Yang, D.W.; Hu, H.P.; Gao, B. Detecting the effect of land-use change on streamflow, sediment and nutrient losses by distributed hydrological simulation. J. Hydrol. 2011, 409, 172–182. [Google Scholar] [CrossRef]
  18. Dao, N.K.; Suetsugi, T. The responses of hydrological processes and sediment yield to land-use and climate change in the Be River Catchment, Vietnam. Hydrol. Process. 2014, 28, 640–652. [Google Scholar]
  19. Zorzal-Almeida, S.; Salim, A.; Andrade, M.R.M.; Nascimento, M.N.; Bini, L.M.; Bicudo, D.C. Effects of land use and spatial processes in water and surface sediment of tropical reservoirs at local and regional scales. Sci. Total Environ. 2018, 644, 237–246. [Google Scholar] [CrossRef] [PubMed]
  20. Gao, G.Y.; Fu, B.J.; Zhang, J.J.; Ma, Y.; Sivapalan, M. Multiscale temporal variability of flow-sediment relationships during the 1950s–2014 in the loess plateau, china. J. Hydrol. 2018, 563, 609–619. [Google Scholar] [CrossRef]
  21. Wang, J.; Ishidaira, H.; Ning, S.; Khujanazarov, T.; Yin, G.; Guo, L. Attribution Analyses of Impacts of Environmental Changes on Streamflow and Sediment Load in a Mountainous Basin, Vietnam. Forests 2016, 7, 30. [Google Scholar] [CrossRef] [Green Version]
  22. Kellner, E.; Hubbart, J.A. Improving understanding of mixed-land-use watershed suspended sediment regimes: Mechanistic progress through high-frequency sampling. Sci. Total Environ. 2017, 598, 228–238. [Google Scholar] [CrossRef] [PubMed]
  23. Le, T.P.Q.; Garnier, J.; Gilles, B.; Sylvain, T.; Van, M.C. The changing flow regime and sediment load of the Red River, VietNam. J. Hydrol. 2007, 334, 199–214. [Google Scholar] [CrossRef]
  24. Wang, J.; Ishidaira, H. Effects of human-induced vegetation cover change on sediment flow using satellite observations and terrestrial ecosystem model. J. Jpn. Soc. Civ. Eng. Ser. B1 2013, 69, I_205–I_210. [Google Scholar] [CrossRef]
  25. Dang, T.H.; Coynel, A.; Orange, D.; Blanc, G.; Etcheber, H.; Le, L.A. Long-term monitoring (1960–2008) of the river-sediment transport in the Red River Watershed (Vietnam): Temporal variability and dam-reservoir impact. Sci. Total Environ. 2010, 408, 4654–4664. [Google Scholar] [CrossRef] [PubMed]
  26. Imhof, A. Vietnam dam to cause hardship for ethnic minorities. World Rivers Rev. 1998, 13, 3–4. [Google Scholar]
  27. Verburg, P.H.; Soepboer, W.; Veldkamp, A.; Limpiada, R.; Espaldon, V.; Mastura, S.S. Modeling the spatial dynamics of regional land use: The CLUE-S model. Environ. Manag. 2002, 30, 391–405. [Google Scholar] [CrossRef] [PubMed]
  28. Soares, B.S.; Cerqueira, G.C.; Pennachin, C.L. DINAMICA—A stochastic cellular automata model designed to simulate the landscape dynamics in an Amazonian colonization frontier. Ecol. Model. 2002, 154, 217–235. [Google Scholar] [CrossRef]
  29. Pontius, R.G.; Cornell, J.D.; Hall, C.A.S. Modeling the spatial pattern of land-use change with GEOMOD2: Application and validation for Costa Rica. Agric. Ecosyst. Environ. 2001, 85, 191–203. [Google Scholar] [CrossRef]
  30. Kim, O.S. An assessment of deforestation models for reducing emissions from deforestation and forest degradation (REDD). Trans. GIS 2010, 14, 631–654. [Google Scholar] [CrossRef]
  31. Azucena, P.V.; Mas, J.F.; Arika, L.Z. Comparing two approaches to land use/cover change modeling and their implications for the assessment of biodiversity loss in a deciduous tropical forest. Environ. Model. Softw. 2011, 29, 11–23. [Google Scholar]
  32. Lin, Y.P.; Hong, N.M.; Wu, P.J.; Lin, C.J. Modeling and assessing land-use and hydrological processes to future land-use and climate change scenarios in watershed land-use planning. Environ. Geol. 2007, 53, 623–634. [Google Scholar] [CrossRef]
  33. Romano, G.; Abdelwahab, O.M.M.; Gentile, F. Modeling land use changes and their impact on sediment load in a Mediterranean watershed. Catena 2018, 163, 342–353. [Google Scholar] [CrossRef]
  34. Xiao, J.F.; Zhou, Y.; Zhang, L. Contributions of natural and human factors to increases in vegetation productivity in China. Ecosphere 2016, 6, 1–20. [Google Scholar] [CrossRef]
  35. United Nations Environment Programme (UNEP). China Conservation Strategy; UNEP & China Environmental Science Press: Beijing, China, 1990. [Google Scholar]
  36. Ye, C.Q.; Gan, S.; Wang, W.L.; Deng, Q.Y.; Chen, W.H.; Li, Y.G. Analysis on the runoff distribution and the variability in the downstream of Honghe River. Resour. Environ. Yangtze Basin 2008, 17, 886–891. [Google Scholar]
  37. World Bank. Vietnam Water Resources Sector Review: Selected Working Papers of the World Bank, ADB, FAO/UNP and NGO Water Resources Sectoral Group; World Bank Group: Hanoi, Vietnam, 1996; p. 340. [Google Scholar]
  38. Forest Science Institute of Vietnam (FSIV). Vietnam Forestry Outlook Study, Asia-Pacific Forestry Sector Outlook Study II; Working Paper Series; Forest Science Institute of Vietnam: Hanoi, Vietnam, 2009. [Google Scholar]
  39. Li, X.; Cheng, G.; Lu, L. Spatial analysis of air temperature in the Qinghai-Tibet Plateau. Arct. Antarct. Alp. Res. 2005, 37, 246–252. [Google Scholar] [CrossRef]
  40. Mahdian, M.H.; Bandarabady, S.R.; Sokouti, R.; Banis, Y.N. Appraisal of the geostatistical methods to estimate monthly and annual temperature. J. Appl. Sci. 2009, 9, 128–134. [Google Scholar] [CrossRef]
  41. Available online: https://lta.cr.usgs.gov/GTOPO30 (accessed on 16 May 2017).
  42. Available online: http://www.fao.org/geonetwork/srv/en/metadata.show?id=14116 (accessed on 15 December 2017).
  43. Available online: https://lpdaac.usgs.gov/products/modis_products_table/mcd12q1 (accessed on 10 June 2017).
  44. Zhu, Z.C.; Bi, J.; Pan, Y.Z.; Ganguly, S.; Anav, A.; Xu, L.; Samanta, A.; Piao, S.L.; Nemani, R.R.; Myneni, R.B. Global Data Sets of Vegetation Leaf Area Index (LAI) 3g and Fraction of Photosynthetically Active Radiation (FPAR) 3g Derived from Global Inventory Modeling and Mapping Studies (GIMMS) Normalized Difference Vegetation Index (NDVI3g) for the Period 1981 to 2011. Remote Sens. 2013, 5, 927–948. [Google Scholar]
  45. Clark Labs. The Land Change Modeler for Ecological Sustainability; IDRISI Focus Paper; Clark University: Worcester, MA, USA, 2009. [Google Scholar]
  46. Oñate-Valdivieso, F.; Sendra, J.B. Application of GIS and remote sensing techniques in generation of land use scenarios for hydrological modeling. J. Hydrol. 2010, 395, 256–263. [Google Scholar] [CrossRef]
  47. Eastman, J.R. IDRISI Andes Tutorial; Clark-Labs, Clark University: Worcester, MA, USA, 2006. [Google Scholar]
  48. Monserud, R.A.; Leemans, R. Comparing global vegetation maps with the Kappa statistic. Ecol. Model. 1992, 62, 275–293. [Google Scholar] [CrossRef]
  49. Running, S.W.; Gower, S.T. FOREST-BGC, A general model of forest ecosystem processes for regional applications. Tree Physiol. 1991, 9, 147–160. [Google Scholar] [CrossRef] [PubMed]
  50. Ichii, K.; Hashimoto, H.; Nemani, R.; White, M. Modeling the interannual variability and trends in gross and net primary productivity of tropical forests from 1982 to 1999. Glob. Planet. Chang. 2005, 48, 274–286. [Google Scholar] [CrossRef]
  51. Takeuchi, K.; Ao, T.Q.; Ishidaira, H. Introduction of blockwise use of TOPMODEL and Muskingum–Cunge method for the hydro-environmental simulation of a large ungauged catchment. Hydrol. Sci. J. 1999, 44, 633–646. [Google Scholar] [CrossRef]
  52. Ishidaira, H.; Takeuchi, K.; Ao, T. Hydrological simulation of large river basins in Southeast Asia. In Proceedings of the Fresh Perspectives on Hydrology and Water Resources in Southeast Asia and the Pacific, Christchurch, New Zealand, 21–24 November 2000; pp. 53–54. [Google Scholar]
  53. Beven, K. Linking parameters across scales-sub grid parameterizations and scale-dependent hydrological models. Hydrol. Process. 1995, 9, 507–525. [Google Scholar] [CrossRef]
  54. Shrestha, S.; Bastola, S.; Babel, M.S.; Dulal, K.N.; Magome, J.; Hapuarachchi, H.A.P.; Kazama, F.; Ishidaira, H.; Takeuchi, K. The assessment of spatial and temporal transferability of a physically based distributed hydrological model parameters in different physiographic regions of Nepal. J. Hydrol. 2007, 347, 153–172. [Google Scholar] [CrossRef]
  55. Moriasi, D.N.; Arnold, J.G.; Van Liew, M.W.; Bingner, R.L.; Harmel, R.D.; Veith, T.L. Model evaluation guidelines for systematic quantification of accuracy in watershed simulations. Trans. ASABE 2007, 50, 885–900. [Google Scholar] [CrossRef]
  56. Asselman, N.E.M. Fitting and interpretation of sediment rating curves. J. Hydrol. 2000, 234, 228–248. [Google Scholar] [CrossRef]
  57. Howe, A.; Rodriguez, J.; MacFarlane, G. Vegetation Sediment Flow Interactions in Estuarine Wetlands. In Proceedings of the International Congress on Modelling and Simulation (MODSIM05), Melbourne, Australia, 12–15 December 2005; pp. 332–338. [Google Scholar]
  58. Wang, J.; Ishidaira, H.; Sun, W.C.; Ning, S.W. Development and Interpretation of New Sediment Rating Curve Considering the Effect of Vegetation Cover for Asian Basins. Sci. World J. 2013, 2013, 154375. [Google Scholar] [CrossRef] [PubMed]
  59. Aguejdad, R.; Houet, T.; Hubert-Moy, L. Spatial Validation of Land Use Change Models Using Multiple Assessment Techniques: A Case Study of Transition Potential Models. Environ. Model. Assess. 2017, 22, 591–606. [Google Scholar] [CrossRef]
  60. Panday, P.K.; Coe, M.T.; Macedo, M.N.; Lefebvre, P.; Castanho, A.D.D.A. Deforestation offsets water balance changes due to climate variability in the Xingu river in Eastern Amazonia. J. Hydrol. 2015, 523, 822–829. [Google Scholar] [CrossRef]
  61. Alvarenga, L.A.; Mello, C.R.D.; Colombo, A.; Cuartas, L.A.; Bowling, L.C. Assessment of land cover change on the hydrology of a brazilian headwater watershed using the distributed hydrology-soil-vegetation model. Catena 2016, 143, 7–17. [Google Scholar] [CrossRef]
  62. Coe, M.T.; Costa, M.H.; Soares-Filho, B.S. The influence of historical and potential future deforestation on the stream flow of the Amazon River—Land surface processes and atmospheric feedbacks. J. Hydrol. 2009, 369, 165–174. [Google Scholar] [CrossRef]
  63. Zhao, J.; Xu, Z.X.; Singh, V.P. Estimation of root zone storage capacity at the catchment scale using improved Mass Curve Technique. J. Hydrol. 2016, 540, 959–972. [Google Scholar] [CrossRef]
  64. Sanyal, J.; Densmore, A.L.; Carbonneau, P. Analysing the effect of land-use/cover changes at sub-catchment levels on downstream flood peaks: A semi-distributed modelling approach with sparse data. Catena 2014, 118, 28–40. [Google Scholar] [CrossRef] [Green Version]
  65. Dudgeon, D.; Choowaew, S.; Ho, S.C. River conservation in South-East Asia. In Global Perspectives on River Conservation: Science, Policy and Practice; Boon, P.J., Davies, B.R., Petts, G.E., Eds.; John Wiley & Sons Ltd.: Chichester, UK, 2000; pp. 279–308. [Google Scholar]
  66. Maneux, E.; Probst, J.L.; Veyssy, E.; Etcheber, H. Assessment of dam trapping efficiency from water residence time: Application to fluvial sediment transport in the Adour, Dordogne, and Garonne River basins (France). Water Resour. Res. 2001, 37, 801–811. [Google Scholar] [CrossRef]
  67. Vörösmarty, C.J.; Meybeck, M.; Fekete, B.; Sharma, K.; Green, P.; Syvitski, J.P.M. Anthropogenic sediment retention: Major global impact from registered river impoundments. Glob. Planet. Chang. 2003, 39, 169–190. [Google Scholar] [CrossRef]
Figure 1. Location of the Da River Basin (DRB) and the hydro-meteorological stations.
Forests 09 00451 g001
Figure 2. Model integration and data flow within models. Biome-BGC: Biome-BioGeochemical Cycle; LCM: Land Change Model; BTOPMC: Block wise use of TOPMODEL with Muskingum–Cunge routing model; NSRC: New Sediment Rating Curve.
Forests 09 00451 g002
Figure 3. (a) Gains and losses in land cover between 2001 and 2008; (b) Net land cover change between 2001 and 2008.
Forests 09 00451 g003
Figure 4. (a) Observed (left) and simulated (right) land cover maps of 2011; (b) Land cover maps of 2001(basin line) and 2050 (predicted).
Forests 09 00451 g004
Figure 5. Spatial distribution of percentage changes in LAI (a) and annual distribution changes (b) in LAI.
Forests 09 00451 g005
Figure 6. Comparison of observed and simulated daily streamflow (the Lai Chau and Ta Bu first and second figures, respectively) and monthly SSCs (bottom figure) in the DRB (calibration period: 1991–1995, validation period: 1996–2000).
Forests 09 00451 g006
Figure 7. (a) Annual distribution changes in streamflow and sediment load under land cover change scenario at the Lai Chau and Ta Bu (b) Spatial distribution of averaged annual runoff depth change.
Forests 09 00451 g007
Table 1. Dataset summary for different models in the study.
ModelsSpatial DatasetPoint Dataset
Hydrological model
BTOPMC
Elevation, land cover, soil map, LAIRainfall, streamflow
meteorological data (e.g., precipitation, maximum/minimum air temperature, vapor pressure)
New sediment rating curve
NSRC
LAIStreamflow, SSC
Land change model
LCM
Elevation, land cover, soil map, population density, road and river networks, slope, human footprint, rainfall trends
Ecological model
Biome-BGC
Elevation, land cover, soil mapprecipitation, mean air temperature, mean air temperature, vapor pressure
BTOPMC: Block wise use of TOPMODEL with Muskingum–Cunge routing model; LAI: Leaf Area Index; SSC: Suspended Sediment Concentration; Biome-BGC: Biome-BioGeochemical Cycle.
Table 2. Statistical parameters between the reference map and the simulated map of 2011.
Land CoverReference 2011 (pix)Simulated 2011 (pix)Mean ErrorPercent (%)Kappa Index
Water869842−27−3.10.94
Forest184,701177,657−7044−3.8
Shrublands60,43369,411897814.8
Grasslands10,7439126−1617−15.0
Wetlands825896718.6
Croplands58,87158,403−468−0.8
Urban161817251076.6
Table 3. Potential land cover change simulated by LCM in the Da River Basin (area percent: %).
Land CoverBaseline 2001 (%)Predicted 2050 (%)Changes (%)
Water0.060.05−0.01
Forest70.9149.57−21.34
Shrublands15.525.479.97
Grasslands0.720.16−0.56
Wetlands0.190.340.15
Croplands12.5724.2711.7
Urban0.060.140.08
Table 4. Evaluation of BTOPMC and NSRC model simulations during the baseline period for the catchments controlled by the Lai Chau and Ta Bu stations in the DRB.
StreamflowSSC
Lai ChauTa BuLai Chau
CalibrationValidationCalibrationValidationCalibrationValidation
NSE0.750.700.700.650.850.82
RSR0.480.570.510.650.330.45
PBIAS (%)6.27.27.07.80.531.22
Table 5. Water balance changes due to land cover change between year of 2001 and 2050: Precipitation (P, mm), actual evapotranspiration (AET, mm), surface runoff (SR, mm), ground water (GW, mm), total runoff (TR, mm).
CatchmentTime ScalePAETSRGWTR
LCwet season2523.1630.1→586.01343.3→1534.1548.7→521.21892.0→2011.2
(−7.0%)(14.2%)(−5.0%)(6.3%)
dry season540.2135.1→128.3241.8→273.5161.2→156.4403.0→423.2
(−5.0%)(13.1%)(−2.9%)(5.0%)
annual1608.5401.1→377.1832.1→940.3373.9→358.91206.0→1275.9
(−6.0%)(13.0%)(−4.0%)(5.8%)
TBwet season3202.3796.9→733.11706.1→1989.3696.9→648.12403.0→2573.6
(−8.0%)(16.6%)(−7.0%)(7.1%)
dry season760.6188.2→176.9342.0→394.0228.0→216.6570.0→600.2
(−6.0%)(15.2%)(−5.0%)(5.3%)
annual1989.1495.3→460.71030.2→1192.9462.8→435.11493.0→1593.0
(−7.0%)(15.8%)(−6.0%)(6.7%)

