Article

Understory Plants Regulate Soil Respiration through Changes in Soil Enzyme Activity and Microbial C, N, and P Stoichiometry Following Afforestation

1
Shaanxi Key Laboratory of Earth Surface System and Environmental Carrying Capacity, Northwest University, Xi’an 710127, China
2
Key Laboratory of Degraded and Unused Land Consolidation Engineering the Ministry of Land and Resources of China, Xi’an 710075, China
3
College of Urban and Environmental Sciences, Northwest University, Xi’an 710127, China
4
College of Agronomy, Northwest A&F University, Yangling 712100, China
5
Department of Microbiology and Plant Biology, Center for Spatial Analysis, University of Oklahoma, Norman, OK 73019, USA
6
College of Life Sciences, Yan’an University, Yan’an 716000, China
*
Author to whom correspondence should be addressed.
Forests 2018, 9(7), 436; https://doi.org/10.3390/f9070436
Submission received: 18 June 2018 / Revised: 8 July 2018 / Accepted: 18 July 2018 / Published: 20 July 2018
(This article belongs to the Special Issue Afforestation and Reforestation: Drivers, Dynamics, and Impacts)

Abstract

:
Soil respiration (SR) is an important process in the carbon cycle. However, the means by which changes in understory plant community traits affect this ecosystem process is still poorly understood. In this study, plant species surveys were conducted and soil samples were collected from forests dominated by black locust (Robinia pseudoacacia L.), with a chronosequence of 15, 25, and 40 years (RP15, RP25, and RP40, respectively), and farmland (FL). Understory plant coverage, evenness, diversity, and richness were determined. We investigated soil microbial biomass carbon (MBC), nitrogen (MBN), phosphorus (MBP), and stoichiometry (MBC:MBN, MBC:MBP, and MBN:MBP). Soil enzyme assays (catalase, saccharase, urease, and alkaline phosphatase), heterotrophic respiration (HR), and autotrophic respiration (AR) were measured. The results showed that plant coverage, plant richness index (R), evenness, and Shannon-Wiener diversity were higher in RP25 and RP40 than in RP15. SR, HR, and AR were significantly higher in the forested sites than in farmland, especially for SR, which was on average 360.7%, 249.6%, and 248.2% higher in RP40, RP25, and RP15, respectively. Meanwhile, catalase, saccharase, urease, and alkaline phosphatase activities and soil microbial C, N, P, and its stoichiometry were also higher after afforestation. Moreover, significant Pearson linear correlations between understory plants (coverage, evenness, diversity, and richness) and SR, HR, and AR were observed, with the strongest correlation observed between plant coverage and SR. This correlation largely depended on soil enzymes (i.e., catalase, saccharase, urease, and alkaline phosphatase), and soil microbial biomass C, N, and P contents and its stoichiometry, particularly urease activity and the MBC:MBP ratio. Therefore, we conclude that plant communities are drivers of soil respiration, and that changes in soil respiration are associated with shifts in soil enzyme activities and nutrient stoichiometry.

1. Introduction

Understory plants play an important role in soil carbon cycling and the future carbon (C) balance of terrestrial ecosystems under climate change [1,2]. The C flux through soil respiration (SR) is a vital component of the global C cycle; it represents approximately 10% of the atmospheric C pool, and is 10 times greater than that from fossil fuel combustion [3]. Consequently, even slight changes in understory plant community composition and traits could affect SR through shifts in productivity [4], changing litter inputs and altering the soil microclimate [5,6]. Many studies have reported that plants can control the balance between plant C inputs and losses [7,8,9,10]. However, the means by which changes in plant community traits affect this ecosystem process, especially in afforested ecosystems, is poorly understood. For example, different results are usually reported the effects of plant diversity on SR. Both positive [11] and non-significant relationships [12] between plant diversity and SR have been documented. More importantly, Dias [13] found no significant effect of plant diversity on SR, while Liu [14] observed that plant diversity was the most important driver of SR. Therefore, it is imperative to further investigate plant communities as drivers of SR, and the possible pathways, mechanisms, and significance of SR for global climate change.
Plants affect SR in many ways, one of which is soil enzyme activities [15,16]. Enzyme activity is the most basic driving factor of SR. More than 50% of SR is produced by the enzyme-related decomposition of litter and soil organic matter (SOM) [17,18]. On the other hand, considering the metabolic activities of microorganisms during C deposition into soil, enzymes transform plant residues, decompose plant-derived C, and thus affect SR [19]. These relationships have been revealed through field experiments [15], models [20], and meta-analyses [21,22]. For example, Chen [15] showed a positive correlation between glycosidase activity and SR for most types of vegetation. Ren [9] also documented that enzyme activities, especially oxidative C-degrading enzyme activities, were significantly correlated with SR due to plant litter inputs. However, a lack of clarity regarding afforested ecosystems still remains, because the distribution of both recalcitrant and labile C varies depending on the plant community composition [23]. Furthermore, understanding the effects of the aggradation of afforested ecosystems on belowground C cycles is important for quantifying and predicting the dynamics of terrestrial C, especially under the current scenarios of global climate change. Thus, investigating the role of soil enzyme activities during the aggradation of afforested ecosystems in SR will help to address this knowledge gap.
Plant communities and litter can affect soil respiration rates through nutrient availability [24]. Additionally, ecological stoichiometry is usually regarded as an indicator of microbial nutrient requirements and nutrient availability, especially for C, nitrogen (N), and phosphorus (P) content in microbial biomass [25]. Plant communities also affect soil respiration by plant-trait driven shifts in microbial biomass C, N, and P contents and stoichiometric ratio. Although results from previous studies suggest that ecological stoichiometry, especially the C:N:P ratios of organisms and substrates, could be used as a tool to acquire knowledge to the cycling of these elements [26,27], the question remains as to how plant communities influence SR through changes in the stoichiometry of soil microbial biomass during the aggradation of afforested ecosystems. We raise this question because changes in the plant community composition during aggradation generally produce more litter with higher N content, which is more easily degraded by soil microbes [28,29]. In turn, microorganisms consume nutrients in excess amounts and store them in the form of glycogen or polyphosphates, because afforestation leads to changes in their biomass C:N:P ratio [27,30]. Consequently, understanding how shifts in plant community composition affect SR due to changes in the C:N:P ratio of microbial biomass is key to predicting the dynamics of terrestrial C under future climate change. Thus, to advance our understanding of plant-soil interactions during the aggradation of afforested ecosystems, more information about the regulation of terrestrial C dynamics by plant community through shifts in microbial biomass C, N, and P stoichiometry is needed.
The Loess Plateau, which covers approximately 640,000 km2 in China, has experienced severe soil erosion and decreased vegetation cover [31]. The abandonment of farmland with slopes >15° to allow for afforestation is an important management practice to prevent soil erosion and restore ecosystems native to this area [32]. In recent years, numerous studies have been conducted to examine the effects of afforestation on soil physicochemical properties, microbial dynamics, and soil enzyme activities [33,34,35]. However, information on the relationships among understory plant communities, SR, soil enzymes, and microbial biomass nutrient stoichiometry is scarce. Therefore, we investigated plant community composition, SR, soil enzyme activities, and microbial biomass C, N, and P stoichiometry at three forest stands (aged 15, 25, and 40 years) with Robinia pseudoacacia L. (RP) succession after afforestation of former farmland (FL) in the Loess Plateau. We hypothesized that SR changed with plant community traits as aggradation progressed, and that this change in soil respiration was stimulated by the soil C, N, and P stoichiometry of microbial biomass and soil enzymes. The objectives of this study were to (i) evaluate the changes in plant community traits after afforestation, (ii) characterize the changes in soil enzymes and microbial biomass C, N, and P stoichiometry after afforestation, and (iii) demonstrate the relationships between plant community traits, soil enzyme activities, and soil microbial biomass C, N, and P stoichiometry after aggradation of the afforested farmland.

2. Material and Method
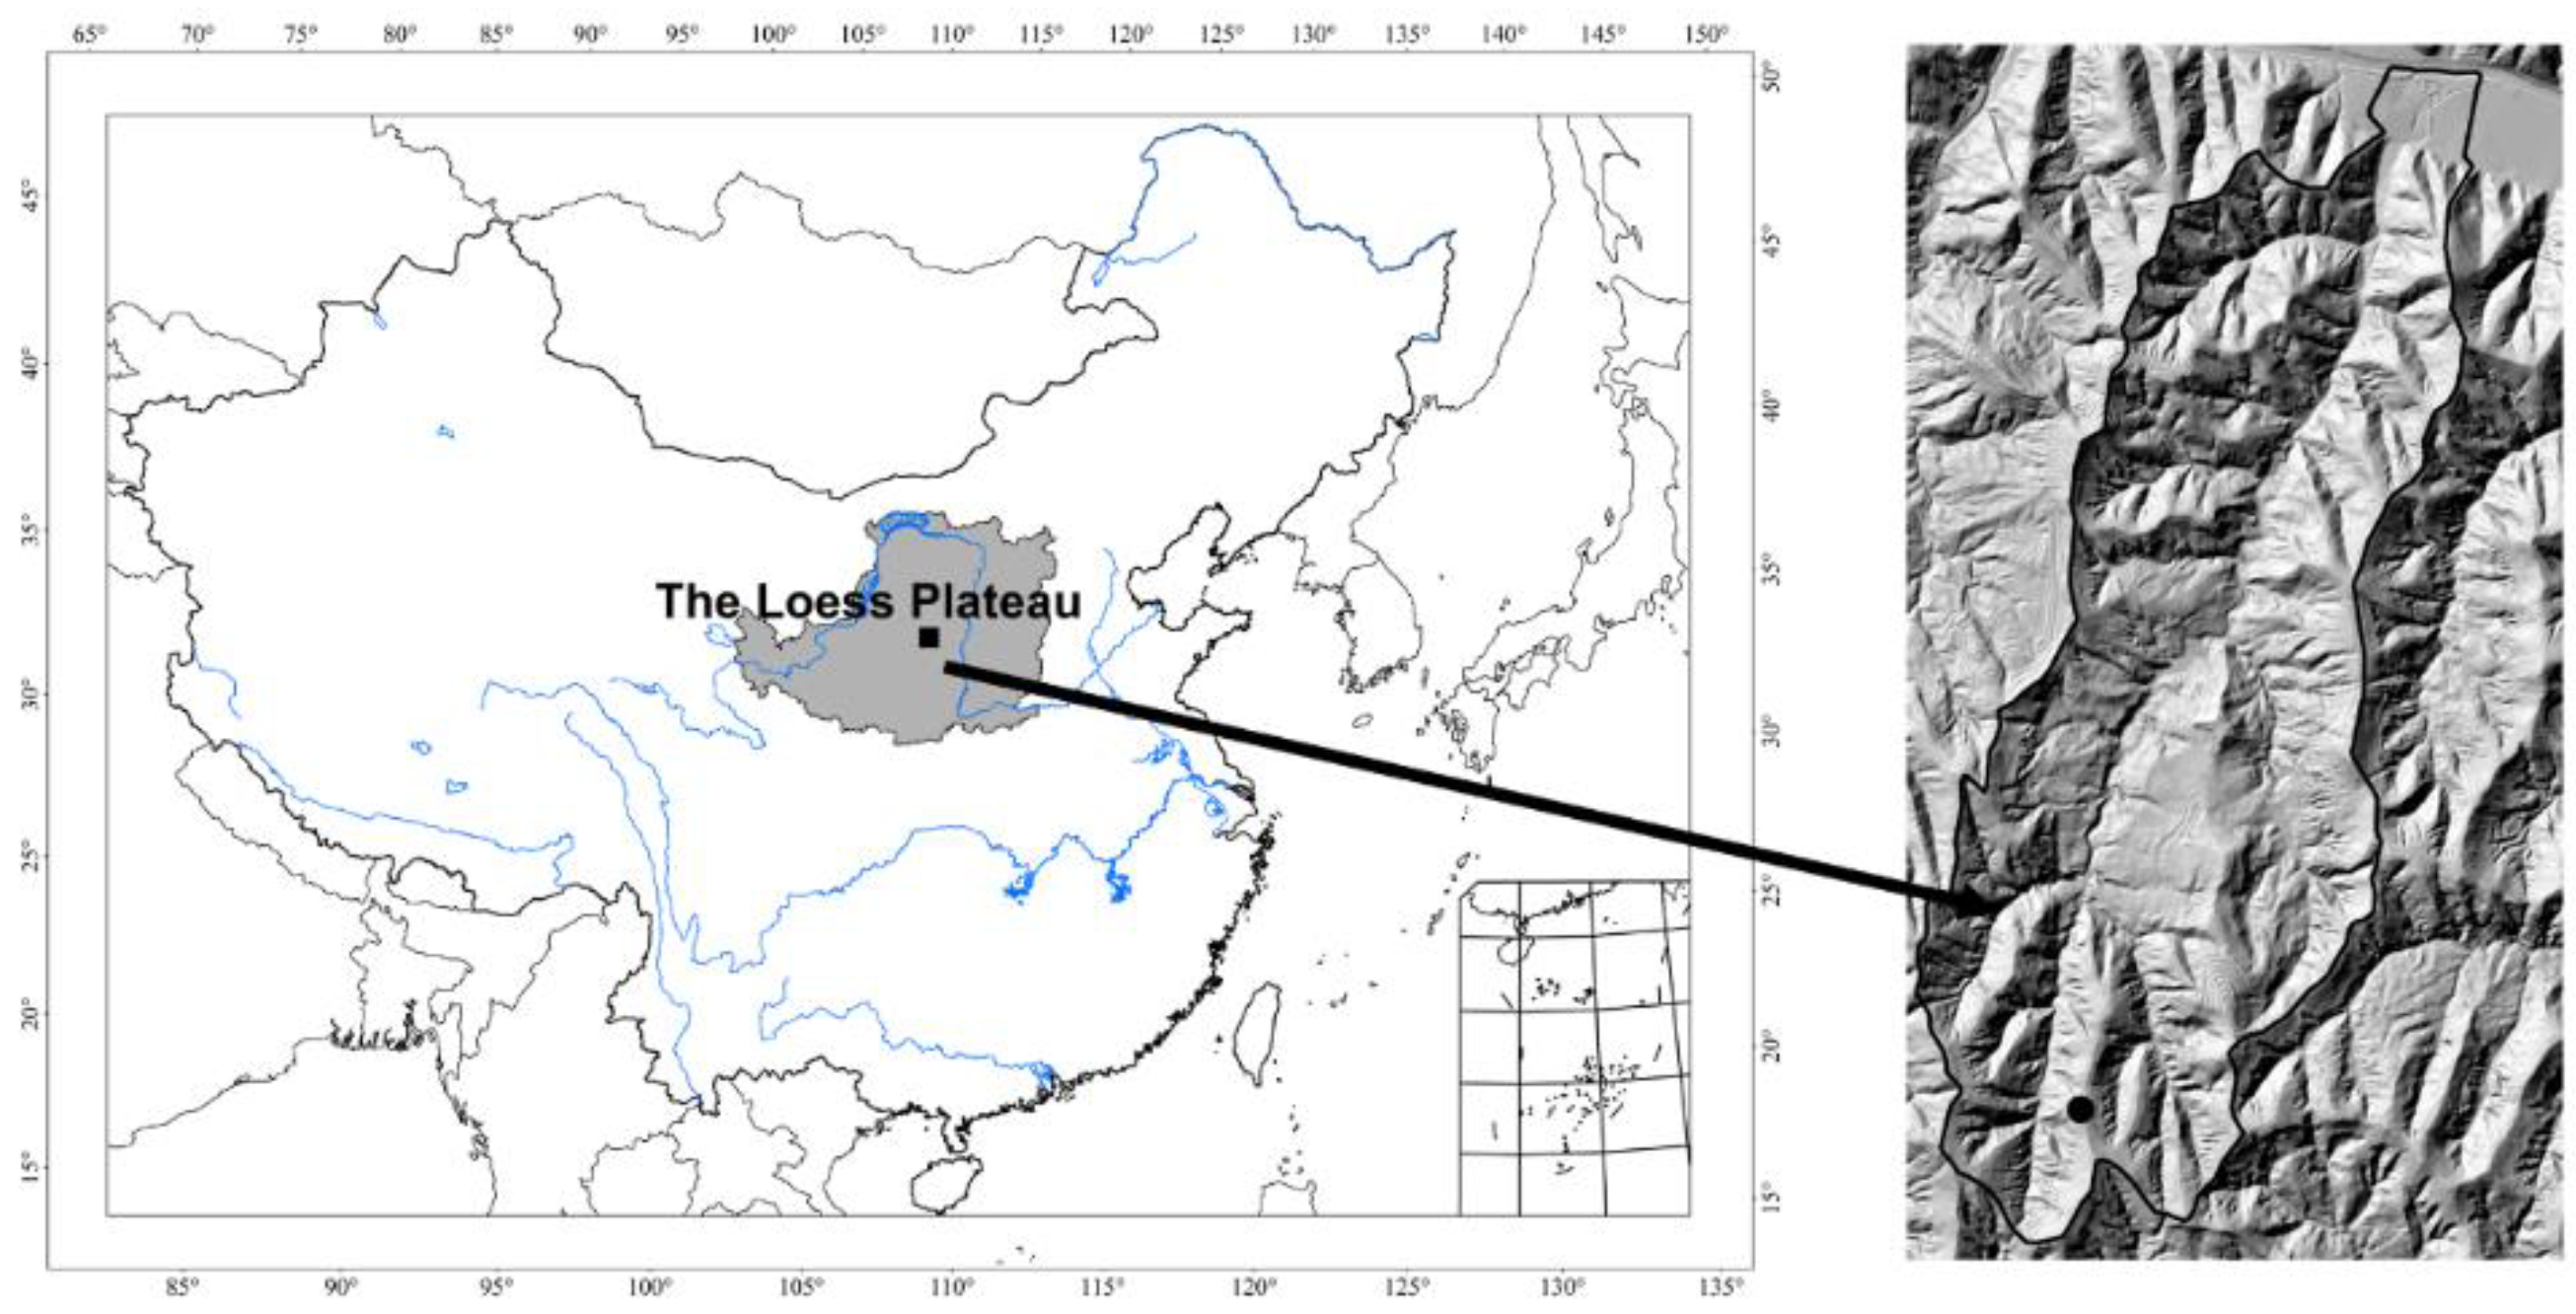
2.1. Study Area

The study was conducted at Wuliwan Watershed, Ansai County, Shaanxi Province, northern China (36°46′42″–36°46′28″ N, 109°13′46″–109°16′03″ E) (Figure 1). This area is a fragile, semiarid ecosystem, and has one of the largest global loess areas [35]. The average monthly temperature ranges from −6.2 °C in January to 37.2 °C in July, with a mean annual temperature of 8.8 °C and mean annual precipitation of 505 mm [36]. In this region, the growing season for deciduous species occurs from April to October [37]. The soil is highly erodible, and classified as loessial soil (Calcaric Cambisols, WRB classification, 2014) (Table 1). The dominant tree species in this area is R. pseudoacacia L., which was replanted on farmland. The main crop species is Setaria italica (L.) P. Beauvois (millet). Water resources for crop growth are dependent entirely on rainfall; irrigation is not practiced during the growing season. The Wuliwan catchment is an experimental site of the Chinese Academy of Science (CAS), and vegetation restoration has been implemented due to serious soil degradation since the 1970s. After 30 years of afforestation, the area of forest has increased significantly from 5% to 40% [38]. Prior to afforestation, all land-use types were essentially farmland, which had been subjected to similar farming practices for more than 20 years with millet and soybean rotations [39]. The understory Stipa bungeana Trin. community is the most extensive species in afforested sites. Stipa grandis P.A.Smirn. and Pinus bungeana Zucc. are the dominant grass species, while Thymus mongolicus Ronn. and Artemisia sacrorum Ledeb. are the dominant forb species (Table 1).

2.2. Experimental Design

Experiments were carried out in June and October, 2014. Based on land use history, three afforested lands, R. pseudoacacia L. (RP40), R. pseudoacacia L. (RP25), and R. pseudoacacia L. (RP15), as well as farmland (FL), were selected. In each different aged stand, three plots with similar slope, gradient, and altitude [38,39] were established. In total, 12 plots (four land use types × three replicate plots) were setup in the study area. In addition, six quadrats (0.5 m × 0.5 m) (three trenched and three untrenched quadrats) were randomly established within the replicate plots, and the trenches (0.5 m wide and 0.8 m deep) were excavated in October 2013. After covering the trenches with a 2 mm thick plastic sheet, we refilled them with soil.

2.3. Soil Respiration Measurement and Soil Sampling

Polyvinyl chloride collars (PVC; 16 cm in diameter × 12 cm in height) were used to measure soil respiration, as described in our previous study [22]. In the experiment sites, six PVC collars were installed to a depth of 10 cm. Three PVC collars in trenched quadrats were used to measure the soil heterotrophic respiration (HR). The other three PVC collars in untrenched quadrats were used to measure SR. In June and August, 2014, AR and HR were measured on a single rain-free day between 9:00 and 11:00 a.m., using the portable soil CO2 flux system (GXH-3010E1, LI-COR Inc., Lincoln, NE, USA) (μmol CO2 m−2 s−1), and obtained from consecutive 2- or 3-day measurements to represent the average monthly soil respiration. Finally, the three respiration rate observations were averaged to obtain the results for a given plot for both AR and HR.
After removing the litter layer, soil samples were collected at 0–10 cm soil depth using a soil auger (diameter 5 cm) from ten points within an “S” shape in each subplot, and then homogenized to provide one final soil sample per subplot. Overall, 12 samples (four stand age types × three plots) were collected. The samples were sieved through a 2 mm screen, and roots and other debris were removed [39,40]. A fraction of each soil sample was air dried and stored at room temperature prior to analysis of its properties, including water content (SWC) and pH. The other portion of each soil sample was immediately transported to the laboratory (on ice, and then stored at −80 °C) for microbial biomass carbon (MBC), nitrogen (MBN), phosphorus (MBP), and enzymatic assay analyses.

2.4. Analysis of Soil Properties and Enzymes Activities

SWC was determined by oven drying to a constant mass at 105 °C. BD was taken by undisturbed soil and calculated from the gravimetric weight of the cores (using 100 cm3 cores with a height of 5 cm) before and after oven drying at 105 °C for 24 h from the individual core volume, while soil pH was measured using a pH meter after shaking the soil water (1:5 w/v) suspension for 30 min [22,39]. MBC, MBN, and MBP were estimated from fresh soil samples using a chloroform fumigation-extraction method [39]. Soil catalase, saccharase, urease, and alkaline phosphatase activities were determined as described in our previous study [40].

2.5. Plant Species Identification and Species Diversity Index

Plant species identification was done in situ in June and October of 2014, which was described in our previous study [41]. Five 1 m × 1 m quadrats were established in each replicate plot in June and October, respectively (3 stand age × 3 replicates × 5 quadrats, a total of 45 quadrats at each site in one season). Vegetation surveys of herbaceous plants in the plantation understory were done by tallying stem quantity and plant height for each species. Plant coverage of herb layers was visually estimated using a metal frame of 1 m × 1 m with 100 equally distributed grids above the subplot, and then understory coverage was calculated as the average percentage of ground surface area covered by the shadow of the foliage in each quadrat [41].
Species richness is the number of species in each quadrat [41]. The Richness index (R) was calculated as the total number of species in each community (S), Shannon-Wiener diversity index (H), and Evenness index (E) of the afforested and abandoned land plant communities were calculated using the following equations:
H = i = 1 S ( P i l n P i )
  E = H l n S  
where S = total number of species in each community, H = Shannon-Wiener diversity index, Pi = density proportion of species “i”, ln = natural log.

2.6. Statistical Analyses

All statistical analyses were carried out using SPSS for Windows (version 17.0, SPSS Inc., Chicago, IL, USA). Analysis of variance (ANOVA) and Duncan’s Multiple Range Test (DMRT) at 5% level of significance were used to compare the differences in plant community coverage, height, and plant density; R, H, and E indexes; MBC:MBN, MBC:MBP, and MBN:MBP ratios; and soil catalase, saccharase, urease, and alkaline phosphatase activity among different sites. Spearman’s rank correlation coefficients were used to investigate the relationships among the plant and soil characteristics at each site. In addition, we used the Beerkan Estimation of Soil Transfer (BEST PRIMER-E, Plymouth, UK) model building procedure, which utilizes all possible combinations of factors to determine which combination of factors (Coverage, Evenness, Diversity, Richness, catalase, alkaline phosphatase, urease, saccharase, MBC:MBN, MBC:MBP, MBN:MBP) account for the greatest proportion of SR (SR, AR and HR). The factors additions were evaluated stepwise and were based on sufficient improvement in the model’s R value.

3. Results

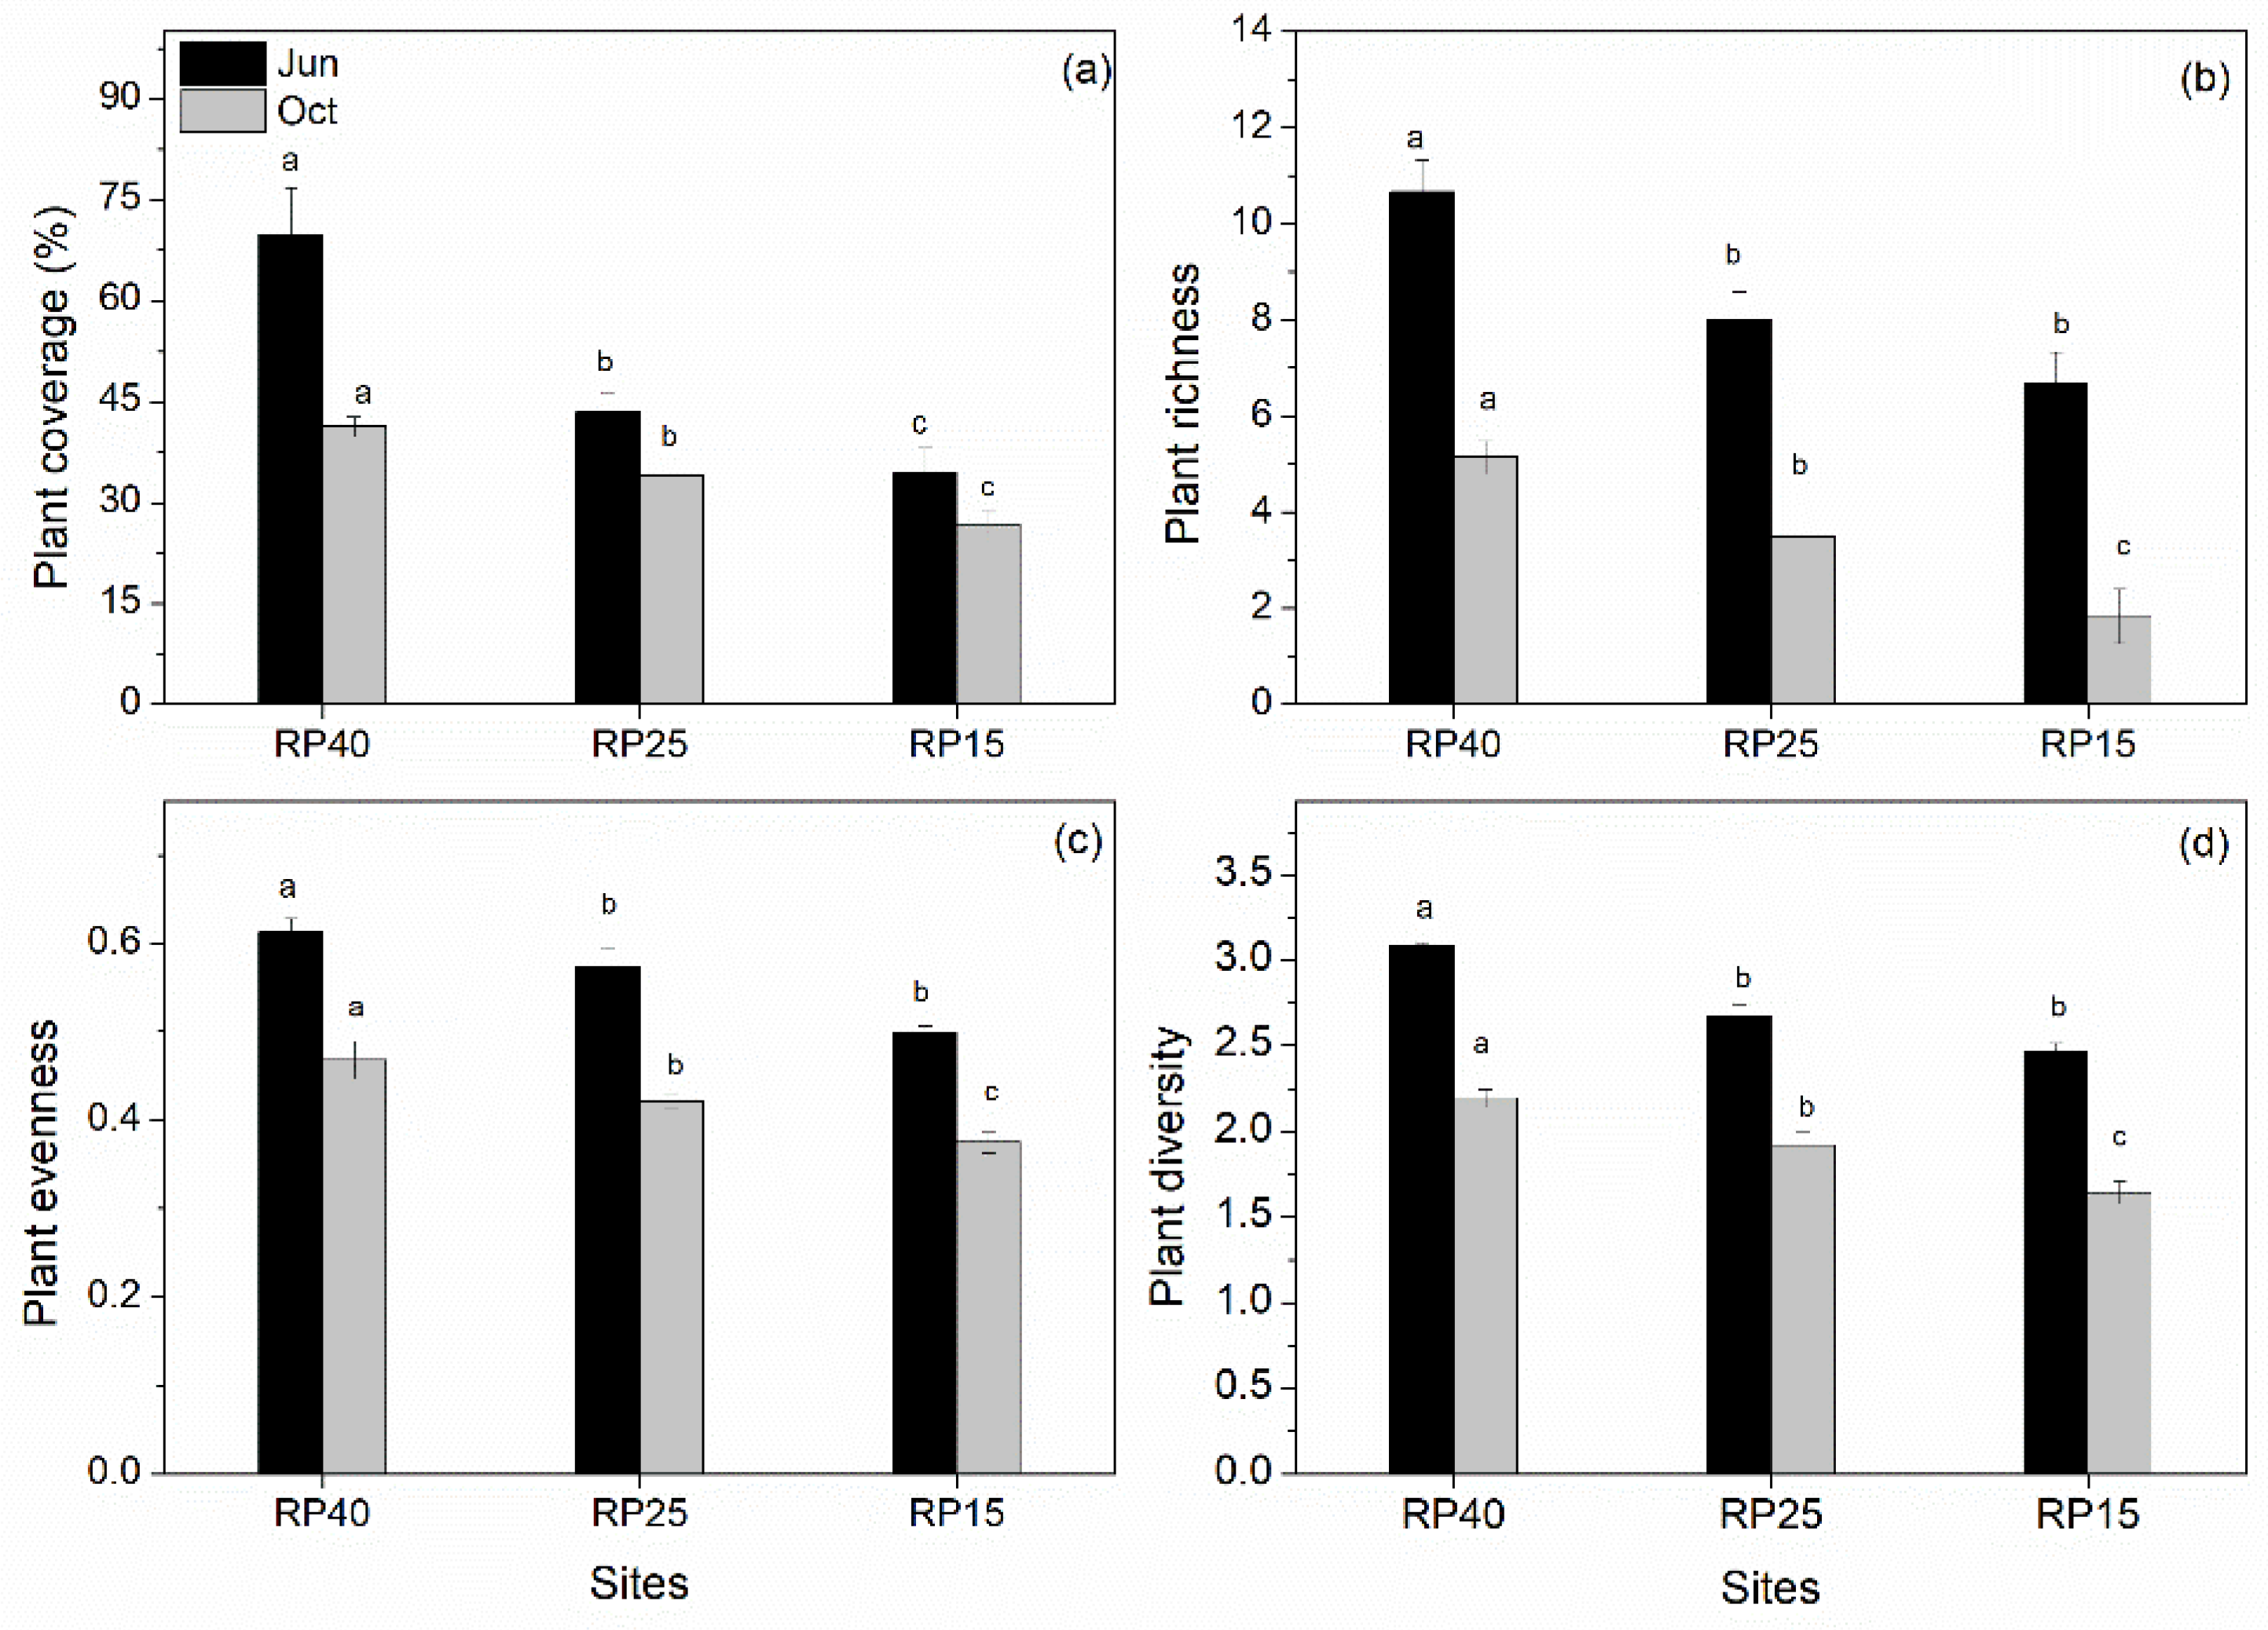
3.1. Changes in Soil Properties and Plant Community Traits after Afforestation

We found that after afforestation, soil bulk density (SBD) and Water Holding Capacity (WHC) increased significantly. SBD was higher at RP40 than RP25, RP15, and FL by 3.33%, 5.98%, and 8.77%. WHC was higher at RP40 than RP25, RP15, and FL by 43.79%, 54.48%, and 136.90%. For the increase of humus, pH value was decreased, and the soil was gradually acidic (Table 2). Understory plants showed remarkable variability during aggradation in our study (Figure 2). We found that after afforestation and during aggradation, plant coverage and plant R, E, and H indices increased. These parameters were higher at RP40 than at RP15 both in June and in October. Compared to RP15, plant coverage and plant R, E, and H indices were higher at RP25 by 26.69%, 20.00%, 14.72%, and 8.28% in June and by 27.15%, 89.45%, 12.47%, and 16.72% in October, respectively.

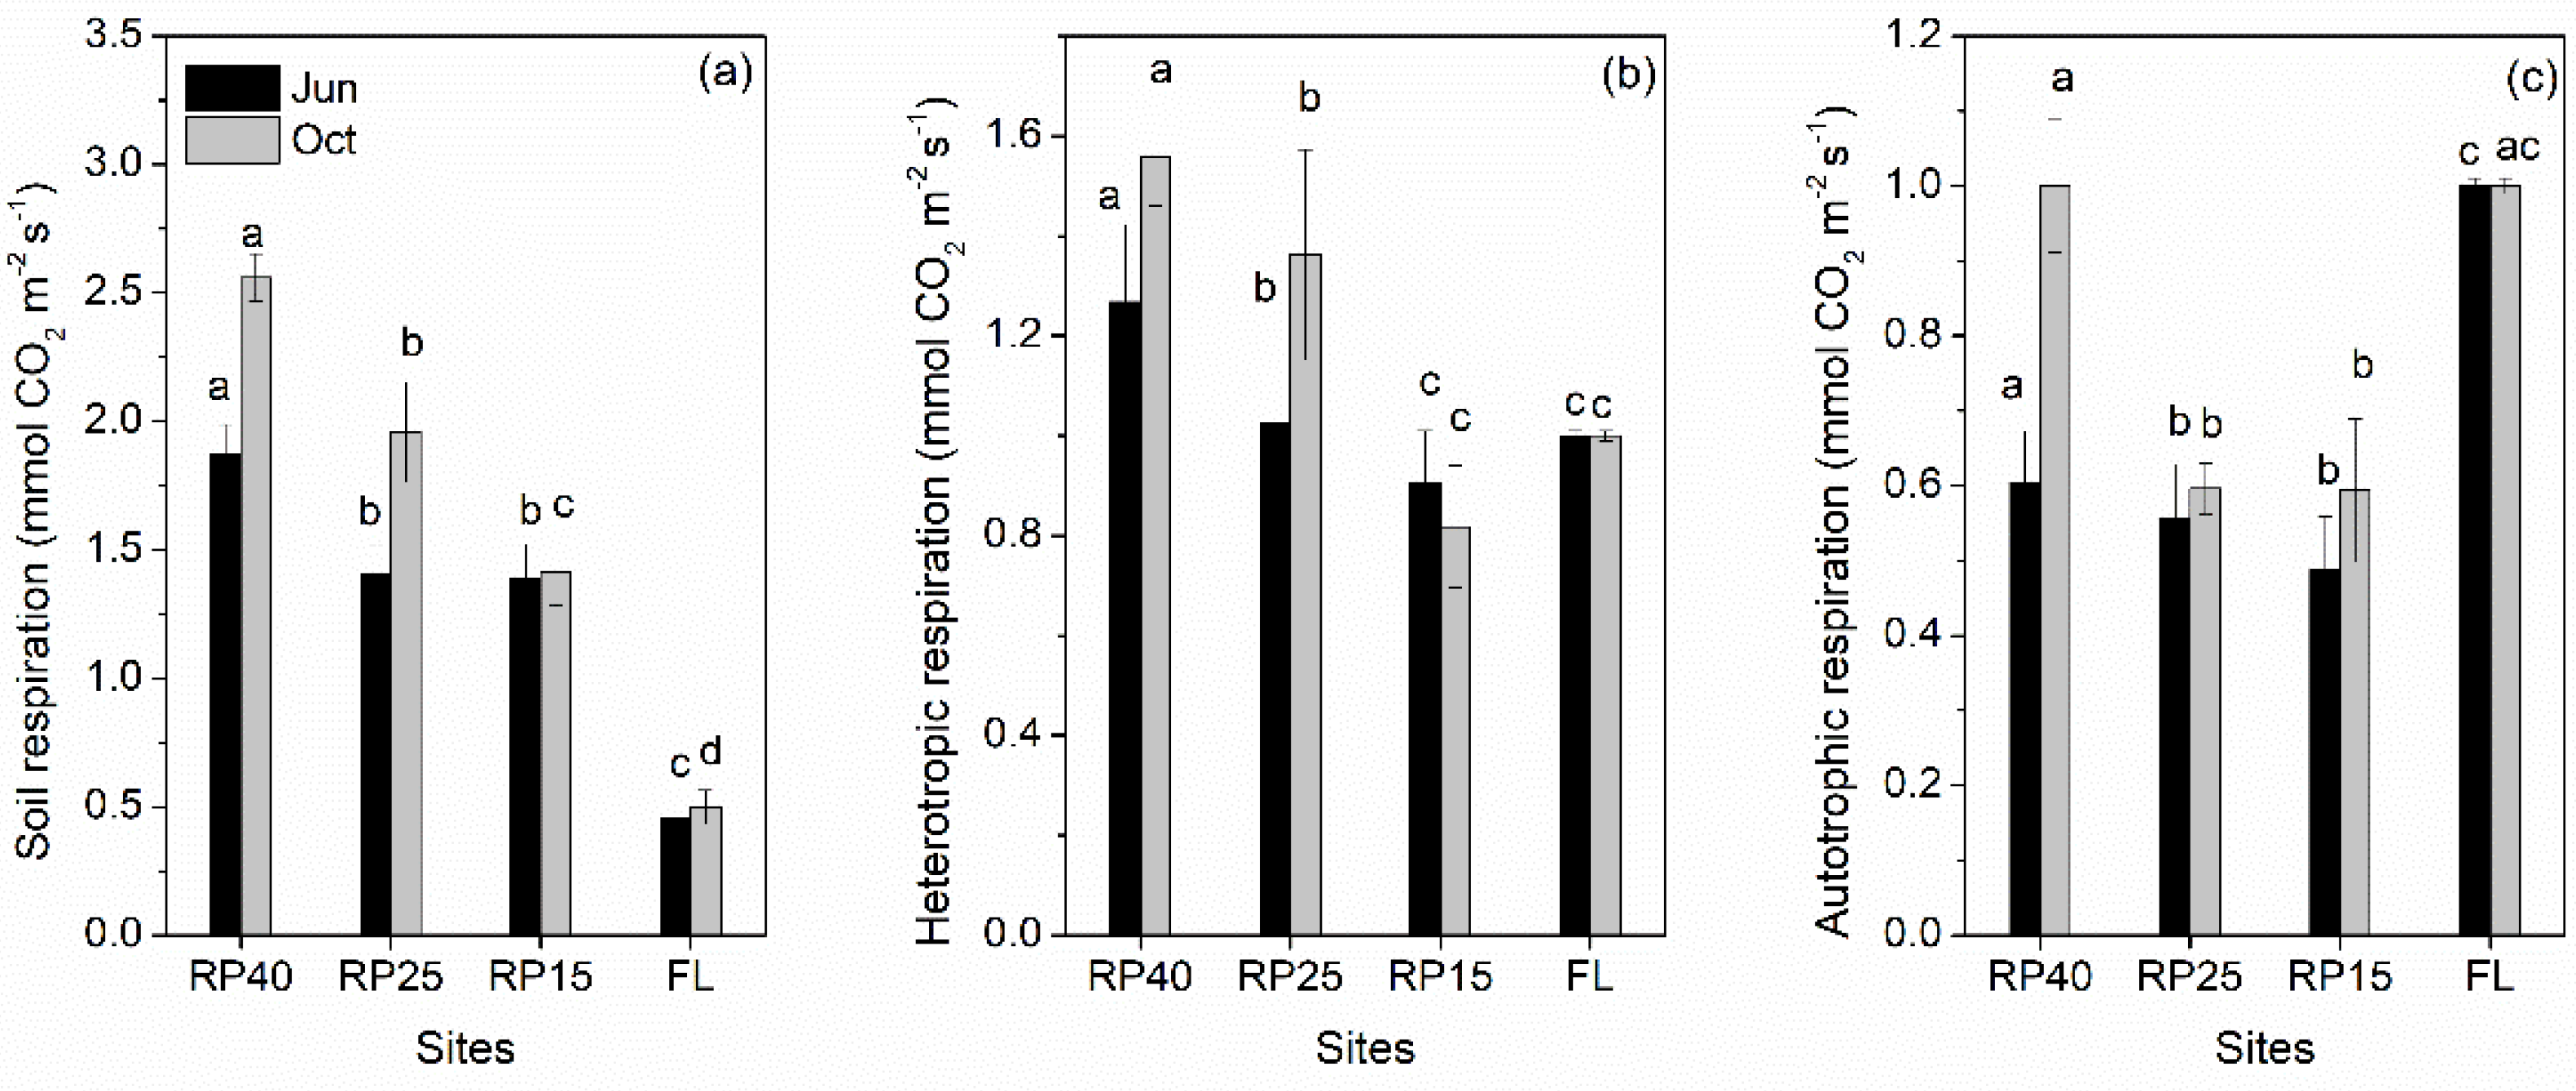
3.2. Changes in Soil Respiration and Its Components after Afforestation

Significant differences were found in SR, HR, and AR (Figure 3). SR at RP40, RP25, and RP15 was significantly higher than that in FL in June and in October. HR increased as aggradation progressed at afforested sites, with HR at RP40 being 23.68% and 40.06% higher than that at RP25 and RP15 in June, and 14.46% and 90.56% higher in October, respectively. Meanwhile, AR increased following afforestation and yielded average values of 0.54 μmol CO2 m−2 s−1 in June and 0.73 μmol CO2 m−2 s−1 in October.

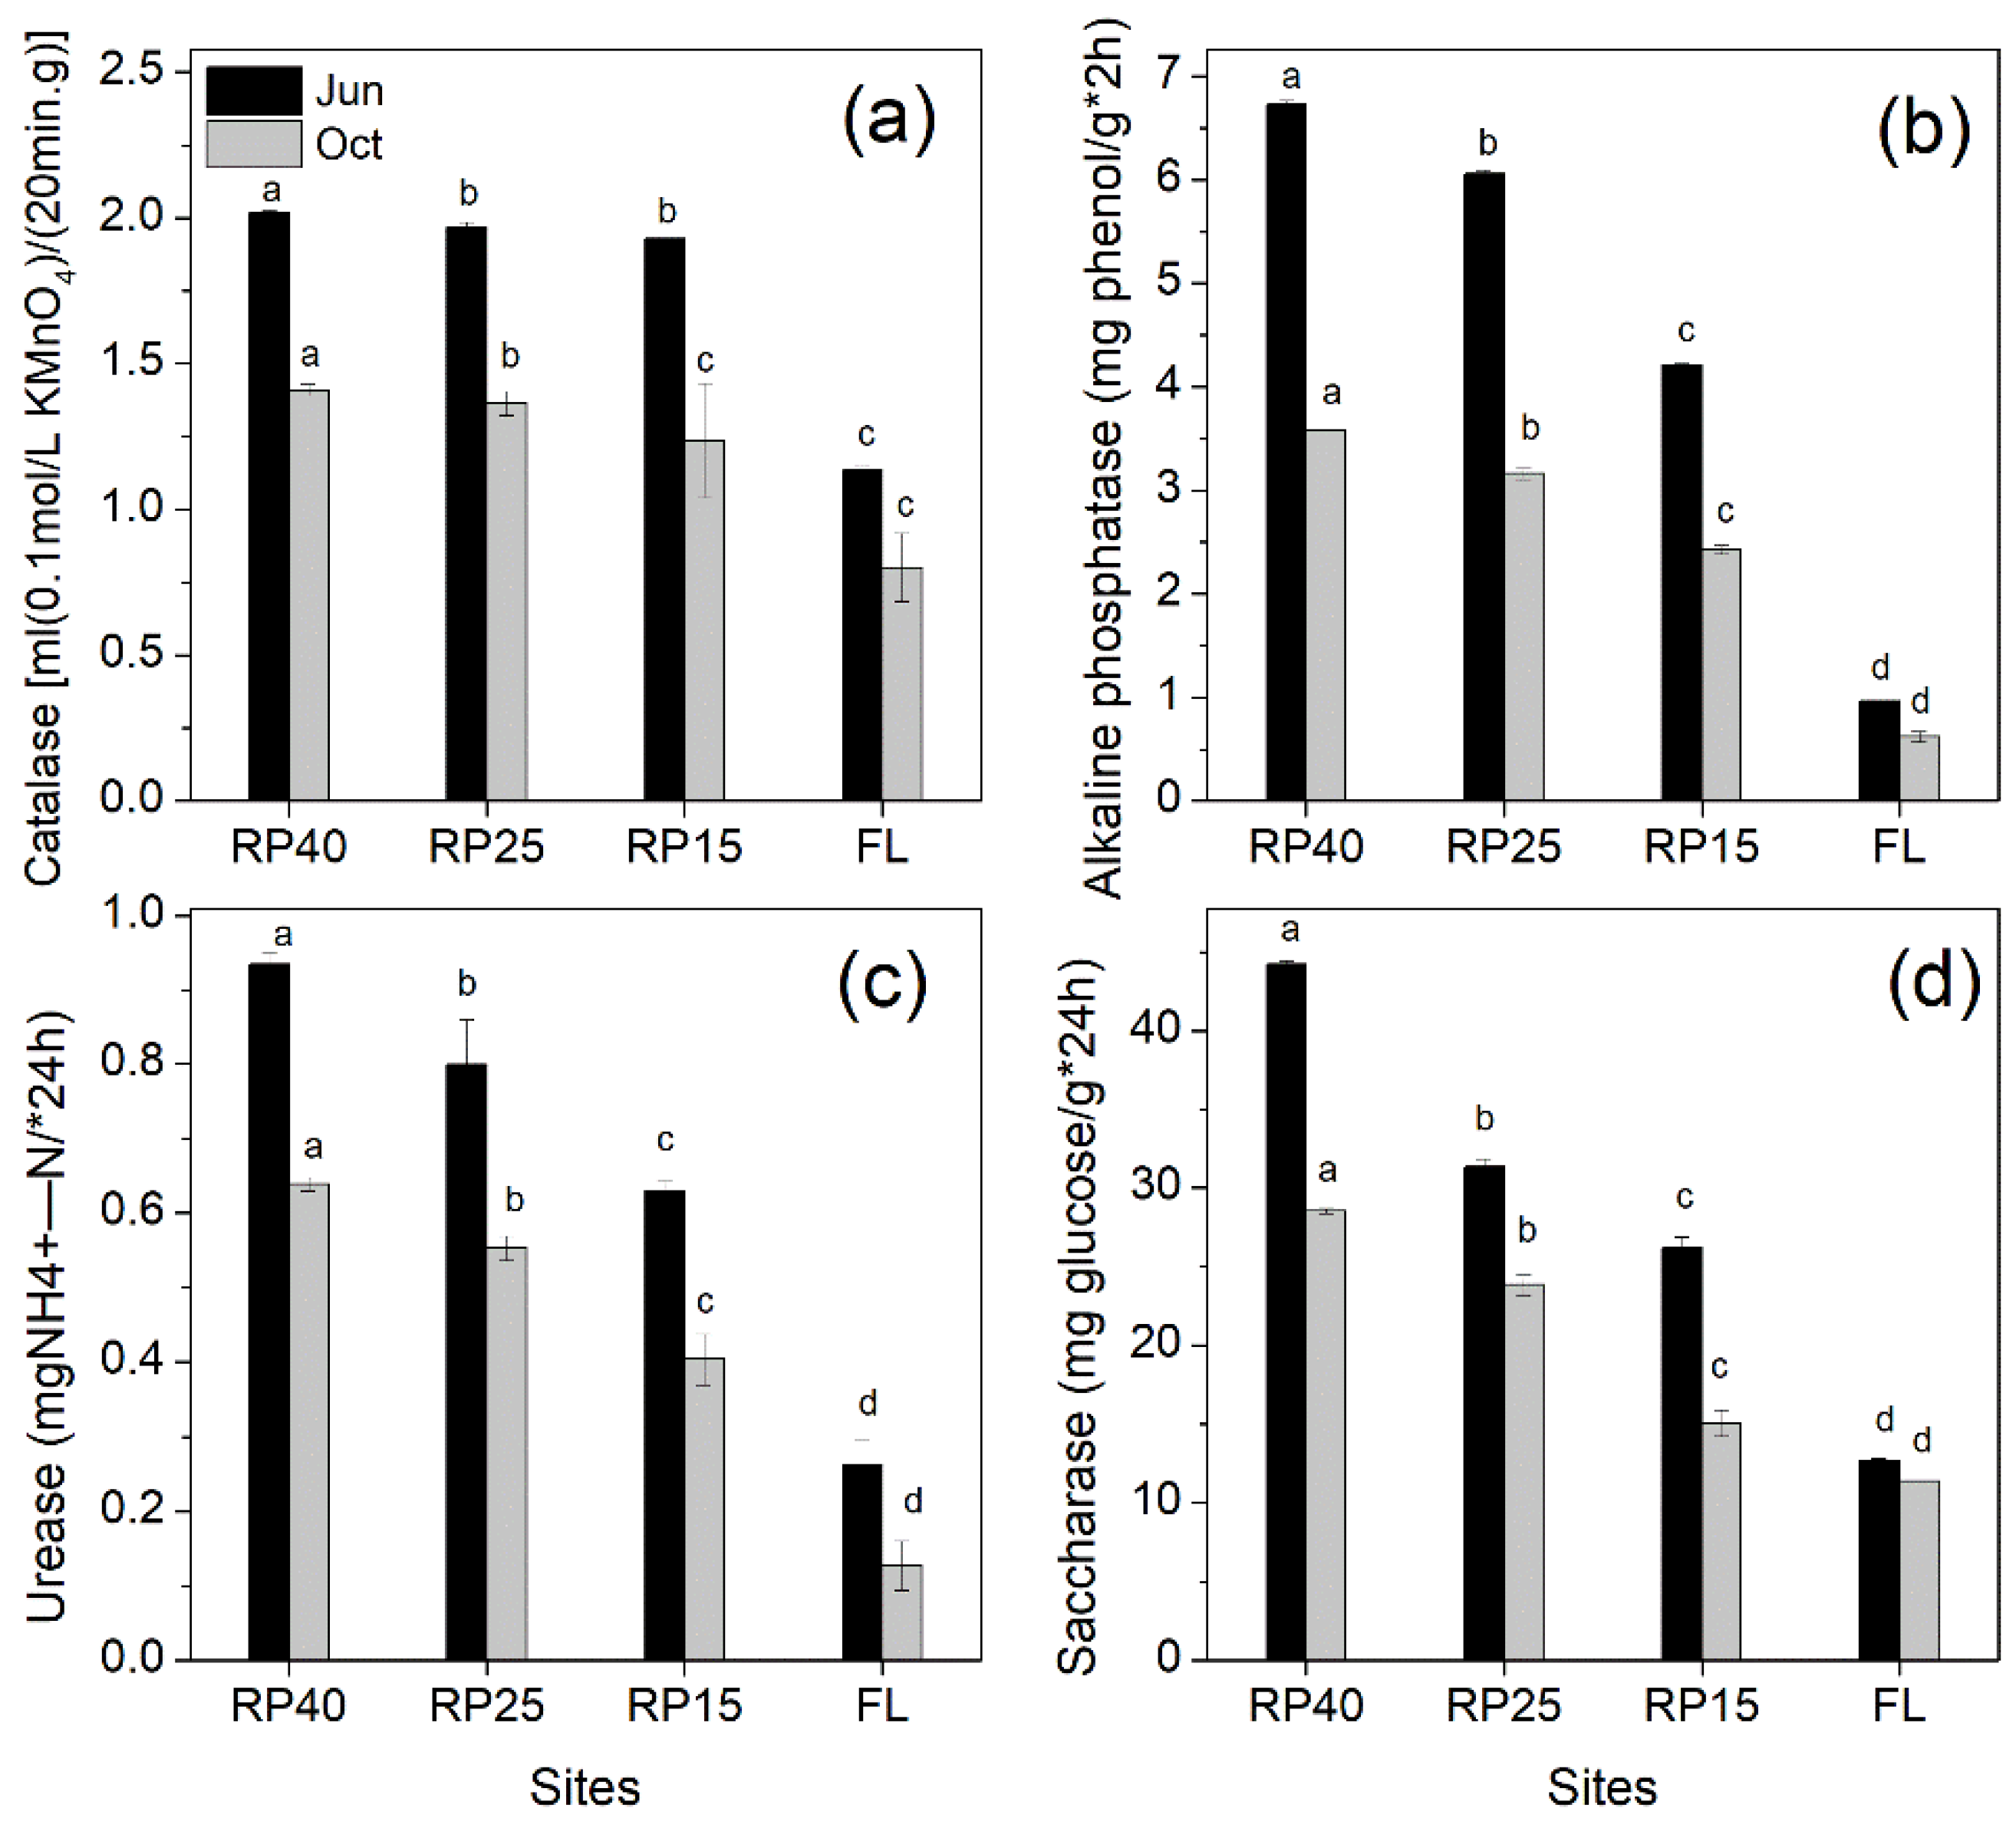
3.3. Changes in Soil Enzyme Activities after Afforestation

Changes in soil enzyme activities are shown in Figure 4. Catalase, saccharase, urease, and alkaline phosphatase contents increased following afforestation. For example, catalase, alkaline phosphatase, urease, and saccharase activities at RP40 were higher than at RP25 in June and October, respectively. Catalase, alkaline phosphatase, urease, and saccharase activities at RP25 were higher than those at RP15 in June and October, respectively. Compared with FL, the average increases of catalase, alkaline phosphatase, urease, and saccharase activities in RP sites were higher in June and October.

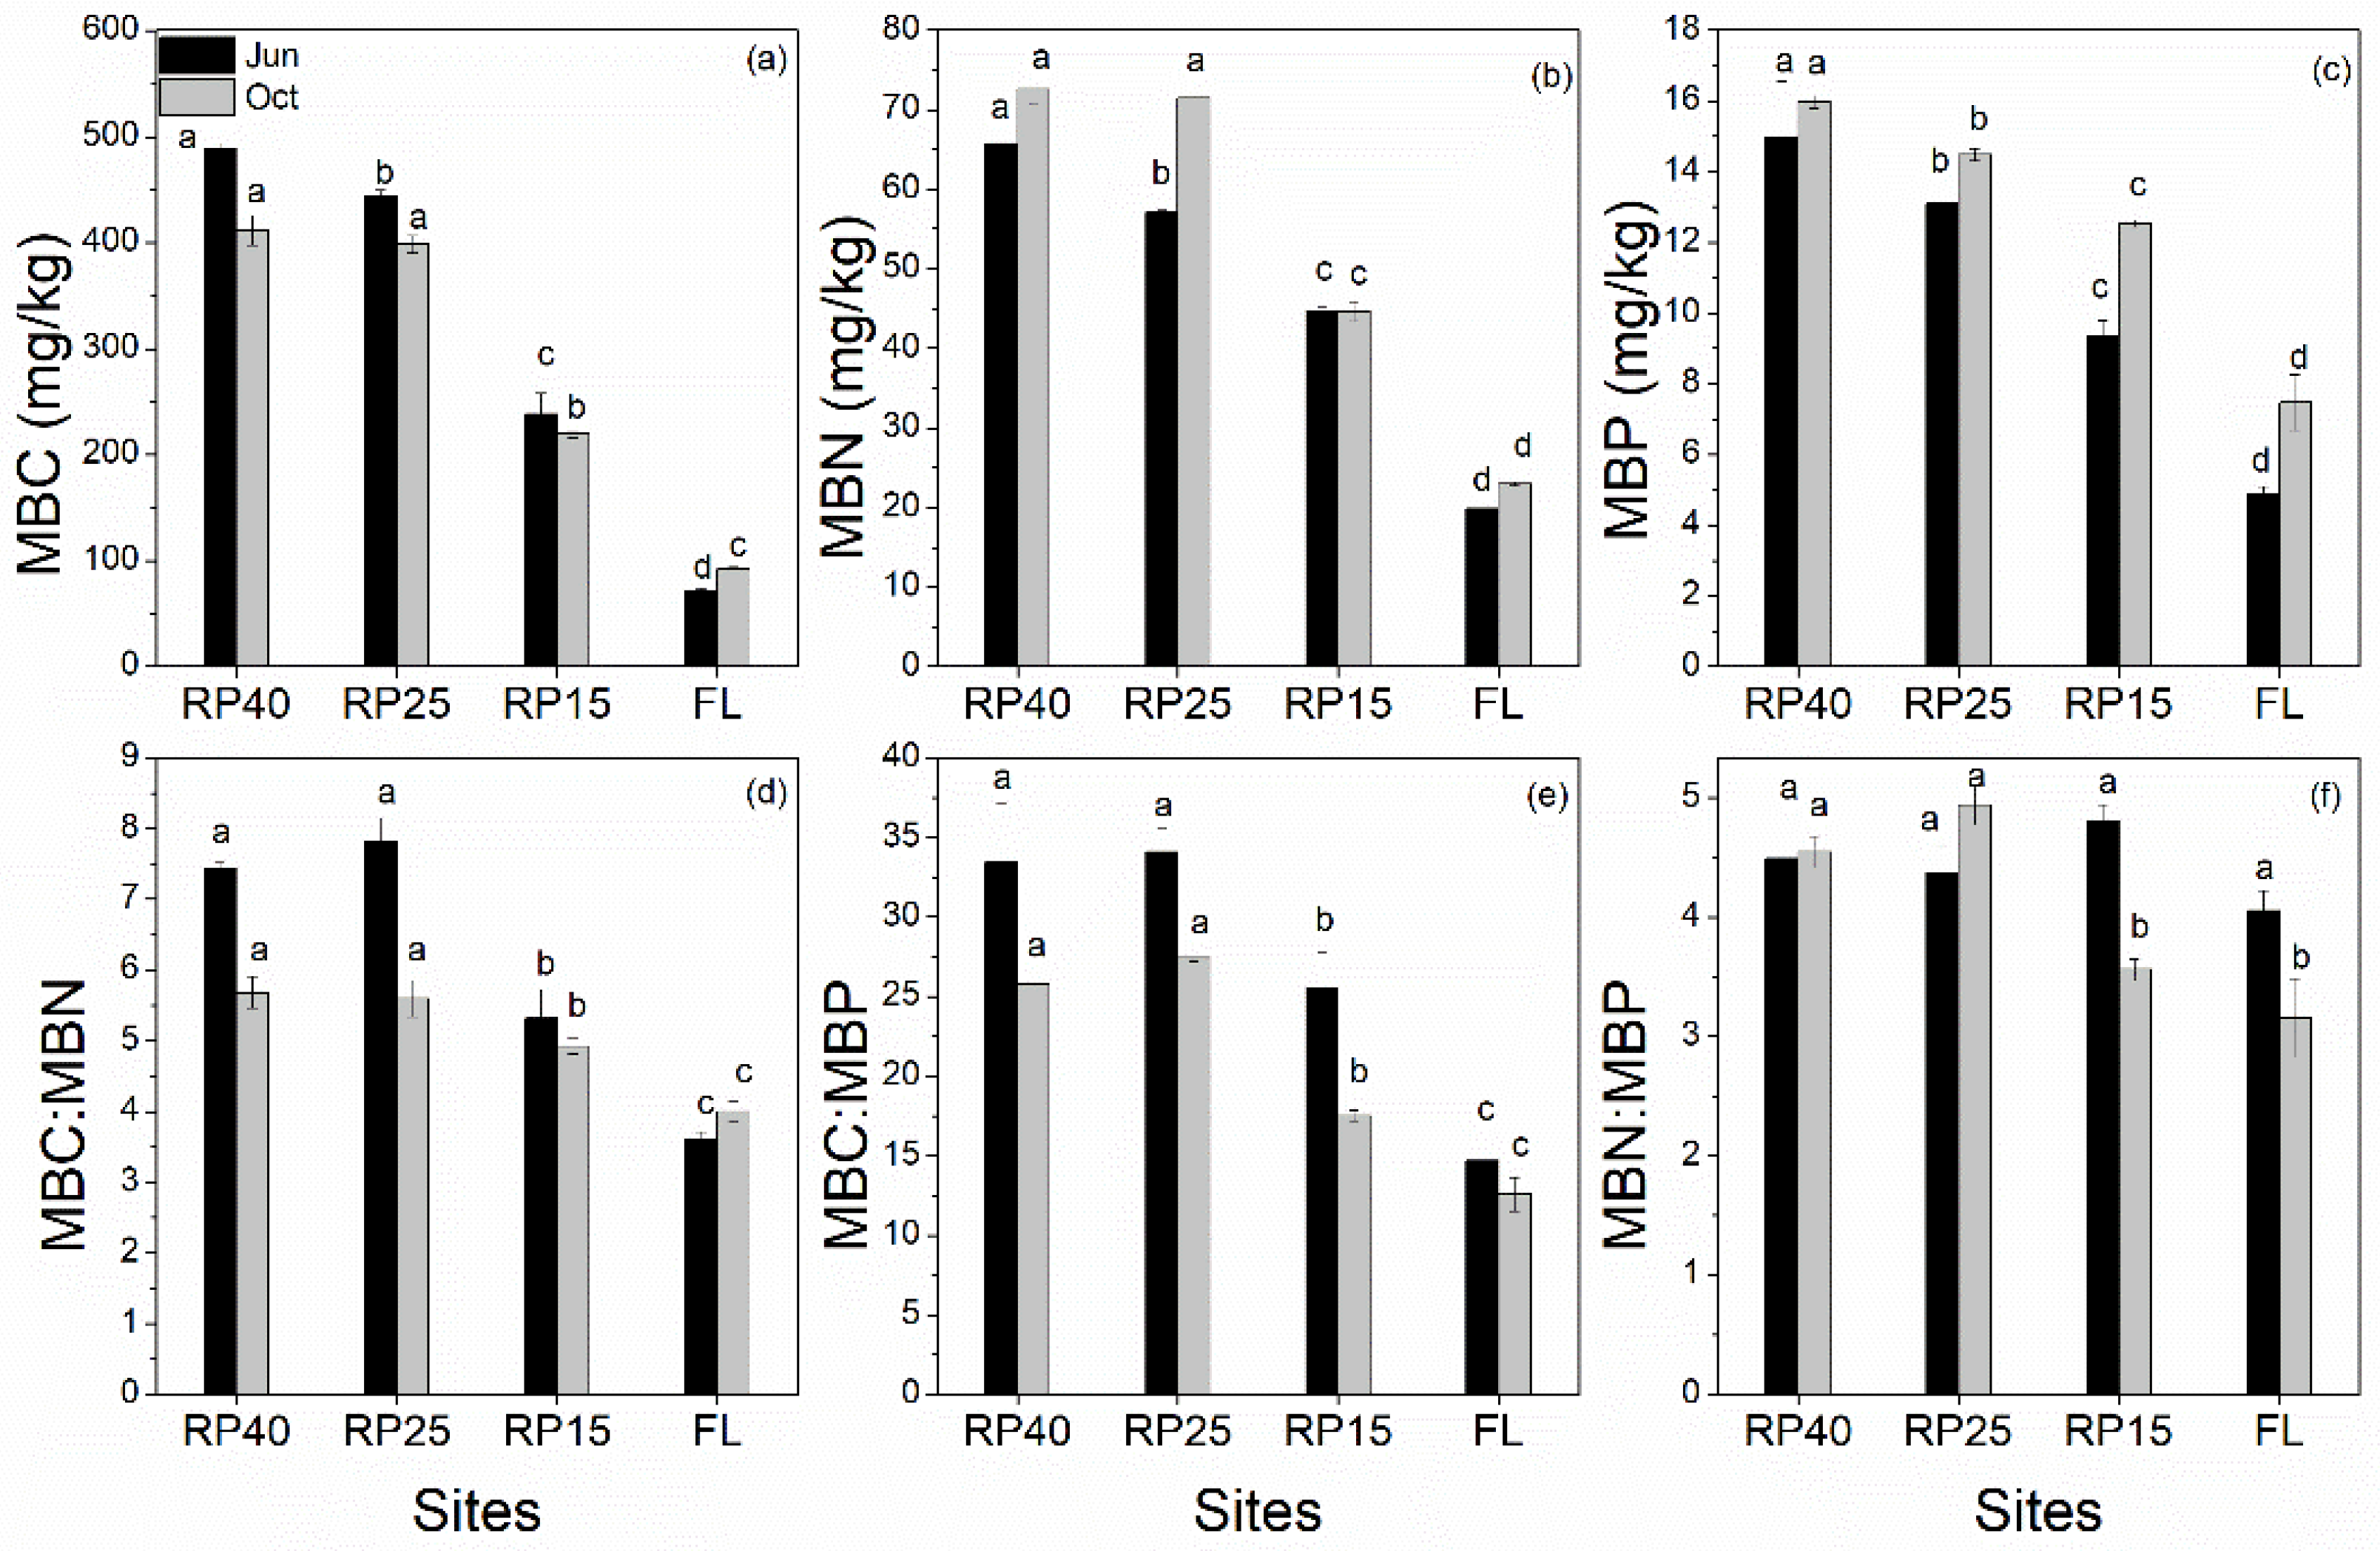
3.4. Changes in Soil Microbial Biomass C, N, and P Contents and Its Stoichiometry after Afforestation

Soil microbial biomass C, N, and P contents and its stoichiometry responded differently during aggradation at the afforested sites (Figure 5). The results showed that MBC, MBN, and MBP contents increased significantly at RP40, compared with FL, by 581.7%, 231.5%, and 204.9% in June, and 347.1%, 215.2%, and 113.8% in October, respectively. Further, MBC, MBN, and MBP contents at RP40 were higher than at RP25 and RP15 by approximately 57.62%, 30.90%, and 36.99% in June, and 45.44%, 32.02%, and 18.79% in October, respectively. In addition, MBC:MBN, MBC:MBP, and MBN:MBP ratios were also significantly higher after afforestation. Compared with FL, MBC:MBN, MBC:MBP, and MBN:MBP ratios at RP40 were higher by 105.7%, 127.8%, and 10.69% in June, and 41.96%, 105.4%, and 44.16% in October, respectively. However, among the afforested sites, there were no significant trends observed in these ratios.

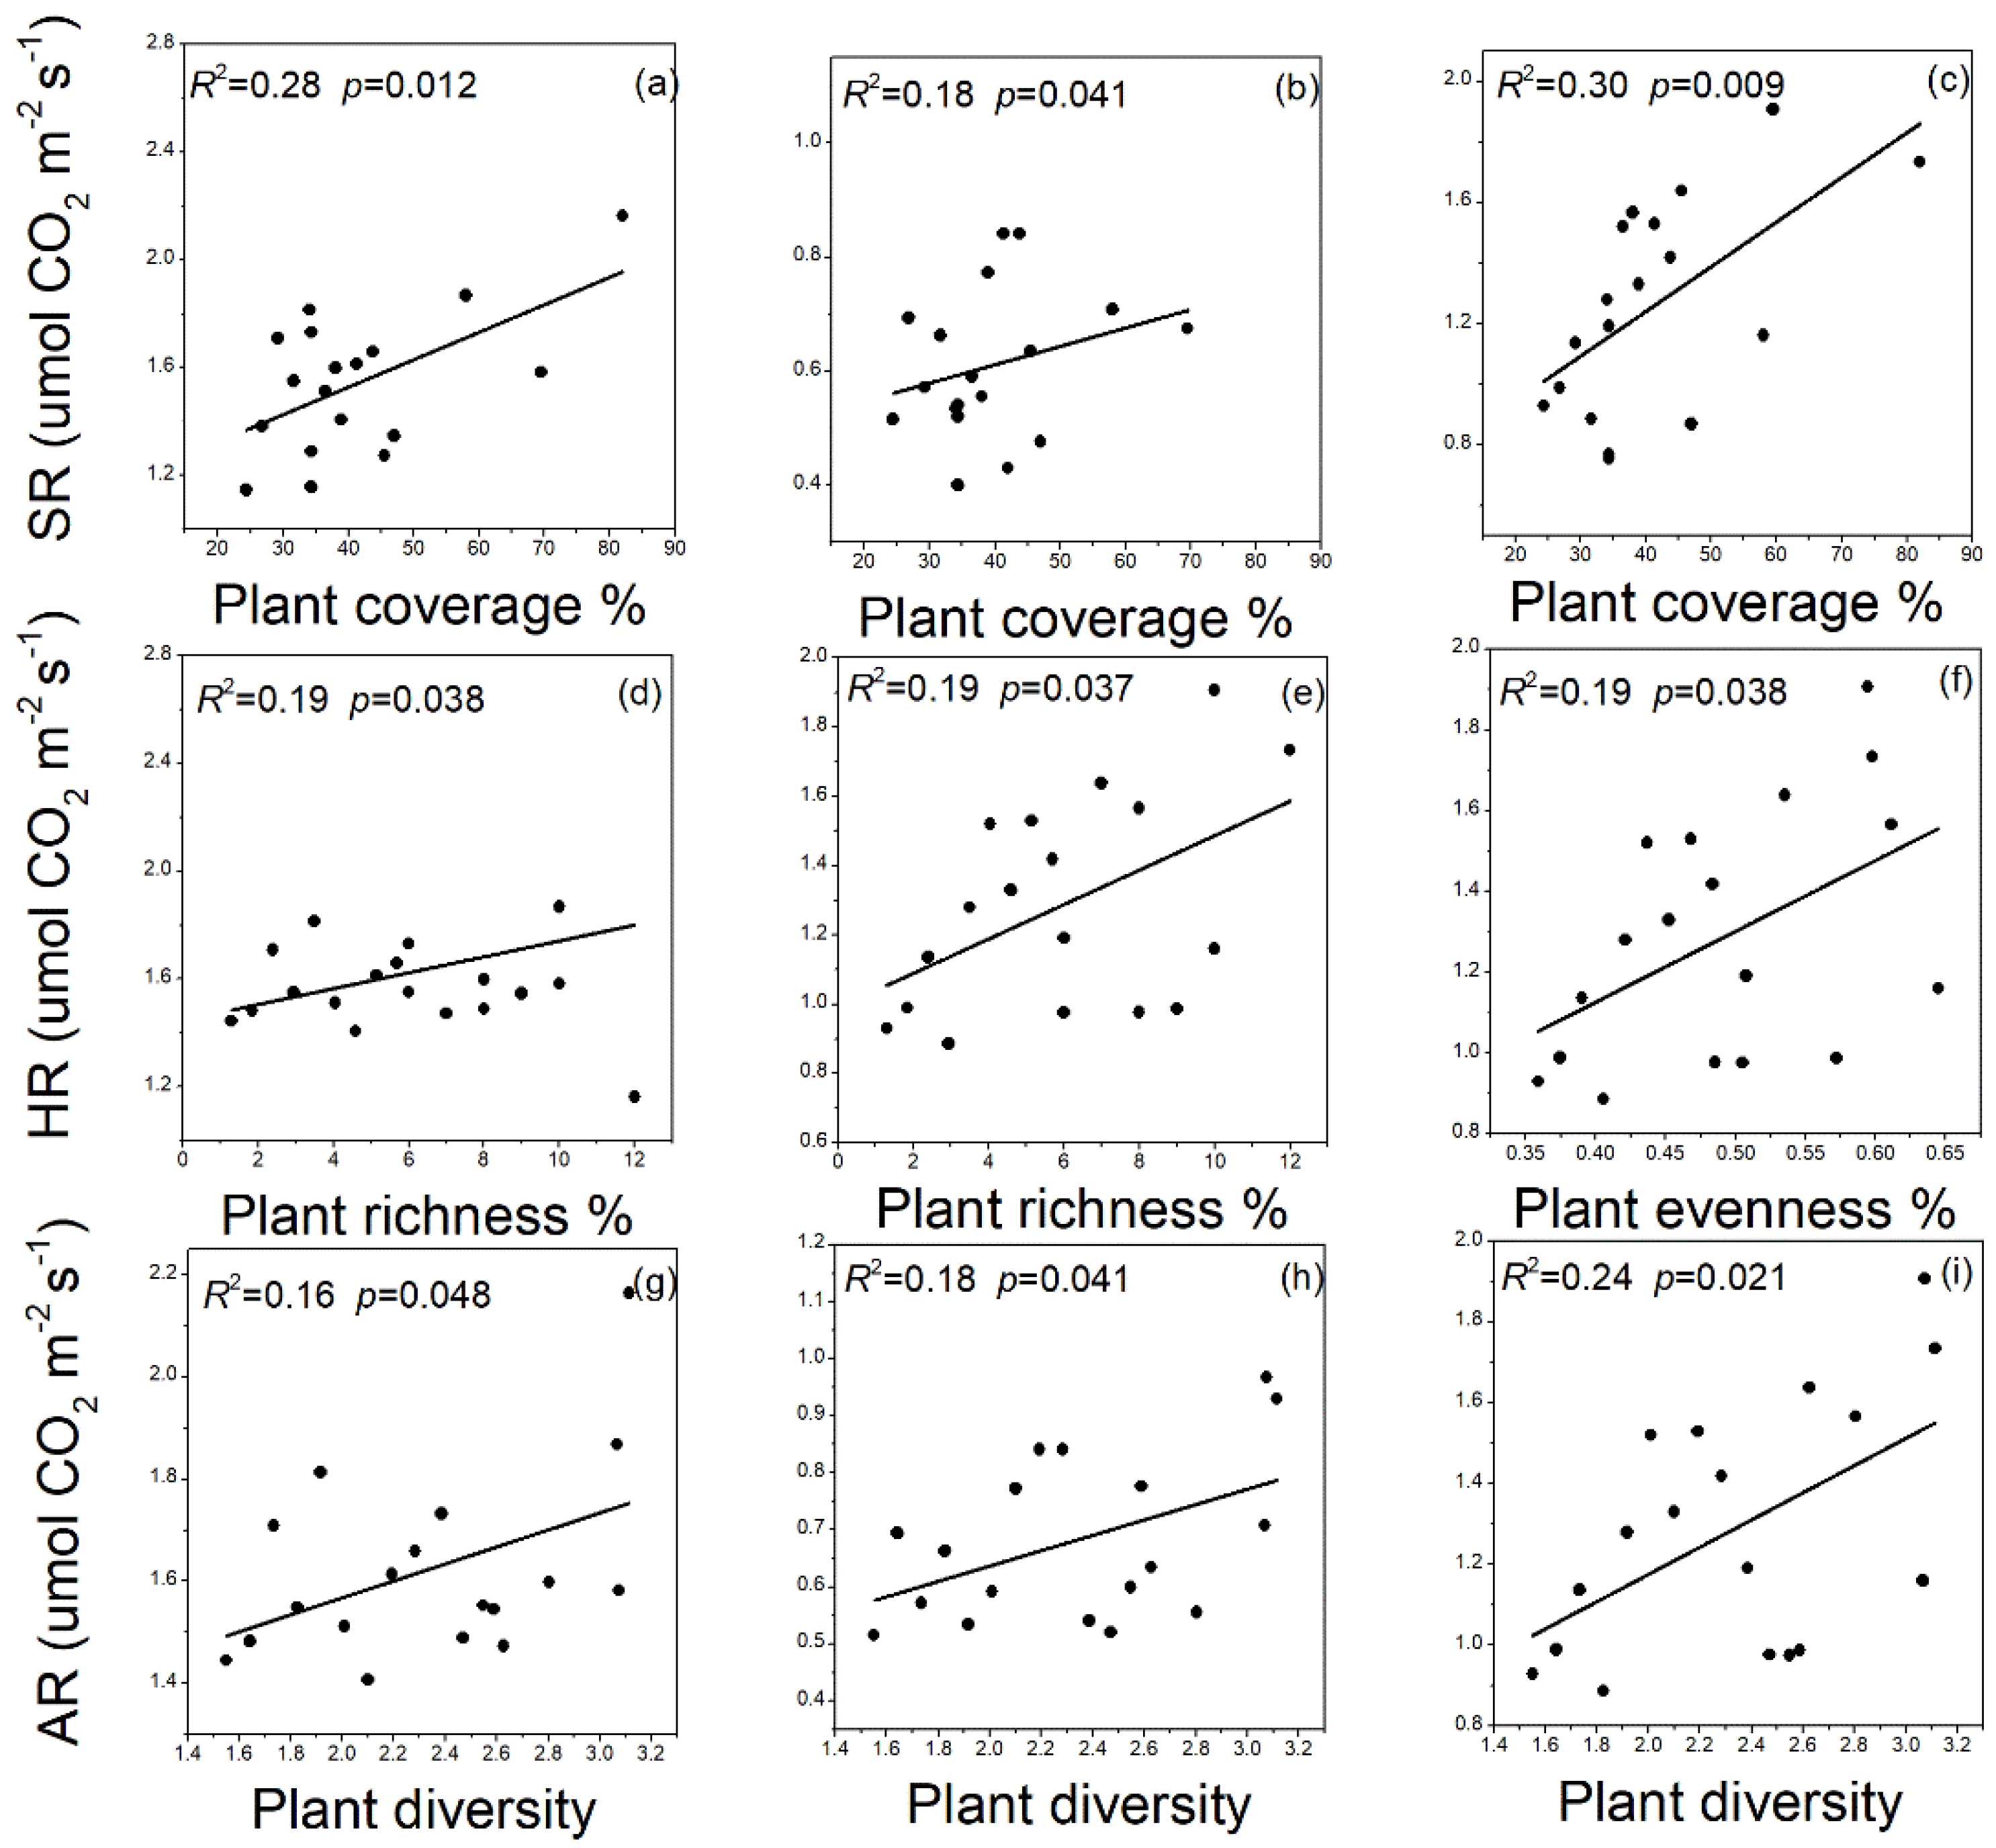
3.5. Relationships between Plant and SR Linked to Microbial Biomass C, N, and P Contents and Its Stoichiometry and Soil Enzyme Activities after Afforestation

Spearman’s rank correlation coefficients also showed significant relationships among microbial biomasses (C, N, and P), their stoichiometries, soil enzyme activities, and soil respiration components (Table 3). Linear regression results were observed between most of these parameters (p < 0.05) (Figure 6), especially for plant coverage (Table 4). The results showed that changes in SR and its components were significantly correlated with catalase, saccharase, urease, alkaline phosphatase, and microbial biomass C, N, and P contents, and MBC:MBN, MBC:MBP, and MBN:MBP ratios (p < 0.05). In addition, after performing a “best” model building procedure, we found that urease, MBP, and MBC:MBP ratio were the best predictive factors influencing SR (Table 5).

4. Discussion

In line with our expectations, plant diversity and coverage significantly influenced SR across our study sites. The most important factors influencing SR were changes in C inputs into soil [7]. These changes in C inputs have been observed by species diversity experiments in grasslands, which documented that more diverse grasslands were more productive [42], and that C inputs further stimulated SR. However, increased plant diversity also showed increased use efficiency [1]. This reduction in N concentration in the soil organic matter may negatively affect SR, including AR and HR [10,13]. On the other hand, understory plant characteristics can have important and diverse effects on soil properties, microclimates, and SR [2]. In particular, the effects of plants on soil temperature and water content are important, because they are drivers of microbial activity and SR [43,44]. For example, a previous study showed that plant canopies often reduce ground level radiation and soil evaporation rates, resulting in lower soil temperature and greater soil moisture content [45]. Therefore, a higher availability of plant-derived resources has a strong and positive affect on SR following afforestation.
The effects of plant diversity on SR may be more pronounced in the presence of soil enzymes [46], which is consistent with our result that species richness mediate soil respiration, partly through changes in soil enzyme activities. Several previous studies also supported our result that soil enzyme activity might significantly affect SR in terrestrial ecosystems [47,48]. For example, Chen [15] reported that changes in microbial enzymatic activities might be the basically drivers of SR, because more than 50% of SR is came from enzyme-related decomposition of litter and SOM. Ren [9] observed that C-degrading extracellular enzyme activities were significantly correlated with SR. A possible explanation was that the litter inputs during afforestation not only provide the building blocks for enzymatic production, because enzymes are basically N-rich molecules, but also increase microbial C demands due to stoichiometry of microbial biomass nutrients [49]. Consequently, increases in microbial C demands were expected to be alleviated by promoting the activities of C-degrading enzymes, influencing SR [50].
More importantly, soil microbial biomass C, N, and P content and its stoichiometry increased significantly with increasing plant diversity in both months of our study. These findings were consistent with previous studies, which showed that the positive effects of plant diversity on soil microbial biomass and functions led to changes in SR [25,51]. In particular, HR came from the microbial decomposition of root exudates in the rhizosphere. Increased microbial biomass C, N, and P content and its stoichiometry could augment labile soil carbon [52,53], alter microbial communities [9,10], or increase soil moisture [6,54], all of which can impact SR. However, our results contrasted with those of Cong [4] who reported that no significant difference was observed in SR between plant community traits and species richness. This was probably a consequence of the low soil fertility and dry conditions at the time of sampling in their experiment [4]. Therefore, plant species diversity may exceed plant production as a driver of the shifts in soil microbial biomass and stoichiometry in the long term by providing more diverse plant-derived resources, and thus, potentially influence SR. In addition, the species composition of plant communities influences microbial biomass C, N, and P content and stoichiometry, which can lead to changes in microbial bioenergetics and qCO2. Consequently, changes in these factors influence SR, especially microbial respiration. This conclusion was supported by a previous study that reported the qCO2 increase with soil and litter carbon to nutrient ratios and underlying stoichiometric controls [55], which may be because microbes in soils with lower microbial C:N ratios have higher growth efficiency and lower release of C through respiration. Conversely, microbes in soils with higher microbial C:N ratios have more C available to be converted into biomass [56,57,58,59]. Therefore, changes in plant communities influences the soil microbial C, N, and P stoichiometry, and are important drivers of the trends in microbial bioenergetics and respiration rates of soil microorganisms per unit microbial biomass.
In summary, understory vegetation affects SR through many mechanisms. However, the most important factor is the quantity and quality of organic inputs into the soil from plants. Our results indicate that plants regulate C dynamics through changes in soil enzyme activities and microbial biomass C, N, and P content and stoichiometry. This study has highlighted the role of plants within the plant-soil system, and the fact that plants are necessary for better understanding and simulating the patterns of SR across terrestrial ecosystems.

5. Conclusions

Our study showed that changes in understory plant community traits (coverage, evenness, diversity, and richness), soil respiration and its components, the activities of four enzymes (catalase, saccharase, urease, and alkaline phosphatase), and soil microbial biomass C, N, and P contents and its stoichiometry were significantly driven by afforestation and the aggradation of afforested sites. Plant community traits mediated SR through changes in soil enzyme activities and soil microbial biomass C, N, and P contents and its stoichiometry. Therefore, our results highlight the importance of understory plant community traits in regulating belowground carbon dynamics, and suggested that plant traits, especially plant coverage, altered the components of soil respiration by affecting soil enzyme activities and soil microbial biomass C, N, and P contents and its stoichiometry.

Author Contributions

L.Z., C.R., X.H., G.Y. conceived and designed the experiment. J.W. and F.Z. performed data analysis and wrote the manuscript. F.Z., J.W., L.Z., C.R. and J.D. conducted the sampling, pre-treatment and experiment work. R.D. revised the English grammar.

Funding

This work was supported by The National Natural Science Foundation of China (Grants: 41601578) and by the Key Laboratory of Degraded and Unused Land Consolidation Engineering, Ministry of Land and Resources (Grants: SXDJ2018-02).

Acknowledgments

We thank Zi ting Wang help us plot figure.

Conflicts of Interest

The authors declare no competing financial interest.

References

  1. Fornara, D.A.; Tilman, D. Plant functional composition influences rates of soil carbon and nitrogen accumulation. J. Ecol. 2008, 96, 314–322. [Google Scholar] [CrossRef] [Green Version]
  2. Metcalfe, D.B.; Fisher, R.A.; Wardle, D.A. Plant communities as drivers of soil respiration: Pathways, mechanisms, and significance for global change. Biogeosciences 2011, 8, 2047–2061. [Google Scholar] [CrossRef]
  3. Schlesinger, W.H.; Andrews, J.A. Soil respiration and the global carbon cycle. Biogeochemistry 2000, 48, 7–20. [Google Scholar] [CrossRef]
  4. Cong, W.F.; Ruijven, J.V.; Werf, W.V.D.; Deyn, G.B.D.; Mommer, L.; Berendse, F.; Hoffland, E. Plant species richness leaves a legacy of enhanced root litter-induced decomposition in soil. Soil. Biol. Biochem. 2015, 80, 341–348. [Google Scholar] [CrossRef]
  5. Fang, H.; Cheng, S.; Wang, Y.; Yu, G.; Xu, M.; Dang, X.; Li, L.; Wang, L. Changes in soil heterotrophic respiration, carbon availability, and microbial function in seven forests along a climate gradient. Ecol. Res. 2014, 29, 1077–1086. [Google Scholar] [CrossRef]
  6. Jewell, M.D.; Shipley, B.; Low-Décarie, E.; Tobner, C.M.; Paquette, A.; Messier, C.; Reich, P.B. Partitioning the effect of composition and diversity of tree communities on leaf litter decomposition and soil respiration. Oikos 2017, 126, 959–971. [Google Scholar] [CrossRef]
  7. Janssens, I.A.; Lankreijer, H.; Matteucci, G.; Kowalski, A.S.; Buchmann, N.; Epron, D.; Pilegaard, K.; Kutsch, W.; Longdoz, B.; Grünwald, T. Productivity overshadows temperature in determining soil and ecosystem respiration across European forests. Glob. Chang. Biol. 2001, 7, 269–278. [Google Scholar] [CrossRef]
  8. Esch, E.H.; Lipson, D.; Cleland, E.E. Direct and indirect effects of shifting rainfall on soil microbial respiration and enzyme activity in a semi-arid system. Plant Soil 2016, 411, 333–346. [Google Scholar] [CrossRef] [Green Version]
  9. Ren, C.; Zhao, F.; Shi, Z.; Chen, J.; Han, X.; Yang, G.; Feng, Y.; Ren, G. Differential responses of soil microbial biomass and carbon-degrading enzyme activities to altered precipitation. Soil Biol. Biochem. 2017, 115, 1–10. [Google Scholar] [CrossRef]
  10. Xiao, H.; Li, Z.; Dong, Y.; Chang, X.; Deng, L.; Huang, J.; Nie, X.; Liu, C.; Liu, L.; Wang, D.; et al. Changes in microbial communities and respiration following the revegetation of eroded soil. Agric. Ecosyst. Environ. 2017, 246, 30–37. [Google Scholar] [CrossRef]
  11. Craine, J.M.; Wedin, D.A.; Reich, P.B. The response of soil CO2 flux to changes in atmospheric CO2, nitrogen supply and plant diversity. Glob. Chang. Biol. 2001, 7, 947–953. [Google Scholar] [CrossRef]
  12. Johnson, D.; Phoenix, G.K.; Grime, J.P. Plant community composition, not diversity, regulates soil respiration in grasslands. Biol. Lett. 2008, 4, 345–348. [Google Scholar] [CrossRef] [PubMed] [Green Version]
  13. Dias, A.T.C.; Ruijven, J.V.; Berendse, F. Plant species richness regulates soil respiration through changes in productivity. Oecologia 2010, 163, 805–813. [Google Scholar] [CrossRef] [PubMed] [Green Version]
  14. Liu, M.; Xia, H.; Fu, S.; Eisenhauer, N. Tree diversity regulates soil respiration through accelerated tree growth in a mesocosm experiment. Pedobiologia 2017, 65, 24–28. [Google Scholar] [CrossRef]
  15. Chen, J.; Luo, Y.; Li, J.; Zhou, X.; Cao, J.; Wang, R.W.; Wang, Y.; Shelton, S.; Jin, Z.; Walker, L.M.; et al. Costimulation of soil glycosidase activity and soil respiration by nitrogen addition. Glob. Chang. Biol. 2017, 23, 1328–1337. [Google Scholar] [CrossRef] [PubMed]
  16. Chen, J.; Zhou, X.; Hruska, T.; Cao, J.; Zhang, B.; Liu, C.; Liu, M.; Shelton, S.; Guo, L.; Wei, Y.; et al. Asymmetric Diurnal and Monthly Responses of Ecosystem Carbon Fluxes to Experimental Warming. CLEAN-Soil Air Water 2017, 45, 1600557. [Google Scholar] [CrossRef]
  17. Waldrop, M.P.; Zak, D.R.; Sinsabaugh, R.L. Microbial community response to nitrogen deposition in northern forest ecosystems. Soil Biol. Biochem. 2004, 36, 1443–1451. [Google Scholar] [CrossRef]
  18. Shahzad, T.; Chenu, C.; Genet, P.; Barot, S.; Perveen, N.; Mougin, C.; Fontaine, S. Contribution of exudates, arbuscular mycorrhizal fungi and litter depositions to the rhizosphere priming effect induced by grassland species. Soil Biol. Biochem. 2015, 80, 146–155. [Google Scholar] [CrossRef]
  19. Liang, C.; Schimel, J.P.; Jastrow, J.D. The importance of anabolism in microbial control over soil carbon storage. Nat. Microbiol. 2017, 2, 17105. [Google Scholar] [CrossRef] [PubMed]
  20. Devaraju, N.; Bala, G.; Caldeira, K.; Nemani, R. A model based investigation of the relative importance of CO2-fertilization, climate warming, nitrogen deposition and land use change on the global terrestrial carbon uptake in the historical period. Clim. Dynam. 2015, 8, 1–18. [Google Scholar] [CrossRef]
  21. Zhou, L.; Zhou, X.; Zhang, B.; Lu, M.; Luo, Y.; Liu, L.; Li, B. Different responses of soil respiration and its components to nitrogen addition among biomes: A meta-analysis. Glob. Chang. Biol. 2014, 20, 2332–2343. [Google Scholar] [CrossRef] [PubMed]
  22. Ren, C.; Wang, T.; Xu, Y.; Deng, J.; Zhao, F.; Yang, G.; Han, X.; Feng, Y.; Ren, G. Differential soil microbial community responses to the linkage of soil organic carbon fractions with respiration across land-use changes. For. Ecol. Manag. 2018, 409, 170–178. [Google Scholar] [CrossRef]
  23. Raich, J.W.; Tufekciogul, A. Vegetation and soil respiration: Correlations and controls. Biogeochemistry 2000, 48, 71–90. [Google Scholar] [CrossRef]
  24. Igor, N.; Aliaksra, R.; Alyona, S.; Evgeniy, L.; Vadim, Z.; Vladimir, P.; Rakovich, Y.P.; Donegan, J.F.; Rubin, A.B.; Govorov, A.O. Consequences of biodiversity loss for litter decomposition across biomes. Nature 2014, 509, 218–221. [Google Scholar] [Green Version]
  25. Eisenhauer, N.; Bessler, H.; Engels, C.; Gleixner, G.; Habekost, M.; Milcu, A.; Partsch, S.; Sabais, A.C.; Scherber, C.; Steinbeiss, S. Plant diversity effects on soil microorganisms support the singular hypothesis. Ecology 2010, 91, 485–496. [Google Scholar] [CrossRef] [PubMed]
  26. Aponte, C.; Marañón, T.; García, L.V. Microbial C, N and P in soils of Mediterranean oak forests: influence of season, canopy cover and soil depth. Biogeochemistry 2010, 101, 77–92. [Google Scholar] [CrossRef] [Green Version]
  27. Heuck, C.; Weig, A.; Spohn, M. Soil microbial biomass C:N:P stoichiometry and microbial use of organic phosphorus. Soil Biol. Biochem. 2015, 85, 119–129. [Google Scholar] [CrossRef]
  28. Cleveland, C.C.; Liptzin, D. C:N:P stoichiometry in soil: is there a “Redfield ratio” for the microbial biomass? Biogeochemistry 2007, 85, 235–252. [Google Scholar] [CrossRef]
  29. Achbergerová, L.; Nahálka, J. Polyphosphate-an ancient energy source and active metabolic regulator. Microb. Cell Fact. 2011, 10, 63. [Google Scholar] [CrossRef] [PubMed]
  30. Elser, J.J.; Sterner, R.W.; Gorokhova, E.; Fagan, W.F.; Markow, T.A.; Cotner, J.B.; Harrison, J.F.; Hobbie, S.E.; Odell, G.M.; Weider, L.W. Biological stoichiometry from genes to ecosystems. Ecol. Lett. 2010, 3, 540–550. [Google Scholar] [CrossRef]
  31. Bai, Z.; Dent, D. Recent land degradation and improvement in China. Ambio 2009, 38, 150–156. [Google Scholar] [CrossRef] [PubMed]
  32. Zhao, F.; Yang, G.; Han, X.; Feng, Y.; Ren, G. Stratification of carbon fractions and carbon management index in deep soil affected by the Grain-to-Green program in China. PLoS ONE 2014, 9, e99657. [Google Scholar] [CrossRef] [PubMed]
  33. Zhang, C.; Xue, S.; Liu, G.B.; Song, Z.L. A comparison of soil qualities of different revegetation types in the Loess Plateau, China. Plant Soil 2011, 347, 163–178. [Google Scholar] [CrossRef]
  34. Zhang, C.; Liu, G.; Xue, S.; Wang, G. Soil bacterial community dynamics reflect changes in plant community and soil properties during the secondary succession of abandoned farmland in the Loess Plateau. Soil Biol. Biochem. 2016, 97, 40–49. [Google Scholar] [CrossRef]
  35. Tian, Q.; Taniguchi, T.; Shi, W.Y.; Li, G.; Yamanaka, N.; Du, S. Land-use types and soil chemical properties influence soil microbial communities in the semiarid Loess Plateau region in China. Sci. Rep. 2017, 7, 45289. [Google Scholar] [CrossRef] [PubMed] [Green Version]
  36. Ren, C.; Sun, P.; Kang, D.; Zhao, F.; Feng, Y.; Ren, G.; Han, X.; Yang, G. Responsiveness of soil nitrogen fractions and bacterial communities to afforestation in the Loess Hilly Region (LHR) of China. Sci. Rep. 2016, 6, 28469. [Google Scholar] [CrossRef] [PubMed] [Green Version]
  37. Du, S.; Wang, Y.L.; Kume, T.; Zhang, J.G.; Otsuki, K.; Yamanaka, N.; Liu, G.B. Sapflow characteristics and climatic responses in three forest species in the semiarid Loess Plateau region of China. Agric. For. Meteorol. 2011, 151, 1–10. [Google Scholar] [CrossRef]
  38. Zhao, F.Z.; Zhang, L.; Ren, C.J.; Sun, J.; Han, X.H.; Yang, G.H.; Wang, J. Effect of microbial carbon, nitrogen, and phosphorus stoichiometry on soil carbon fractions under a black locust Forest within the central loess plateau of China. Soil Sci. Soc. Am. J. 2016, 80, 1520–1530. [Google Scholar] [CrossRef]
  39. Ren, C.; Zhao, F.; Kang, D.; Yang, G.; Han, X.; Tong, X.; Feng, Y.; Ren, G. Linkages of C:N:P stoichiometry and bacterial community in soil following afforestation of former farmland. For. Ecol. Manag. 2016, 376, 59–66. [Google Scholar] [CrossRef]
  40. Ren, C.; Kang, D.; Wu, J.P.; Zhao, F.; Yang, G.; Han, X.; Feng, Y.; Ren, G. Temporal variation in soil enzyme activities after afforestation in the Loess Plateau, China. Geoderma 2016, 282, 103–111. [Google Scholar] [CrossRef]
  41. Zhao, F.; Kang, D.; Han, X.; Yang, G.; Yang, G.; Feng, Y.; Ren, G. Soil stoichiometry and carbon storage in long-term afforestation soil affected by understory vegetation diversity. Ecol. Eng. 2015, 74, 415–422. [Google Scholar] [CrossRef]
  42. Hooper, D.U.; Chapin, F.S.; Ewel, J.J.; Hector, A.; Inchausti, P.; Lavorel, S.; Lawton, J.H.; Lodge, D.M.; Loreau, M.; Naeem, S. Effects of biodiversity on ecosystem functioning: A consensus of current knowledge. Ecol. Monogr. 2005, 75, 3–35. [Google Scholar] [CrossRef] [Green Version]
  43. Davidson, E.A.; Janssens, I.A. Temperature sensitivity of soil carbon decomposition and feedbacks to climate change. Nature 2006, 440, 165–173. [Google Scholar] [CrossRef] [PubMed] [Green Version]
  44. Chen, J.; Luo, Y.; Xia, J.; Shi, Z.; Jiang, L.; Niu, S.; Zhou, X.; Cao, J. Differential responses of ecosystem respiration components to experimental warming in a meadow grassland on the Tibetan Plateau. Agric. For. Meteorol. 2016, 220, 21–29. [Google Scholar] [CrossRef] [Green Version]
  45. Breshears, D.D.; Rich, P.M.; Barnes, F.J.; Campbell, K. Overstory-imposed heterogeneity in solar radiation and soil moisture in a semiarid woodland. Ecol. Appl. 1997, 7, 1201–1215. [Google Scholar] [CrossRef]
  46. Sinsabaugh, R.L.; Hill, B.H.; Follstad Shah, J.J. Ecoenzymatic stoichiometry of microbial organic nutrient acquisition in soil and sediment. Nature 2009, 462, 795–798. [Google Scholar] [CrossRef] [PubMed]
  47. Allison, S.D.; Wallenstein, M.D.; Bradford, M.A. Soil-carbon response to warming dependent on microbial physiology. Nat. Geosci. 2010, 3, 336–340. [Google Scholar] [CrossRef]
  48. Ali, R.S.; Ingwersen, J.; Demyan, M.S.; Funkuin, Y.N.; Wizemann, H.D.; Kandeler, E.; Poll, C. Modelling in situ activities of enzymes as a tool to explain seasonal variation of soil respiration from agro-ecosystems. Soil. Biol. Biochem. 2015, 81, 291–303. [Google Scholar] [CrossRef]
  49. Sistla, S.A.; Schimel, J.P. Seasonal patterns of microbial extracellular enzyme activities in an arctic tundra soil: Identifying direct and indirect effects of long-term summer warming. Soil Biol. Biochem. 2013, 66, 119–129. [Google Scholar] [CrossRef]
  50. Stone, M.M.; Deforest, J.L.; Plante, A.F. Changes in extracellular enzyme activity and microbial community structure with soil depth at the Luquillo Critical Zone Observatory. Soil Biol. Biochem. 2014, 75, 237–247. [Google Scholar] [CrossRef]
  51. Spehn, E.M.; Joshi, J.; Schmid, B.; Diemer, M.; Korner, C. Above-ground resource use increases with plant species richness in experimental grassland ecosystems. Funct. Ecol. 2000, 14, 326–337. [Google Scholar] [Green Version]
  52. Song, B.; Niu, S.; Zhang, Z.; Yang, H.; Li, L.; Wan, S. Light and heavy fractions of soil organic matter in response to climate warming and increased precipitation in a temperate steppe. PLoS ONE 2012, 7, e33217. [Google Scholar] [CrossRef] [PubMed]
  53. Tucker, C.L.; Bell, J.; Pendall, E.; Ogle, K. Does declining carbon-use efficiency explain thermal acclimation of soil respiration with warming? Glob. Chang. Biol. 2013, 19, 252–263. [Google Scholar] [CrossRef] [PubMed]
  54. Lloret, F.; Mattana, S.; Curiel Yuste, J. Climate-induced die-off affects plant-soil-microbe ecological relationship and functioning. FEMS Microbiol. Ecol. 2015, 91, 1–12. [Google Scholar] [CrossRef] [PubMed]
  55. Spohn, M.; Chodak, M. Microbial respiration per unit biomass increases with carbon-to-nutrient ratios in forest soils. Soil Biol. Biochem. 2015, 81, 128–133. [Google Scholar] [CrossRef]
  56. Schimel, J. Microbial ecology: Linking omics to biogeochemistry. Nat. Microbiol. 2016, 1, 15028. [Google Scholar] [CrossRef] [PubMed]
  57. Shoemaker, W.R.; Locey, K.J.; Lennon, J.T. A macroecological theory of microbial biodiversity. Nat. Ecol. Evol. 2017, 1, 0107. [Google Scholar] [CrossRef] [PubMed]
  58. Zhou, H.; Zhang, D.; Wang, P.; Liu, X.; Cheng, K.; Li, L.; Zheng, J.; Zhang, X.; Zheng, J.; Crowley, D.; et al. Changes in microbial biomass and the metabolic quotient with biochar addition to agricultural soils: A Meta-analysis. Agric. Ecosyst. Environ. 2017, 239, 80–89. [Google Scholar] [CrossRef]
  59. Zhou, Z.; Wang, C.; Jiang, L.; Luo, Y. Trends in soil microbial communities during secondary succession. Soil Biol. Biochem. 2017, 115, 92–99. [Google Scholar] [CrossRef]
Figure 1. Location of the Loess Plateau and the study site.
Forests 09 00436 g001
Figure 2. Plant community characteristics ((a) plant coverage, (b) plant richness, (c) plant evenness, (d) plant diversity) after afforestation. Different letters denote significant (p < 0.05) differences among sites in same month; error bar represents standard error. Note: 40, 25, and 15 years of Robinia pseudoacacia L. indicated as RP40, RP25, and RP15.
Forests 09 00436 g002
Figure 3. Soil respiration (a) and its components ((b) soil heterotrophic respiration, (c) soil autotrophic respiration) after afforestation. Different letters denote significant (p < 0.05) differences among sites in same month; error bar represents standard error. Note: 40, 25, and 15 years of Robinia pseudoacacia L. indicated as RP40, RP25, and RP15.
Forests 09 00436 g003
Figure 4. Soil Catalase enzyme activities (a), Alkaline phosphatase enzyme activities (b), Ureas enzyme activities (c) and Saccharase enzyme activities (d) after afforestation. Different letters denote significant (p < 0.05) differences among sites in same month; error bar represents standard error. Note: 40, 25, and 15 years of Robinia pseudoacacia L. indicated as RP40, RP25, and RP15.
Forests 09 00436 g004
Figure 5. Soil microbial C (a), N (b), P (c) and soil MBC: MBN (d), soil MBC: MBP (e) and soil MBN: MBP (f) after afforestation. Different letters denote significant (p < 0.05) differences among sites in same month and error bar represents standard error. Note: 40, 25, and 15 years of Robinia pseudoacacia L. indicated as RP40, RP25, and RP15.
Forests 09 00436 g005
Figure 6. Linear Regression between SR and plant coverage in RP40 (a), RP20 (b), and in RP15 (c); between HR and plant richness in RP40 (d), RP20 (e), and in RP15 (f); between AR and plant diversity in RP40 (g), RP20 (h), and in RP15 (i); Soil respiration (SR); Soil heterotrophic respiration (HR); Soil autotrophic respiration (AR).
Forests 09 00436 g006
Table 1. Geographical information for the four R. pseudoacacia L. sites.
SitesFarmlandRobinia pseudoacacia Linn.
(RP15 year)
Robinia pseudoacacia Linn.
(RP25 year)
Robinia pseudoacacia Linn.
(RP40 year)
Elevation (m)1205130312981293
Clay (%)8.12 ± 0.21 A8.55 ± 0.14 A9.54 ± 0.13 A10.11 ± 0.12 A
Silt (%)60.45 ± 0.22 A62.53 ± 0.19 A60.36 ± 0.19 A64.35 ± 0.21 A
Sand (%)31.43 ± 0.10 A28.92 ± 0.09 A30.10 ± 0.18 A25.54 ± 0.11 A
Dominate species Artemisia capillaries Thunb., Heteropappus altaicus (Willd.) Novopokr., Stipa bungeana Trin., Oxytropis bicolor Bunge., Cleistogenes squarrosa (Trin.) KengArtemisia capillaries Thunb., Heteropappus altaicus (Willd.) Novopokr., Stipa bungeana Trin., Salsola collina Pall., Oxytropis bicolor Bunge., Cleistogenes squarrosa (Trin.) KengArtemisia capillaries Thunb., Heteropappus altaicus (Willd.) Novopokr., Artemisia sacrorum Ledeb., Stipa bungeana Trin., Oxytropis bicolor Bunge., Cleistogenes squarrosa (Trin.) Keng
Capital letters indicate significant difference among different land use types (p < 0.05); the error bars.
Table 2. Soil properties after afforestation.
SitesSBD (g·cm−3) apHWHC (%) b
Farmland1.14 ± 0.02 A9.38 ± 0.01 A10.27 ± 0.74 C
R. pseudoacacia (RP15 year)1.17 ± 0.01 A8.67 ± 0.11 A15.75 ± 0.98 B
R. pseudoacacia (RP25 year)1.20 ± 0.01 A8.65 ± 0.01 A16.92 ± 0.79 B
R. pseudoacacia (RP40 year)1.24 ± 0.01 A8.48 ± 0.02 A24.33 ± 1.21 A
a SBD is soil bulk density; b WHC is Water Holding Capacity Note: ±SE, Capital letter represents significant difference among sites.
Table 3. Spearman’s rank correlation coefficients between the microbial biomass (C, N, and P) and its stoichiometry (MBC:MBN, MBC:MBP and MBN:MBP) and the soil enzyme actives (catalase, saccharase, urease, and alkaline phosphatase), as well as soil respiration components.
Soil Enzyme Actives
catalaseAlkaline phosphataseureasesaccharase
SR−0.653 **−0.649 **−0.677 **−0.757 **
HR−0.520 *−0.518 *−0.410−0.558 *
AR−0.595 **−0.649 **−0.774 **−0.717 **
MBCMBNMBPMBC:MBNMBC:MBPMBN:MBP
SR0.420.582 *0.676 **0.613 **−0.695 **0.447
HR0.553 *0.3640.517 *0.658 **−0.699 **0.481 *
AR0.240.586 *0.568 *0.620 **−0.717 **0.478 *
Soil respiration (SR); Soil heterotrophic respiration (HR); Soil autotrophic respiration (AR); Microbial biomass carbon (MBC); nitrogen (MBN); phosphorus (MBP); Microbial biomass carbon and nitrogen ratio (MBC:MBN); Microbial biomass carbon and phosphorus ratio (MBC:MBP); Microbial biomass nitrogen and phosphorus ratio (MBN:MBP) ** Correlation is significant at the 0.01 level. * Correlation is significant at the 0.05 level.
Table 4. Results from the BEST model for each number of predictor variables.
Number VariablesRPredictor Variables **
10.142Coverage
20.116Coverage, Evenness
30.093Coverage, Evenness, Diversity
40.037Coverage, Evenness, Diversity, Richness
Number of permutations: 999 (random sample). ** Significance level of sample statistic: 0.1%.
Table 5. Results from the BEST model for each number of predictor variables.
Number VariablesSoil Enzyme ActivesSoil Microbial C, N, P Soil Microbial Stoichiometry
RPredictor VariablesRPredictor VariablesRPredictor Variables
10.131urease0.112MBP0.136MBC:MBP
20.126alkaline phosphatase, urease0.158MBP0.193MBC:MBP, MBN:MBP
30.118catalase, alkaline phos-phatase, urease0.138MBP, MBN0.132MBC:MBP, MBN:MBP
40.036catalase, alkaline phosphatase,
urease, saccharase
Number of permutations: 999 (random sample). Microbial biomass carbon (MBC); nitrogen (MBN); phosphorus (MBP); Microbial biomass carbon and nitrogen ratio (MBC:MBN); Microbial biomass carbon and phosphorus ratio (MBC:MBP); Microbial biomass nitrogen and phosphorus ratio (MBN:MBP).

