Article

Species Identification of Pinus Pollen Found in Belukha Glacier, Russian Altai Mountains, Using a Whole-Genome Amplification Method

1
National Institute of Polar Research, 10-3 Midori-cho, Tachikawa, Tokyo 190-8518, Japan
2
SOKENDAI (The Graduate University of Advanced Studies), Shonan Village, Hayama, Kanagawa 240-0193, Japan
3
Field Science Center, Graduate School of Agricultural Science, Tohoku University, 232-3 Yomogida, Naruko-onsen, Osaki, Miyagi 989-6711, Japan
*
Author to whom correspondence should be addressed.
Forests 2018, 9(8), 444; https://doi.org/10.3390/f9080444
Submission received: 20 April 2018 / Revised: 25 June 2018 / Accepted: 28 June 2018 / Published: 24 July 2018
(This article belongs to the Special Issue Ecological Management of Pine Forests)

Abstract

:
Pollen taxa in sediment samples can be identified based on morphology. However, closely related species do not differ substantially in pollen morphology, and accurate identification is generally limited to genera or families. Because many pollen grains in glaciers contain protoplasm, genetic information obtained from pollen grains should enable the identification of plant taxa at the species level. In the present study, species identification of Pinus pollen grains was attempted using whole-genome amplification (WGA). We used pollen grains extracted from surface snow (depth, 1.8–1.9 m) from the Belukha glacier in the summer of 2003. WGA was performed using a single pollen grain. Some regions of the chloroplast genome were amplified by PCR, and the DNA products were sequenced to identify the pollen grain. Pinus includes approximately 111 recognized species in two subgenera, four sections, and 11 subsections. The tree species Pinus sibirica and P. sylvestris are currently found at the periphery of the glacier. We identified the pollen grains from the Belukha glacier to the level of section or subsection to which P. sibirica and P. sylvestris belong. Moreover, we specifically identified two pollen grains as P. sibirica or P. cembra. Fifteen species, including P. sibirica, were candidates for the remaining pollen grain.

1. Introduction

The natural range of the genus Pinus is confined to the Northern Hemisphere, although some species have been introduced to the Southern Hemisphere. The genus is currently a dominant component in forests [1]. The pollen grains of Pinus have two sacs and the winged pollen grains can be transported long distances by wind. In fact, Pinus pollen grains can reach remote areas, such as mountain glaciers in the Northern Hemisphere, Arctic glaciers, and the Greenland ice sheet, and are found in snow and ice as a predominant pollen type [2,3,4,5,6,7,8,9]. Many pollen grains in glaciers are expected to contain protoplasm, and their maintenance at below 0 °C is favorable for DNA preservation [10]. This property is characteristic of glacial pollen; protoplasm is rarely seen in pollen found in other sediment types, such as peat and lacustrine deposits. Therefore, pollen grains in glaciers are advantageous for obtaining genetic information, which should enable identification to the species level. Modern pollen identification focuses on the morphological characteristics of the pollen wall, but this approach is generally limited to the identification of plant genera or families. In the case of Pinus, identification to the genus level is typically possible, although the haploxylon and diploxylon types are sometimes distinguished for Pinus pollen grains on the basis of vesicle morphology and other characters. Hence, alternative techniques are needed for species identification, such as DNA analyses of pollen grains. If Pinus pollen grains in glaciers are identified to the species level, it may be possible to investigate the provenance and transportation routes from source plants. Genetic data also provide valuable information related to physiological ecology, gene flow, and population dynamics [11,12]. In addition, if genetic analysis is applied to pollen from ice cores, which are cylindrical samples of ice drilled from glaciers and are used to reconstruct past climate conditions and the environmental history of a particular area, then the abovementioned provenance and ecological studies can be extended to trace back into the past.
Nakazawa et al. [10] analyzed the DNA of Pinus pollen grains collected from subsurface snow layers on the Belukha glacier in the Altai Mountains of Russia in the summer of 2003. They identified Pinus pollen grains to the section level using a PCR-based method. However, it is difficult to achieve species-level identification using this approach. The sequences provide limited information owing to their short lengths, meaning that there is the potential to obtain more DNA information by improving on PCR-based methods.
To identify the grains at the species level, an optimized whole-genome amplification (WGA) approach combined with multiplex PCR was developed in this study. Multiplex PCR can be used to amplify multiple targets in a single PCR experiment. Additionally, DNA barcoding is used to identify materials from known species based on short DNA sequences of standard genomic regions (i.e., DNA barcodes). In general, chloroplast DNA in land plants has a low nucleotide substitution rate, on the order of 10−9 per site per year [13]. Therefore, few mutations are expected within a short period of time, and the most promising DNA barcoding loci for plants are chloroplast genes. DNA barcoding technologies are being developed for applications in palynology (pollen DNA barcoding) [14], and these studies have demonstrated that both chloroplast and nuclear barcoding markers can be amplified from pollen. Unfortunately, most plastid candidate barcodes lack species-level resolution [15]. Additionally, DNA barcoding markers with universal primers used in previous pollen DNA barcoding studies [14] provide insufficient information on the species-level taxonomy of Pinus. Species-specific primers are generally used for the precise identification of samples [16,17]. Moreover, PCR amplification using limited amounts of DNA template, such as from a single pollen grain, has high risk of contamination, biased amplification, and product redundancy [18,19]. Thus, in this study, we designed primers for species-specific DNA barcoding with high resolution at low taxonomic levels to reduce these risks and increase precision.

2. Materials and Methods

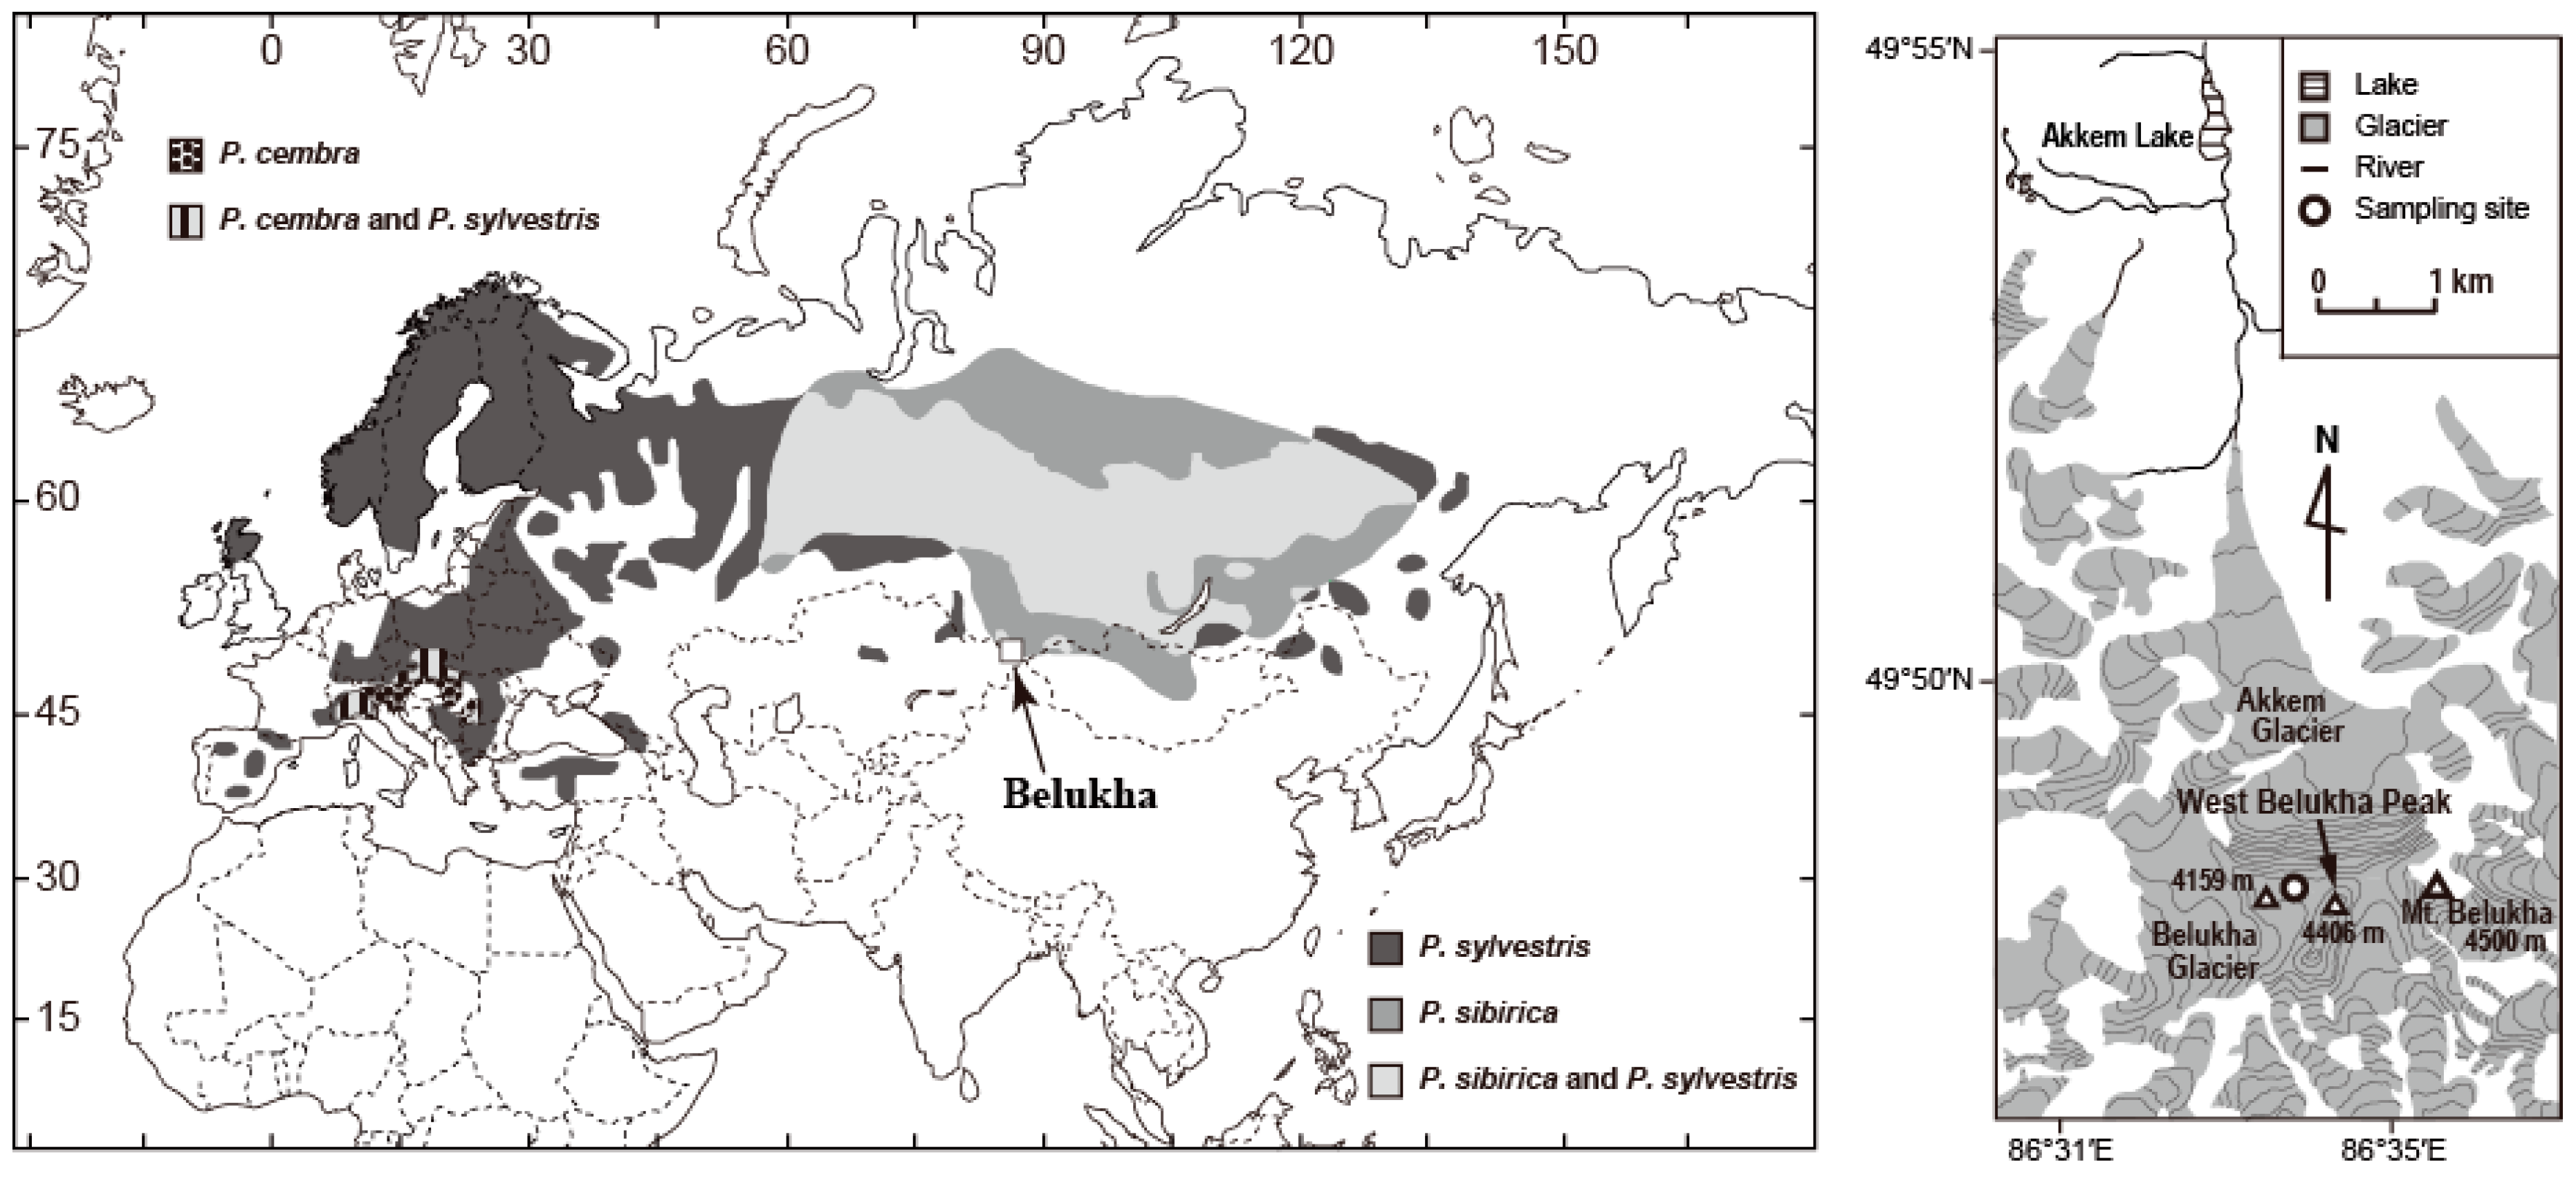
2.1. Study Area and Pollen Samples

The Belukha glacier (49°49′ N, 86°34′ E; 4,110 m a.s.l.) is located on the western side of Mt. Belukha (4500 m a.s.l.) in the Russian Altai Mountains and is situated in the border region between Russia, Mongolia, China, and Kazakhstan (Figure 1). In the summer of 2003, a 4-m-deep pit on the plateau of the glacier was examined (4100 m a.s.l.) [20]. Pinus pollen grains in a snow sample were obtained at a depth of 1.8–1.9 m in the pit and used for the DNA analysis. The Pinus pollen concentration in the sample was 34,900 grains L−1. The sample was dated to the summer of 2002 by counting the seasonal distribution of pollen [20]. The sample was obtained from the same pit as in our previous study [10], but the pollen grains were previously collected from a depth of 0.4–0.5 m and dated to the summer of 2003. The sample was kept in a frozen state until it was analyzed.
Pinus species surrounding the Belukha glacier are P. sibirica, which is distributed between approximately 1000 and 2000 m a.s.l., and P. sylvestris, which typically occurs below the P. sibirica stands [21]. For a detailed description of the vegetation, see Nakazawa et al. [10].

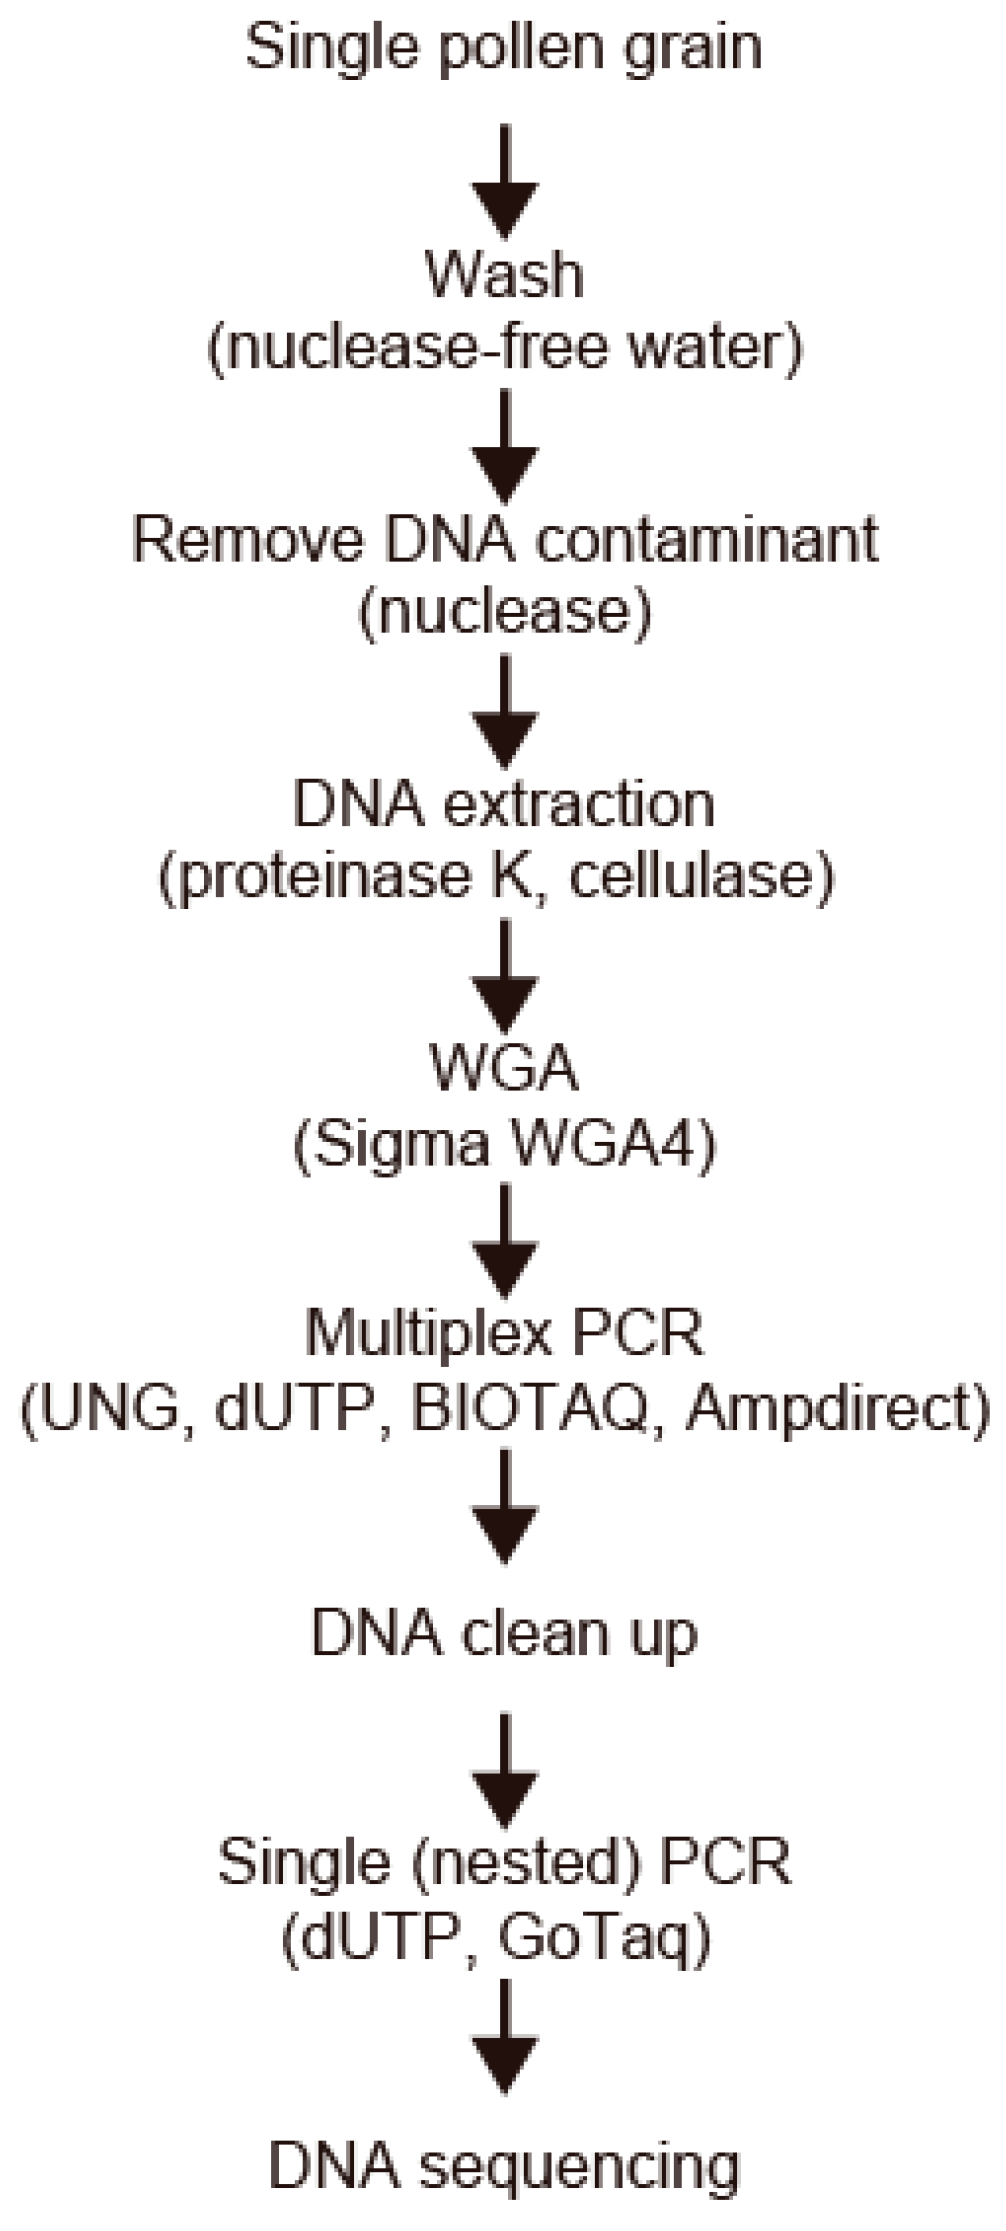
2.2. DNA Extraction from a Single Pollen Grain

DNA was extracted using a modified version of the extraction method described by Nakazawa et al. [10]. A flow chart of the experimental procedure is shown in Figure 2. Melted snow and ice samples were first filtered through a hydrophilic PTFE membrane filter with a pore size of 10 μm. Next, pollen grains that showed no structural damage were selected from the filter using a micromanipulator (MM-88; Narishige, Tokyo, Japan) under a microscope. Each selected pollen grain was placed onto a new hydrophilic PTFE membrane filter with a pore size of 5 μm, and was then washed by suction filtration with 1 mL of nuclease-free water (Ambion Life Technologies, Foster City, CA, USA). The filter trapping a pollen grain was transferred to a sterile Petri dish. The washed grain was then transferred to the inner side of the lid of a DNA-free PCR tube containing 0.5 μL of water using a pipette.
The pollen grain in the lid was treated with endonuclease and exonuclease to eliminate potential contaminants from DNA fragments attached to the surface of the grain. One microliter of reaction mixture containing 0.48 μL of water, 0.2 μL of 10× Exonuclease III Buffer (TaKaRa Biotechnology Co., Ltd., Dalian, Japan), 0.1 μL of Exonuclease I (20 U/μL, Epicentre, Madison, WI, USA), 0.02 μL of Exonuclease III (200 U/μL, TaKaRa Biotechnology), and 0.2 μL of DNase I (1 U/μL, Sigma-Aldrich Co., St. Louis, MO, USA) was added to the lid. The mixture was incubated at 37 °C for 3–5 h, then at 98 °C for 10 min.
The treated grain was crushed directly in the lid of the tube using a sterile plastic pipette tip. For crushing, we used an electric toothbrush with an attached tip-rounded pipette tip, which was made by heating with a gas burner in advance. The vibration of the electronic toothbrush facilitated crushing. One microliter of extraction mixture containing 0.7 μL of Tris-HCl (pH 8.0, 20 mM, Nacalai Tesque, Kyoto, Japan), 0.2 μL of proteinase K (1 μg/μL, TaKaRa Biotechnology), and 0.1 μL of cellulase (Sigma-Aldrich) was added to the lid of each sample and spun down for collection at the bottom of the tube. The mixture was incubated at 50 °C for 6 h, at 95 °C for 10 min, and then used as a template.

2.3. Whole-Genome Amplification

WGA from a pollen grain was performed using the GenomePlex Single Cell Whole Genome Amplification Kit (WGA4; Sigma-Aldrich) according to the manufacturer’s instructions, with slight modifications. After the lysis procedure, 1.3 μL of fragmentation solution, including 0.3 μL of fragmentation buffer and 1 μL of water, was added and heated in a thermal cycler (Bioer Technology Co. Ltd., Hangzhou, China) at 99 °C for 3 min. The PCR tubes were then cooled on a cooling rack (Nippon Genetics Co., Ltd., Tokyo, Japan). For library preparation, 1 μL of the reaction solution including 0.7 μL of Library Preparation Buffer and 0.3 μL of Library Stabilization Solution was added to each sample and was placed in the thermal cycler at 95 °C for 2 min. The samples were cooled on the cooling rack. Next, 1.0 μL of enzyme solution including 0.7 μL of water and 0.3 μL of the Library Preparation Enzyme solution was added to each sample. The samples were placed in the thermal cycler. The reaction time and temperature were based on the instructions provided.
For the amplification, 14.6 μL of the reaction mixture, including 11.0 μL of water, 2.0 μL of 10× Amplification Master Mix, 1.3 μL of WGA DNA Polymerase, 0.2 μL of uracil-N-glycosylase (UNG; TaKaRa Biotechnology), and 0.1 μL of BIOTAQ HS DNA polymerase (Bioline, London, UK), was added to the sample. UNG was used to degrade uracil-containing PCR contaminants from previous PCR prior to the amplification reaction. This is explained in more detail in the next section. Note that the PCR products included dUTP, instead of dTTP. Therefore, the treatment with UNG should allow the selective removal of carryover PCR products. Samples were first incubated at 25 °C for 10 min, and then amplified using an initial denaturation of 95 °C for 10 min followed by 40 cycles each consisting of a denaturation step at 94 °C for 30 s, an annealing step at 52 °C for 1 min, and an extension step at 72 °C for 1 min, and a final extension at 72 °C for 7 min. The WGA DNA in the reaction mixture was stored at −20 °C until further use, without a DNA purification step.

2.4. UNG Treatment and Multiplex PCR Amplification

The quality of the WGA amplification was evaluated using a multiplex PCR approach. The DNA specimens generated by WGA were subjected to various analyses for chloroplast DNA. Instead of single PCR, a multiplex PCR step was introduced in this study to use the specimens effectively. To preclude carryover contamination of amplification products from previous PCR, the reaction with UNG, an enzyme that degrades uracil-containing DNA, was carried out. Each multiplex PCR amplification was performed with dUTP instead of dTTP. Thus, the PCR products should be obtained from only thymine-containing templates amplified by WGA.
For the multiplex PCR assay, 2–7 primer pairs were designed. PCR was carried out with a 10-μL reaction mixture containing 1 μL of template WGA products. The primers are listed in Table 1. To identify samples at the section or subsection level, a total of 10 primer pairs were used. Seven or 14 primer pairs were selected to narrow the candidates within each subsection. To evaluate the primer sets, the performance of primers was examined using single pollen grains of P. resinosa belonging to subsection Pinus and needles collected from P. pumila, P. strobus, P. taeda, P. jeffreyi, and P. monophylla, which belong to subsections Strobus, Strobus, Australes, Ponderosae and Cembroides, and P. resinosa, respectively. From the results, some primers were screened out. The primers presented in Table 1 were effective for sequencing. In addition, the number of cycles of multiplex PCR in this study was minimized to avoid the introduction of significant PCR bias.
Nine microliters of the reaction mixture for UNG and multiplex PCR, containing 1.75 μL of water, 5.1 μL of 5× PCR buffer, 2.0 μL of a mix of primers (2.5 μM each primer), 0.05 μL of BIOTAQ HS DNA polymerase, and 0.1 μL of UNG, was added to a PCR tube. The 5× PCR buffer was prepared by mixing 2 μL of 5× Ampdirect-D (Shimadzu Biotech, Kyoto, Japan), 2 μL of 5× AmpAddition-3 (Shimadzu Biotech, Kyoto, Japan), 0.3 μL of 25 mM MgCl2, and 0.8 μL of dU plus dNTP Mixture (TaKaRa Biotechnology).

2.5. Nested PCR

The secondary amplification for each strand, which was run with a nested set of primers, was performed using a 0.5-μL aliquot of the purified first PCR products. A new PCR mixture of 10 μL was prepared, containing 0.5 μL of the template, 4.75 μL of water, 2.0 μL of 5× Green GoTaq Flexi Buffer (Promega Co., Madison, WI, USA), 0.9 μL of 25 mM MgCl2, 0.8 μL of dU plus dNTP Mixture, 1.0 μL of 5.0 μM primers, and 0.05 μL of GoTaq Hot Start Polymerase (Promega). The primers used for nested PCR are listed in Table 1. The amplification was performed using a thermal cycler (GeneAmp PCR System 9700; Applied Biosystems, Foster City, CA, USA) under the following conditions: initial activation at 95 °C for 2 min, 20 cycles of denaturation at 95 °C for 30 s, annealing at 52 °C for 30 s, and extension at 72 °C for 30 s, followed by a final incubation at 72 °C for 5 min. Amplified PCR products were then sequenced using the BigDye Terminator v.3.1 Sequencing Kit (Applied Biosystems, Foster City, CA, USA) and an ABI 3130xl Genetic Analyzer (Applied Biosystems).

2.6. Identification of Individual Pinus Pollen Grains

Each Pinus pollen grain was identified based on parsimony-informative characters in various regions of the chloroplast genome, as shown in Table 1. The genus Pinus has approximately 111 recognized species in two subgenera, four sections, and 17 subsections (Table 2). Sequence data were collected for these regions from GenBank, which are available for almost all Pinus species. In addition, the aligned DNA sequences for each locus were used to determine parsimony-informative sites in MEGA ver. 5 [23] (see Supplementary data). Additionally, a small insertion of 3 bp was considered for the Matsu5 (ycf3) and Matsu7 (rpoB) regions. Genus-level classification was based on Gernandt et al. [24]. Their classification, based on a chloroplast DNA phylogeny, was a modification of (1) the influential classification of Little and Critchfield [25], which is based primarily on morphological characters and data from interspecific crosses, and (2) the classification of Price et al. [26], which incorporates additional recently described species.

3. Results and Discussion

3.1. Pinus Pollen Identification at the Section or Subsection Level

We analyzed 21 pollen grains, and five samples showed positive amplification from at least one locus in the multiplex PCR with the primer sets Matsu1–10 (Table 3). DNA fragmentation and degradation, particularly in ancient samples, make it difficult to amplify long fragments from a single pollen grain in sediment samples [27,28]. This problem is alleviated by the higher amplification efficiency of short fragments (<200 bp) [29]. To increase the probability of amplification, our primer sets were designed to yield fragments of around 200 bp, even though our samples were not ancient. Although previous pollen DNA barcoding studies have focused on fragments of longer than 300 bp [14], we believe that fragments of around 200 bp may be sufficient to identify pollen at the section or subsection level when the target pollen type is specified and sequence data are available, as demonstrated in the present study.
The controls in our PCRs followed the experimental methodology of Parducci et al. [29]. A positive control was not used owing to the high contamination risk. As a negative control, contamination by exogenous chloroplast DNA from Pinus species in the reagents was monitored using a PCR blank that included all reagents. If no band was visible by agarose gel electrophoresis after multiplex PCRs, we concluded that the samples were not contaminated. Samples with bands on the agarose gel were selected for an additional nested PCR amplification step with each single primer set.
Based on the sequence data collected for the clpP, rpoA, atpB, rpoC1, ycf3, ycf4, and rpoB regions by nested PCR, the pollen grains were identified to the section or subsection level (Table 3). We identified four out of five pollen grains as members of the subsection Strobus. One belonged to the section Quinquefoliae, and the remaining grain was part of the section Pinus.
For the four grains in the subsection Strobus, we successfully obtained sequence data for multiple loci (Table 3). Based on these sequence data, we identified each locus as belonging to the same phylogenetic clade, namely, subsection Strobus of the section Quinquefoliae in the subgenus Strobus (Table 2). This consistency confirms that the WGA reactions could increase the amount of accurate DNA data that can be obtained from a single pollen grain.

3.2. Species Identification of Pinus Pollen Grains

To further narrow down the candidate species in the subsection Strobus, we used the WGA products for multiplex PCRs with primers to amplify short fragments on the plastid gene ycf1. We designed various primer sets targeting regions in the ycf1 gene (Table 1), which is a highly variable locus that can be used for Pinus species identification [30]. The multiplex PCR products were subjected to an additional round of nested PCR.
We successfully amplified target regions for three out of four pollen grains in the subsection Strobus. Regions that were successfully amplified are shown in Table S1. In the sequence analysis based on variable base positions, we identified two pollen grains as P. cembra or P. sibirica (samples No. 1 and 3). Although we examined various regions in the chloroplast genome, to positively identify pollen grains as P. sibirica or P. cembra, it was sufficient to examine only three regions, namely, Strbs3, Strbs7, and Matsu6 (or Matsu8). For the remaining grain, we determined the following 15 candidate species: P. albicaulis, P. armandii, P. bhutanica, P. cembra, P. dalatensis, P. fenzeliana, P. lambertiana, P. monticola, P. morrisonicola, P. parviflora, P. peuce, P. pumila, P. sibirica, P. wallichiana, and P. wangii.
We inferred that the three grains were P. sibirica. Gugerli et al. [31] observed highly similar chloroplast and mitochondrial DNA sequences between P. cembra and P. sibirica. This similarity suggests a relatively recent evolutionary separation of the species, despite their currently disjunct distributions (Figure 1). P. sibirica appears in the Urals and Siberia of Russia, in eastern Kazakhstan, in northern Mongolia, and in Xingjiang, Nei Mongo, and Heilongjiang of China. P. cembra occurs in the Swiss Alps, in the Tirol of Austria, in the High Tatra between Poland and the Slovak Republic, and in the eastern Carpathians of Romania and Ukrine [22]. Heinze and Holzer [32] verified that a nearly complete P. cembra chloroplast genome sequence in GenBank (Accession No. FJ899574) is identical to a P. sibirica sequence (Accession No. FJ899558). Although the FJ899574 sequence lacks part of the ycf1 region targeted in this study, the ycf1 sequence identities for both species were validated by a comparative analysis using FJ899558 and KP128626 of P. cembra. Accordingly, the two species likely cannot be discriminated based on comparative sequence analyses of the chloroplast genome. P. sibirica is an extant species and is the only member of the subsection Strobus that is found near the glacier. This species was a major candidate in our study, suggesting that the pollen grains in the glacier originated from P. sibirica trees found in the immediate surroundings. This consistency between the results of our genetic analysis and species distribution data suggests that our method to identify pollen species was reliable.
We were not able to obtain sequence data for three grains. For the pollen grain identified as belonging to the section Pinus, the WGA products were used as templates in the multiplex PCRs, with primer sets for the ycf1, rbcL, and rpl20-rps18 chloroplast regions (Table 1). We could not identify those grains at a lower taxonomic level. However, the grains appeared to be P. sibirica in subsection Strobus, section Quinquefoliae, and P. sylvestris, which belongs to subsection Pinus in section Pinus based on the consistent results at the subsection or section levels. To obtain accurate sequences and facilitate a more detailed taxonomic identification, additional PCRs with newly designed primer sets may be effective. Although we were able to generate sufficient DNA specimens from single pollen grains for additional PCRs using the WGA technique, we did not perform subsequent analyses owing to a lack of time and resources and an expectation of unremarkable results.

3.3. Potential Use of Pollen Grains as a Tracer for Emission Sources

We believe that our method for Pinus pollen identification is suitable for further work aimed at a more detailed characterization of the provenance of aerosols, particularly in Arctic glaciers and the Greenland ice sheet. Pollen is a type of bio-aerosol; Pinus pollen as well as other types of pollen travel long distances. This pollen is regarded as exotic, and many studies have investigated its source area and long-distance transportation by trajectory analyses [33,34,35,36,37]. For aerosols reaching ice sheets and mountain glaciers, dust has been used as a tracer for emission sources as well as large-scale atmospheric circulation [38,39,40]. Clay mineralogy and Sr-Nd isotopic and elemental compositions have suggested that East Asia (i.e., the Gobi Desert, northern Chinese deserts, and the Taklamakan Desert) is the main source of dust arriving in Greenland, both at present and during the last glacial period [38]. Generally, dust seems to originate mainly from arid regions. In contrast, pollen sources are restricted to vegetated areas. Therefore, pollen can be used as another tracer, and a combination of both of these tracers should lead to a better understanding of the provenance of solid aerosols and the materials cycle. This approach has not been used, although some pollen grains, including Pinus pollen grains, have been found in Greenland [2,35,36].
As mentioned in Section 3.2, our analysis strongly suggested that two Pinus pollen grains found in the Belukha glacier are P. sibirica, in consonance with the surrounding Pinus vegetation. Therefore, we can assume that the provenance of the Pinus pollen is the region that extends from the northwest to the east of the glacier, as shown in Figure 1. A Pinus pollen grain is around 50 μm in size; the size of a pollen grain typically ranges from 10 to 200 μm, and the most common size is between 20 and 60 μm [41]. Despite the relatively large size of Pinus pollen, the grains are well dispersed in a vesiculate form with two prominent sacci [42]. In addition, Pinus is characterized by high pollen grain production. For those reasons, Pinus pollen in palaeoecological records are frequently disregarded as evidence for presence or absence in the arctic region with low local production of pollen [1]. However, these properties are favorable for analyses of Pinus pollen grains from Arctic glaciers and the Greenland ice sheet by our method to investigate geographic provenances and the materials cycle. Additionally, their large size seems to be beneficial for the treatment of pollen grains in a laboratory.

3.4. Improvement in the Amplification Success Rate

The success rate for obtaining sequence data reported by Nakazawa et al. [10] was 7.6% (n = 105). This was higher than the success rates observed in previous DNA analyses of pollen collected from peat or lacustrine deposits. Suyama et al. [28,43] and Parducci et al. [29] observed success rates ranging from 0 to 3.2%. However, these rates are still insufficient to develop a new field of palynological research based on genetic information. Hence, improving the success rate is a particularly important issue.
In this study, we subjected 21 pollen grains to WGA, and we observed positive amplification from at least one locus for a total of five grains. The success rate for sequence amplification in this study was 24% and exceeded that of Nakazawa et al. [10] who used pollen samples from the same glacier collected from the upper layer of the pit. To improve the success rate of DNA analyses, we introduced multiplex PCR; amplifying multiple loci simultaneously in a single reaction improved the probability that at least one locus was amplified. In addition, the WGA technique enabled an increased quantity of DNA to be obtained from samples with limited DNA content. Since we collected samples from a different layer from that of previous studies, we cannot make a simple comparison of the success rates between studies. However, we were able to obtain sequence data from multiple loci, and this method appeared to be more effective with respect to success rate.

4. Conclusions

We described an initial attempt to identify pollen grains from a glacier at the species level based on chloroplast DNA sequences. For precise identification, we applied an optimized WGA technique for single pollen grains. We subjected WGA products to an additional round of multiplex PCRs. The combined DNA sequence data obtained from a single pollen grain suggested that identification at or near the species level is possible.
We analyzed 21 pollen grains, of which five exhibited positive amplification for at least one locus in the multiplex PCRs. One grain appeared to belong to the section Quinquefoliae, four grains were in the subsection Strobus of section Quinquefoliae, and the remaining grain was identified as a member of the section Pinus. In addition, for three out of the four grains in the subsection Strobus, the candidates were narrowed down to two species; 15 candidates remained for the other grain. Owing to the identical P. cembra and P. sibirica chloroplast genome sequences, it was not possible to differentiate between the species using sequence data. However, we inferred that both grains were P. sibirica because it is an extant species that is currently distributed around the glacier. Meanwhile, P. cembra is distributed in some high mountains in Switzerland, Austria, Poland, the Slovak Republic, Romania, and Ukraine [22]. Moreover, we could assume the grains traveled from the region that expands from the northwest to the east of the glacier based on the forest distribution of P. sibirica. Similarly, the remaining grains appeared to be P. sibirica or P. sylvestris, which is also found around the glacier. Our pollen identifications based on DNA sequence data are supported by the vegetation in the region, suggesting that the method established in this study enables reliable identification at the species level for pollen grains. Additionally, the method should be useful for future studies on the provenance of solid aerosols and the materials cycle in the polar region and high mountain regions in the Northern Hemisphere, where glaciers exist.
The DNA amplification success rate in this study exceeded that of our previous study of samples from the same snow pit. However, the samples were collected from a different layer, preventing a simple comparison of success rates between studies. However, we demonstrated that our method could be used to obtain sequence data from multiple loci and effectively increase the success rate.
Further investigations using older samples from ice cores are necessary to extend the applications of these methods and to accumulate data in the field. The rarity of suitable, well-preserved pollen samples in sediments has limited the broad utility of DNA studies for the taxonomic identification of pollen. However, owing to low-temperature conditions, pollen grains in glaciers are not strongly affected by diagenesis and their DNA is therefore likely to be preserved. Accordingly, pollen samples from glaciers have broad utility for studies of taxonomy, past vegetation, population genetics, and climate and environmental conditions. Our method based on WGA and multiplex PCR techniques may enable the generation of DNA specimens from single pollen grains that can be analyzed by multiple molecular techniques for a range of applications.

Supplementary Materials

The following are available online at https://www.mdpi.com/1999-4907/9/8/444/s1. S1: Table S1, S2: Sequence data obtained for Matsu1–10 are shown in the sheets of “Matsu No. seq” of the file. Sequence variation for parsimony-informative characters in Pinus and Pinus pollen from the Belukha glacier are compared in the individual sheet named “Matsu No. id” to identify pollen taxa. Identical sequences with those of the samples for each sheet are colored to identify candidates.

Author Contributions

F.N. carried out the molecular genetic studies and drafted the manuscript. Y.S. helped to evaluate and edit the manuscript. S.I. participated in the coordination of the study and helped in data interpretation and manuscript evaluation. H.M. supervised the development of the work and helped draft the manuscript.

Funding

This research was funded by the “Systematic Analysis for Global Environmental Change and Life on Earth’’ research project of the Transdisciplinary Research Integration Center; the Oasis Project (Historical evolution of adaptability in an oasis region to water resource changes) and the Ili Project (Historical interactions between multi-cultural societies and the natural environment in a semi-arid region in Central Eurasia) promoted by the Research Institute for Humanity and Nature, Kyoto, Japan; and JSPS KAKENHI Grant Numbers 24710019, 16K00529, 24248025. The production of this paper was supported by an NIPR publication subsidy.

Acknowledgments

We wish to thank all individuals who generously assisted with the study. We also thank Kenichi Watanabe, Ryoko Yamagishi, and Reiko Sakamoto of the National Institute of Polar Research for help with the DNA analysis.

Conflicts of Interest

The authors declare no conflict of interest.

References

  1. Richardson, D.M.; Rundel, P.W. Ecology and biogeography of Pinus: An introduction. In Ecology and Biogeography of Pinus; Richardson, D.M., Ed.; Cambridge University Press: Cambridge, UK, 1998; pp. 3–46. ISBN 0521789109. [Google Scholar]
  2. Fredskild, B.; Wagner, P. Pollen and fragments of plant tissue in core samples from the Greenland Ice Cap. Boreas 1974, 3, 105–108. [Google Scholar] [CrossRef]
  3. Short, S.K.; Holdsworth, G. Pollen, oxygen isotope content and seasonality in an ice core from the Penny Ice Cap, Baffin island. Arctic 1985, 38, 214–218. [Google Scholar] [CrossRef]
  4. Bourgeois, J.C. Seasonal and interannual pollen variability in snow layers of arctic ice caps. Rev. Palaeobot. Palynol. 2000, 108, 17–36. [Google Scholar] [CrossRef]
  5. Nakazawa, F.; Fujita, K.; Uetake, J.; Kohno, M.; Fujiki, T.; Arkhipov, S.M.; Kameda, T.; Suzuki, K.; Fujii, Y. Application of pollen analysis to dating of ice cores from lower-latitude glaciers. J. Geophys. Res. 2004, 109, F04001. [Google Scholar] [CrossRef]
  6. Nakazawa, F.; Fujita, K.; Takeuchi, N.; Fujiki, T.; Uetake, J.; Aizen, V.; Nakawo, M. Dating of seasonal snow/firn accumulation layers using pollen analysis. J. Glaciol. 2005, 51, 483–490. [Google Scholar] [CrossRef]
  7. Hicks, S.; Isaksson, E. Assessing source areas of pollutants from studies of fly ash, charcoal, and pollen from Svalbard snow and ice. J. Geophys. Res. 2006, 111, D02113. [Google Scholar] [CrossRef]
  8. Nakazawa, F.; Konya, K.; Kadota, T.; Ohata, T. Reconstruction of the depositional environment upstream of Potanin Glacier, Mongolian Altai, from pollen analysis. Environ. Res. Lett. 2012, 7, 035402. [Google Scholar] [CrossRef] [Green Version]
  9. Festi, D.; Kofler, W.; Bucher, E.; Mair, V.; Gabrielli, P.; Carturan, L.; Oeggl, K. A novel pollen-based method to detect seasonality in ice cores: a case study from the Ortles Glacier (South Tyrol, Italy). J. Glaciol. 2015, 61, 815–824. [Google Scholar] [CrossRef]
  10. Nakazawa, F.; Uetake, J.; Suyama, Y.; Kaneko, R.; Takeuchi, N.; Fujita, K.; Motoyama, H.; Imura, S.; Kanda, H. DNA analysis for section identification of individual Pinus pollen grains from Belukha glacier, Altai Mountains, Russia. Environ. Res. Lett. 2013, 8, 014032. [Google Scholar] [CrossRef]
  11. Yazdani, R.; Lindgren, D.; Stewart, S. Gene dispersion within a population of Pinus sylvestris. Scand. J. For. Res. 1989, 4, 295–306. [Google Scholar] [CrossRef]
  12. Savolainen, O.; Pyhäjarvi, T.; Knürr, T. Gene flow and local adaptation in trees. Annu. Rev. Ecol. Evol. Syst. 2007, 38, 595–619. [Google Scholar] [CrossRef]
  13. Wolfe, K.H.; Li, W.H.; Sharp, P.M. Rates of nucleotide substitution vary greatly among plant mitochondrial, chloroplast, and nuclear DNAs. Proc. Natl. Acad. Sci. USA 1987, 84, 9054–9058. [Google Scholar] [CrossRef] [PubMed]
  14. Bell, K.L.; de Vere, N.; Keller, A.; Richardson, R.T.; Gous, A.; Burgess, K.S.; Brosi, B.J. Pollen DNA barcoding: current applications and future. Genome 2016, 59, 629–640. [Google Scholar] [CrossRef] [PubMed]
  15. Dong, W.; Xu, C.; Li, C.; Sun, J.; Zuo, Y.; Shi, S.; Cheng, T.; Guo, J.; Zhou, S. ycf1, the most promising plastid DNA barcode of land plants. Sci. Rep. 2015, 5, 8348. [Google Scholar] [CrossRef] [PubMed]
  16. Nachtigall, P.G.; Rodrigues-Filho, L.F.S.; Sodré, D.C.A.; Vallinoto, M.; Pinhal, D. A multiplex PCR approach for the molecular identification and conservation of the Critically Endangered daggernose shark. Endanger. Spec. Res. 2017, 32, 169–175. [Google Scholar] [CrossRef] [Green Version]
  17. Kim, J.; Hong, J.; Lim, J.A.; Heu, S.; Roh, E. Improved multiplex PCR primers for rapid identifcation of coagulase-negative staphylococci. Arch. Microbiol. 2018, 200, 73–83. [Google Scholar] [CrossRef] [PubMed]
  18. Miner, B.E.; Stöger, R.J.; Burden, A.F.; Laird, C.D.; Hansen, R.S. Molecular barcodes detect redundancy and contamination in hairpin-bisulfite PCR. Nucleic Acids Res. 2004, 32, e135. [Google Scholar] [CrossRef] [PubMed]
  19. McCloskey, M.L.; Stöger, R.; Hansen, R.S.; Laird, C.D. Encoding PCR products with batch-stamps and barcodes. Biochem. Genet. 2007, 45, 761–767. [Google Scholar] [CrossRef] [PubMed]
  20. Nakazawa, F.; Miyake, T.; Fujita, K.; Takeuchi, N.; Uetake, J.; Fujiki, T.; Aizen, V.B.; Nakawo, M. Establishing the timing of chemical deposition events on Belukha glacier, Altai Mountains, Russia, using pollen analysis. Arctic Antarct. Alp. Res. 2011, 43, 66–72. [Google Scholar] [CrossRef]
  21. Eichler, A.; Tinner, W.; Brütsch, S.; Olivier, S.; Papina, T.; Schwikowski, M. An ice-core based history of Siberian forest fires since AD 1250. Quat. Sci. Rev. 2011, 30, 1027–1034. [Google Scholar] [CrossRef]
  22. Farjon, A. Pines: Drawings and Descriptions of the Genus Pinus, 2nd ed.; Brill: Leiden, The Netherlands, 2005; p. 236. ISBN 9004139168. [Google Scholar]
  23. Tamura, K.; Peterson, D.; Peterson, N.; Stecher, G.; Nei, M.; Kumar, S. MEGA5: Molecular Evolutionary Genetics Analysis using Maximum Likelihood, Evolutionary Distance, and Maximum Parsimony Methods. Mol. Biol. Evol. 2011, 28, 2731–2739. [Google Scholar] [CrossRef] [PubMed]
  24. Gernandt, D.S.; GeadaLópez, G.; Garcia, S.O.; Liston, A. Phylogeny and classification of Pinus. Taxon 2005, 54, 29–42. [Google Scholar] [CrossRef]
  25. Little, E.L., Jr.; Critchfield, W.B. Subdivisions of the Genus Pinus (Pines); Miscellaneous Publications 1144; U.S. Department of Agriculture: Washington, DC, USA, 1969; p. 51.
  26. Price, R.A.; Liston, A.; Strauss, S.H. Phylogeny and systematics of Pinus. In Ecology and Biogeography of Pinus; Richardson, D.M., Ed.; Cambridge University Press: Cambridge, UK, 1988; pp. 49–68. ISBN 0521789109. [Google Scholar]
  27. Pääbo, S. Ancient DNA: Extraction, characterization, molecular cloning, and enzymatic amplification. Proc. Natl. Acad. Sci. USA 1989, 86, 1939–1943. [Google Scholar] [CrossRef] [PubMed]
  28. Suyama, Y.; Kawamuro, K.; Kinoshita, I.; Yoshimura, K.; Tsumura, Y.; Takahara, H. DNA sequence from a fossil pollen of Abies spp. from Pleistocene peat. Genes Genet. Syst. 1996, 71, 145–149. [Google Scholar] [CrossRef] [PubMed]
  29. Parducci, L.; Suyama, Y.; Lascoux, M.; Bennett, K.D. Ancient DNA from pollen: a genetic record of plant population history. Mol. Ecol. 2005, 14, 2873–2882. [Google Scholar] [CrossRef] [PubMed]
  30. Parks, M.; Cronn, R.; Liston, A. Increasing phylogenetic resolution at low taxonomic levels using massively parallel sequencing of chloroplast genomes. BMC Biol. 2009, 7, 84. [Google Scholar] [CrossRef] [PubMed]
  31. Gugerli, F.; Senn, J.; Anzidei, M.; Madaghiele, A.; Büchler, U.; Sperisen, C.; Vendramin, G.G. Chloroplast microsatellites and mitochondrial nad1 intron 2 sequences indicate congruent phylogenetic relationships among Swiss stone pine (Pinus cembra), Siberian stone pine (Pinus sibirica), and Siberian dwarf pine (Pinus pumila). Mol. Ecol. 2001, 10, 1489–1497. [Google Scholar] [CrossRef] [PubMed]
  32. Heinze, B.; Holzer, K. A review of research on Pinus cembra in Austria, with special reference to the conservation of genetic resources. In Proceedings of the 5th Symposium for Research in Protected Areas, Mittersill, Austria, 10–12 June 2013; pp. 279–284. [Google Scholar]
  33. Bourgeois, J.C.; Koerner, R.M.; Alt, B.T. Airborne pollen: a unique mass tracer, its influx to the Canadian High Arctic. Ann. Glaciol. 1985, 7, 109–116. [Google Scholar] [CrossRef]
  34. Rogers, C.A.; Levetin, E. Evidence of long-distance transport of mountain cedar pollen into Tulsa, Oklahoma. Int. J. Biometeorol. 1998, 42, 65–72. [Google Scholar] [CrossRef]
  35. Rousseau, D.D.; Duzer, D.; Cambon, G.; Jolly, D.; Poulsen, U.; Ferrier, J.; Schevin, P.; Gros, R. Long distance transport of pollen to Greenland. Geophys. Res. Lett. 2003, 30, 1765. [Google Scholar] [CrossRef]
  36. Rousseau, D.D.; Schevin, P.; Duzer, D.; Cambon, G.; Ferrier, J.; Jolly, D.; Poulsen, U. New evidence of long distance pollen transport to southern Greenland in late spring. Rev. Palaeobot. Palynol. 2006, 141, 277–286. [Google Scholar] [CrossRef]
  37. Mohanty, R.P.; Buchheim, M.A.; Anderson, J.; Levetin, E. Molecular analysis confirms the long-distance transport of Juniperus ashei pollen. PLoS ONE 2017, 12, e0173465. [Google Scholar] [CrossRef] [PubMed]
  38. Bory, A.J.M. A 10,000 km dust highway between the Taklamakan Desert and Greenland. In Past Global Changes Magazine; Merkel, U., Rousseau, D.D., Stuut, J.B., Winckler, G., von Gunten, L., Kiefer, T., Eds.; PAGES International Project Office: Bern, Switzerland, 2014; Volume 22, pp. 72–73. [Google Scholar]
  39. Nagatsuka, N.; Takeuchi, N.; Nakano, T.; Shin, K.; Kokado, E. Geographical variations in Sr and Nd isotopic ratios of cryoconite on Asian glaciers. Environ. Res. Lett. 2014, 9, 045007. [Google Scholar] [CrossRef] [Green Version]
  40. Vallelonga, P. The enigma of dust provenance: Where else does Antarctic dust come from? In Past Global Changes Magazine; Merkel, U., Rousseau, D.D., Stuut, J.B., Winckler, G., von Gunten, L., Kiefer, T., Eds.; PAGES International Project Office: Bern, Switzerland, 2014; Volume 22, pp. 74–75. [Google Scholar]
  41. Matsushita, M. Pollen Analysis and Archaeology; Douseisha: Tokyo, Japan, 2004; p. 135. ISBN 4886213030. (In Japanese) [Google Scholar]
  42. Willis, K.J.; Bennett, K.D.; Birks, H.J.B. The late Quaternary dynamics of Pines in Europe. In Ecology and Biogeography of Pinus; Richardson, D.M., Ed.; Cambridge University Press: Cambridge, UK, 1998; pp. 107–121. ISBN 0521789109. [Google Scholar]
  43. Suyama, Y.; Kawamuro, K.; Takahara, H.; Shichi, K.; Yoshimaru, H.; Kinoshita, I.; Yoshimura, K.; Tsumura, Y. Study on vegetation dynamics and biological evolution from DNA analyses of ancient pollen. Chikyu Mon. Symp. 2003, 42, 187–192. (In Japanese) [Google Scholar]
Figure 1. Location of the Belukha glacier in Russia’s Altai Republic, and distributions of extant P. cembra and two Pinus species (P. sibirica and P. sylvestris) found in the region surrounding the glacier. The sampling site was located on the western side of Mt. Belukha. The distribution map was compiled based on the maps of Farjon [22]. The figure is from our previous study [10].
Forests 09 00444 g001
Figure 2. Flow chart of the experimental procedure.
Forests 09 00444 g002
Table 1. Primers for the target fragments used in the present study. The primers for nested PCR for Pns1–7 are not shown because the multiplex PCR products showed no visible band by agarose gel electrophoresis, and an additional round of nested PCR was not performed.
Mixture for Multiplex PCRPrimer IDRegionPrimers for Multiplex PCRSequence (5′-3′)Product Size (bp)Primers for Nested PCRSequence (5′-3′)Product Size (bp)
Mixture 1 (Matsu1-Matsu5)Matsu1clpPMatsu m1FCAACTTGGGTCGACTTATACAACC185Matsu n1FCGACTTATACAACCGACTTTATCG174
Matsu m1RACCTACCCCTGGTATTACTGATCC Matsu n1RCCTACCCCTGGTATTACTGATCC
Matsu2rpoAMatsu m2FCTGGGTCCAACAATATAAATAGAAGC174Matsu n2FCAATATAAATAGAAGCTTCTCGGATTCC164
Matsu m2RAGTAGAAGGAACATGTATCACACG Matsu n2Rsame as Matsu m2R
Matsu3atpBMatsu m3FGGAGAACCTGTCGATAATTTGGG130Matsu n3FCCTGTCGATAATTTGGGTCCTG115
Matsu m3RGATCTACTACTTTAATGCCTGTTTCG Matsu n3RCTTTAATGCCTGTTTCGAAGATGG
Matsu4rpoC1Matsu m4FGCCTAGTAAATTTTCACGAAATCTTCCC134Matsu n4FTTCCCTCTTTGCCTTCGATCAC111
Matsu m4RAGGAAGCCGTAGATGCACTTC Matsu n4Rsame as Matsu m4R
Matsu5ycf3Matsu m5FCTGGAGATAGAACAATTCCTTCTGTC143Matsu n5FGTATCCCCGGTCAATGCAC115
Matsu m5RCCTATCAAATAGGTTCAACTATACAAGCMatsu n5Rsame as Matsu m5R
Mixture 2 (Matsu6-Matsu10)Matsu6ycf4Matsu m6FGGTTCACATTATCACCAGTACGAG160Matsu n6FCACATTATCACCAGTACGAGTTAAAGG157
Matsu m6RCCCGGAATAAATCGTCGTATTTTC Matsu n6Rsame as Matsu m6R
Matsu7rpoBMatsu m7FACTCCAGAATGGCTTTTTCC133Matsu n7FAATGGCTTTTTCCCTCGAC109
Matsu m7RTCAGSTATGGGTTTAAATCTCG Matsu n7RTCTCGAAGAGATTCTGGACAATAC
Matsu8rpoC1Matsu m8FAGGCATAAGACCATCCATTTTGG186Matsu n8FCCATCCATTTTGGTTCTATATTTGTTCGG177
Matsu m8RACATATGGAATGGAAGAACTTGGTG Matsu n8RCACATATGGAATGGAAGAACTTGGTG
Matsu9ycf3Matsu m9FGATTAATCCCCGGAGAATACAGG147Matsu n9FGGAGAATACAGGGCGTTAAGAAC136
Matsu m9RATTAAMAGGGGCTAGTGTATTTCC Matsu n9Rsame as Matsu m9R
Matsu10ycf4Matsu m10FAGTATTTGCTGAGATGACAATAGGG142Matsu n10Fsame as Matsu m10F118
Matsu m10RAACCTATAACAGGGTCTCGAAAAAG Matsu n10RGAAGTAATTTCTTTTGGGCTTGTATCC
Mixture 3 (Strbs1, 3, 5, 7, 9, 11)Strbs1ycf1Strbs m1FTTCGGATCGAGTGAAAGCTC146Strbs n1FGAAAGCTCTAAGCCATGGATCTC113
Strbs m1RGGTCTATTGTTCCACGCAATG Strbs n1RCCCCATTAAGCAATGGATCATAC
Strbs3ycf1Strbs m3FCTGAGCATTGGCAGGAATTG148Strbs n3FCAGGAATTGGAACACAAAAGC125
Strbs m3RGCTAATGGATAAARCCGTTTCG Strbs n3RAGCCGTTTCGAAATAGGTTC
Strbs5ycf1Strbs m5FGGAAATGCAGATCCAAGAAATC182Strbs n5Fsame as Strbs m5F148
Strbs m5RCAACGTTTCTARCATCAATTCG Strbs n5RCACTAAAGAGTTTGTGTAGATCCGTTC
Strbs7ycf1Strbs m7FGGATGATTCAACGCAAACG199Strbs n7FCGGATGATTCAACGCAAAC180 (186)
Strbs m7RTTTGACCTTTCTTGTACGAATCC Strbs n7RTCCTACTCGTTGATATTTGAATTGG
Strbs9ycf1Strbs m9.1FCCTAAAGATTATTATGACACGTTCG194Strbs n9.1FCGATTCTGGTAGAGTGAATCAGG169
Strbs m9.1RTTTGATTGAGCCACTAATATGAGAC Strbs n9.1Rsame as Strbs m9.2R
Strbs m9.2FTTATGACACGTTCGATTCTGG181
Strbs m9.2RTGATTGAGCCACTAATATGAGACC
Strbs11ycf1Strbs m11FCGTTTGAAGCCTTGGCATAG211Strbs n11Fsame as Strbs m11F177
Strbs m11RCTCTCTTCAATCCTTTCTTCAATCC Strbs n11RTCCTTTCTTCAATCCTTTCTTCAC
Mixture 4 (Strbs2, 4, 6, 8, 10, 12)Strbs2ycf1Strbs m2.1FGGCATTGCGTGGAACAATAG178Strb n2.1Fsame as Strb m2.1F129
Strbs m2.1RCAATTCCTGCCAATGCTCAG Strb n2.1RTTCGGAAATCCCTCTTTACAGTC
Strbs m2.2FGGGGATTCTTTTACTGAAATGTATG169
Strbs m2.2RTCGGAAATCCCTCTTTACAGTC
Strbs4ycf1Strbs m4FGTTCCGAGCACTAAATCATCG196Strb n4FCGAAAAGAGGAAAAGTTGAACC177
Strbs m4RGGATCTGCATTTCCAACAAATC Strb n4Rsame as Strb m4R
Strbs6ycf1Strbs m6FACCGAATTGATGGTAGAAACG167Strb n6FCCGAATTGATGGTAGAAACG137
Strbs m6RTTGCGTTGAATCATCCGTAG Strb n6RCGCGACAATTTCGTAGTATTG
Strbs8ycf1Strbs m8FCATGCCGAGTCAGATTATCGTC178Strb n8Fsame as Strb m8F140
Strbs m8RTCACTCTACCAGAATCGAACGTG Strb n8RGGATAAGTGGGTATTTCCATTCTTCTC
Strbs10ycf1Strbs m10FGAGGTCTCATATTAGTGGCTCAATC256Strb n10Fsame as Strb m10F228
Strbs m10RCAAGGCTTCAAACGAAAAGG Strb n10RGCTTTATCTGCATACCATATTTGTACC
Strbs12ycf1Strbs m12FGGATTGAAGAAAGGATTGAAGAGAG174Strb n12FGGATTGAAGAAAGGATTGAAGAG135
Strbs m12RACCCATAGGGGTAGTCTCAGTCTC Strb n12RTTGTATCCGGTCATTAAGTTCAC
Mixture 5 (Pns1-Pns5)Pns1ycf1Pns m1FTTTCGGATCGAGTGAAAGCTC150
GGTTTATTGTTCCACGGAATGC
Pns2ycf1Pns m2FGGTCAAGTAGAAGATCAACAAACTG149
Pns3ycf1Pns m3FCCAACCATATCGTTTATCAAGC213
TCTCTACGACGTTTTGGAAGC
Pns4rbcLPns m4FTTGTACACAAGCTTCTAGAGCAACC190
AGATTGGGTATCTATGCCAGGTG
Pns5rpl20-rps18Pns m5FAGAGGCAGTTGCTTCCAAATC161
TCCGGGAGAATCTGTTCTATCC
Mixture 6 (Pns6-Pns7)Pns6ycf1Pns m6FTTGCTCTTCAGAGGAATGTTCG126
TATACATCAGGAATTGGTCATCCAC
Pns7ycf1Pns m7FCTCGGCAATAATGAGCCAAAG149
GGGACATTATTTGAATGCTACTGC
Table 2. Classification system for the genus Pinus. The classification system is based on Gernandt et al. [24]. The colors indicating various taxa correspond to those in Table 3.
GenusSubgenusSectionSubsection
PinusStrobusParryaCembroides
Nelsoniae
Balfourianae
QuinquefoliaeStrobus
Krempfianae
Gerardianae
PinusTrifoliaeAustrales
Ponderosae
Contortae
PinusPinus
Pinaster
Table 3. Identification of pollen grains by multiplex PCR. Each pollen grain was identified at the subgenus, section, or subsection level based on regions that were positively amplified. The S, Q, P, and St indicate the subgenus Strobus, section Quinquefoliae, section Pinus, and subsection Strobus, respectively. Dashes indicate a lack of amplification. For the sequence data and identification procedures, see Supplementary data.
Primer IDRegionBelukha 1Belukha 2Belukha 3Belukha 4Belukha 5
Matsu1clpPQ----
Matsu2rpoAQQQ--
Matsu3atpBQQQQP
Matsu4rpoC1SSS--
Matsu5ycf3QQQ--
Matsu6Ycf4St----
Matsu7rpoB-SQ--
Matsu8rpoC1StSt---
Matsu9ycf3Q-Q--
Matsu10Ycf4Q----

