Productivity was calculated for each case study or data group, respectively, as an average of the ratio of harvest volume and time required for each cycle, extrapolated to one hour.
3.3.1. FM Group
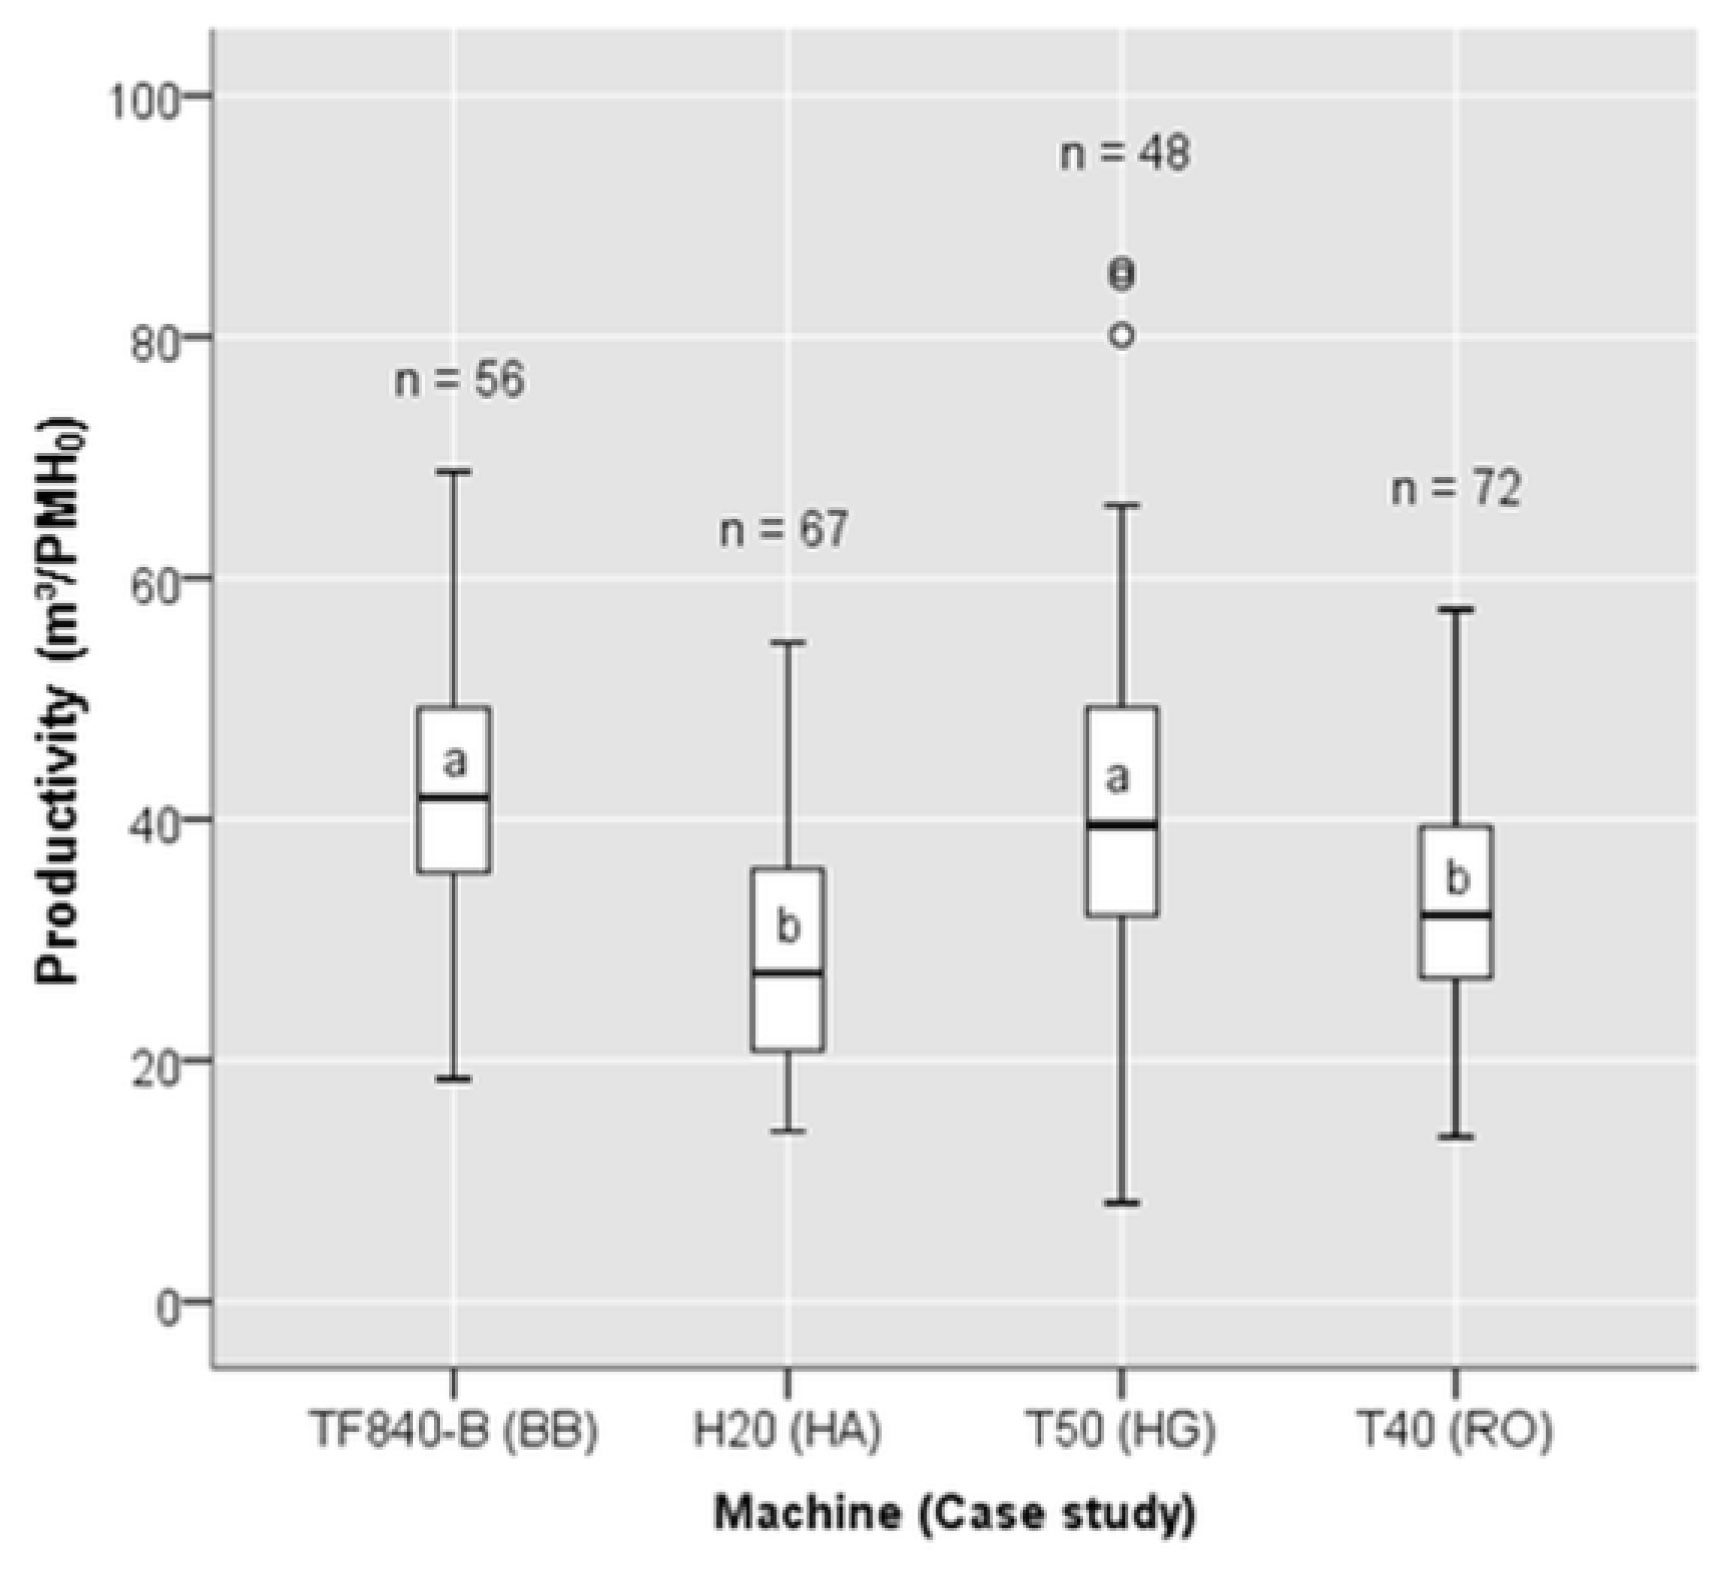
Overall, the harvesting productivities observed in the four case studies were on a considerably high level, ranging from 28 to 49 m³/PMH
0 (
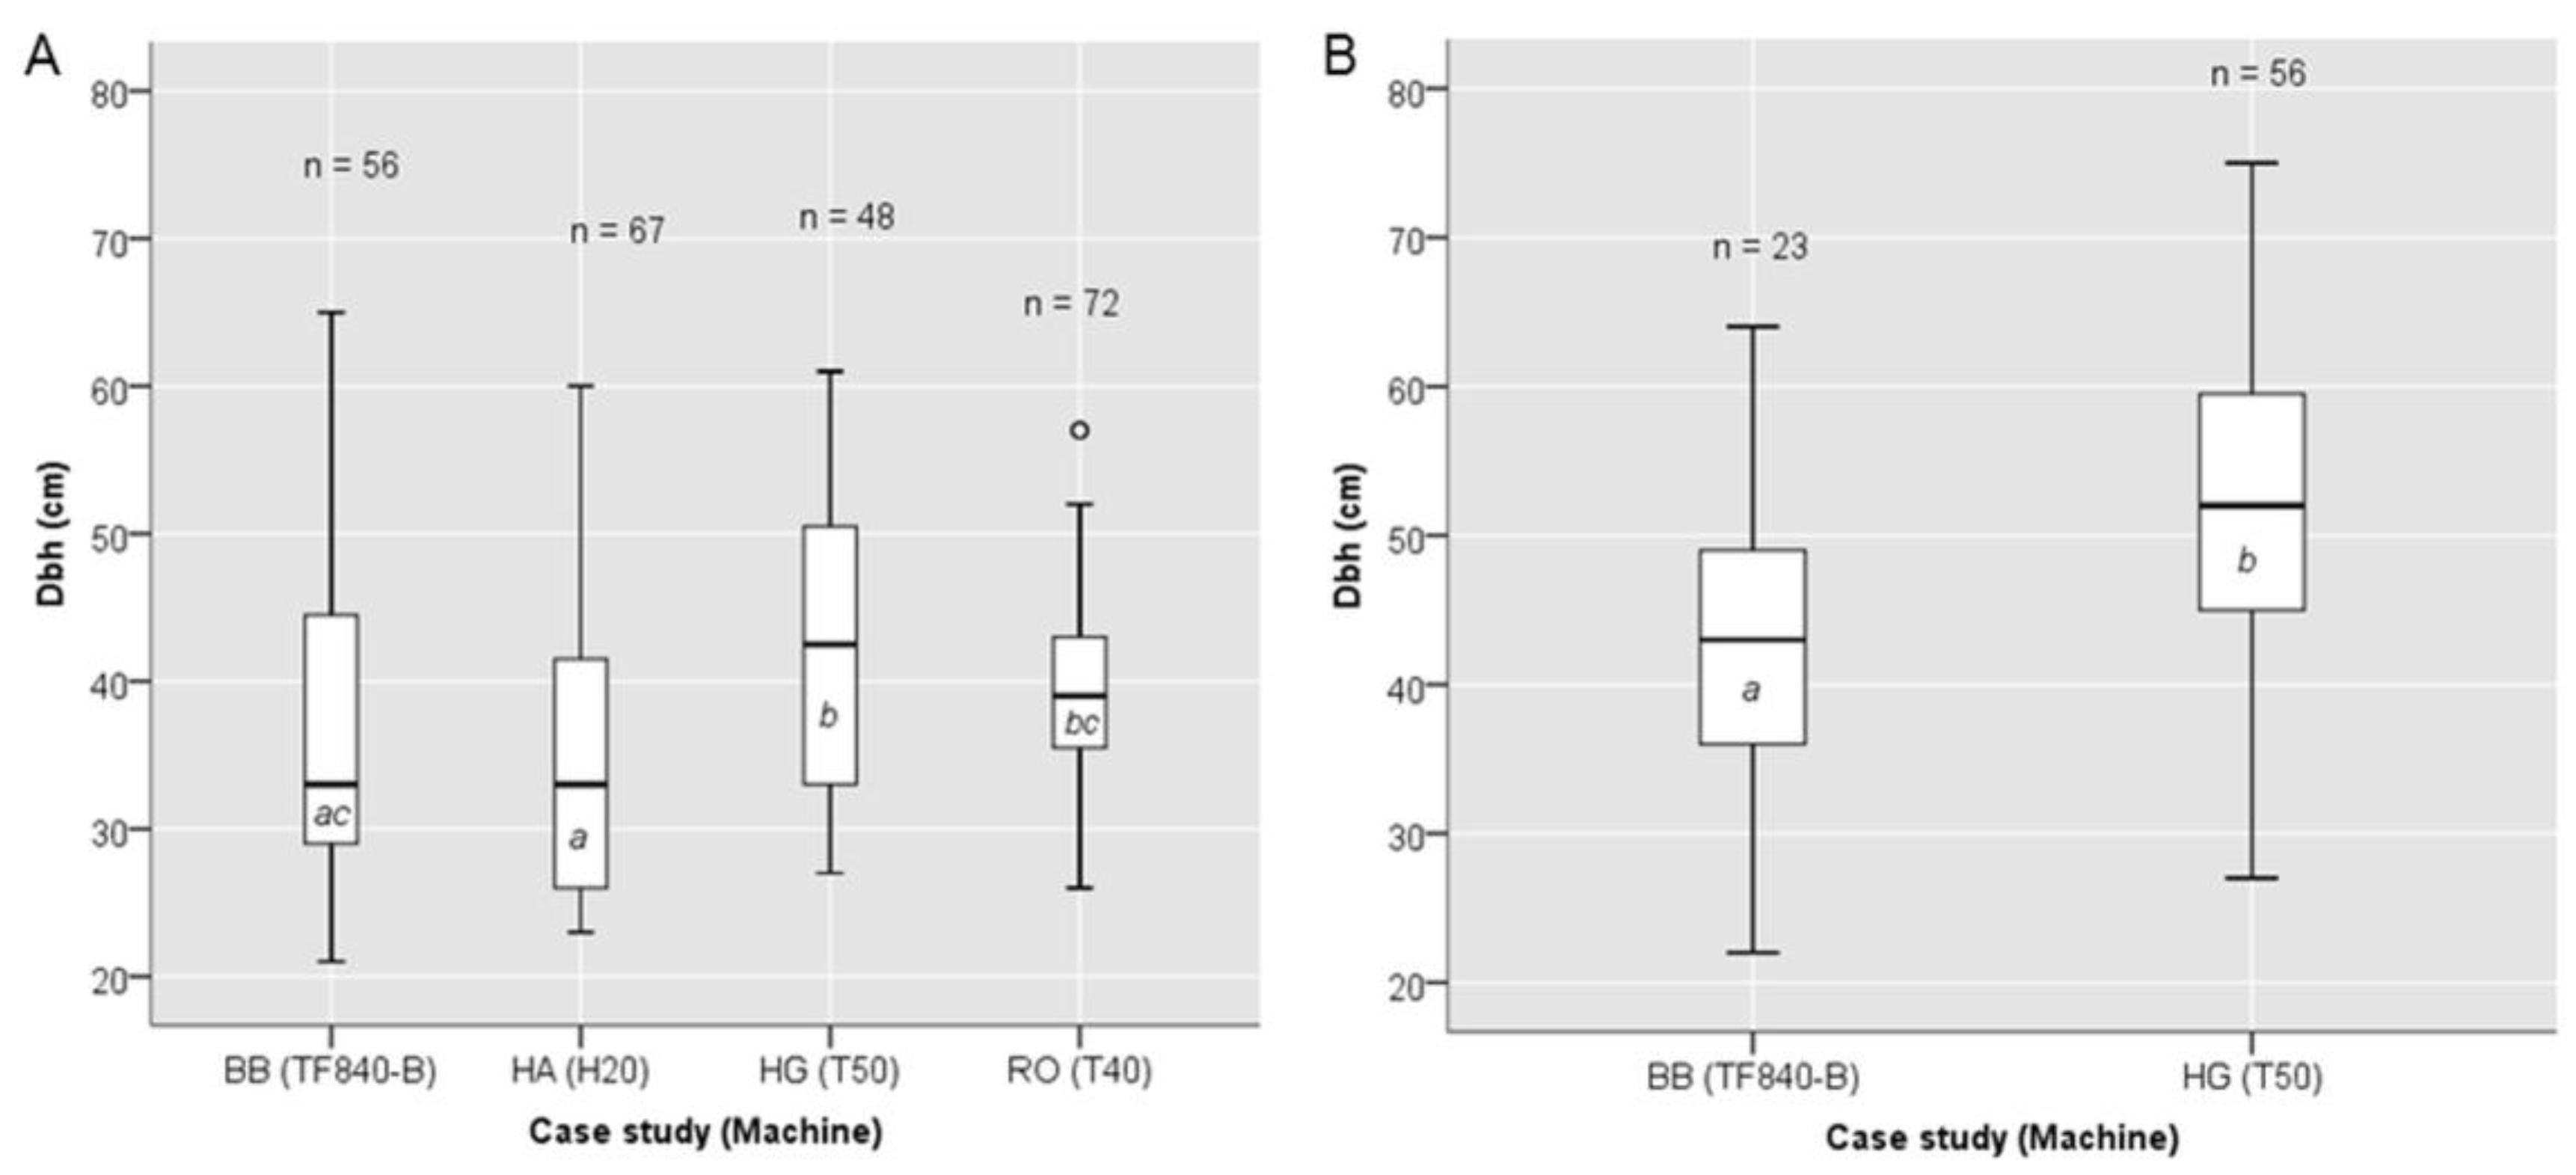
Table 7). In all four case studies, productivity of the tested harvesters increased with greater tree size as reported in two dbh classes (20 to 39 cm and 40 cm and above). However, while productivity was 26% and 40% higher with the larger tree size (dbh) class for the TF840-B and T50, respectively, less pronounced increases of 14% and 6% were observed for the H20 and T40, respectively. No apparent cause for this observation could be identified; however, we assume a combined effect of the operators’ working techniques and, probably more important, the harvesting heads of the H20 and T40 reaching their capacity limits.
Regarding average harvesting productivity across all dbh classes, the TF840-B and T50 were on par with 43 m
3/PMH
0 and at the same time considerably higher than the average productivities of the other two harvesters, these being 29 m
3/PMH
0 for the H20 and 34 m
3/PMH
0 for the T40. The subdivision of the tested harvesters into two groups in terms of productivity, that these observations implied, was confirmed by the analysis of covariance performed: the productivities of the H20 and the T40 were significantly different from the productivities of the TF840-B and the T50 (
Figure 5). Additionally, the analysis of covariance indicated that 31% of the variation of harvesting productivity (across all case studies) was explained by the combination of machine type (strictly speaking: case study) as factor and dbh as independent variable (covariate).
Given the constraint that sample size was rather low, the match in productivity by the TF840-B and the T50 can be explained, on the one hand, by the fact that the TF840-B was comparable to the tracked machines in terms of engine output and capacity of the harvesting head. On the other hand, the previously mentioned working technique of motor-manually preparing particularly large trees might also have contributed to the high productivity of this machine via the time savings during felling. The lower productivity observed for the H20 can be partly explained by the lowest average dbh of removal trees (35.8 cm) as compared to the other case studies and also due to the lowest capacity according to the technical specifications. However, no obvious explanation for the noticeable productivity difference between the very similar T40 and T50 harvesters could be found. The discrepancy, which was most pronounced for the larger trees, could be linked to the operators’ working technique and other factors difficult to capture quantitatively.
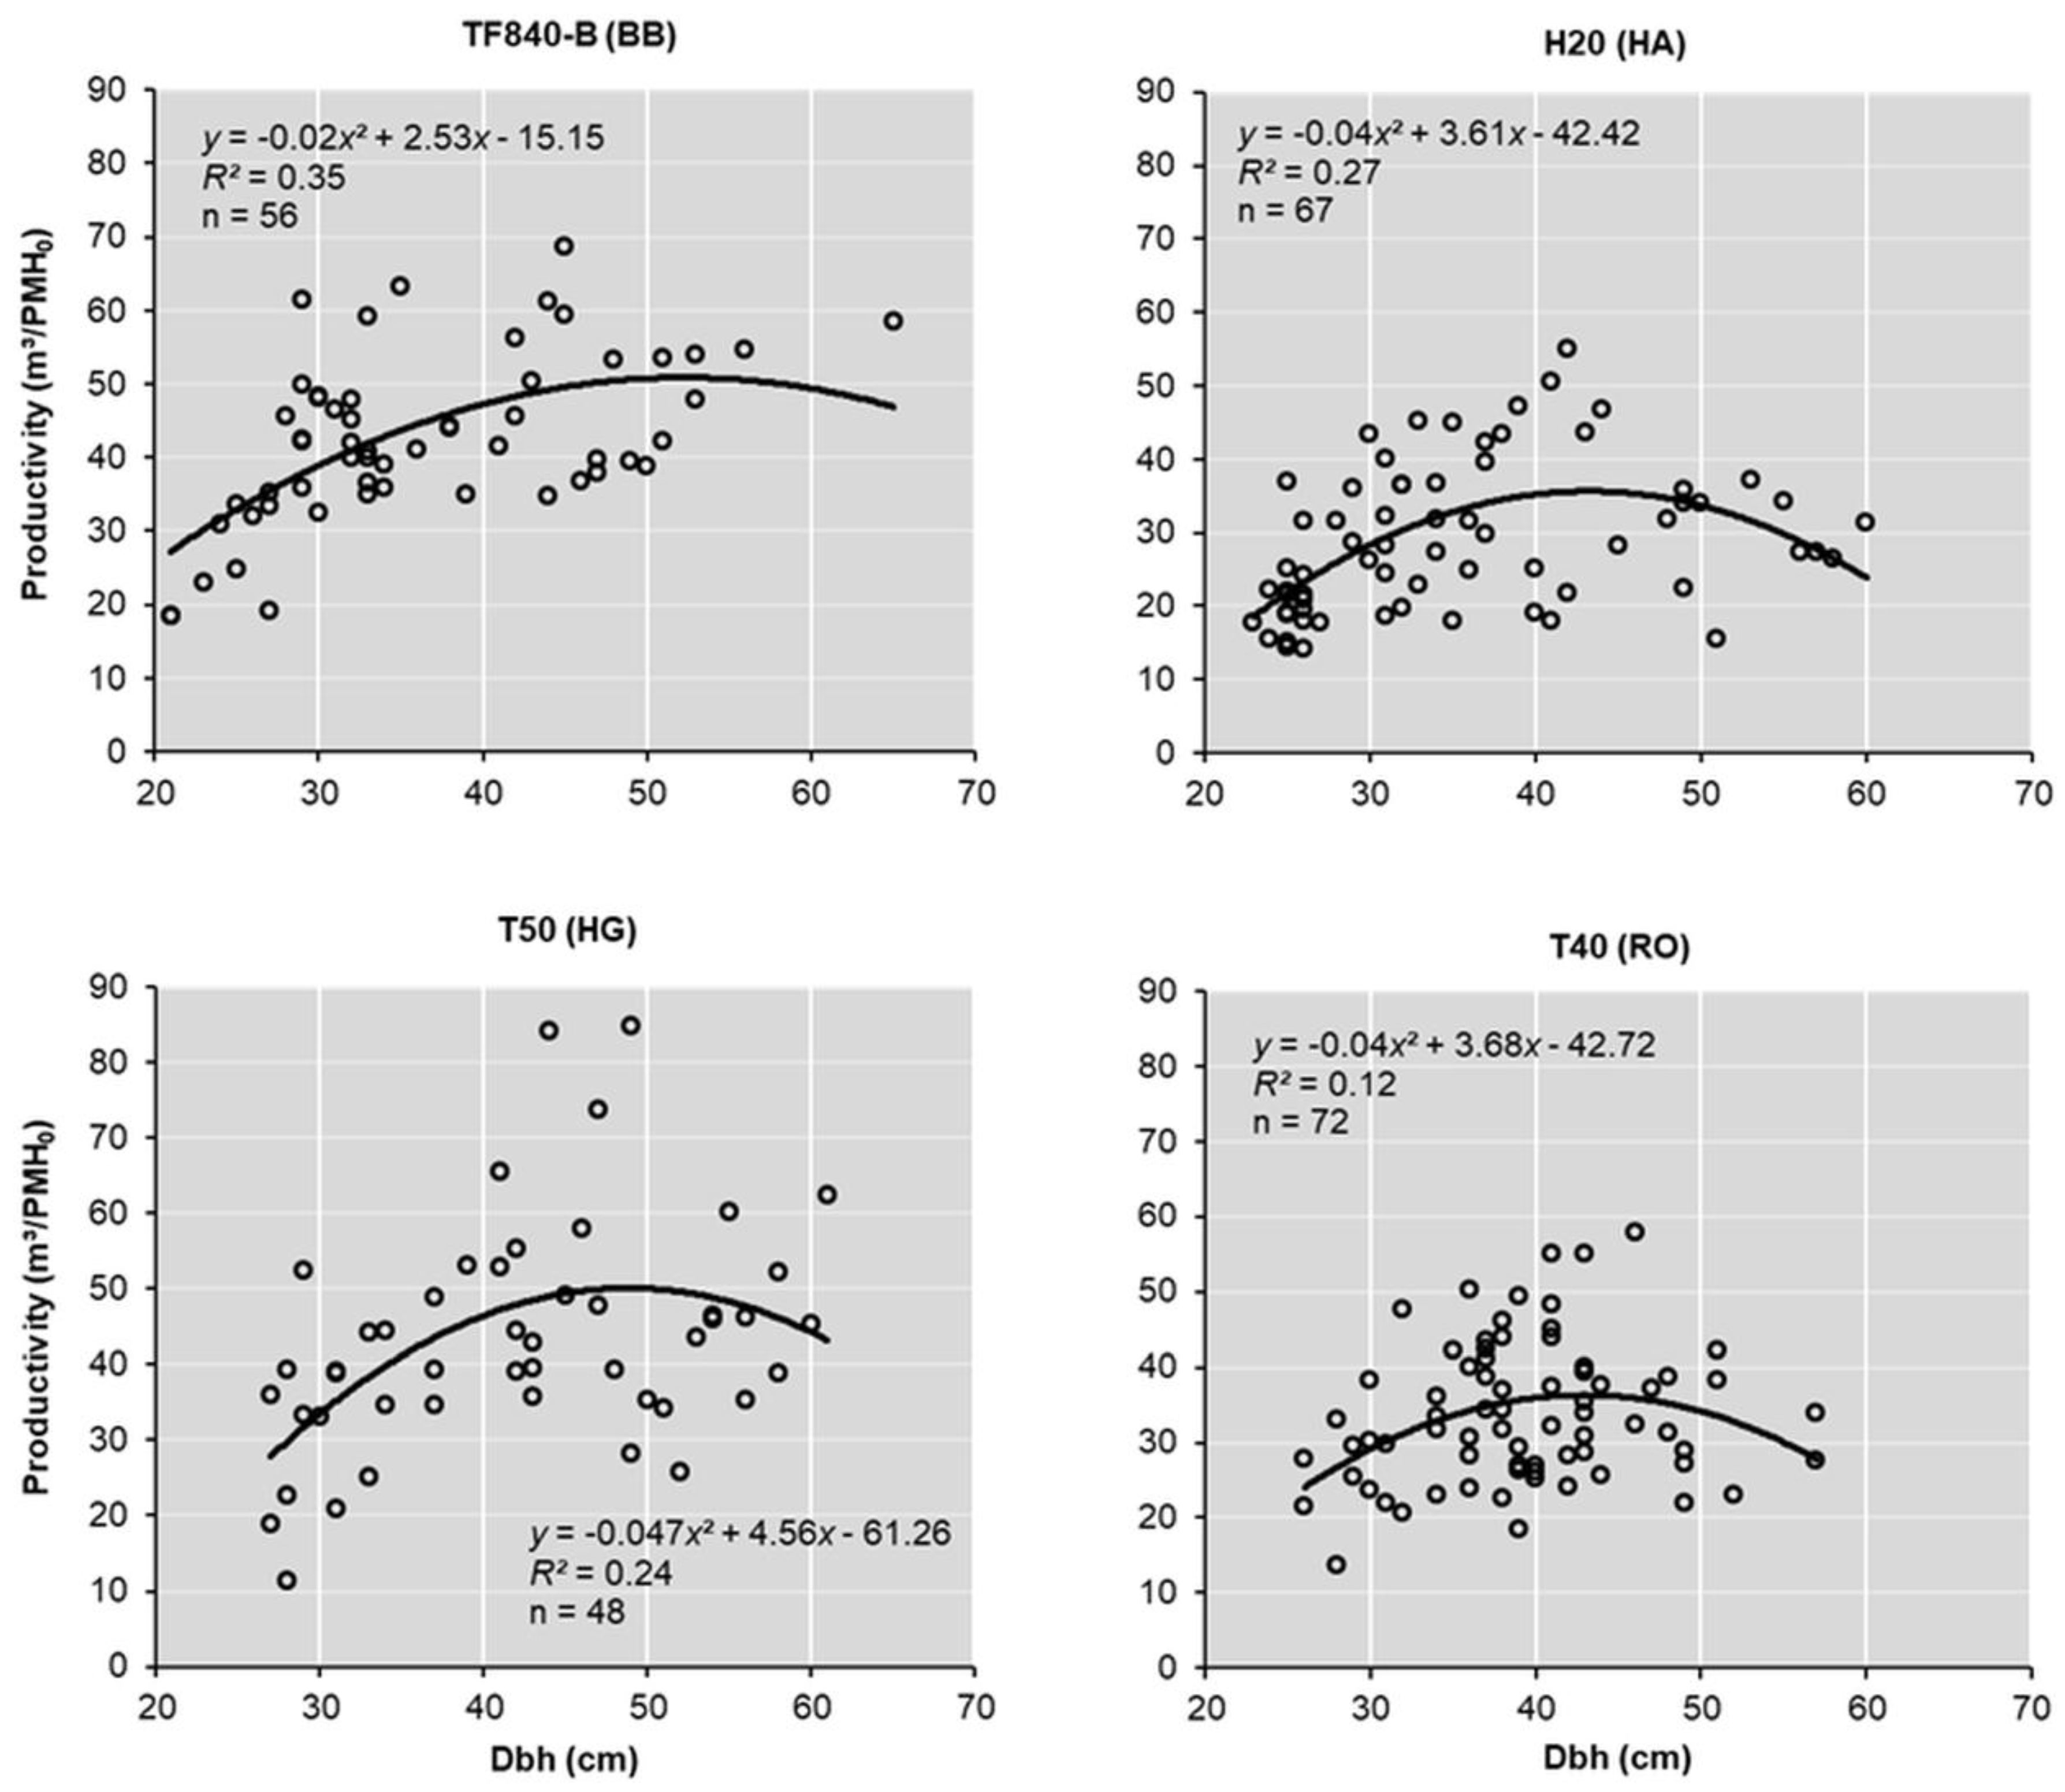
In the case of the TF840-B and the T50, regression curves show productivity maxima of approximately 50 m
3/PMH
0 at a dbh slightly above or below 50 cm; while in the case of the H20 and the T40, the maxima of about 35 m
3/PMH
0 were just below a dbh of 45 cm, as can be seen in
Figure 6. The rather low coefficients of determination are in line with other published works performed in deciduous stands [
2], while remaining lower than those normally reported in coniferous stands [
18,
19]. In the case of deciduous trees, other factors (tree morphology, single-tree volume) aside from dbh seem to strongly influence harvesting productivity.
Higher-than-expected harvesting productivities can also be explained by the fact that the deciduous trees removed in all four case studies were relatively tall (avg. of 28.8 m) and that the majority of the first two-thirds of the merchantable sections rarely exhibited large branches or other form characteristics that would hinder processing.
For large trees (merchantable stem volume > 1 m³) of mixed species, but mainly spruce and pine, Gerasimov et al. [
20] found productivities by a John Deere 1270 that were even substantially higher (by a factor of 2) than those observed in our study. However, these productivities were based on so-called “stem processing time” that excluded the work elements moving, boom-out and manipulation and are thus not directly comparable. In line with our findings, Pajkoš et al. [
21] reported average harvesting productivity of 35 m
3/PMH (measured over bark) with two harvesters (Rottne H11 and John Deere 1270) operated in a spruce-dominated stand with an average stem volume of 1.3 m
3.
3.3.2. MM Group
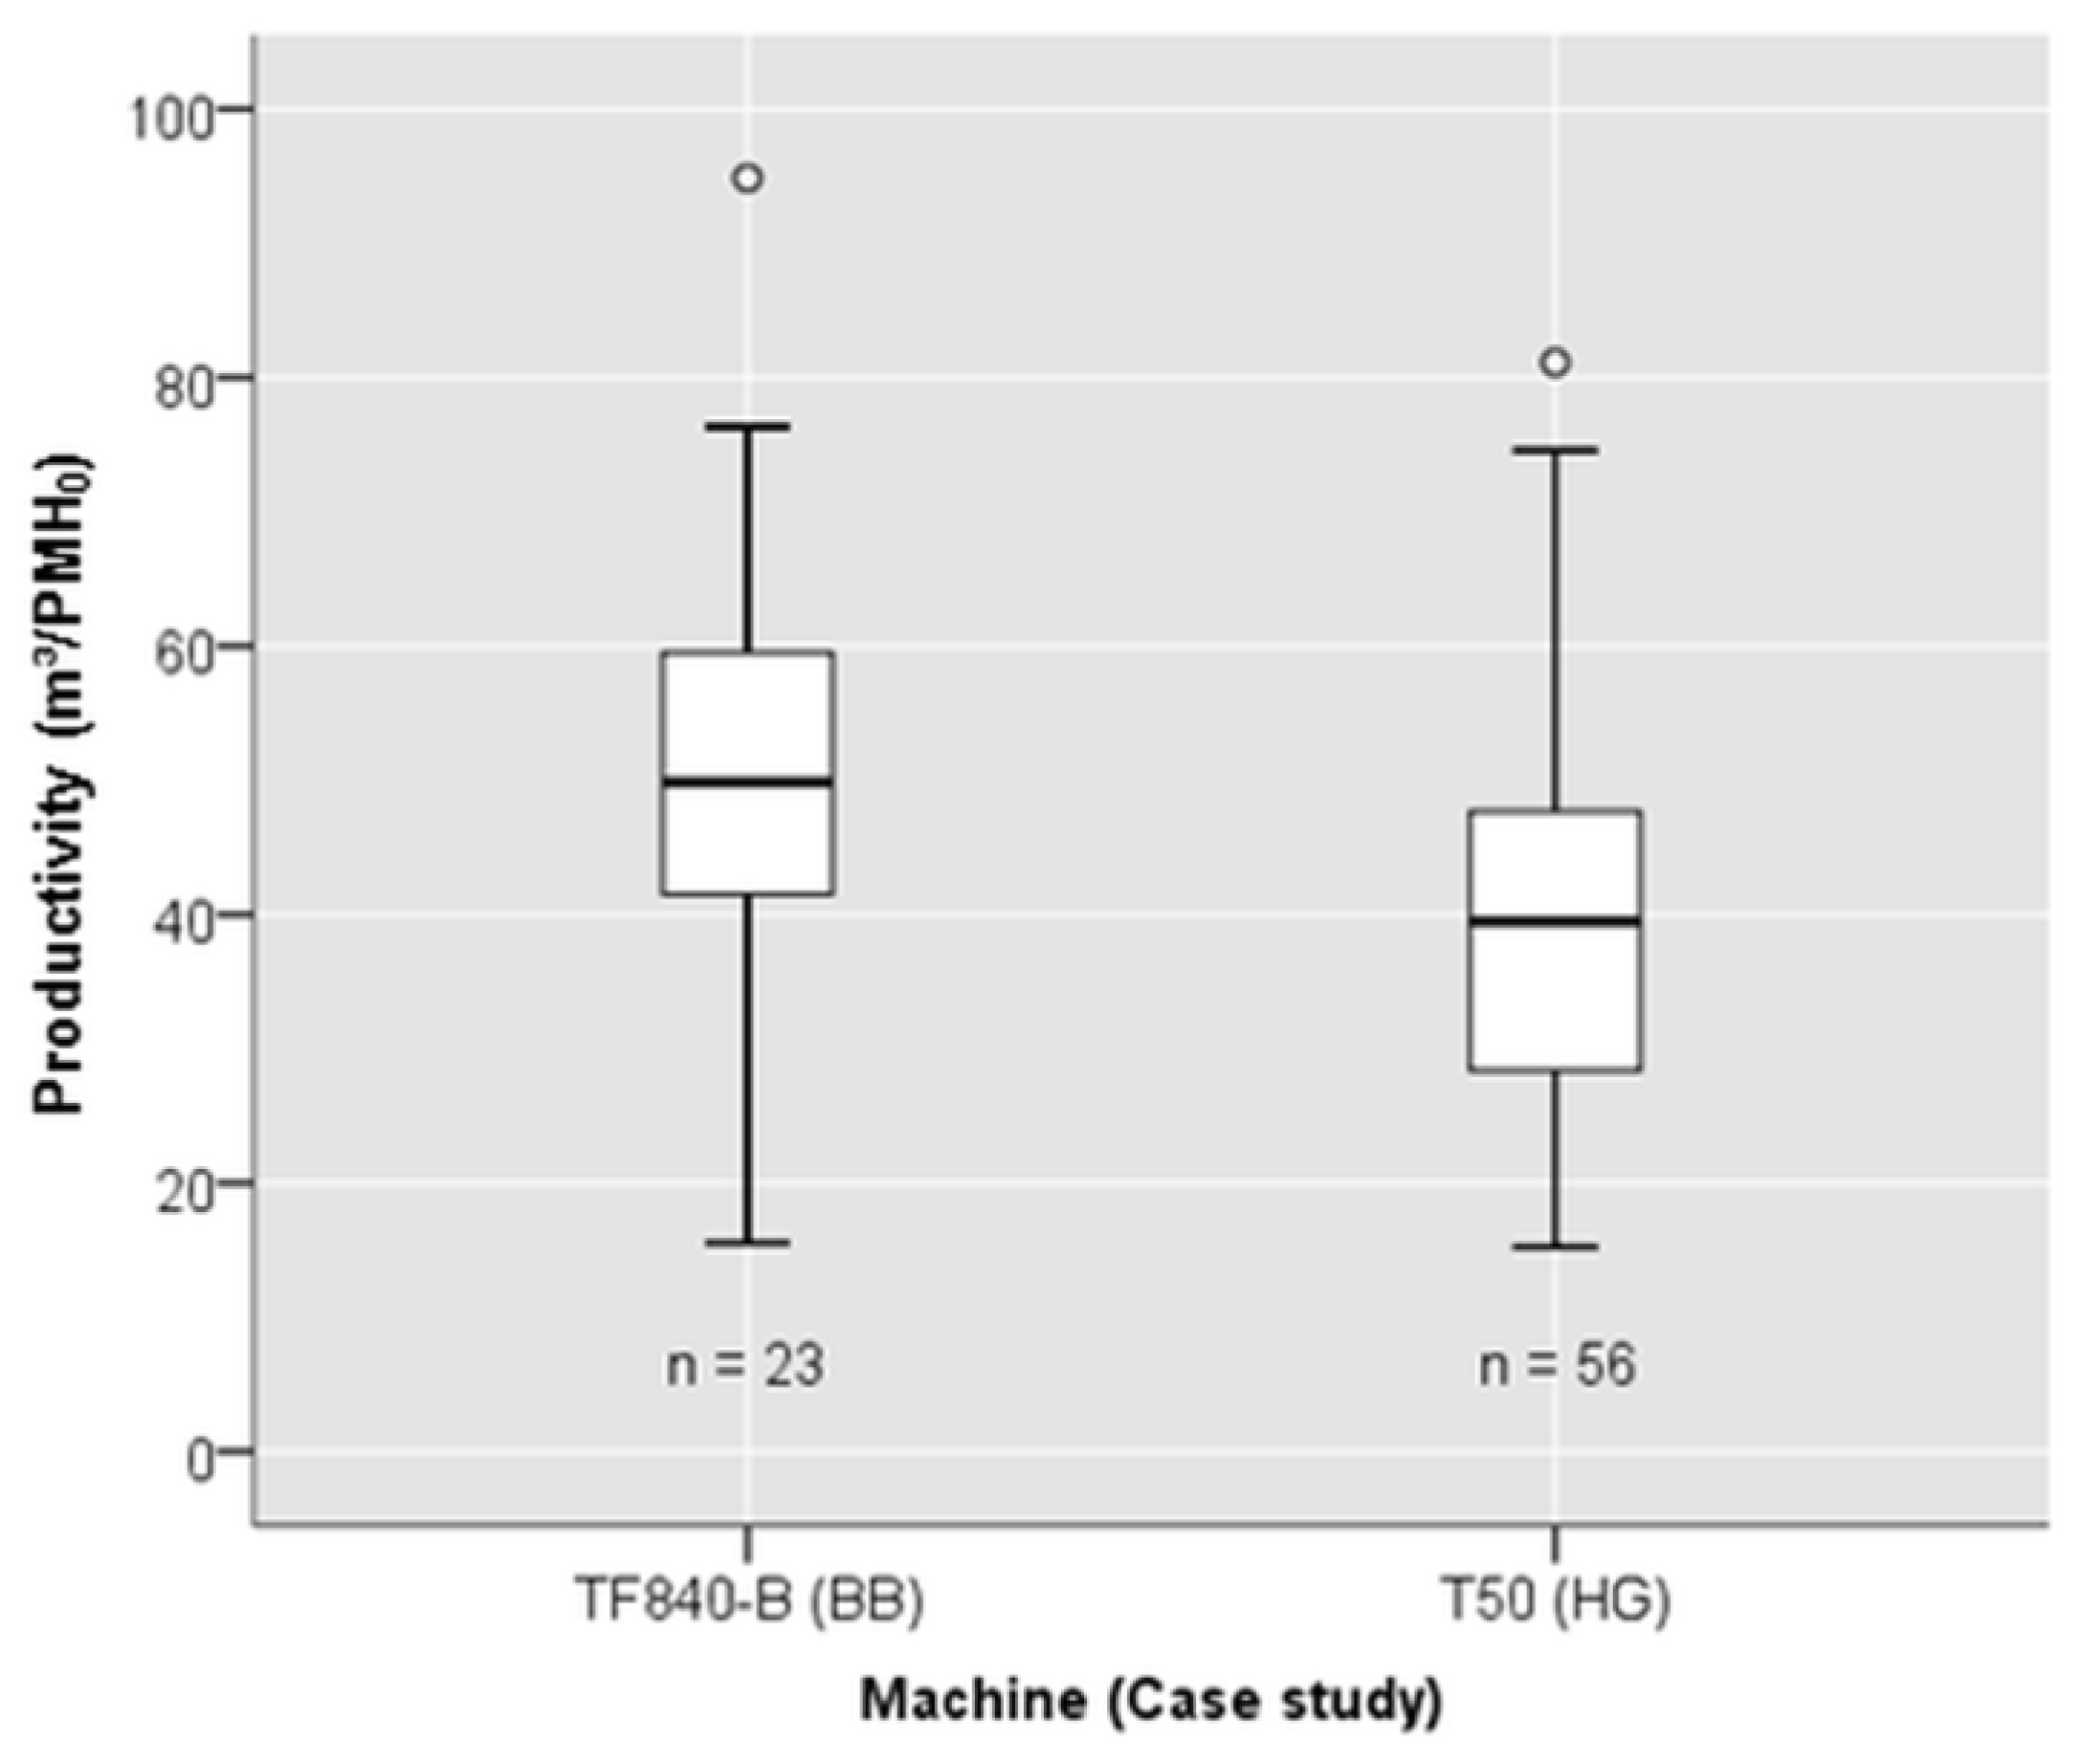
Observed productivity in the MM group was higher than in the FM group in the case of the TF840-B, while it was lower in the case of the T50 (
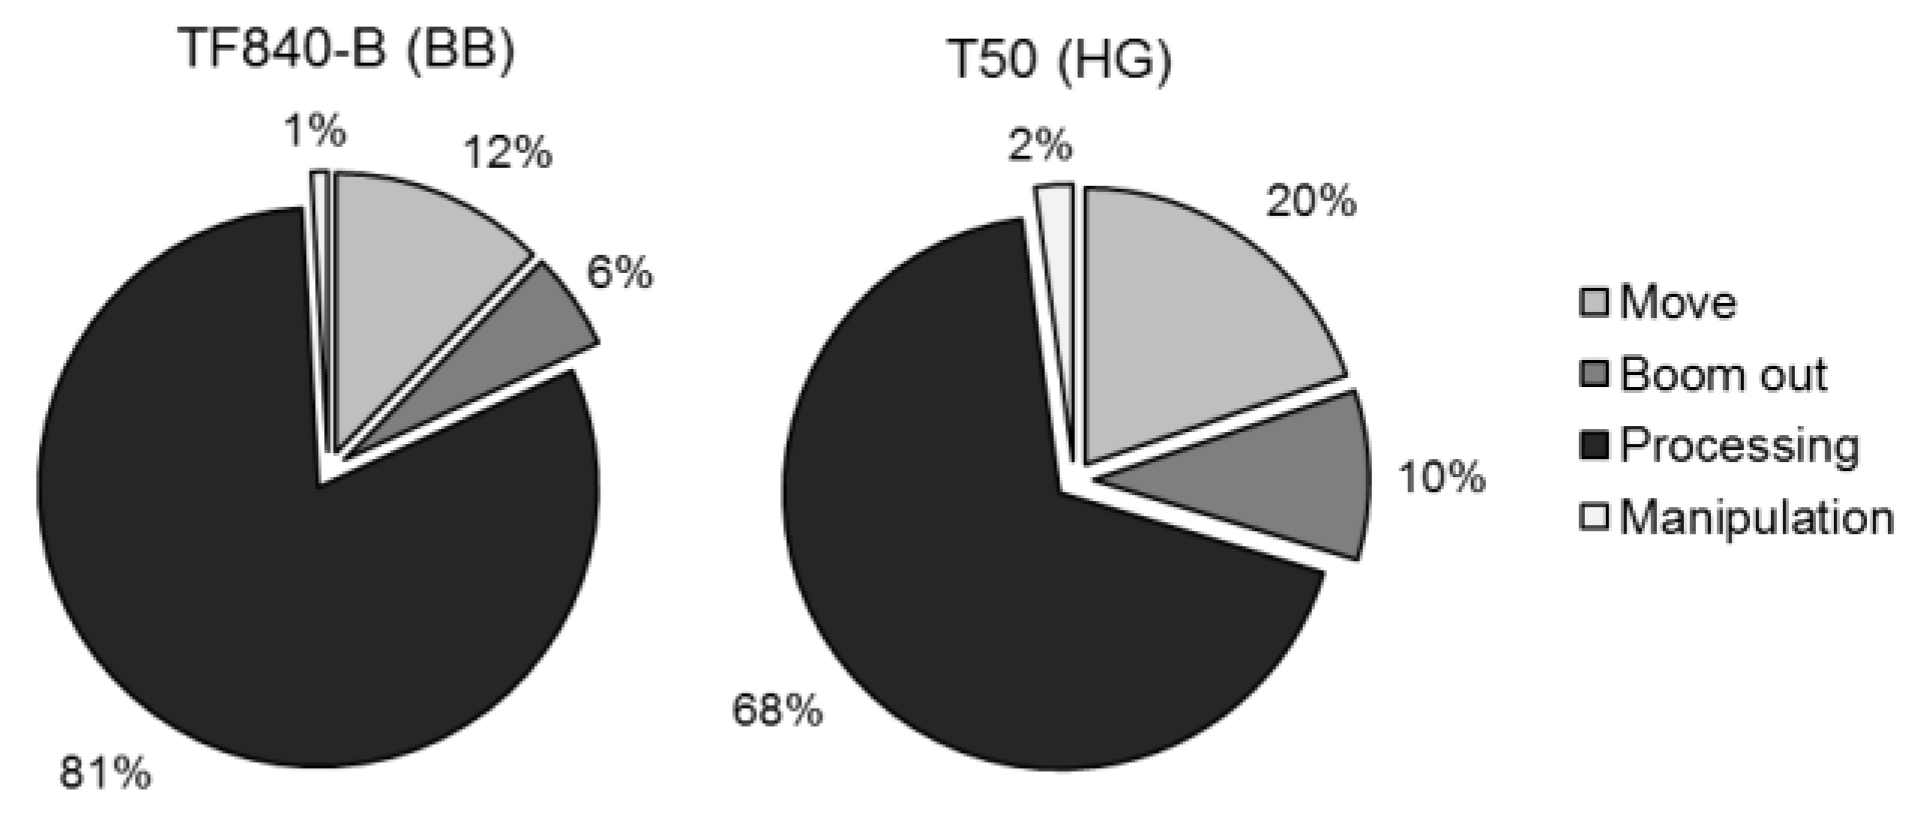
Table 8). At first glance, this seems contradictory to the cycle durations presented in
Table 6, especially the low time consumption for the work element processing in the case of the T50; but the same explanation, that is, the fact that the sawlogs were not processed by the T50 at all, applies here: while the T50 thus achieved considerable time savings, at the same time, it did not exploit the part of a tree that usually yields the highest product volumes in the shortest processing time. Even more than with the data in the FM group, here the small sample size (23 trees in the case of BB) must be considered together with any interpretations, and as indicated in
Figure 7, the productivity difference between the two case studies was not significant.
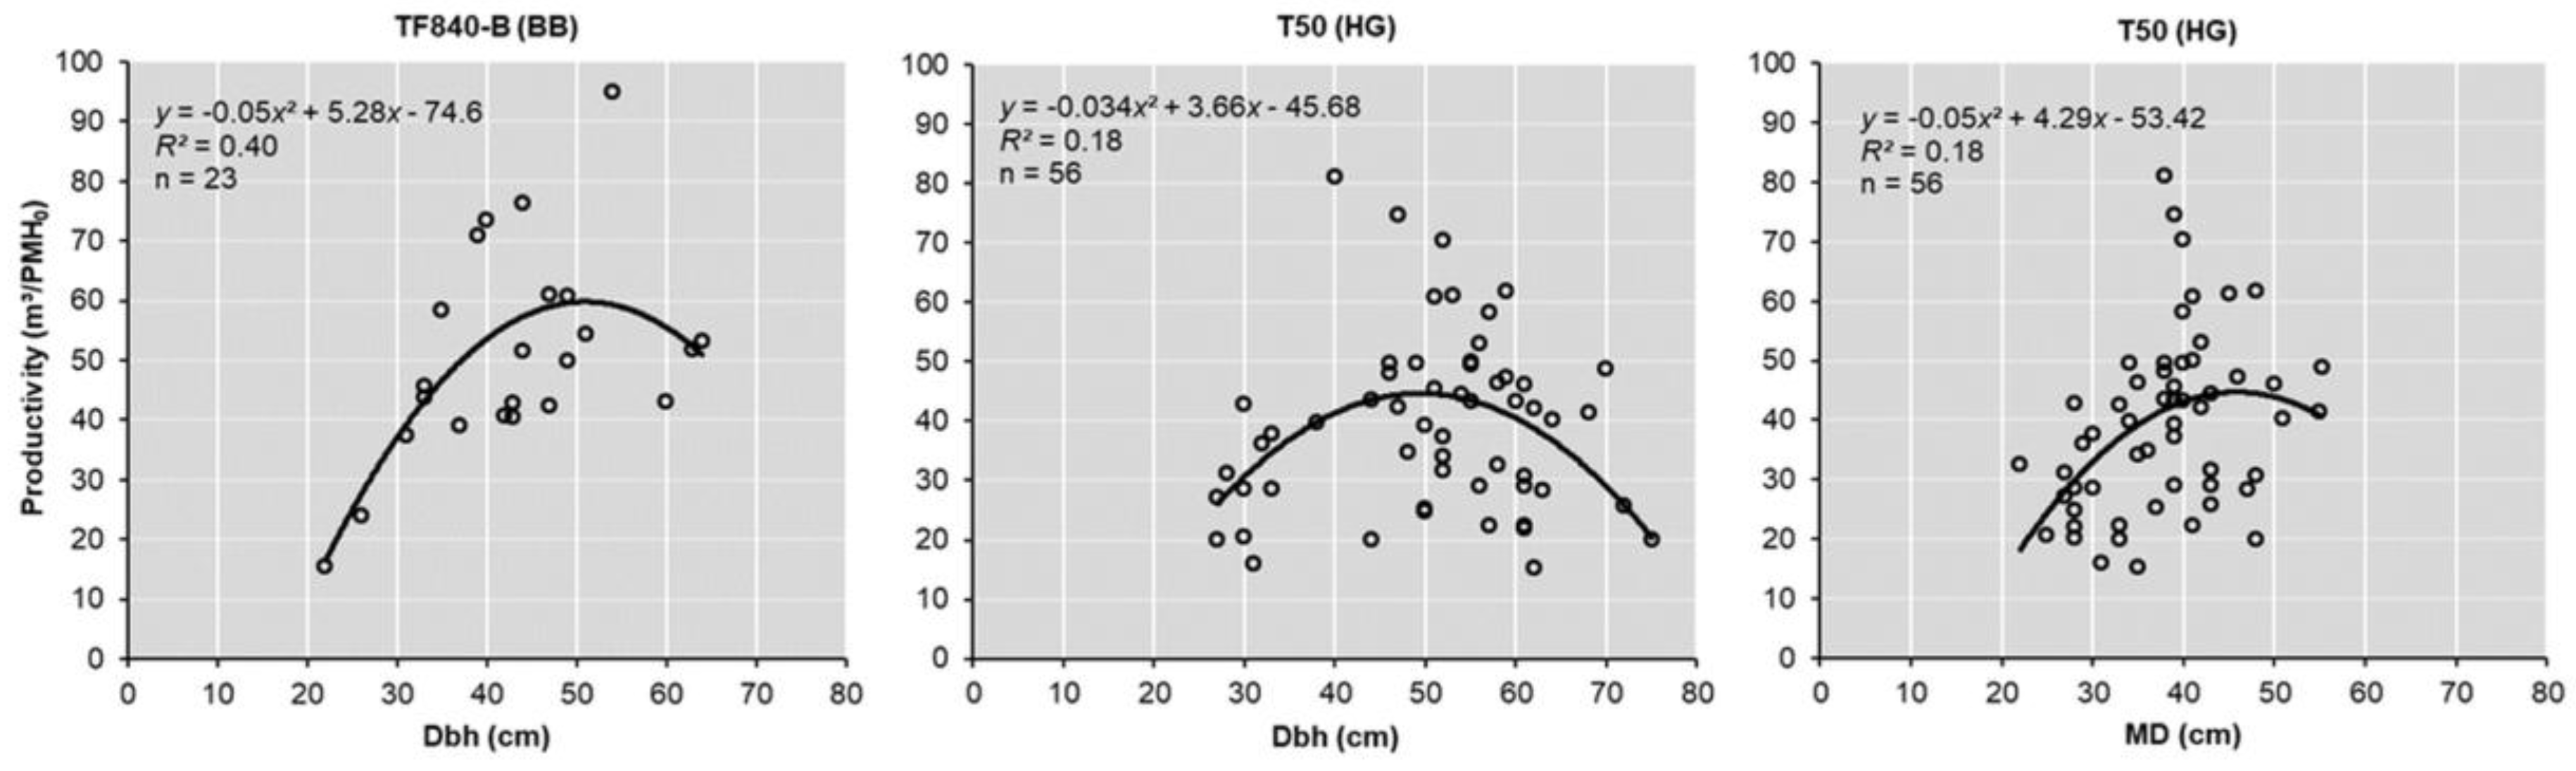
Productivity curves derived from the results in the MM group are presented in
Figure 8. In the case of BB, the task of prefelling trees increased harvesting productivity compared to trees that were felled and processed entirely by the harvester. According to the highest vertex of the regression curve, maximum productivity reached 60 m
3/PMH
0, thus indicating a 20% increase compared to trees that were completely handled by the harvester. This finding is reasonable since with fully-mechanized operations, trees of this dimension (avg. dbh of 43.3 cm) would require one or several back-cuts prior to the final cut. As discussed previously, in the case of HG, observed productivity of the T50 with the prefelled trees was lower than with the trees in the FM group. This is also reflected in the corresponding productivity curves, which have their maxima at 45 m³/PMH
0 as compared to 50 m³/PMH
0 in the FM group. A potentially higher productivity of the harvester when processing only is thus masked by the fact that the sawlogs (i.e., butt logs) were not produced by the harvester, but rather motor-manually.


