Secondary Invasions Hinder the Recovery of Native Communities after the Removal of Nonnative Pines Along a Precipitation Gradient in Patagonia

 , ,
, ,
Abstract
:1. Introduction
2. Materials and Methods
2.1. Study Region
2.2. Study Design
2.3. Data Analyses
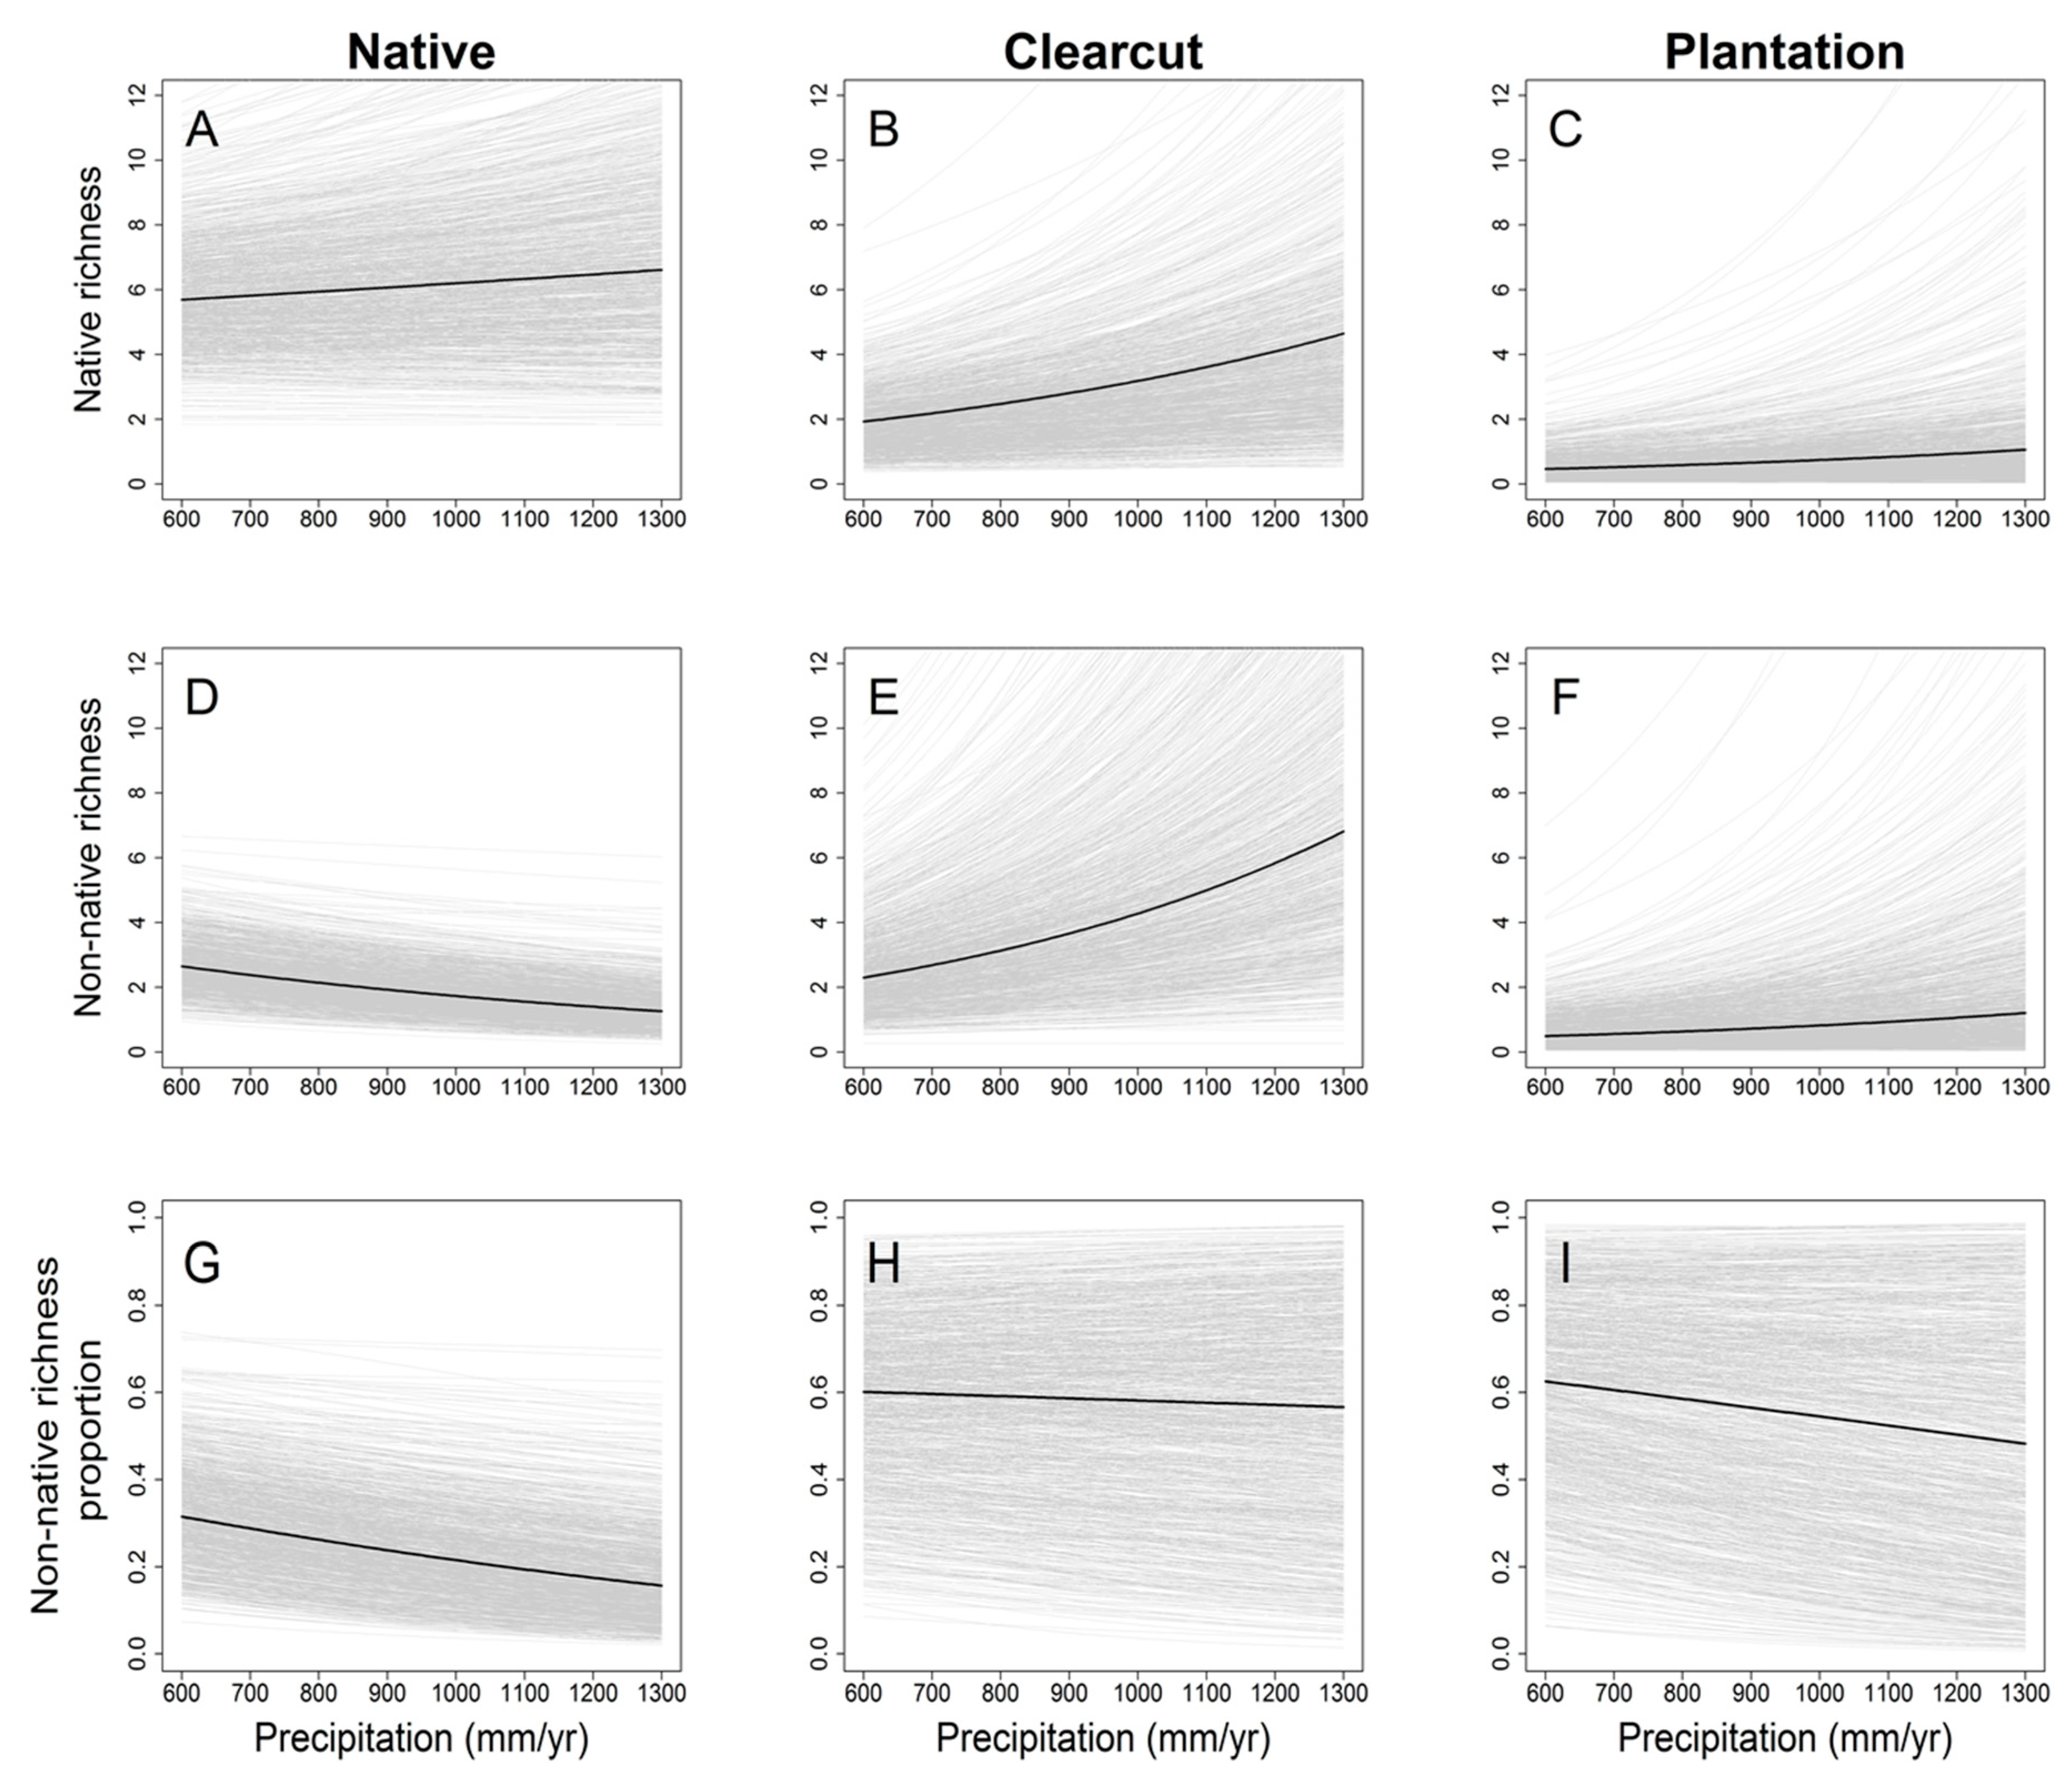
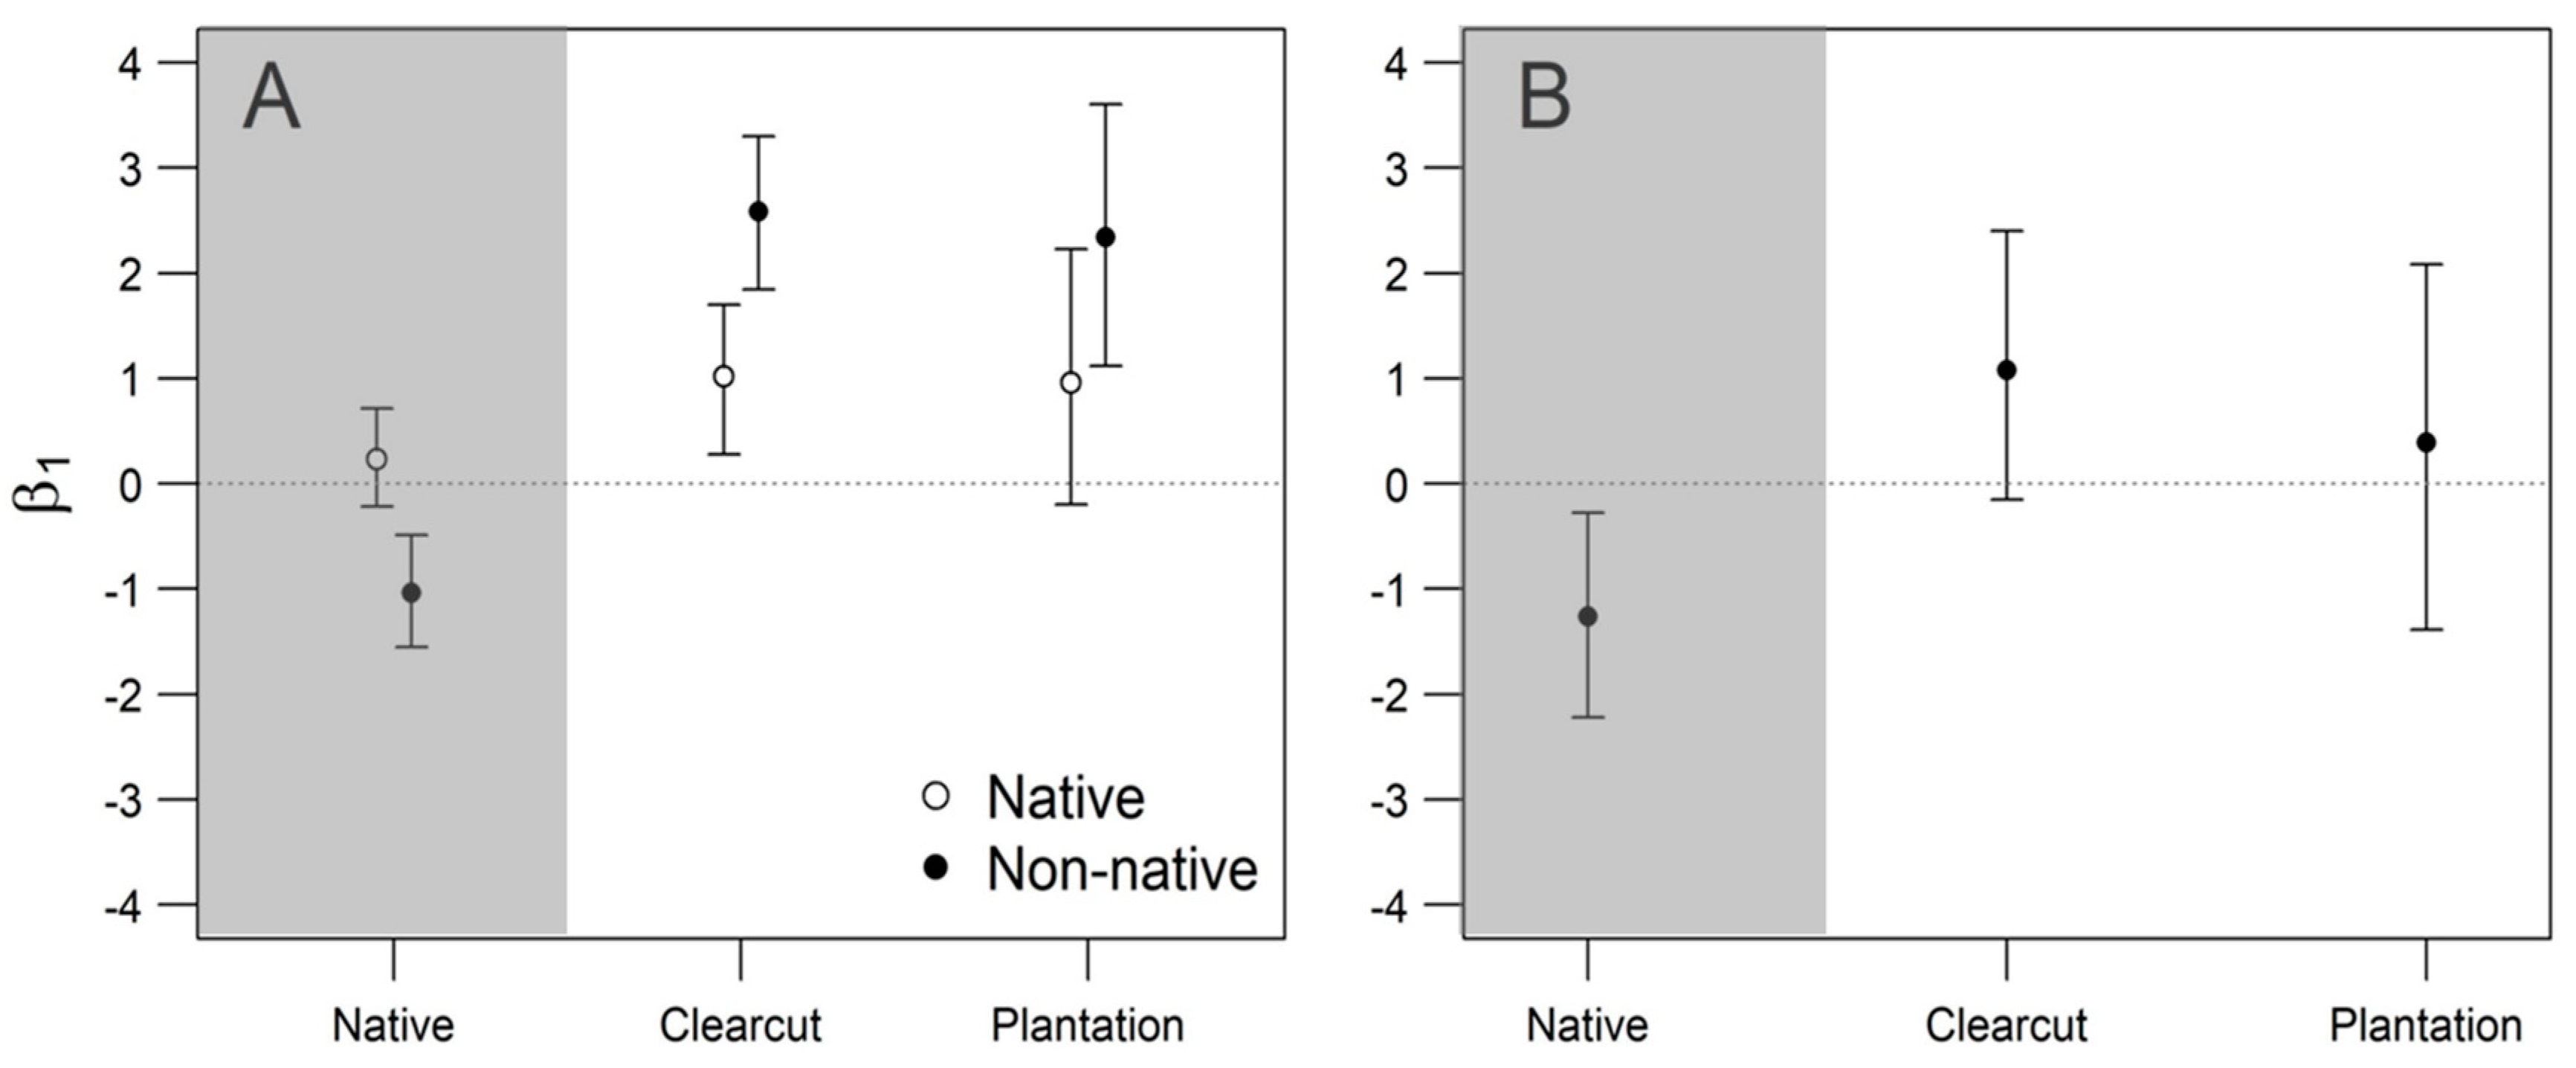
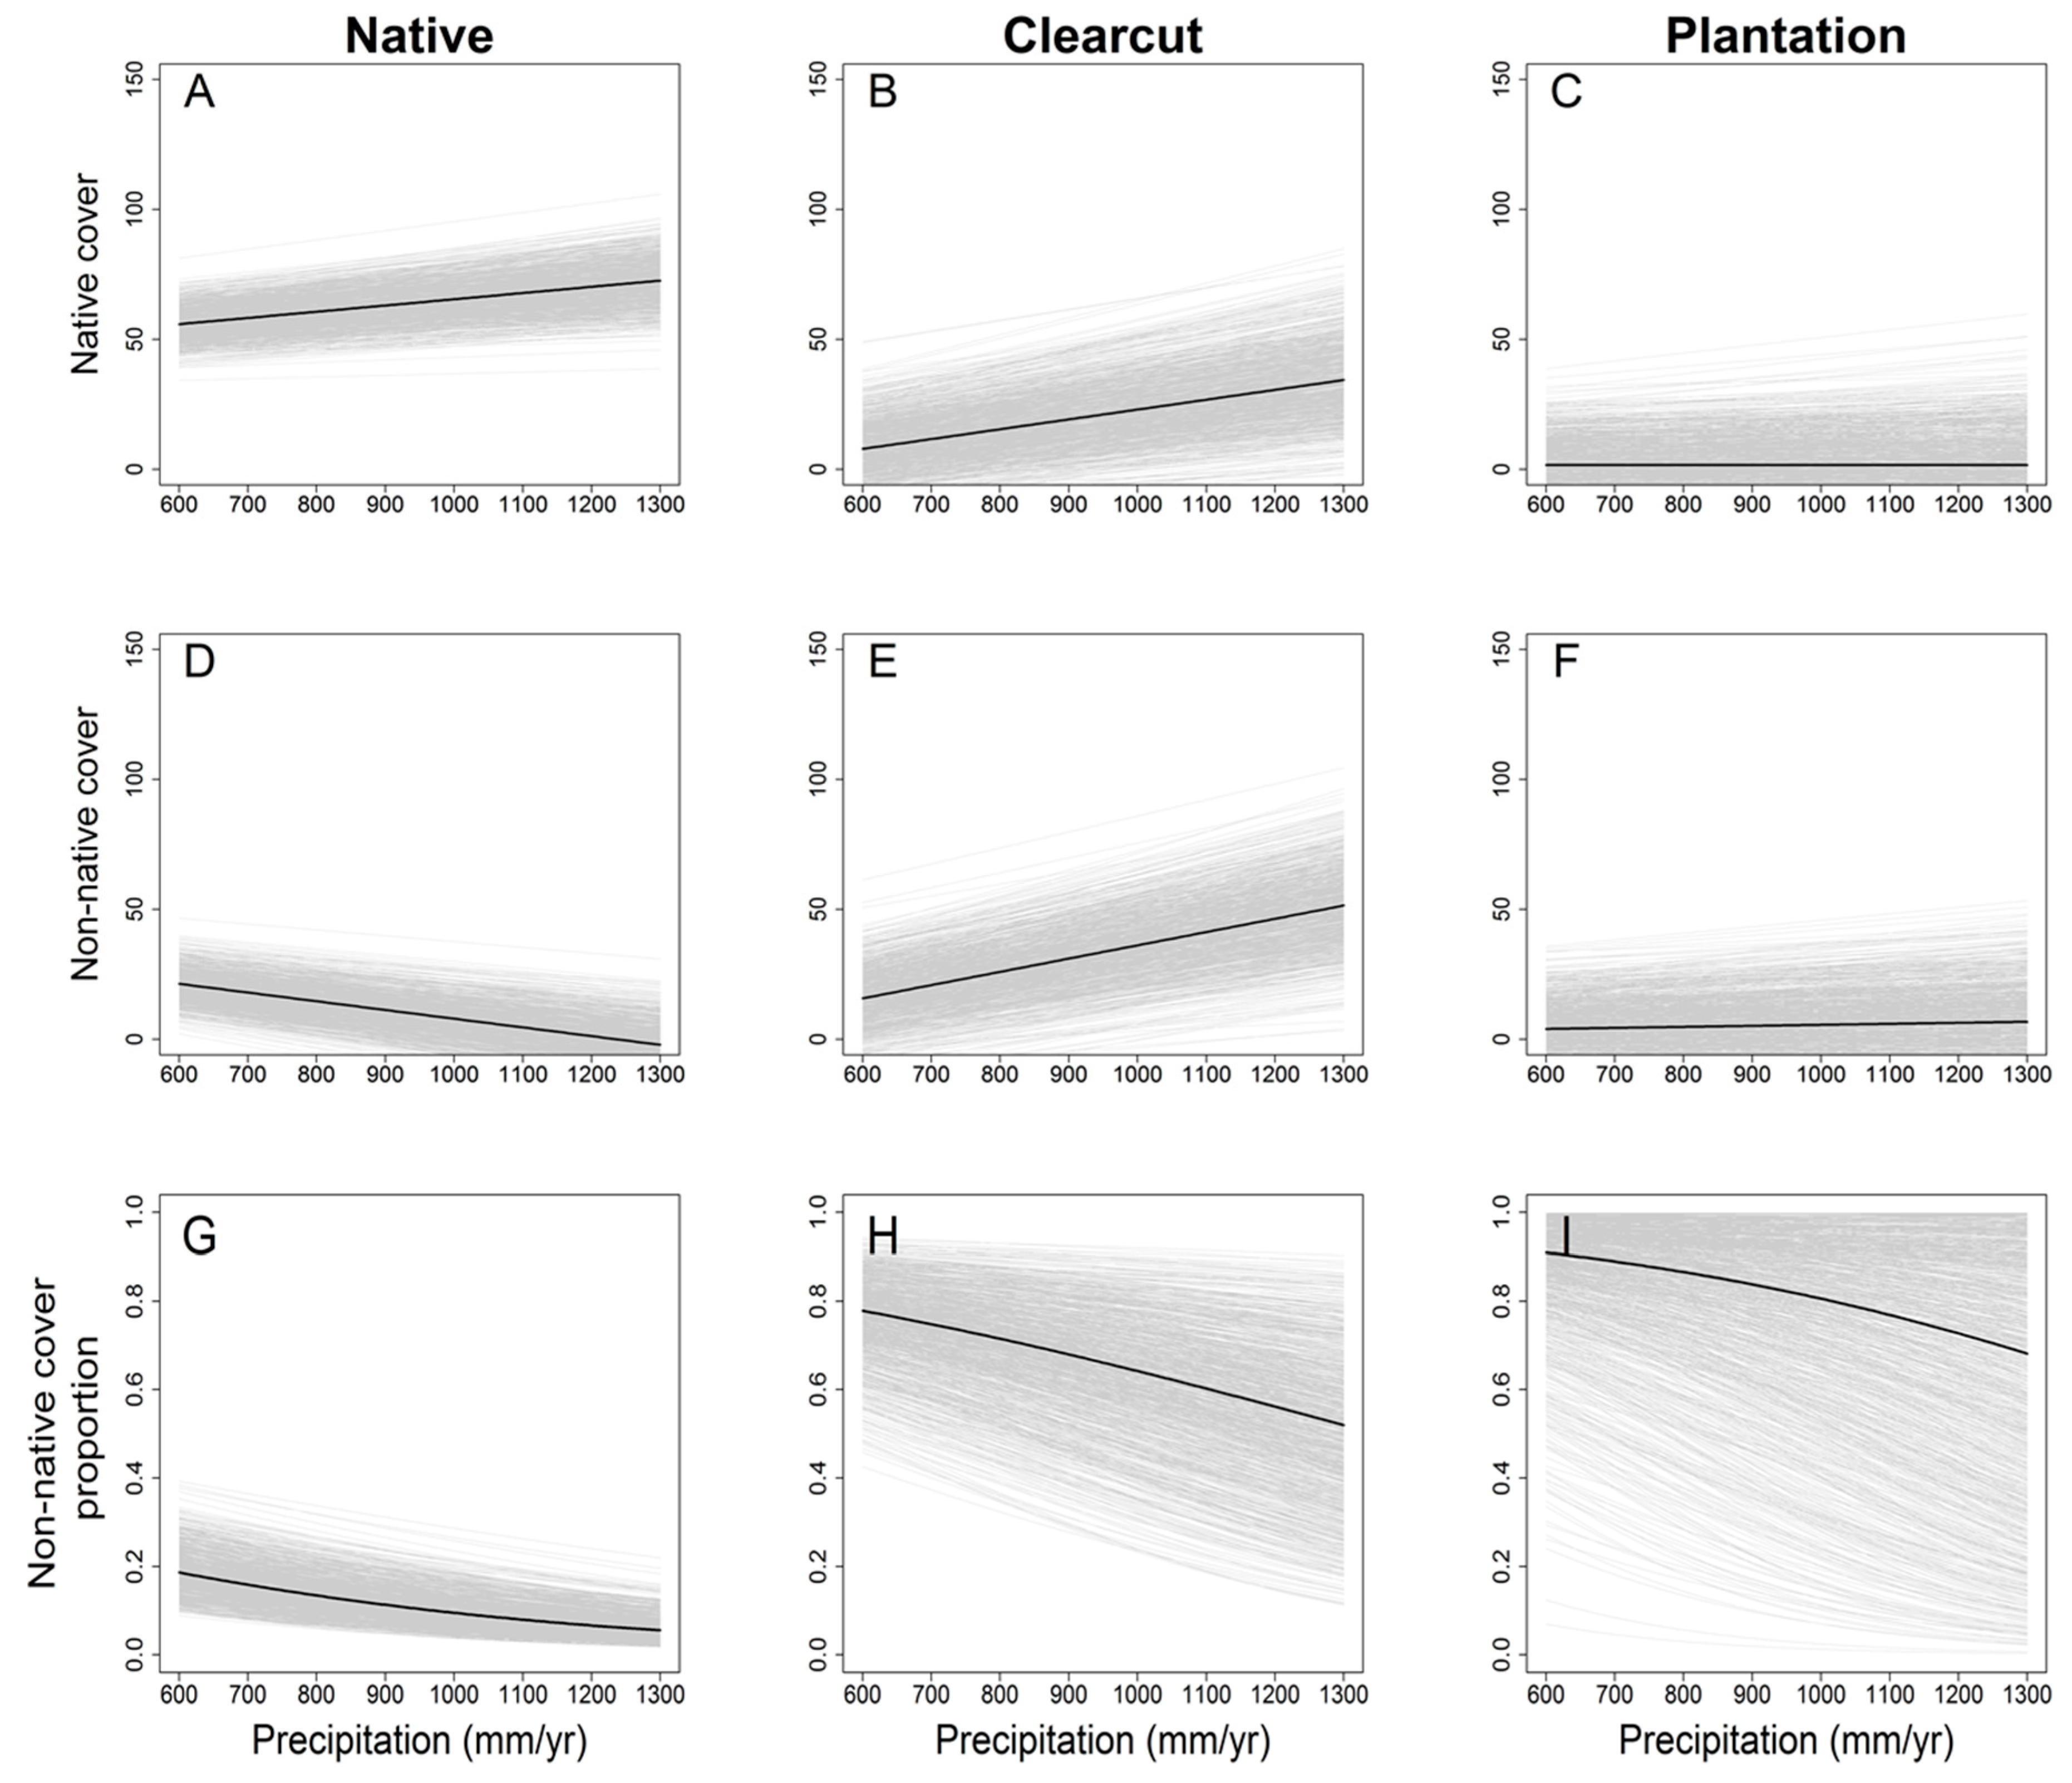
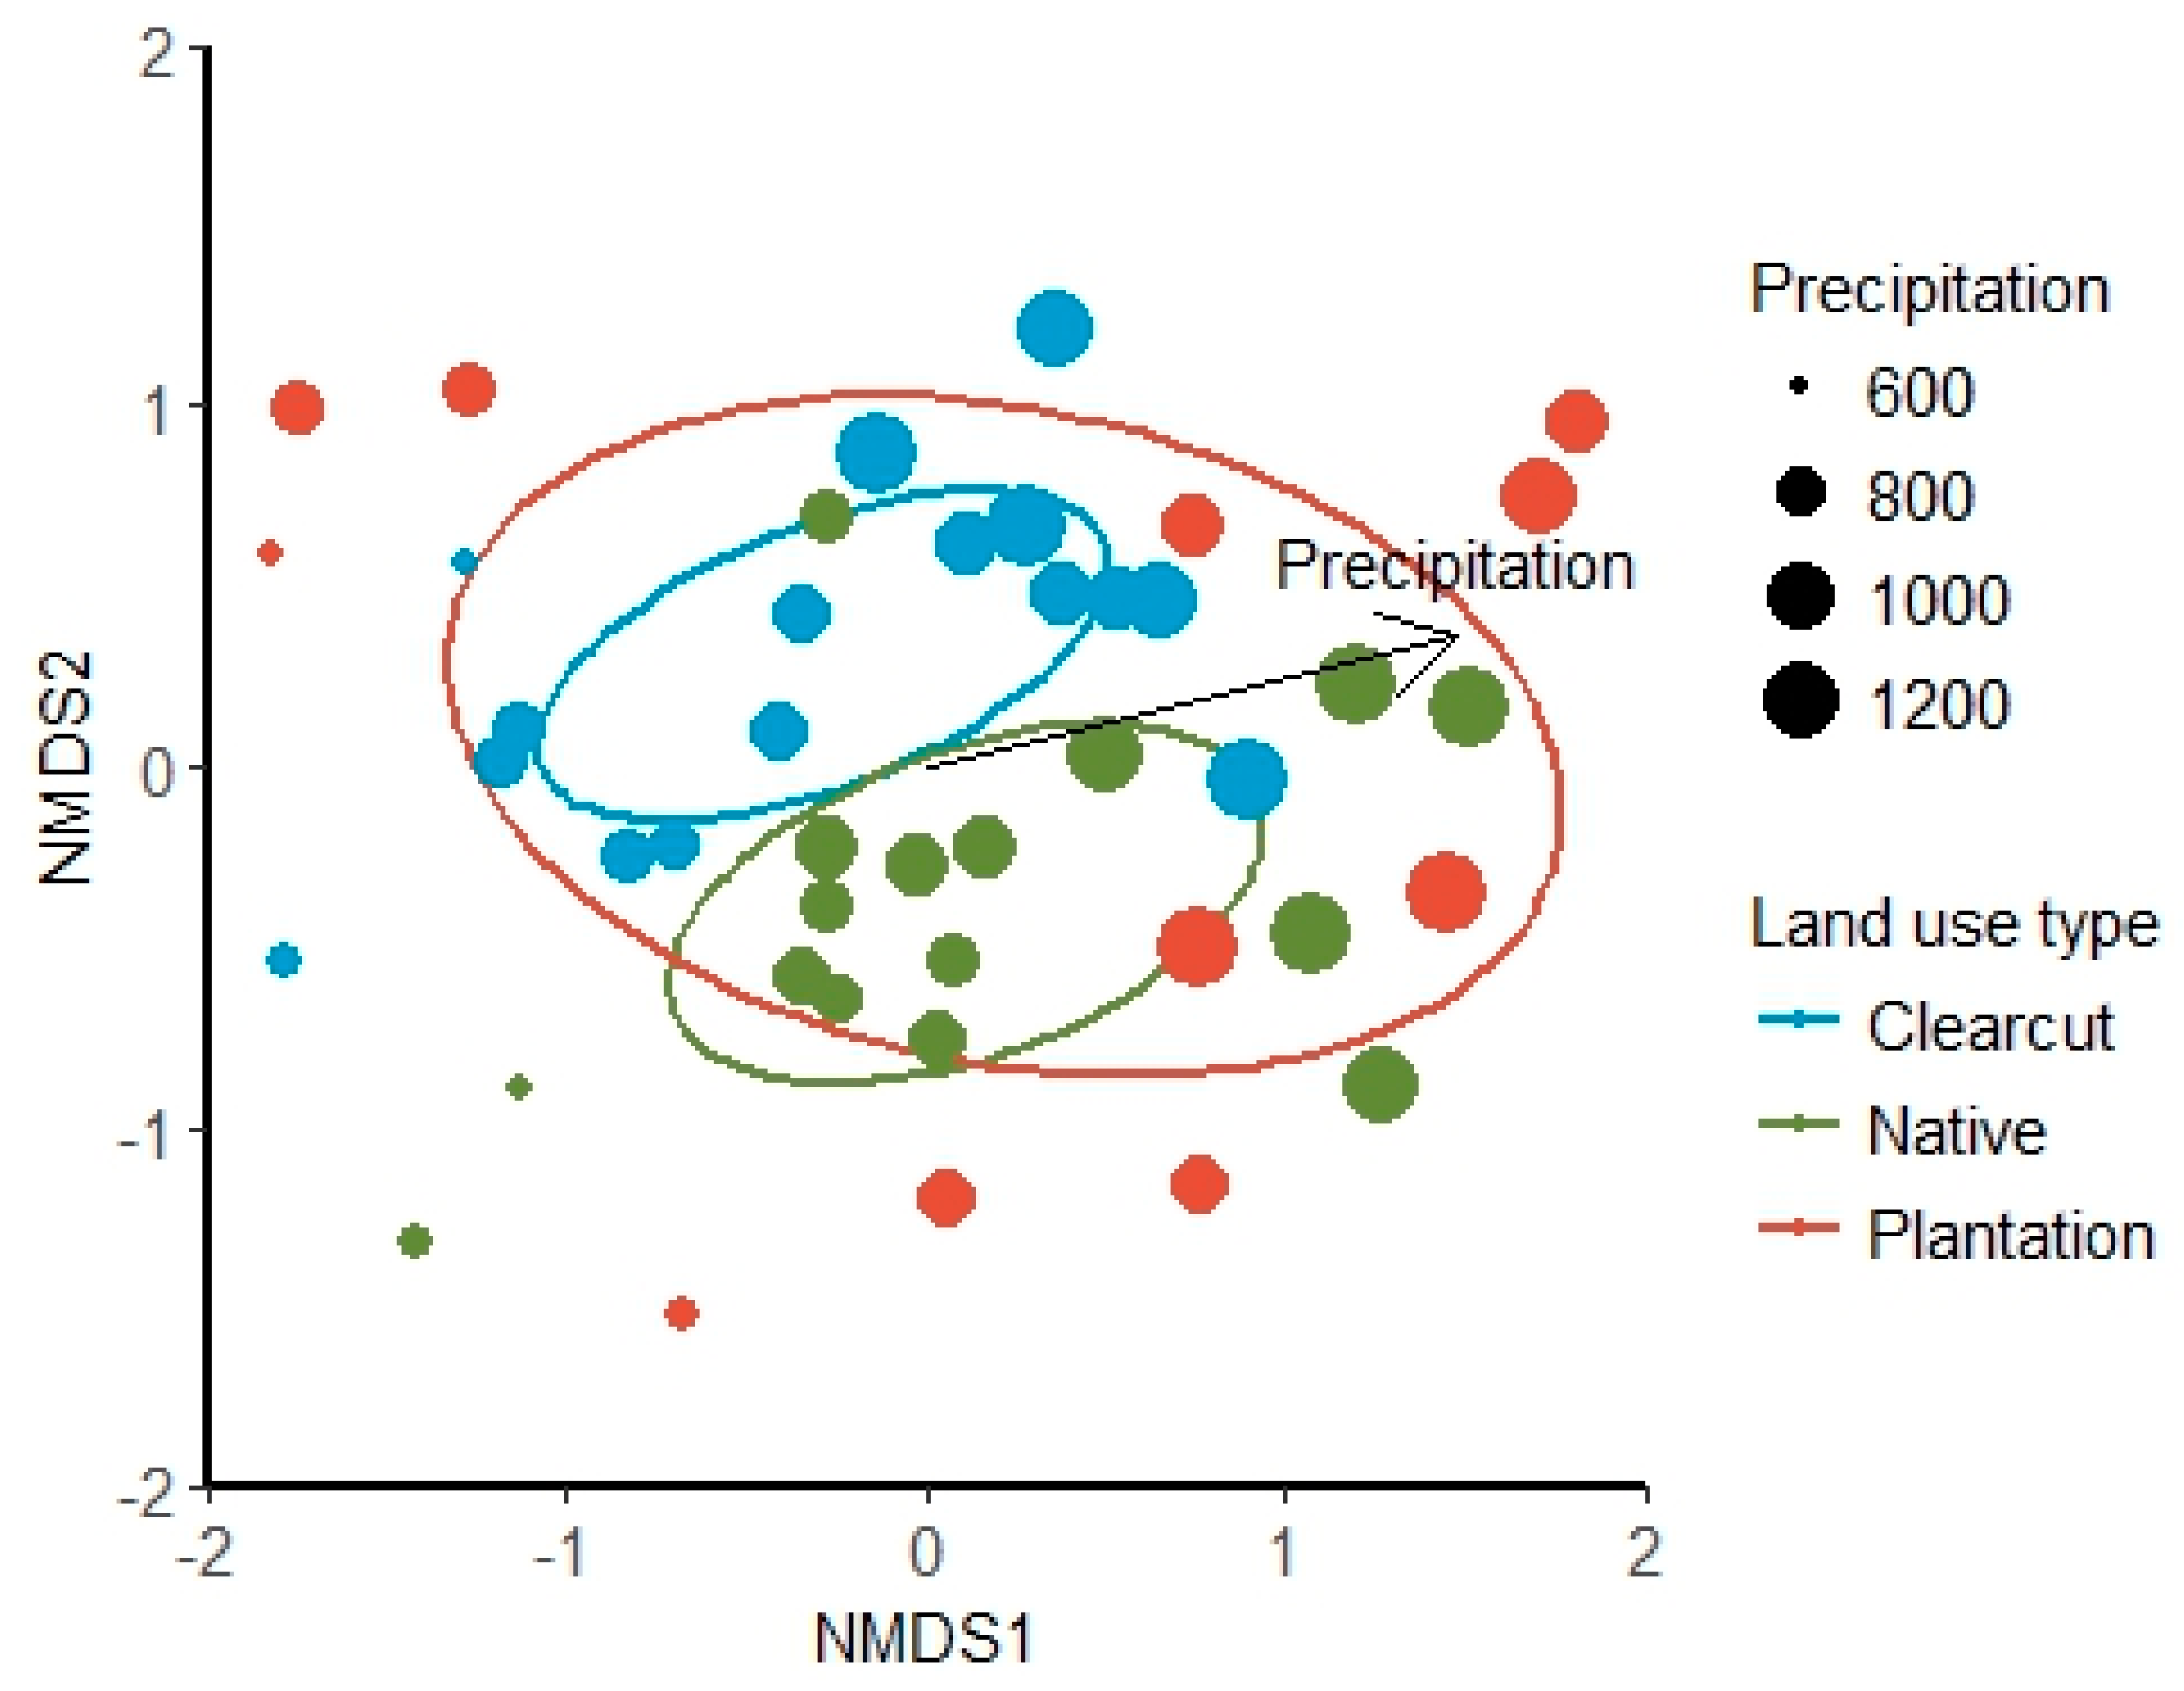
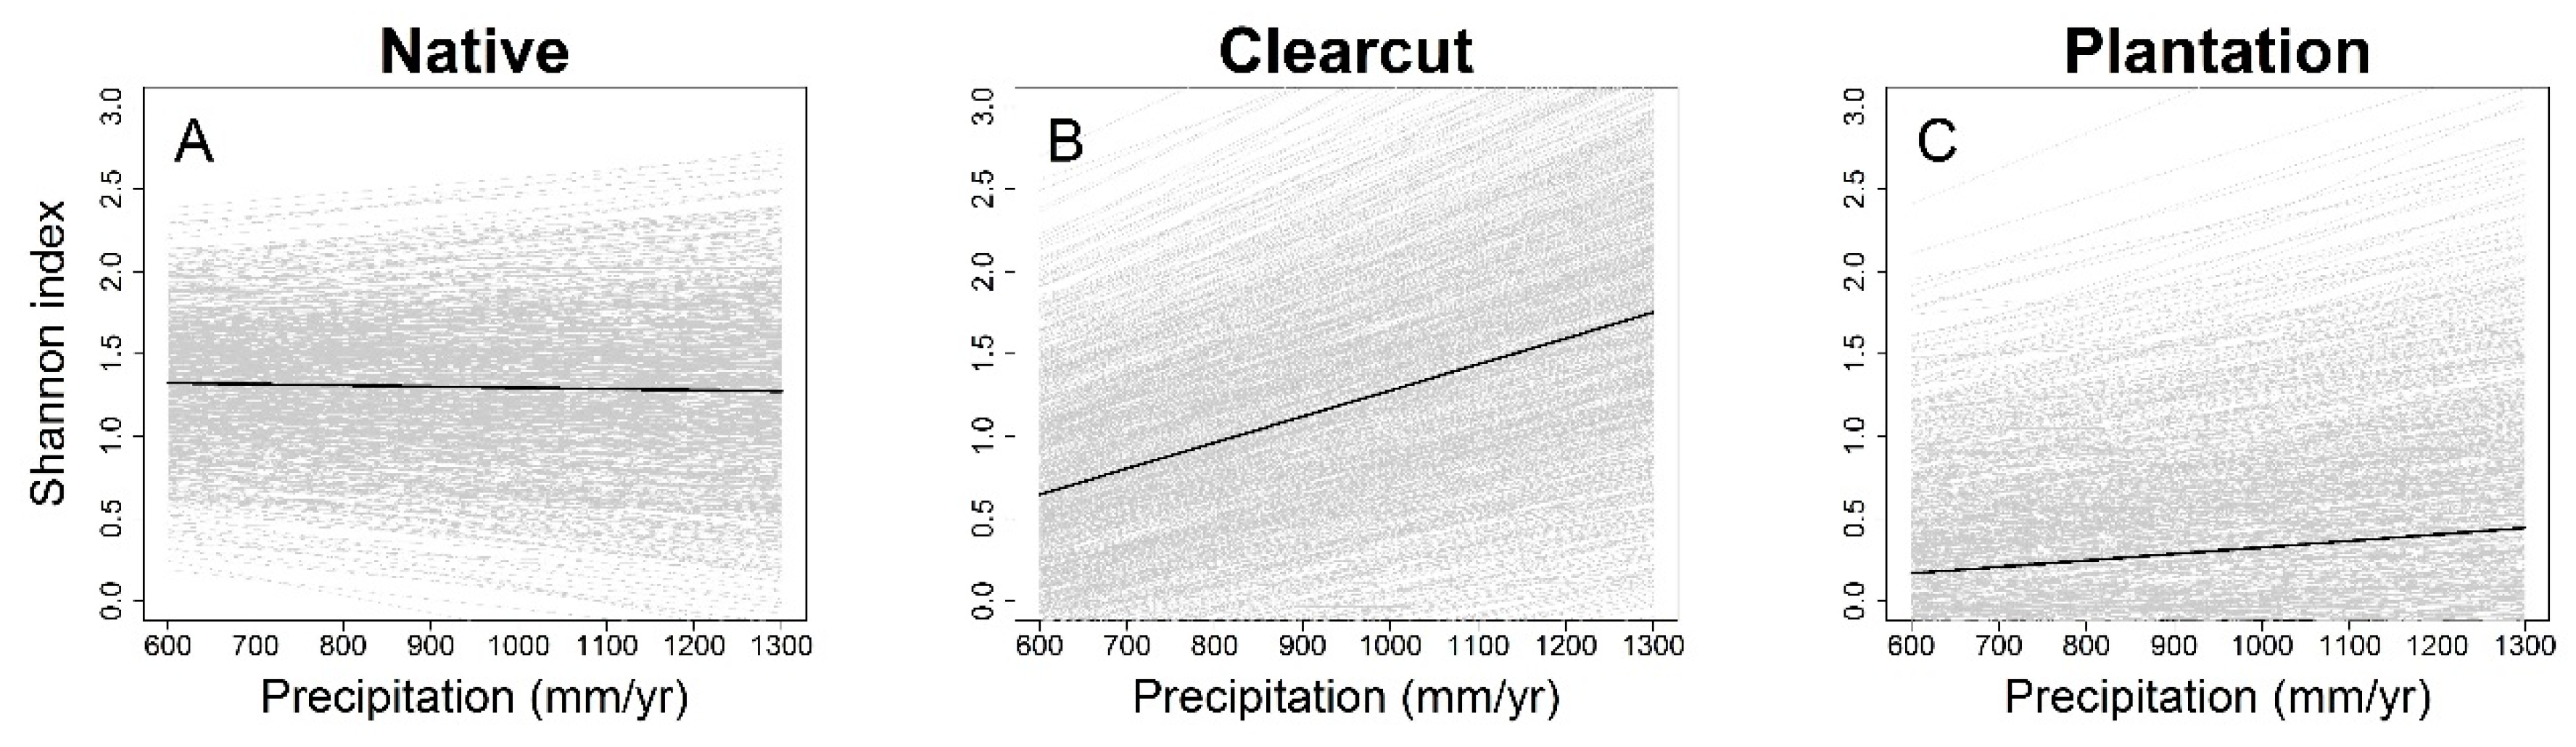
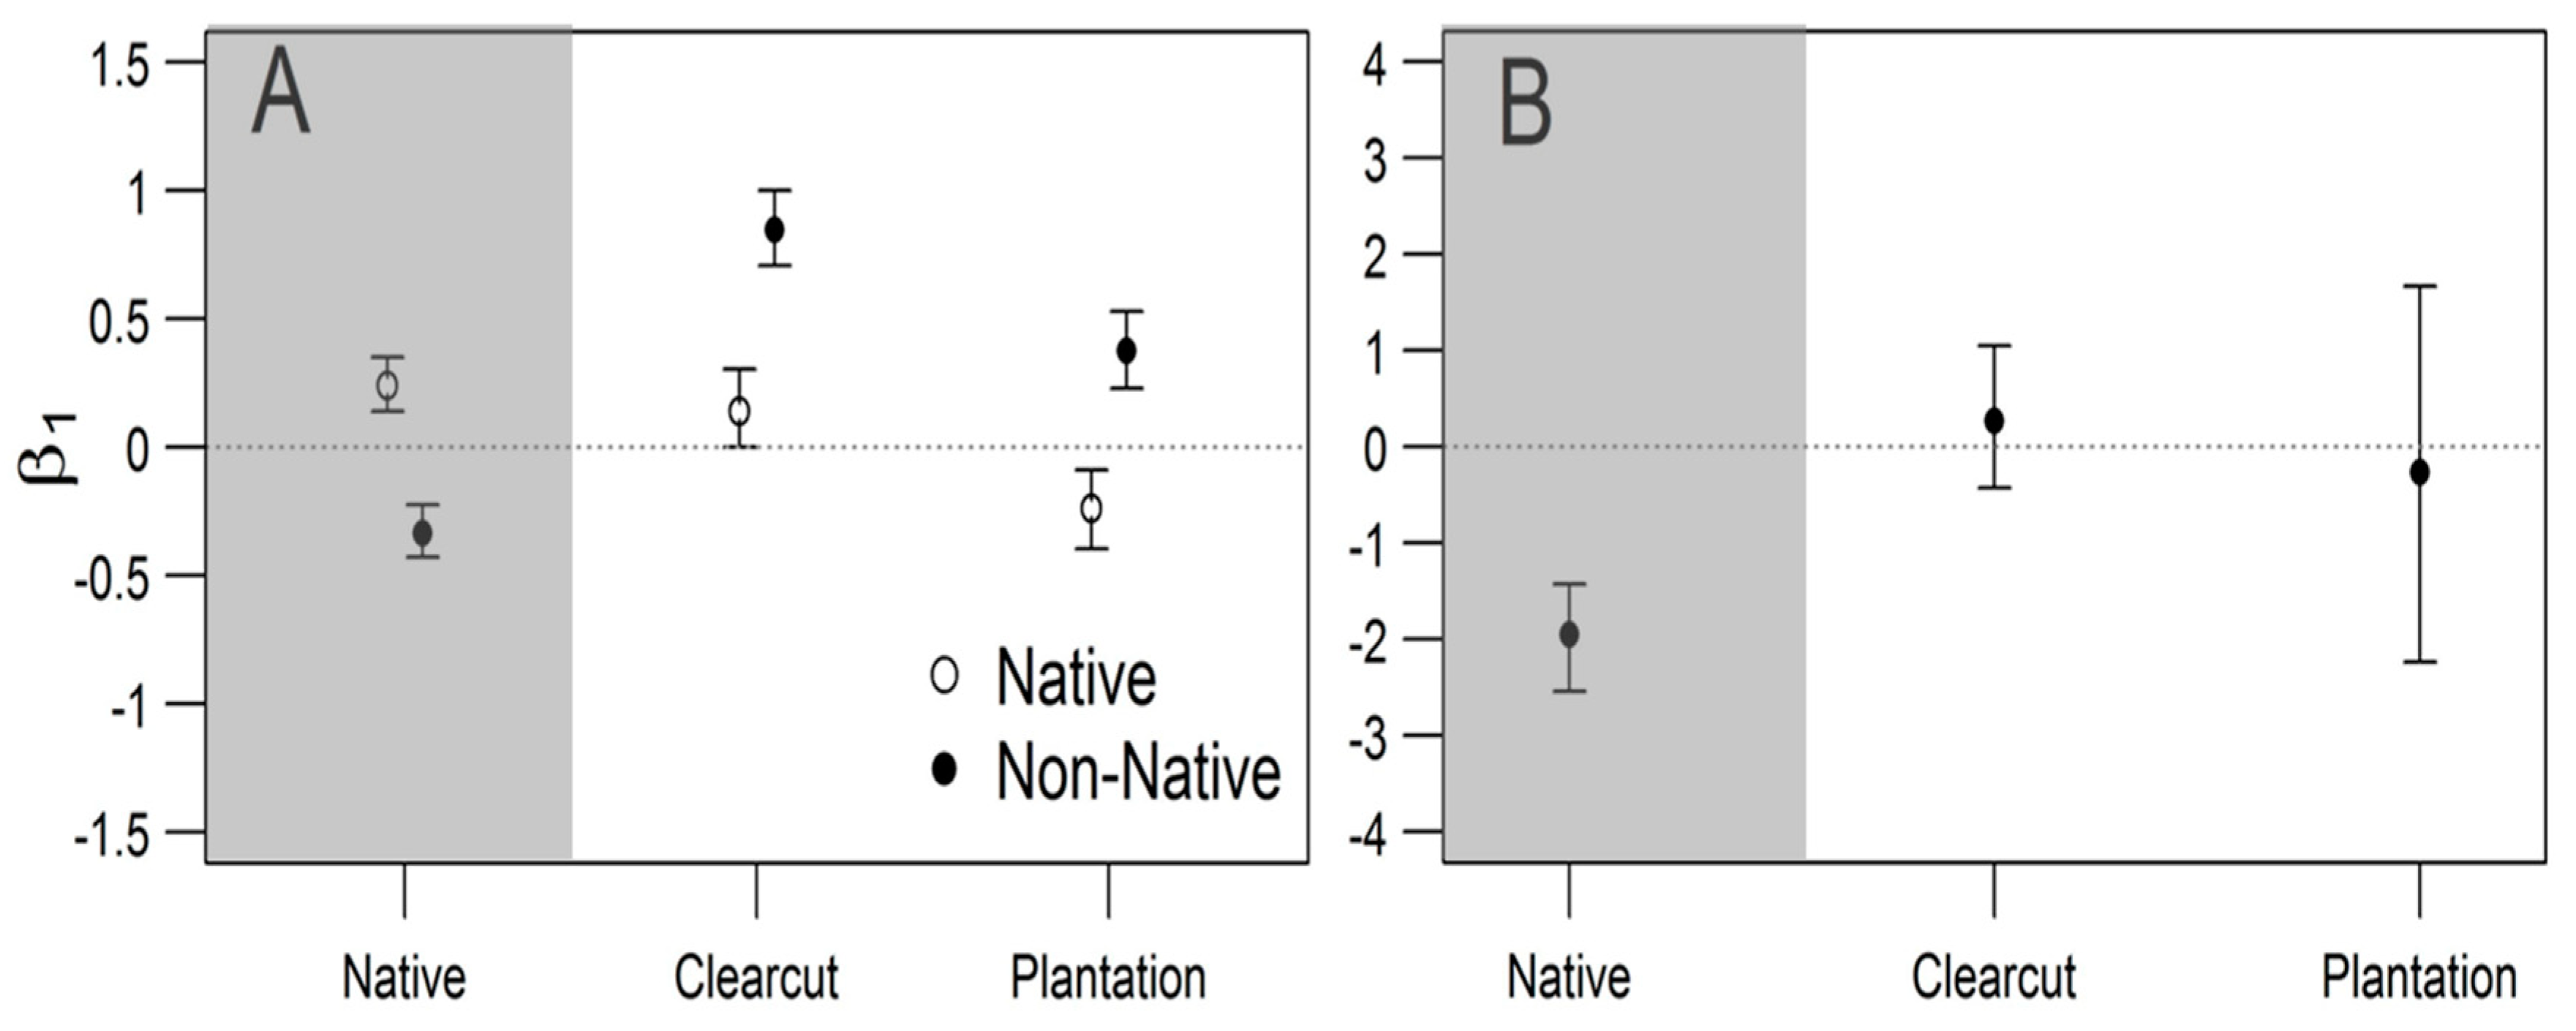
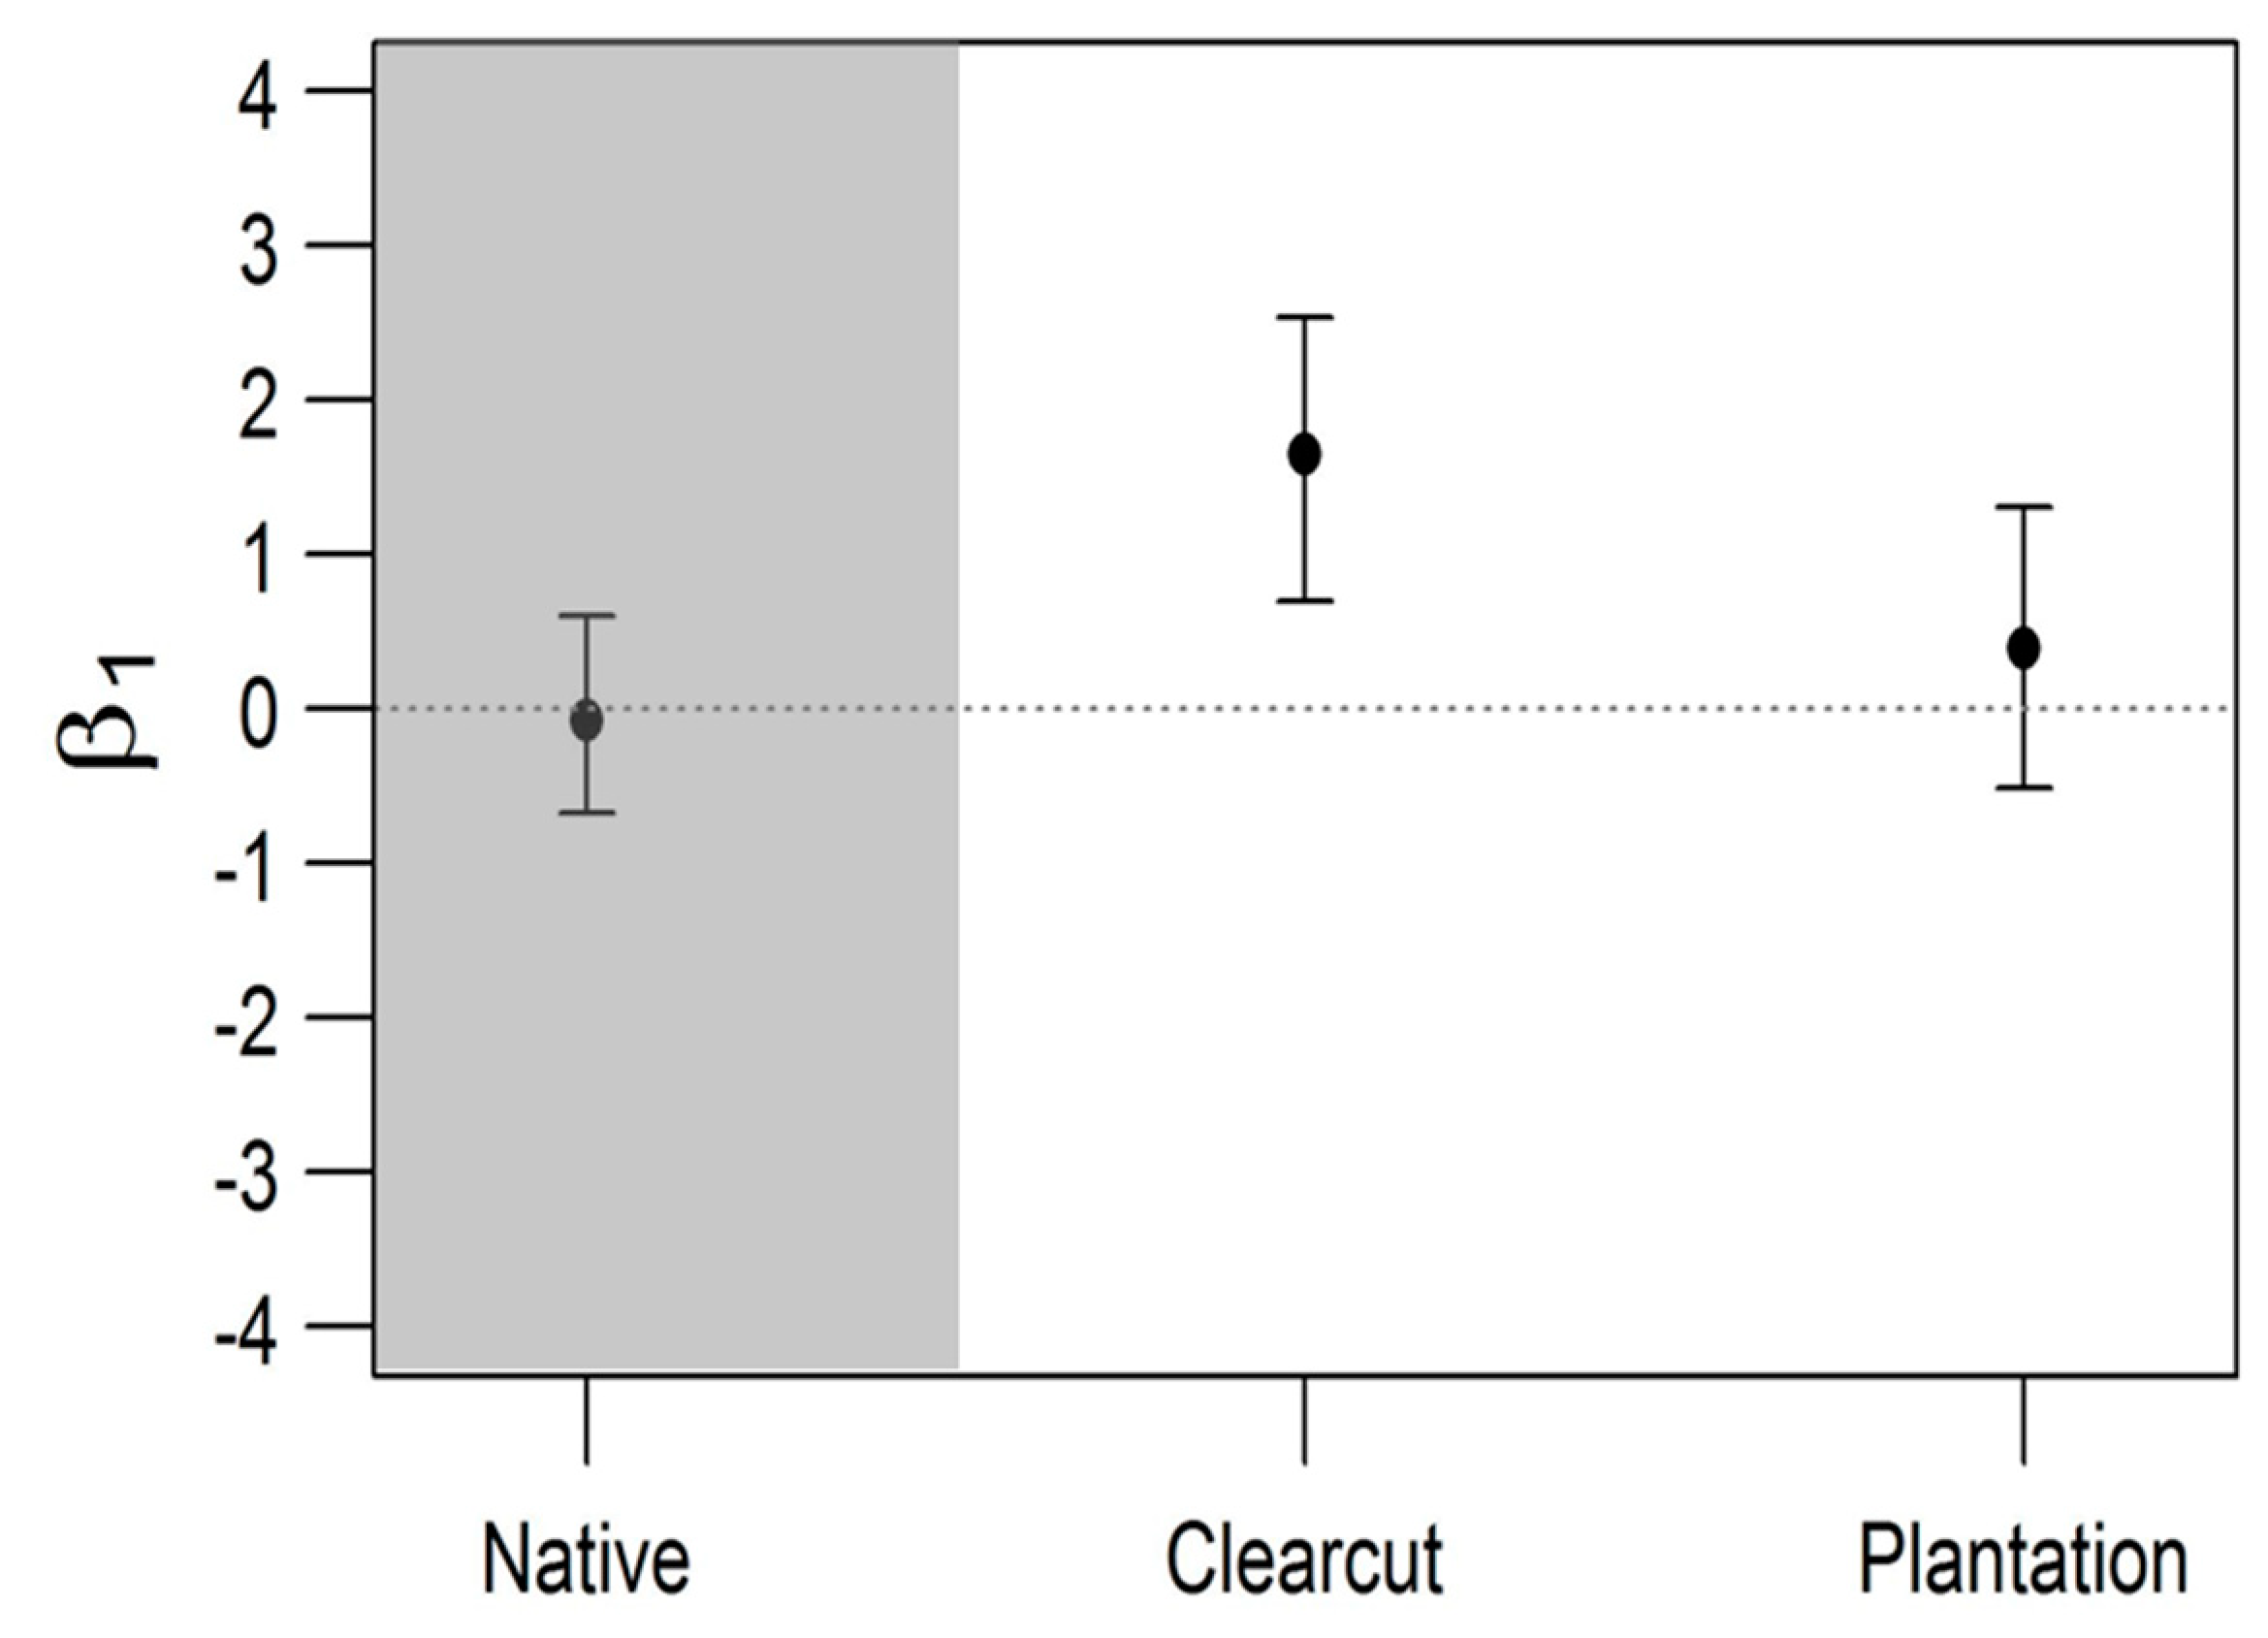
3. Results
4. Discussion
5. Conclusions
Supplementary Materials
Author Contributions
Funding
Acknowledgments
Conflicts of Interest
Appendix A


| Sites | Land-Use Type | Precipitation | Total Cover | Perennial Herbs | Annual Herbs | Shrubs | Trees |
|---|---|---|---|---|---|---|---|
| AA 2 | Native | 619 | 79.1 | 25.9 | 0.0 | 53.2 | 0.0 |
| AA 2 | Plantation | 619 | 1.3 | 0.3 | 0.0 | 0.0 | 1.0 |
| AA 2 | Clearcut | 619 | 15.5 | 0.9 | 0.2 | 1.7 | 12.8 |
| AA 1 | Native | 648 | 70.4 | 0.0 | 0.0 | 10.8 | 59.7 |
| AA 1 | Plantation | 648 | 3.2 | 1.2 | 0.0 | 2.0 | 0.0 |
| AA 1 | Clearcut | 648 | 0.5 | 0.5 | 0.0 | 0.0 | 0.0 |
| MC | Native | 805 | 117.4 | 30.5 | 15.6 | 25.5 | 45.8 |
| MC | Plantation | 805 | 0.3 | 0.0 | 0.0 | 0.0 | 0.3 |
| MC | Clearcut | 805 | 31.8 | 20.8 | 9.1 | 1.7 | 0.3 |
| SJ 2 | Native | 824 | 65.3 | 10.4 | 3.6 | 28.5 | 22.8 |
| SJ 2 | Plantation | 824 | 0.0 | 0.0 | 0.0 | 0.0 | 0.0 |
| SJ 2 | Clearcut | 824 | 59.4 | 28.8 | 0.3 | 0.0 | 30.4 |
| SJ 3 | Native | 827 | 33.5 | 5.5 | 3.1 | 20.7 | 4.3 |
| SJ 3 | Plantation | 827 | 1.0 | 0.0 | 0.0 | 0.0 | 1.0 |
| SJ 3 | Clearcut | 827 | 52.8 | 42.5 | 8.7 | 0.0 | 1.7 |
| SJ 1 | Native | 846 | 108.3 | 24.2 | 37.4 | 31.3 | 15.4 |
| SJ 1 | Plantation | 846 | 2.0 | 0.0 | 0.0 | 0.7 | 1.3 |
| SJ 1 | Clearcut | 846 | 27.6 | 16.1 | 1.1 | 0.0 | 10.4 |
| CON 1 | Native | 863 | 67.3 | 10.8 | 10.0 | 5.8 | 40.7 |
| CON 1 | Plantation | 863 | 3.0 | 0.0 | 0.0 | 0.3 | 2.7 |
| CON 1 | Clearcut | 863 | 62.3 | 10.3 | 48.1 | 0.5 | 3.5 |
| CON 2 | Native | 876 | 66.5 | 10.1 | 1.1 | 50.4 | 4.8 |
| CON 2 | Plantation | 876 | 2.2 | 1.4 | 0.0 | 0.0 | 0.9 |
| CON 2 | Clearcut | 876 | 52.6 | 19.0 | 16.8 | 2.1 | 14.8 |
| AMU 1 | Native | 973 | 106.3 | 27.8 | 0.3 | 24.3 | 53.8 |
| AMU 1 | Plantation | 973 | 45.7 | 2.4 | 0.9 | 0.1 | 42.3 |
| AMU 1 | Clearcut | 973 | 20.7 | 2.5 | 17.8 | 0.0 | 0.4 |
| AMU 3 | Native | 983 | 96.3 | 11.3 | 3.6 | 18.0 | 63.4 |
| AMU 3 | Plantation | 983 | 0.0 | 0.0 | 0.0 | 0.0 | 0.0 |
| AMU 3 | Clearcut | 983 | 108.1 | 8.9 | 41.3 | 1.7 | 56.2 |
| AMU 2 | Native | 995 | 97.6 | 7.6 | 0.6 | 25.5 | 63.9 |
| AMU 2 | Plantation | 995 | 14.9 | 0.0 | 0.0 | 0.0 | 14.9 |
| AMU 2 | Clearcut | 995 | 94.8 | 0.9 | 44.1 | 3.1 | 46.7 |
| PM | Native | 1181 | 20.6 | 0.0 | 0.0 | 6.0 | 14.4 |
| PM | Plantation | 1181 | 0.3 | 0.0 | 0.0 | 0.0 | 0.3 |
| PM | Clearcut | 1181 | 68.2 | 32.3 | 17.7 | 18.2 | 0.0 |
| VM | Native | 1216 | 38.2 | 23.3 | 0.3 | 8.3 | 6.4 |
| VM | Plantation | 1216 | 9.0 | 0.1 | 0.0 | 0.0 | 9.0 |
| VM | Clearcut | 1216 | 65.8 | 15.5 | 9.6 | 3.6 | 37.2 |
| QQ3 | Native | 1262 | 111.3 | 76.8 | 0.0 | 0.0 | 34.5 |
| QQ3 | Plantation | 1262 | 3.7 | 3.4 | 0.0 | 0.2 | 0.1 |
| QQ3 | Clearcut | 1262 | 88.3 | 17.5 | 1.1 | 2.1 | 67.6 |
| CF | Native | 1265 | 56.5 | 1.0 | 0.0 | 1.9 | 53.5 |
| CF | Plantation | 1265 | 21.5 | 2.6 | 0.4 | 11.7 | 6.8 |
| CF | Clearcut | 1265 | 48.4 | 17.8 | 20.4 | 9.0 | 1.2 |
| QQ2 | Native | 1274 | 59.5 | 54.6 | 0.0 | 0.0 | 4.9 |
| QQ2 | Plantation | 1274 | 0.0 | 0.0 | 0.0 | 0.0 | 0.0 |
| QQ2 | Clearcut | 1274 | 99.0 | 47.3 | 47.3 | 3.8 | 0.6 |
References
- Kettenring, K.M.; Adams, C.R. Lessons learned from invasive plant control experiments: A systematic review and meta-analysis. J. Appl. Ecol. 2011, 48, 970–979. [Google Scholar] [CrossRef]
- Pearson, D.E.; Ortega, Y.K.; Runyon, J.B.; Butler, J.L. Secondary invasion: The bane of weed management. Biol. Conserv. 2016, 197, 8–17. [Google Scholar] [CrossRef] [Green Version]
- Zavaleta, E.S.; Hobbs, R.J.; Mooney, H.A. Viewing invasive species removal in a whole-ecosystem context. Trends Ecol. Evol. 2001, 16, 454–459. [Google Scholar] [CrossRef]
- Benayas, J.M.R.; Newton, A.C.; Diaz, A.; Bullock, J.M. Enhancement of biodiversity and ecosystem services by ecological restoration: A meta-analysis. Science 2009, 325, 1121–1124. [Google Scholar] [CrossRef] [PubMed]
- Prior, K.M.; Adams, D.C.; Klepzig, K.D.; Hulcr, J. When does invasive species removal lead to ecological recovery? Implications for management success. Biol. Invasions 2018, 20, 267–283. [Google Scholar] [CrossRef]
- D’Antonio, C.M.; Ostertag, R.; Cordell, S.; Yelenik, S. Interactions Among Invasive Plants: Lessons from Hawai ‘i. Annu. Rev. Ecol. Evol. Syst. 2017, 48, 521–541. [Google Scholar] [CrossRef]
- Kuebbing, S.E.; Nuñez, M.A. Negative, neutral, and positive interactions among nonnative plants: Patterns, processes, and management implications. Glob. Chang. Biol. 2015, 21, 926–934. [Google Scholar] [CrossRef] [PubMed]
- Lodge, D.M.; Williams, S.; MacIsaac, H.J.; Hayes, K.R.; Leung, B.; Reichard, S.; Mack, R.N.; Moyle, P.B.; Smith, M.; Andow, D.A.; et al. Biological invasions: Recommendations for US policy and management. Ecol. Appl. 2006, 16, 2035–2054. [Google Scholar] [CrossRef]
- Cuevas, Y.A.; Zalba, S.M. Recovery of native grasslands after removing invasive pines. Restor. Ecol. 2010, 18, 711–719. [Google Scholar] [CrossRef]
- Galloway, A.D.; Holmes, P.; Gaertner, M.; Esler, K. The impact of pine plantations on fynbos above-ground vegetation and soil seed bank composition. S. Afr. J. Bot. 2017, 113, 300–307. [Google Scholar] [CrossRef]
- Funk, J.L. The physiology of invasive plants in low-resource environments. Conserv. Physiol. 2013, 1. [Google Scholar] [CrossRef] [PubMed] [Green Version]
- Stohlgren, T.J.; Barnett, D.T.; Kartesz, J.T. The rich get richer: Patterns of plant invasions in the United States. Front. Ecol. Environ. 2003, 1, 11–14. [Google Scholar] [CrossRef]
- Stohlgren, T.J.; Barnett, D.T.; Jarnevich, C.S.; Flather, C.; Kartesz, J. The myth of plant species saturation. Ecol. Lett. 2008, 11, 313–322. [Google Scholar] [CrossRef] [PubMed]
- Zefferman, E.; Stevens, J.T.; Charles, G.K.; Dunbar-Irwin, M.; Emam, T.; Fick, S.; Morales, L.V.; Wolf, K.M.; Young, D.J.; Young, T.P. Plant communities in harsh sites are less invaded: A summary of observations and proposed explanations. AoB Plants 2015, 7. [Google Scholar] [CrossRef] [PubMed]
- D’Antonio, C.M.; Levine, J.; Thomsen, M. Ecosystem resistance to invasion and the role of propagule supply: A California perspective. J. Mediterr. Ecol. 2001, 2, 233–246. [Google Scholar]
- Sorte, C.J.; Ibáñez, I.; Blumenthal, D.M.; Molinari, N.A.; Miller, L.P.; Grosholz, E.D.; Diez, J.M.; D’Antonio, C.M.; Olden, J.D.; Jones, S.J.; et al. Poised to prosper? A cross-system comparison of climate change effects on native and non-native species performance. Ecol. Lett. 2013, 16, 261–270. [Google Scholar] [CrossRef] [PubMed]
- Harms, R.S.; Hiebert, R.D. Vegetation response following invasive tamarisk (Tamarix spp.) removal and implications for riparian restoration. Restor. Ecol. 2006, 14, 461–472. [Google Scholar] [CrossRef]
- Elton, C.S. The Ecology of Invasions by Animals and Plants; University of Chicago Press: London, UK, 1958; ISBN 0-226-20638-6. [Google Scholar]
- Levine, J.M. Species diversity and biological invasions: relating local process to community pattern. Science 2000, 288, 852–854. [Google Scholar] [CrossRef] [PubMed]
- Levine, J.M.; Adler, P.B.; Yelenik, S.G. A meta-analysis of biotic resistance to exotic plant invasions. Ecol. Lett. 2004, 7, 975–989. [Google Scholar] [CrossRef]
- Bertness, M.D.; Callaway, R. Positive interactions in communities. Trends Ecol. Evol. 1994, 9, 191–193. [Google Scholar] [CrossRef]
- Kuebbing, S.E.; Nuñez, M.A. Invasive non-native plants have a greater effect on neighbouring natives than other non-natives. Nat. Plants 2016, 2, 16134. [Google Scholar] [CrossRef] [PubMed]
- Nuñez, M.A.; Chiuffo, M.C.; Torres, A.; Paul, T.; Dimarco, R.D.; Raal, P.; Policelli, N.; Moyano, J.; García, R.A.; van Wilgen, B.W.; et al. Ecology and management of invasive Pinaceae around the world: progress and challenges. Biol. Invasions 2017, 19, 3099–3120. [Google Scholar] [CrossRef]
- Paritsis, J.; Landesmann, J.B.; Kitzberger, T.; Tiribelli, F.; Sasal, Y.; Quintero, C.; Dimarco, R.D.; Barrios-García, M.N.; Iglesias, A.L.; Diez, J.P.; et al. Pine Plantations and Invasion Alter Fuel Structure and Potential Fire Behavior in a Patagonian Forest-Steppe Ecotone. Forests 2018, 9, 117. [Google Scholar] [CrossRef]
- Franzese, J.; Raffaele, E. Fire as a driver of pine invasions in the Southern Hemisphere: A review. Biol. Invasions 2017, 19, 2237–2246. [Google Scholar] [CrossRef]
- Nuñez, M.A.; Raffaele, E. Afforestation causes changes in post-fire regeneration in native shrubland communities of northwestern Patagonia, Argentina. J. Veg. Sci. 2007, 18, 827–834. [Google Scholar] [CrossRef]
- Cuddington, K. Legacy effects: the persistent impact of ecological interactions. Biol. Theory 2011, 6, 203–210. [Google Scholar] [CrossRef]
- Suding, K.N.; Stanley Harpole, W.; Fukami, T.; Kulmatiski, A.; MacDougall, A.S.; Stein, C.; Putten, W.H. Consequences of plant-soil feedbacks in invasion. J. Ecol. 2013, 101, 298–308. [Google Scholar] [CrossRef]
- Silvicultural Management Project for the Gradual Eradicaion of Exotic Forest Species of Isla Victoria. In Agreement between the National Park Administration and the Province of Río Negro; NPA (National Park Administration): Buenos Aires, Argentina, 1988.
- Dickie, I.A.; St John, M.G.; Yeates, G.W.; Morse, C.W.; Bonner, K.I.; Orwin, K.; Peltzer, D.A. Belowground legacies of Pinus contorta invasion and removal result in multiple mechanisms of invasional meltdown. AoB Plants 2014, 6. [Google Scholar] [CrossRef] [PubMed] [Green Version]
- Wardle, D.A.; Peltzer, D.A. Impacts of invasive biota in forest ecosystems in an aboveground-belowground context. Biol. Invasions 2017, 19, 3301–3316. [Google Scholar] [CrossRef]
- Sample, M.W. Exotic Conifer Removal in Northern Argentina: Ecological Outcomes and Management Evaluation. Master’s Thesis, Northern Arizona University, Flagstaff, AZ, USA, December 2016. [Google Scholar]
- Jauni, M.; Gripenberg, S.; Ramula, S. Non-native plant species benefit from disturbance: A meta-analysis. Oikos 2015, 124, 122–129. [Google Scholar] [CrossRef]
- Paruelo, J.M.; Beltran, A.; Jobbagy, E.; Sala, O.E.; Golluscio, R.A. The climate of Patagonia: General patterns and controls on biotic processes. Ecol. Austral 1998, 8, 85–101. [Google Scholar]
- Suarez, L.M.; Kitzberger, T. Differential effects of climate variability on forest dynamics along a precipitation gradient in northern Patagonia. J. Ecol. 2010, 98, 1023–1034. [Google Scholar] [CrossRef] [Green Version]
- Jobbágy, E.G.; Paruelo, J.M.; León, R.J. Estimación del régimen de precipitación a partir de la distancia a la cordillera en el noroeste de la Patagonia. Ecol. Austral 1995, 5, 47–53. [Google Scholar]
- Grechka, D.A.; Berezin, S.B.; Emmott, S.; Lyutsarev, V.; Smith, M.J.; Purves, D.W. Universal, easy access to geotemporal information: FetchClimate. Ecography 2016, 39, 904–911. [Google Scholar] [CrossRef] [Green Version]
- Cabrera, Á.L.; Willink, A. Biogeografía de América Latina, 1st ed.; Organization of American States: Washington, DC, USA, 1973; p. 120. [Google Scholar]
- Oyarzabal, M.; Clavijo, J.; Oakley, L.; Biganzoli, F.; Tognetti, P.; Barberis, I.; Maturo, H.M.; Aragón, R.; Campanello, P.I.; Prado, D.; et al. Unidades de vegetación de la Argentina. Ecol. Austral 2018, 28, 40–63. [Google Scholar] [CrossRef] [Green Version]
- Oliva, G.; González, L.; Rial, P. El ambiente en la Patagonia Austral. In Ganadería Ovina Sustenable en la Patagonia Austral. Tecnología de Manejo Extensivo; Borelli, P., Oliva, G., Eds.; INTA: Santa Cruz, Argentina, 2001; Chapter 2; pp. 17–80. [Google Scholar]
- Ezcurra, C.; Brion, C. Plants of the Nahuel Huapi: Catalogue of the Vascular Flora of the Nahual Huapi National Park; Universidad Nacional del Comahue: San Carlos de Bariloche, Argentina, 2005; p. 70. [Google Scholar]
- Zuloaga, F.O.; Morrone, O.; Belgrano, M.J. Catálogo de las Plantas Vasculares del Cono Sur (Argentina, sur de Brasil, Chile, Paraguay y Uruguay); Missouri Botanical Garden: St Louis, MI, USA, 2008; ISBN 978-19-307-2370-2. [Google Scholar]
- Damascos, M.A.; Gallopin, G.G. Ecología de un arbusto introducido (Rosa rubiginosa L.= Rosa eglanteria L.): riesgo de invasión y efectos en las comunidades vegetales de la región andino-patagónica de Argentina. Rev. Chil. Hist. Nat. 1992, 65, 395–407. [Google Scholar]
- Simberloff, D.; Relva, M.A.; Nuñez, M. Introduced species and management of a Nothofagus/Austrocedrus forest. Environ. Manag. 2003, 31, 0263–0275. [Google Scholar] [CrossRef] [PubMed]
- Gelman, A.; Hill, J. Data Analysis Using Regression and Multilevel/Hierarchical Models; Cambridge University Press: New York, NY, USA, 2006; ISBN 1-139-46093-5. [Google Scholar]
- Crawley, M.J. The R Book, 2nd ed.; John Wiley & Sons: Chichester, UK, 2013; ISBN 1-118-44896-0. [Google Scholar]
- Legendre, P.; Legendre, L. Numerical Ecology; Elsevier: Amsterdam, The Netherlands, 2012; ISBN 978-0-444-53869-7. [Google Scholar]
- Oksanen, J.; Blanchet, F.G.; Kindt, R.; Legendre, P.; O’hara, R.; Simpson, G.L.; Solymos, P.; Stevens, M.H.H.; Wagner, H. vegan: Community Ecology Package. R Package Version 2.4-6. 2017. Available online: https://CRAN.R-project.org/package=vegan (accessed on 10 October 2017).
- Baselga, A.; Orme, C.D.L. betapart: An R package for the study of beta diversity. Methods Ecol. Evol. 2012, 3, 808–812. [Google Scholar] [CrossRef]
- Team, R.C. R: A Language and Environment for Statistical Computing, Version 3.4.3; Foundation for Statistical Computing: Vienna, Austria, 2017; Available online: http://www.R-project.org (accessed on 10 October 2017).
- McAlpine, K.G.; Howell, C.J.; Wotton, D.M. Effects of tree control method, seed addition, and introduced mammal exclusion on seedling establishment in an invasive Pinus contorta forest. N. Z. J. Ecol. 2016, 40, 302–309. [Google Scholar] [CrossRef]
- Alday, J.G.; Etxeberria, E.; Ametzaga, I. Conversion of Pinus radiata plantations to native forest after harvest operations: A north Iberian Peninsula case study. Eur. J. For. Res. 2017, 136, 801–810. [Google Scholar] [CrossRef]
- Pauchard, A.; Alaback, P.B. Edge type defines alien plant species invasions along Pinus contorta burned, highway and clearcut forest edges. For. Ecol. Manag. 2006, 223, 327–335. [Google Scholar] [CrossRef]
- Davis, M.A.; Grime, J.P.; Thompson, K. Fluctuating resources in plant communities: A general theory of invasibility. J. Ecol. 2000, 88, 528–534. [Google Scholar] [CrossRef]
- Pearson, D.E.; Ortega, Y.K.; Villarreal, D.; Lekberg, Y.; Cock, M.C.; Eren, Ö.; Hierro, J. The fluctuating resource hypothesis explains invasibility, but not exotic advantage following disturbance. Ecology 2018, 99, 1296–1305. [Google Scholar] [CrossRef] [PubMed]
- Grove, S.; Parker, I.M.; Haubensak, K.A. Persistence of a soil legacy following removal of a nitrogen-fixing invader. Biol. Invasions 2015, 17, 2621–2631. [Google Scholar] [CrossRef]
- Corbin, J.D.; D’Antonio, C.M. Gone but not forgotten? Invasive plants’ legacies on community and ecosystem properties. Invasive Plant Sci. Manag. 2012, 5, 117–124. [Google Scholar] [CrossRef]
- Hess, L.J.; Austin, A.T. Pinus ponderosa alters nitrogen dynamics and diminishes the climate footprint in natural ecosystems of Patagonia. J. Ecol. 2014, 102, 610–621. [Google Scholar] [CrossRef] [Green Version]
- Araujo, P.I.; Austin, A.T. A shady business: Pine afforestation alters the primary controls on litter decomposition along a precipitation gradient in Patagonia, Argentina. J. Ecol. 2015, 103, 1408–1420. [Google Scholar] [CrossRef]
- Dehlin, H.; Peltzer, D.A.; Allison, V.J.; Yeates, G.W.; Nilsson, M.C.; Wardle, D.A. Tree seedling performance and below-ground properties in stands of invasive and native tree species. N. Z. J. Ecol. 2008, 32, 67–79. [Google Scholar]
- Reich, P.B.; Oleksyn, J.; Modrzynski, J.; Mrozinski, P.; Hobbie, S.E.; Eissenstat, D.M.; Chorover, J.; Chadwick, O.A.; Hale, C.M.; Tjoelker, M.G. Linking litter calcium, earthworms and soil properties: A common garden test with 14 tree species. Ecol. Lett. 2005, 8, 811–818. [Google Scholar] [CrossRef]
- Nuñez, M.A.; Dickie, I.A. Invasive belowground mutualists of woody plants. Biol. Invasions 2014, 16, 645–661. [Google Scholar] [CrossRef]
- Reinhart, K.O.; Callaway, R.M. Soil biota and invasive plants. New Phytol. 2006, 170, 445–457. [Google Scholar] [CrossRef] [PubMed] [Green Version]
- Buckley, Y.M.; Catford, J. Does the biogeographic origin of species matter? Ecological effects of native and non-native species and the use of origin to guide management. J. Ecol. 2016, 104, 4–17. [Google Scholar] [CrossRef]
- Paritsis, J.; Aizen, M.A. Effects of exotic conifer plantations on the biodiversity of understory plants, epigeal beetles and birds in Nothofagus dombeyi forests. For. Ecol. Manag. 2008, 255, 1575–1583. [Google Scholar] [CrossRef]
- Franzese, J.; Urrutia, J.; García, R.A.; Taylor, K.; Pauchard, A. Pine invasion impacts on plant diversity in Patagonia: Invader size and invaded habitat matter. Biol. Invasions 2017, 19, 1015–1027. [Google Scholar] [CrossRef]
- Pawson, S.M.; Ecroyd, C.E.; Seaton, R.; Shaw, W.B.; Brockerhoff, E.G. New Zealand’s exotic plantation forests as habitats for threatened indigenous species. N. Z. J. Ecol. 2010, 34, 342–355. [Google Scholar]
- Poch, T.J.; Simonetti, J.A. Insectivory in Pinus radiata plantations with different degree of structural complexity. For. Ecol. Manag. 2013, 304, 132–136. [Google Scholar] [CrossRef]
- Brockerhoff, E.G.; Ecroyd, C.E.; Leckie, A.C.; Kimberley, M.O. Diversity and succession of adventive and indigenous vascular understorey plants in Pinus radiata plantation forests in New Zealand. For. Ecol. Manag. 2003, 185, 307–326. [Google Scholar] [CrossRef]
- Drake, D.R. Relationships among the seed rain, seed bank and vegetation of a Hawaiian forest. J. Veg. Sci. 1998, 9, 103–112. [Google Scholar] [CrossRef]
- Varela, S.A.; Gobbi, M.E.; Laos, F. Banco de semillas de un bosque quemado de Nothofagus pumilio: Efecto de la aplicación de compost de biosólidos. Ecol. Austral 2006, 16, 63–78. [Google Scholar]
- Urretavizcaya, M.F.; Defossé, G.E. Soil seed bank of Austrocedrus chilensis (D. Don) Pic. Serm. et Bizarri related to different degrees of fire disturbance in two sites of southern Patagonia, Argentina. For. Ecol. Manag. 2004, 187, 361–372. [Google Scholar] [CrossRef]
- Raffaele, E.; Gobbi, M. Seed bank composition and variability in Austrocedrus chilensis forest sites in Patagonia, Argentina. Int. J. Ecol. Environ. Sci. 1996, 22, 59–72. [Google Scholar]
- Grove, S.; Parker, I.M.; Haubensak, K.A. Do impacts of an invasive nitrogen-fixing shrub on Douglas-fir and its ectomycorrhizal mutualism change over time following invasion? J. Ecol. 2017, 105, 1687–1697. [Google Scholar] [CrossRef]


© 2018 by the authors. Licensee MDPI, Basel, Switzerland. This article is an open access article distributed under the terms and conditions of the Creative Commons Attribution (CC BY) license (http://creativecommons.org/licenses/by/4.0/).
Share and Cite
Torres, A.; Alarcón, P.A.E.; Rodríguez-Cabal, M.A.; Nuñez, M.A. Secondary Invasions Hinder the Recovery of Native Communities after the Removal of Nonnative Pines Along a Precipitation Gradient in Patagonia. Forests 2018, 9, 394. https://doi.org/10.3390/f9070394
Torres A, Alarcón PAE, Rodríguez-Cabal MA, Nuñez MA. Secondary Invasions Hinder the Recovery of Native Communities after the Removal of Nonnative Pines Along a Precipitation Gradient in Patagonia. Forests. 2018; 9(7):394. https://doi.org/10.3390/f9070394
Chicago/Turabian StyleTorres, Agostina, Pablo A. E. Alarcón, Mariano A. Rodríguez-Cabal, and Martín A. Nuñez. 2018. "Secondary Invasions Hinder the Recovery of Native Communities after the Removal of Nonnative Pines Along a Precipitation Gradient in Patagonia" Forests 9, no. 7: 394. https://doi.org/10.3390/f9070394
APA StyleTorres, A., Alarcón, P. A. E., Rodríguez-Cabal, M. A., & Nuñez, M. A. (2018). Secondary Invasions Hinder the Recovery of Native Communities after the Removal of Nonnative Pines Along a Precipitation Gradient in Patagonia. Forests, 9(7), 394. https://doi.org/10.3390/f9070394