Biotic and Abiotic Drivers of Sap Flux in Mature Green Ash Trees (Fraxinus pennsylvanica) Experiencing Varying Levels of Emerald Ash Borer (Agrilus planipennis) Infestation

 ,
,
Abstract
:1. Introduction
2. Materials and Methods
2.1. Site Description and Tree Selection
2.2. Sap flux Measurements
2.3. Leaf Tissue Sampling
2.4. Foliar Gas-Exchange Measurements
2.5. Elemental and Isotopic Analysis of Leaf Tissue
2.6. Plant Tissue Non-Structural Carbohydrate Analysis
2.7. Statistical Analysis
3. Results
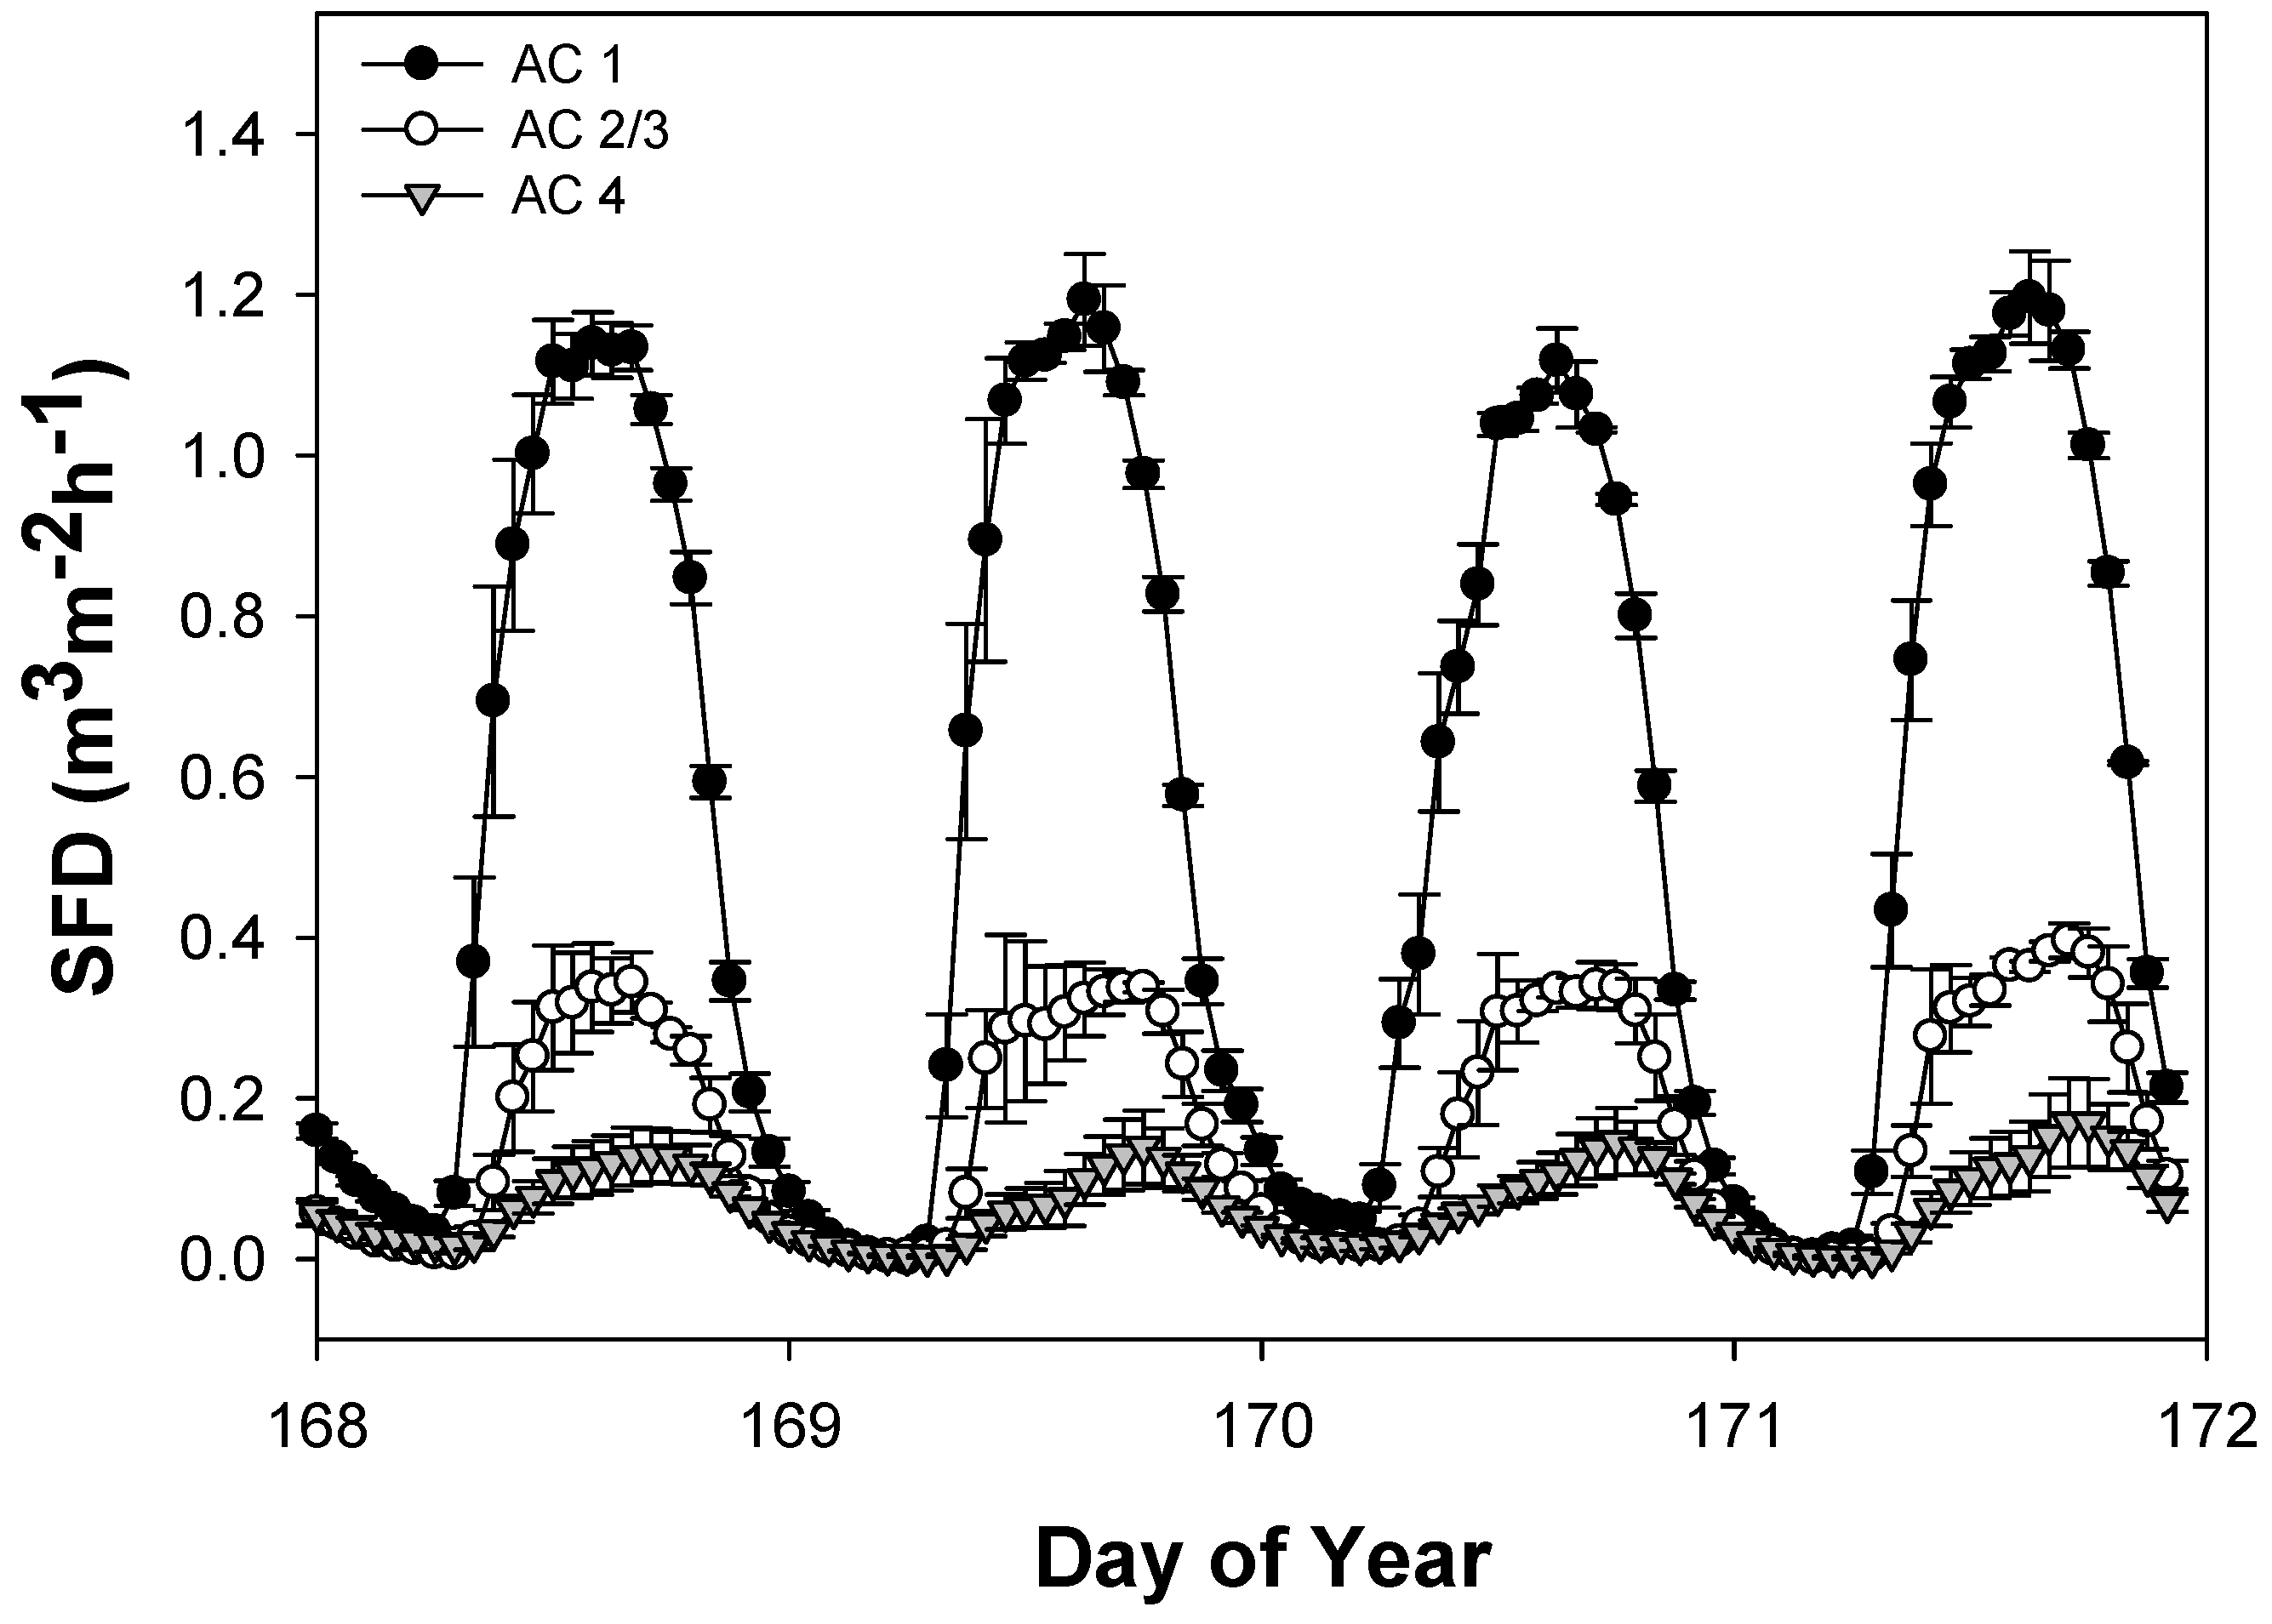
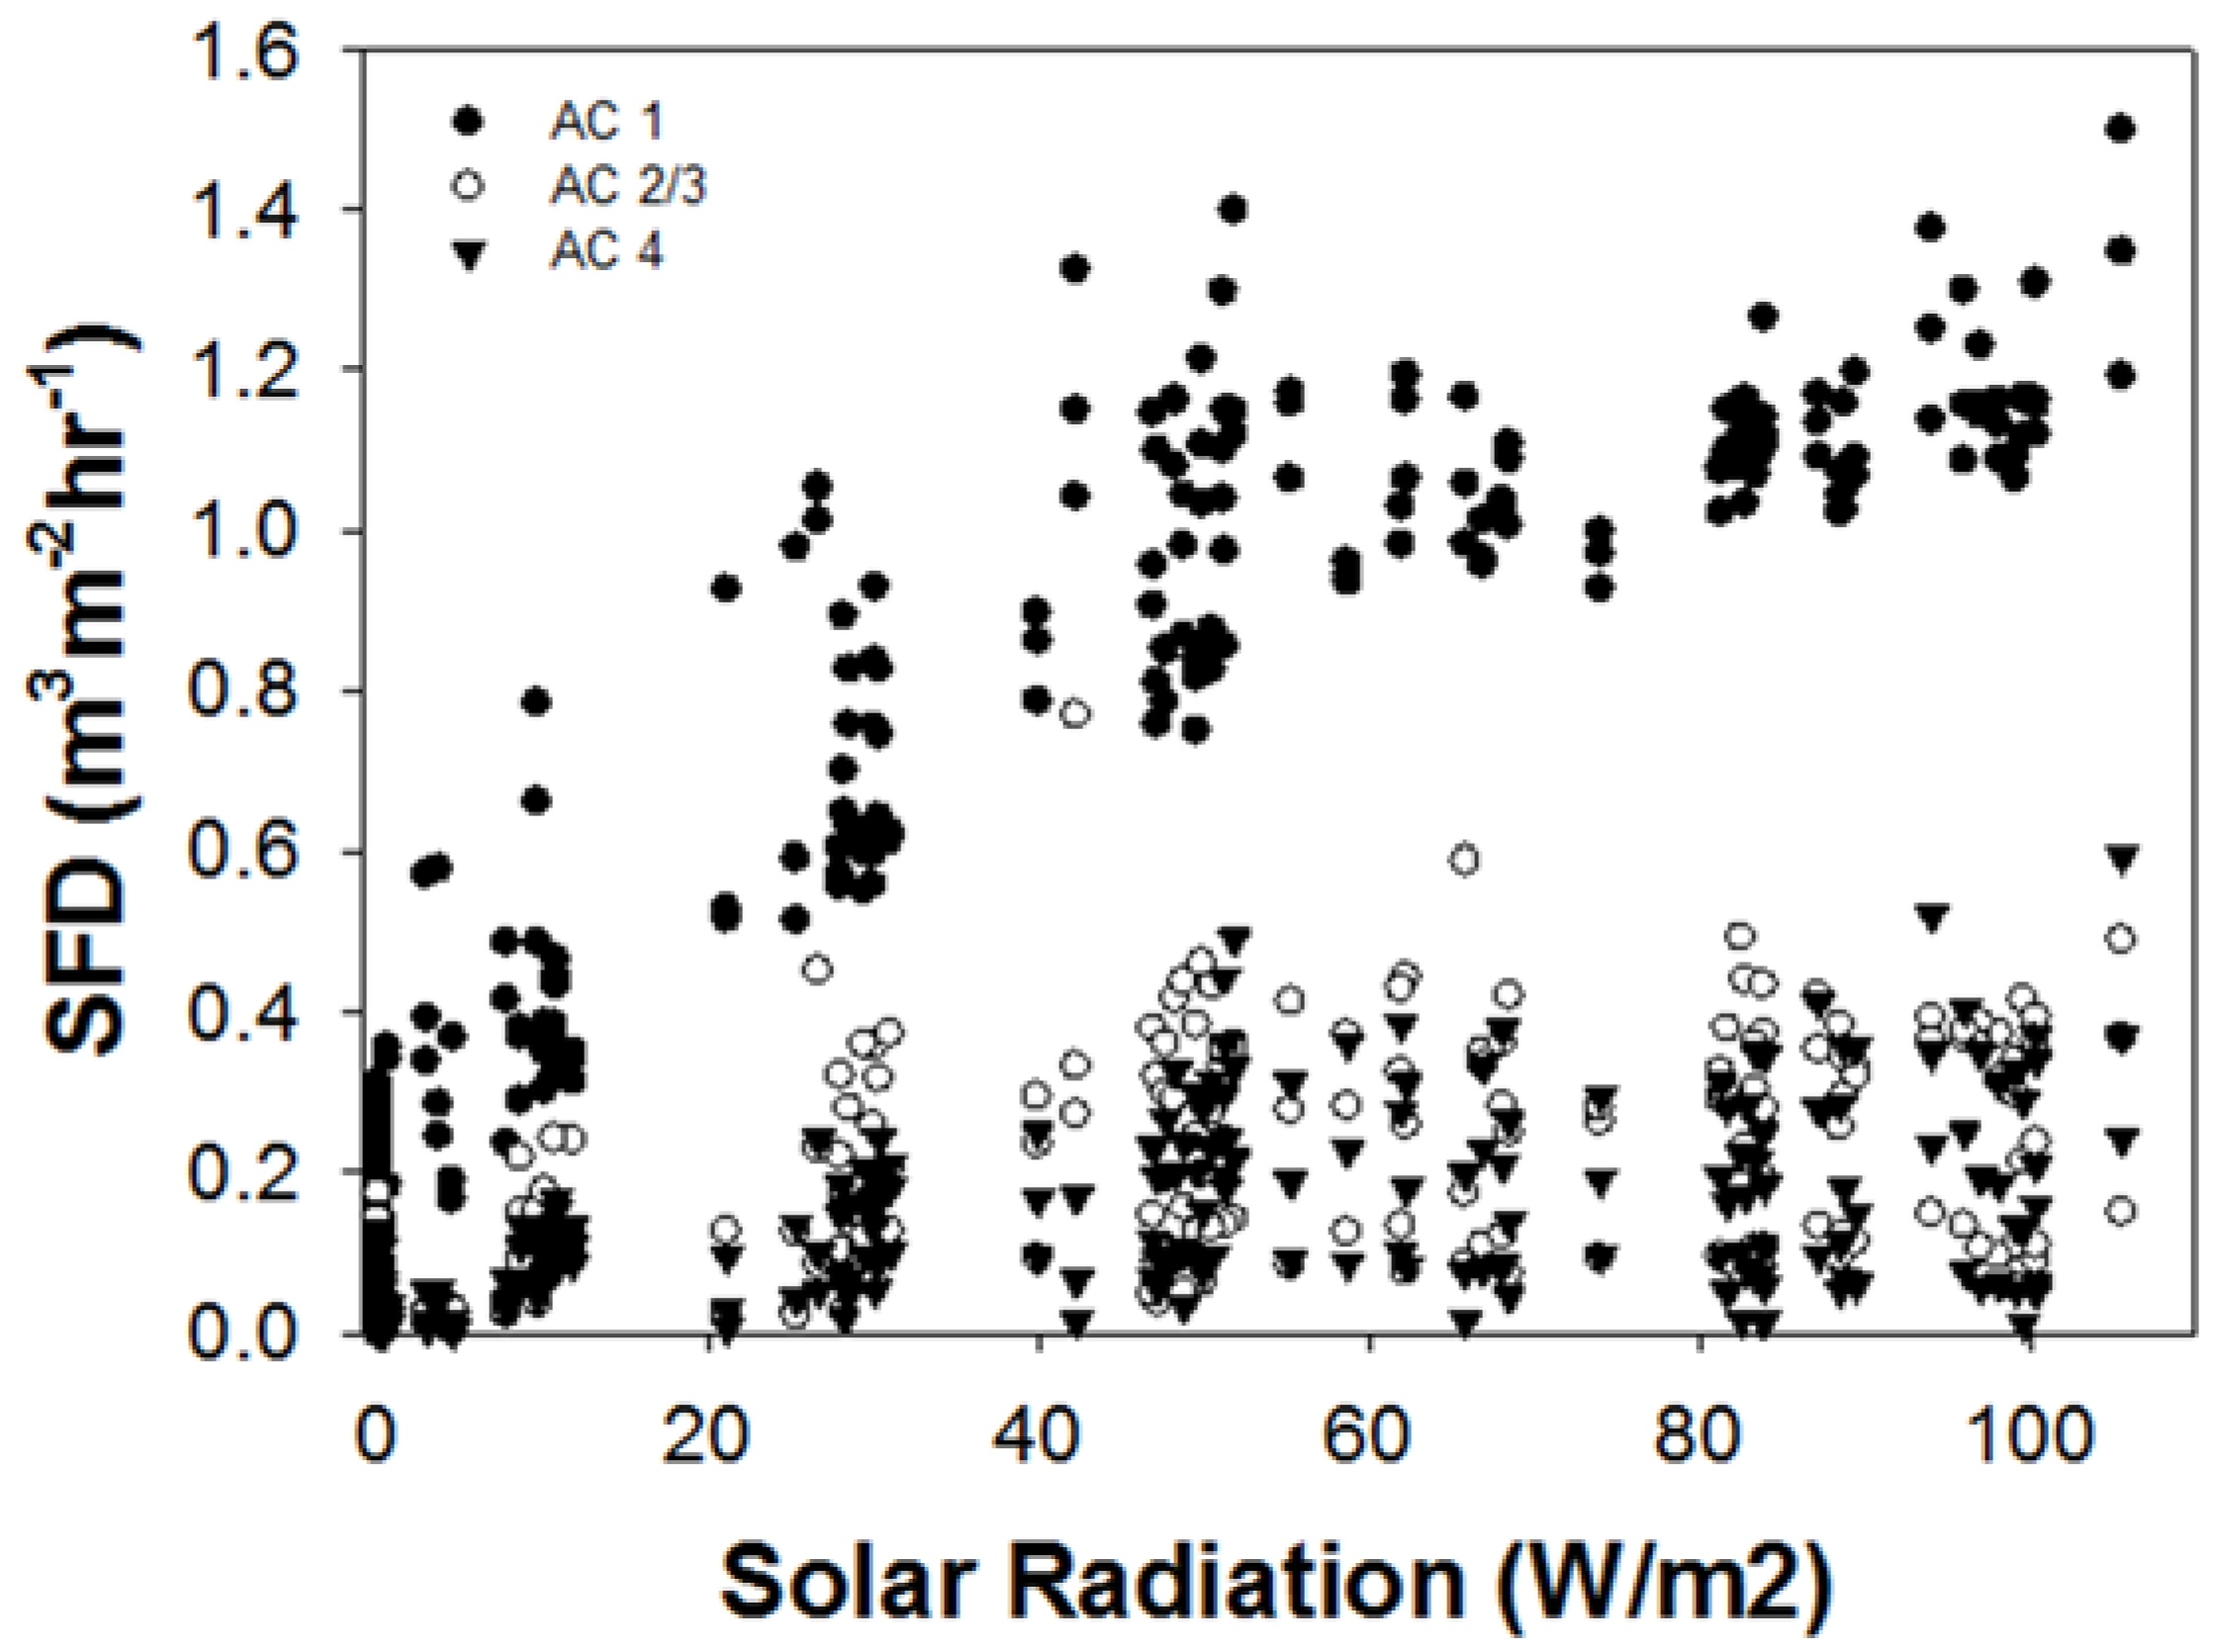
3.1. Sap Flux Density Rates by Ash Canopy Condition Classes and Abiotic Drivers
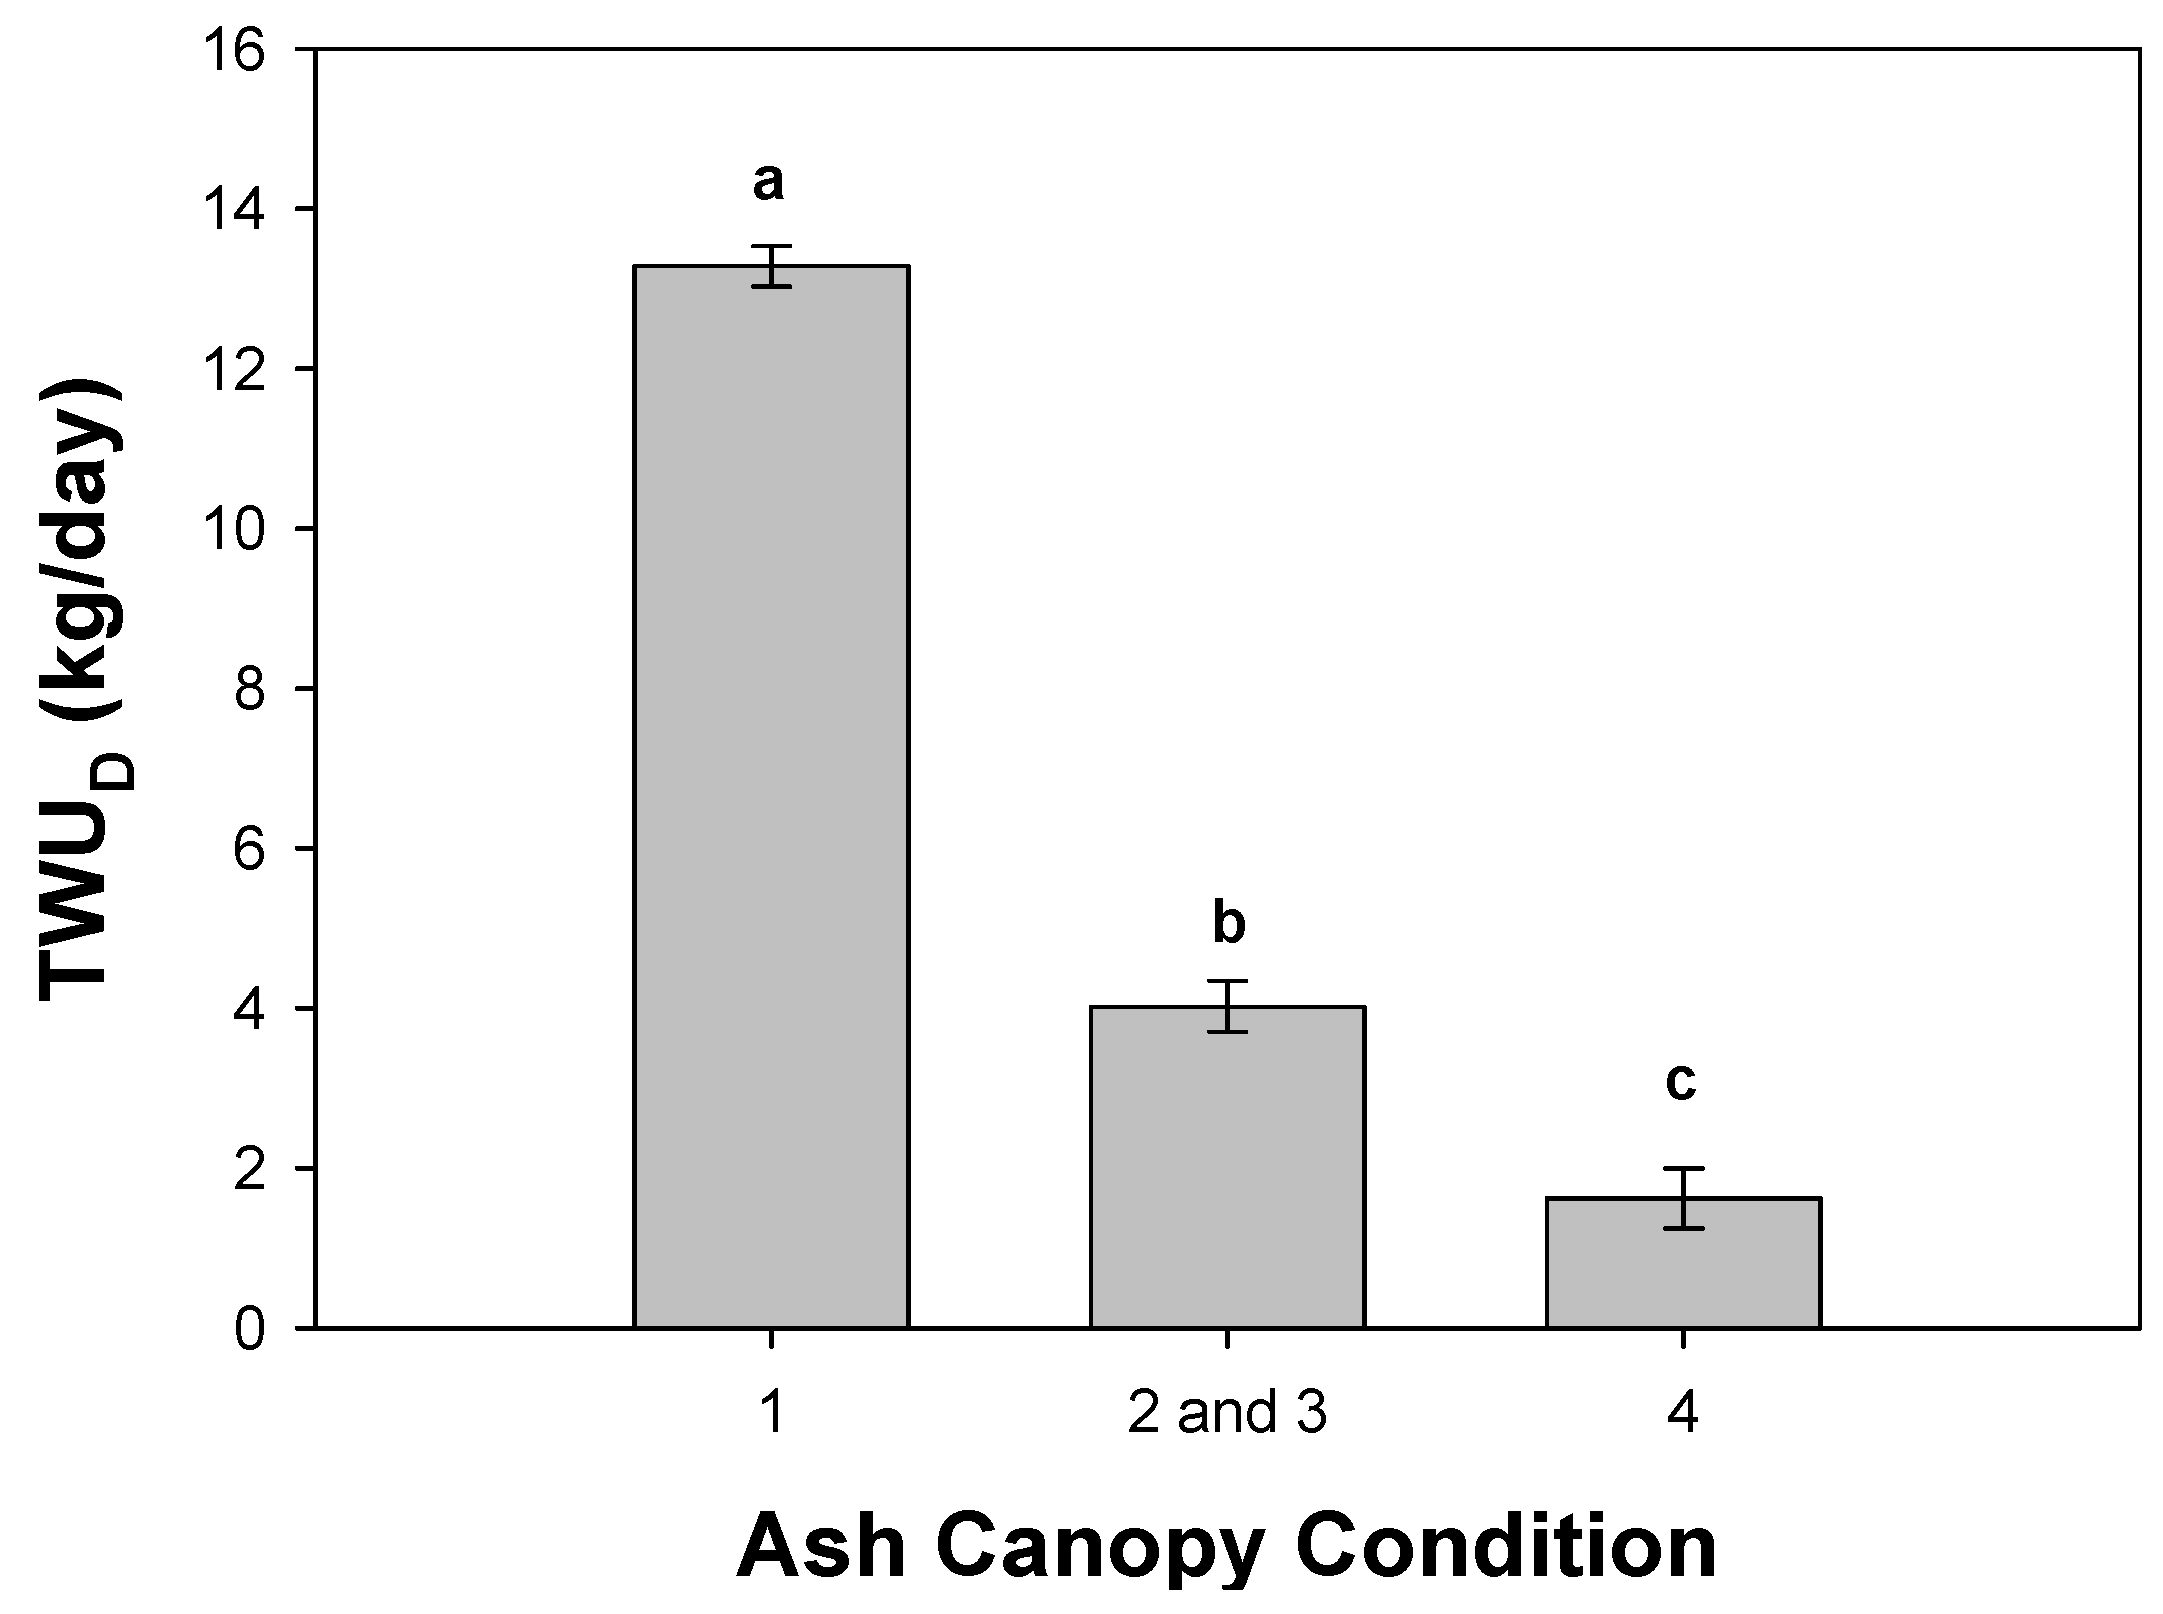
3.2. Daily Sap Flux
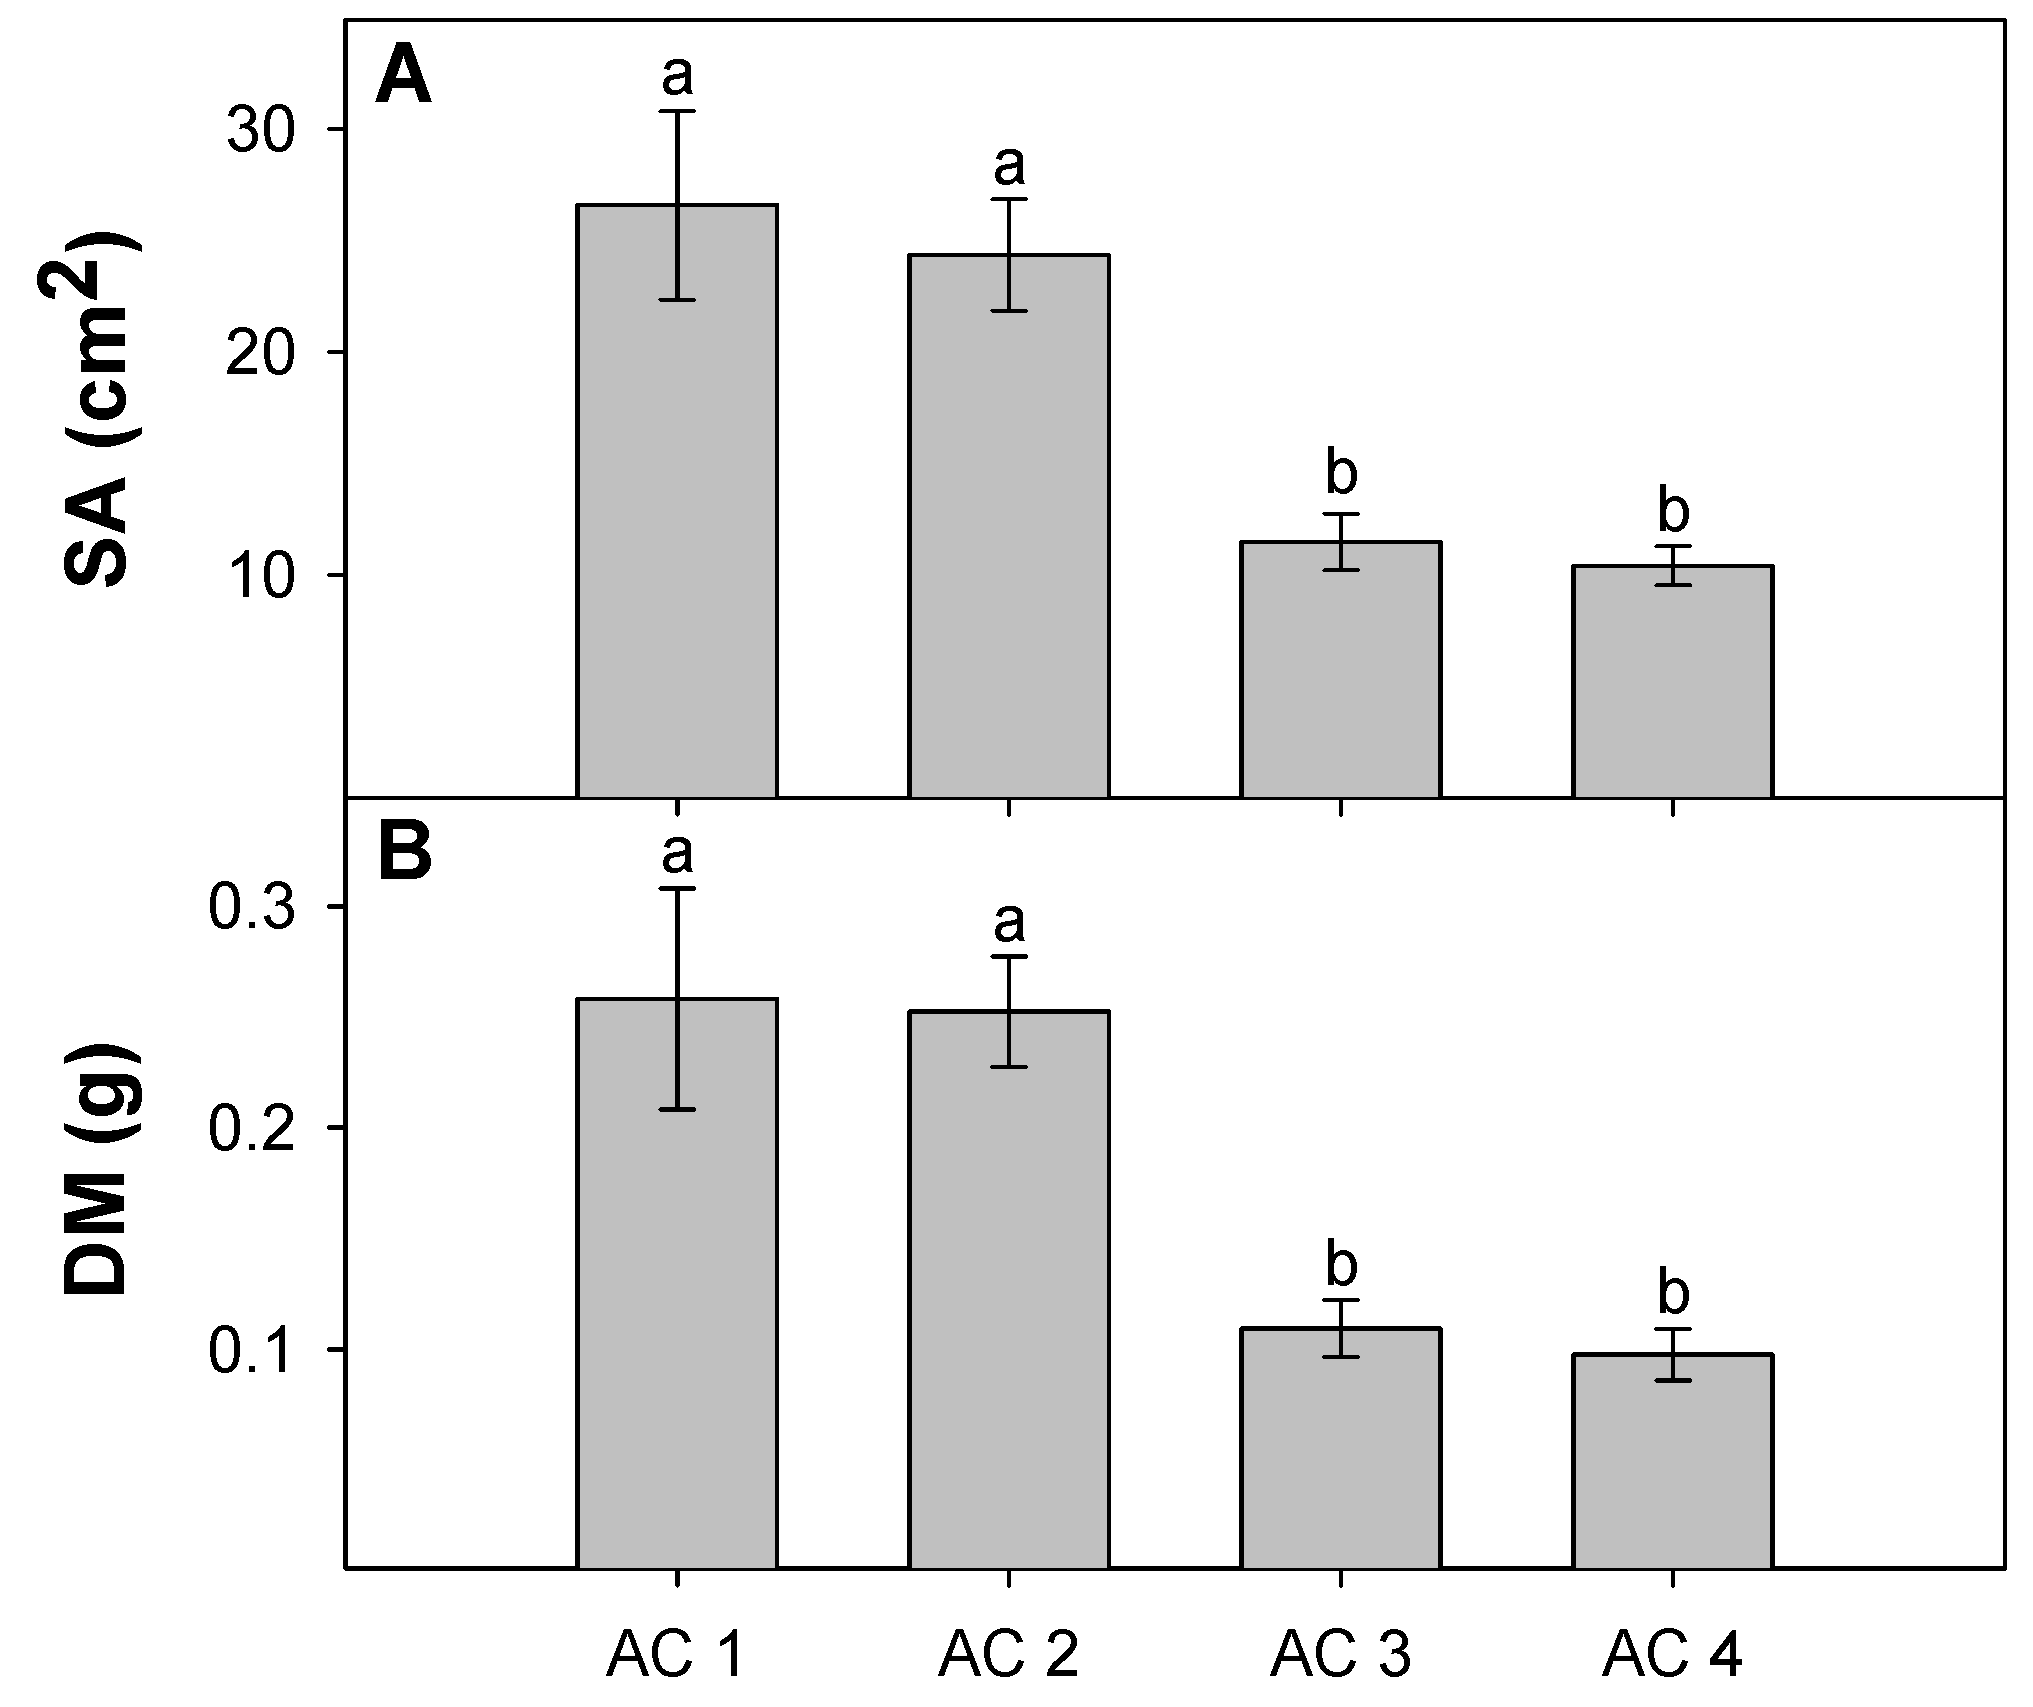
3.3. Leaf Traits
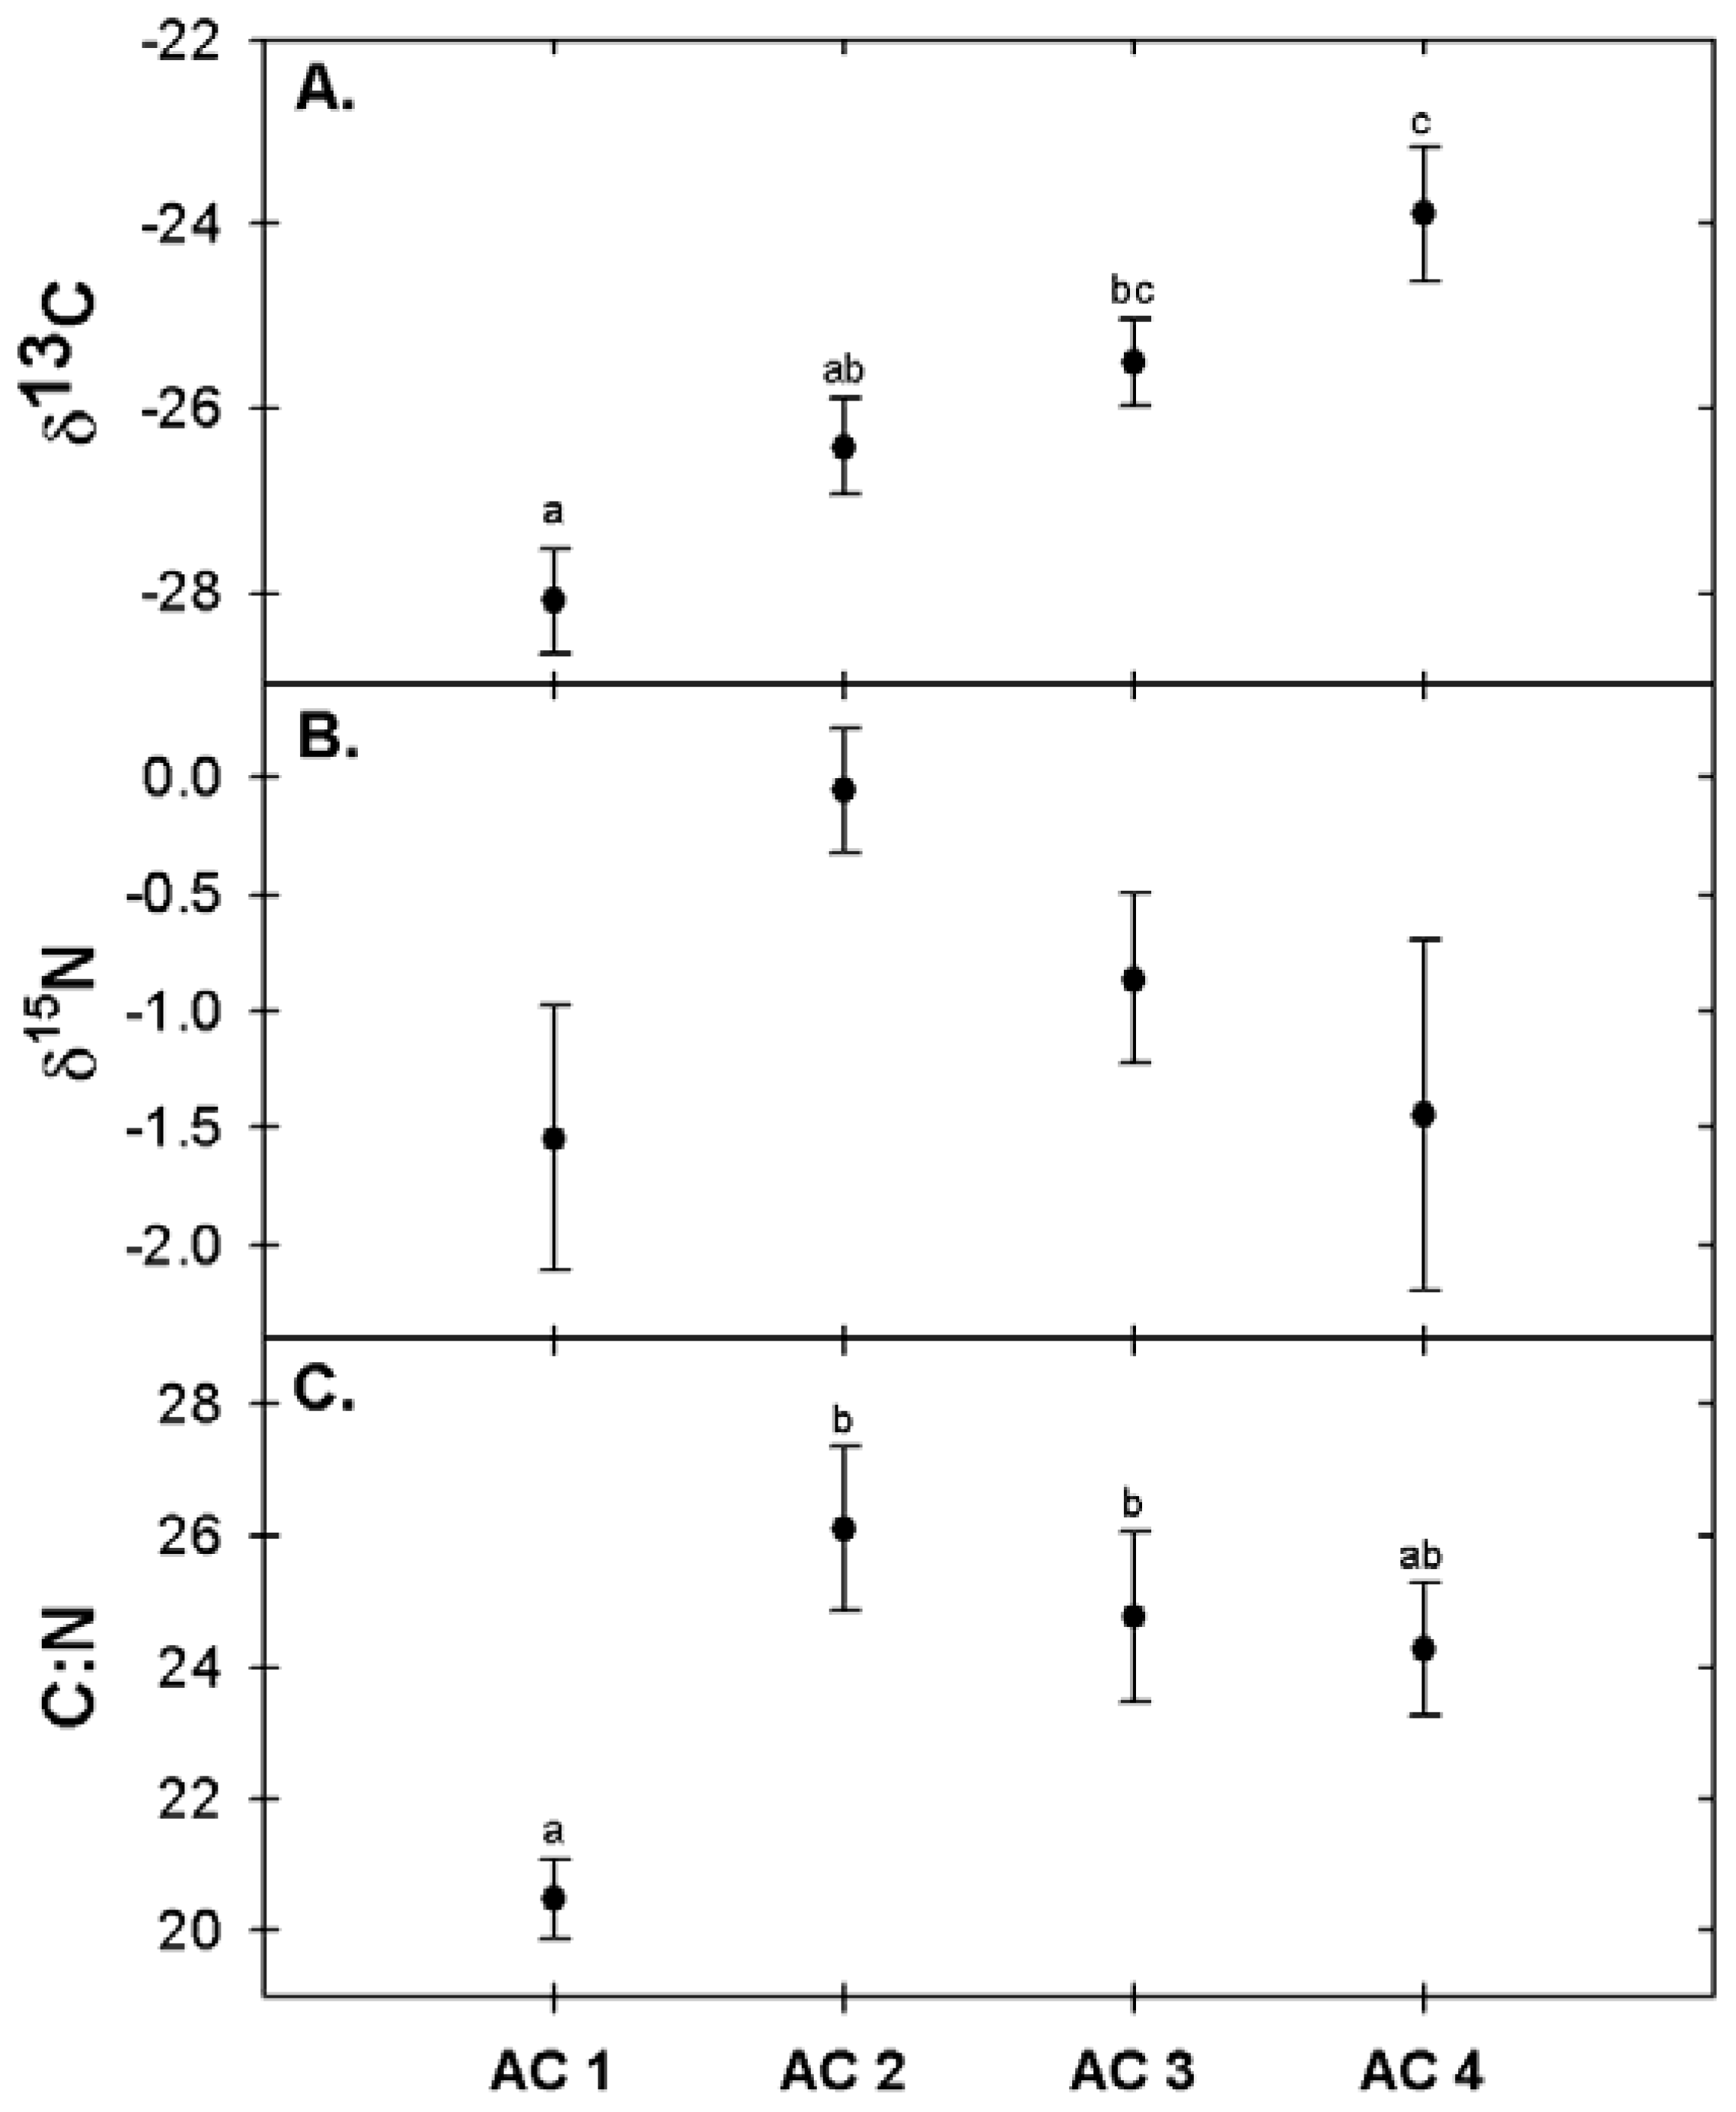
3.4. Foliar Chemistry
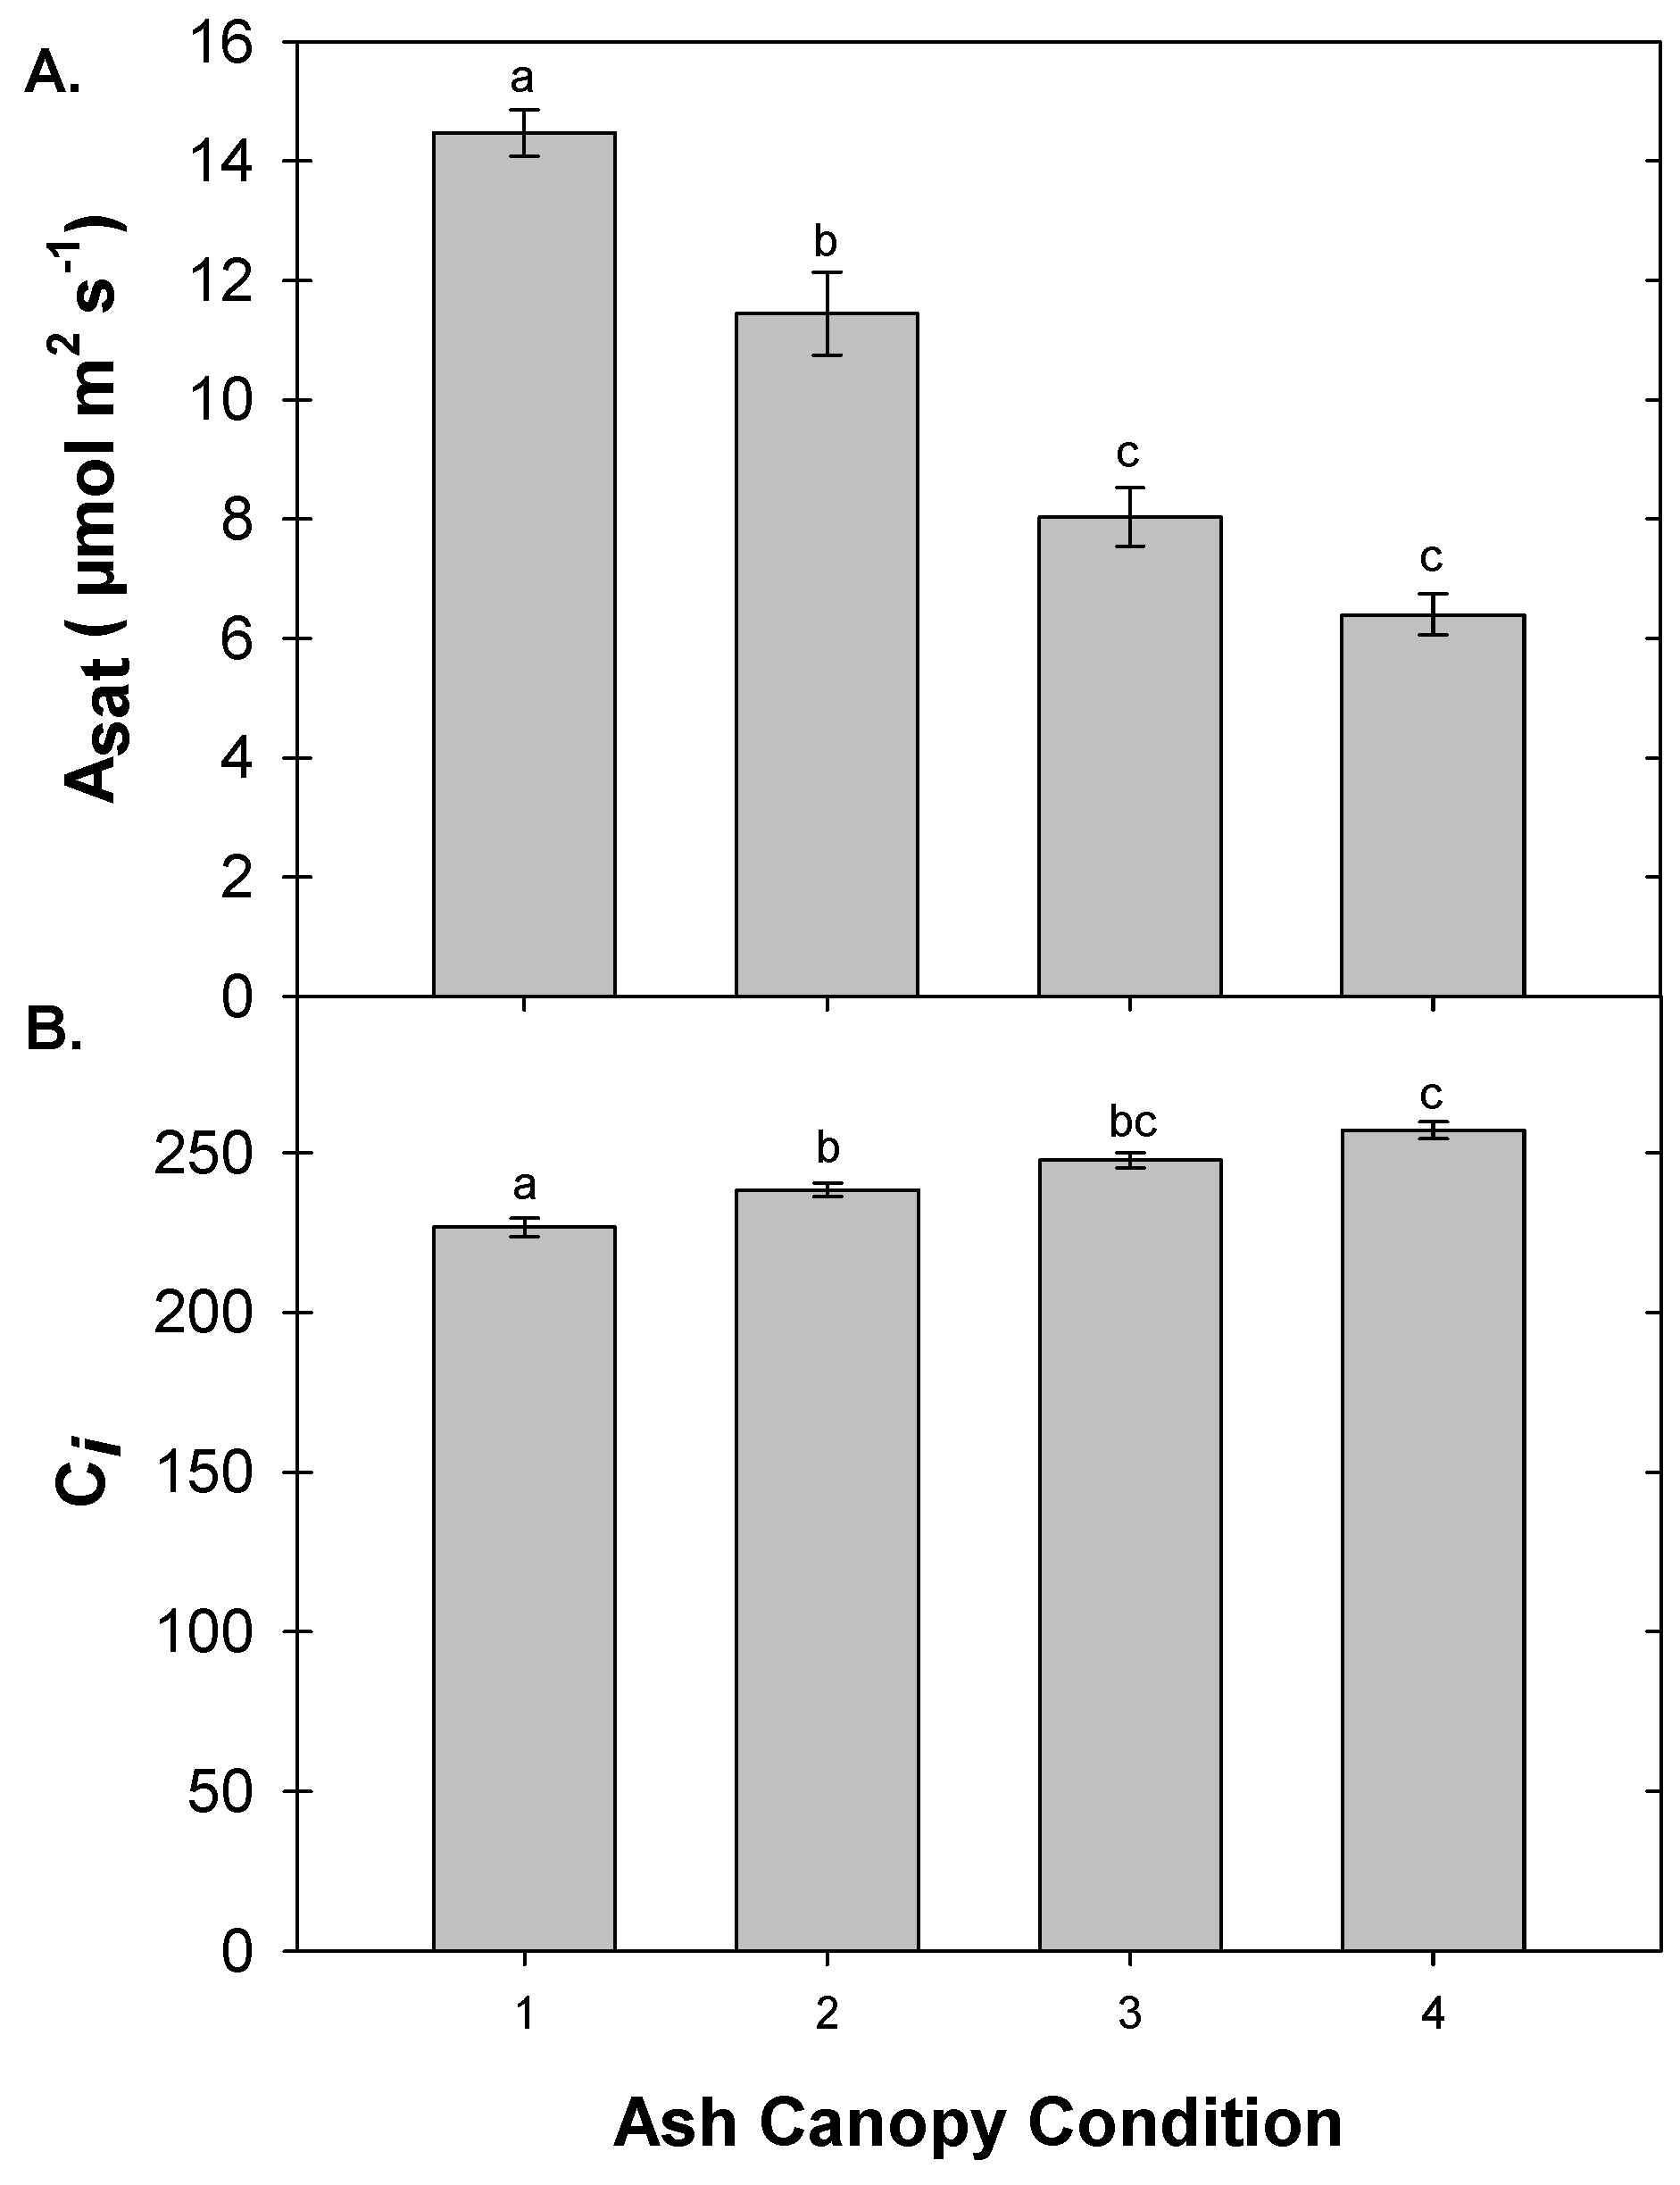
3.5. Foliar Gas Exchange
4. Discussion
5. Conclusions
Supplementary Materials
Author Contributions
Acknowledgments
Conflicts of Interest
References
- Bovard, B.D.; Curtis, P.S.; Vogel, C.S.; Su, H.-B.; Schmid, H.P. Environmental controls on sap flow in a northern hardwood forest. Tree Physiol. 2005, 25, 31–38. [Google Scholar] [CrossRef] [PubMed]
- Oren, R.; Phillips, N.; Ewers, B.E.; Pataki, D.E.; Megonigal, J.P. Sap-Flux-Scaled Transpiration Responses To Light, Vapor Pressure Deficit, and Leaf Area Reduction in a flooded Taxodium distichum forest. Tree Physiol. 1999, 19, 337–347. [Google Scholar] [CrossRef] [PubMed]
- Lösch, R. Plant Water Relations. In Progress in Botany: Genetics Cell Biology and Physiology Systematics and Comparative Morphology Ecology and Vegetation Science; Esser, K., Kadereit, J.W., Lüttge, U., Runge, M., Eds.; Springer: Berlin/Heidelberg, Germany, 1999; pp. 193–233. ISBN 978-3-642-59940-8. [Google Scholar]
- Wullschleger, S.D.; Meinzer, F.C.; Vertessy, R.A. A Review of Whole-Plant Water Use Studies in Tree. Tree Physiol. 1998, 18, 499–512. [Google Scholar] [CrossRef] [PubMed]
- Hubbard, R.M.; Rhoades, C.C.; Elder, K.; Negron, J. Changes in transpiration and foliage growth in lodgepole pine trees following mountain pine beetle attack and mechanical girdling. For. Ecol. Manag. 2013, 289, 312–317. [Google Scholar] [CrossRef]
- Flower, C.E.; Gonzalez-Meler, M.A. Responses of temperate forest productivity to insect and pathogen disturbances. Annu. Rev. Plant Biol. 2015, 66, 547–569. [Google Scholar] [CrossRef] [PubMed]
- Lagergren, F.; Lindroth, A. Transpiration response to soil moisture in pine and spruce trees in Sweden. Agric. For. Meteorol. 2002, 112, 67–85. [Google Scholar] [CrossRef]
- Lu, P.; Urban, L.; Zhao, P. Granier’s thermal dissipation probe (TDP) method for measuring Sap Flow in trees: theory and practice. Acta Bot. Sin. 2004, 46, 631–646. [Google Scholar]
- Hölscher, D.; Koch, O.; Korn, S.; Leuschner, C. Sap flux of five co-occurring tree species in a temperate broad-leaved forest during seasonal soil drought. Trees 2005, 19, 628–637. [Google Scholar] [CrossRef]
- Gebauer, T.; Horna, V.; Leuschner, C. Variability in radial sap flux density patterns and sapwood area among seven co-occurring temperate broad-leaved tree species. Tree Physiol. 2008, 28, 1821–1830. [Google Scholar] [CrossRef] [PubMed]
- Oren, R.; Pataki, D.E. Transpiration in response to variation in microclimate and soil moisture in southeastern deciduous forests. Oecologia 2001, 127, 549–559. [Google Scholar] [CrossRef] [PubMed]
- Granier, A. Evaluation of transpiration in a Douglas-fir stand by means of sap flow measurements. Tree Physiol. 1987, 3, 309–320. [Google Scholar] [CrossRef] [PubMed]
- Ploetz, R.C.; Schaffer, B.; Vargas, A.I.; Konkol, J.L.; Salvatierra, J.; Wideman, R. Impact of Laurel Wilt, Caused by Raffaelea lauricola, on Leaf Gas Exchange and Xylem Sap Flow in Avocado, Persea americana. Phytopathology 2015, 105, 433–440. [Google Scholar] [CrossRef] [PubMed]
- Urban, J.; Dvořák, M. Sap flow-based quantitative indication of progression of Dutch elm disease after inoculation with Ophiostoma novo-ulmi. Trees Struct. Funct. 2014, 28, 1599–1605. [Google Scholar] [CrossRef]
- Kirisits, T.; Offenthaler, I. Xylem sap flow of Norway spruce after inoculation with the blue-stain fungus Ceratocystis polonica. Plant Pathol. 2002, 51, 359–364. [Google Scholar] [CrossRef]
- Park, J.-H.; Juzwik, J.; Cavender-Bares, J. Multiple Ceratocystis smalleyi infections associated with reduced stem water transport in bitternut hickory. Phytopathology 2013, 103, 565–574. [Google Scholar] [CrossRef] [PubMed]
- Schäfer, K.V.R.; Clark, K.L.; Skowronski, N.; Hamerlynck, E.P. Impact of insect defoliation on forest carbon balance as assessed with a canopy assimilation model. Glob. Chang. Biol. 2010, 16, 546–560. [Google Scholar] [CrossRef]
- Hultine, K.R.; Nagler, P.L.; Morino, K.; Bush, S.E.; Burtch, K.G.; Dennison, P.E.; Glenn, E.P.; Ehleringer, J.R. Sap flux-scaled transpiration by tamarisk (Tamarix spp.) before, during and after episodic defoliation by the saltcedar leaf beetle (Diorhabda carinulata). Agric. For. Meteorol. 2010, 150, 1467–1475. [Google Scholar] [CrossRef]
- Bauer, L.; Haack, R.A.; Miller, D.; Petrice, T.; Liu, H. Emerald ash borer life cycle. In Proceedings of the Emerald Ash Borer Research and Technology Development Meeting, Port Huron, MI, USA, 30 September–1 October 2003; FHTET-2004-02. USDA Forest Service, Forest Health Technology Enterprise Team: Morgantown, WV, USA, 2004; p. 8. [Google Scholar]
- Siegert, N.W.; McCullough, D.G.; Liebhold, A.M.; Telewski, F.W. Dendrochronological reconstruction of the epicentre and early spread of emerald ash borer in North America. Divers. Distrib. 2014, 20, 847–858. [Google Scholar] [CrossRef]
- Wang, X.; Yang, Z.; Gould, J.; Zhang, Y.; Liu, G.; Liu, E. The biology and ecology of the emerald ash borer, Agrilus planipennis, in China. J. Insect Sci. 2010, 10, 128. [Google Scholar] [CrossRef] [PubMed]
- Cappaert, D.; Mccullough, D.G.; Poland, T.M.; Siegert, N.W. Emerald ash borer in north america a research and regulatory challenge. Am. Entomol. 2005, 51, 152–165. [Google Scholar] [CrossRef]
- Herms, D.A.; McCullough, D.G. Emerald Ash Borer Invasion of North America: History, Biology, Ecology, Impacts, and Management. Annu. Rev. Entomol. 2014, 59, 13–30. [Google Scholar] [CrossRef] [PubMed]
- Rebek, E.J.; Herms, D.A.; Smitley, D.R. Interspecific variation in resistance to emerald ash borer (Coleoptera: Buprestidae) among North American and Asian ash (Fraxinus spp.). Environ. Entomol. 2008, 37, 242–246. [Google Scholar] [CrossRef]
- Anulewicz, A.C.; McCullough, D.G.; Cappaert, D.L.; Poland, T.M. Host range of the emerald ash borer (Agrilus planipennis Fairmaire) (Coleoptera: Buprestidae) in North America: results of multiple-choice field experiments. Environ. Entomol. 2008, 37, 230–241. [Google Scholar] [CrossRef]
- Cipollini, D. White fringetree as a novel larval host for emerald ash borer. J. Econ. Entomol. 2015, 108, 370–375. [Google Scholar] [CrossRef] [PubMed]
- Pugh, S.A.; Liebhold, A.M.; Morin, R.S. Changes in ash tree demography associated with emerald ash borer invasion, indicated by regional forest inventory data from the Great Lakes States. Can. J. For. Res. 2011, 41, 2165–2175. [Google Scholar] [CrossRef]
- Flower, C.E.; Knight, K.S.; Gonzalez-Meler, M.A. Impacts of the emerald ash borer (Agrilus planipennis Fairmaire) induced ash (Fraxinus spp.) mortality on forest carbon cycling and successional dynamics in the eastern United States. Biol. Invasions 2013, 15, 931–944. [Google Scholar] [CrossRef]
- MacFarlane, D.W.; Meyer, S.P. Characteristics and distribution of potential ash tree hosts for emerald ash borer. For. Ecol. Manag. 2005, 213, 15–24. [Google Scholar] [CrossRef]
- Burns, R.; Honkala, B. Silvics of North America, Vol. 2: Hardwoods. Agriculture Handbook 654; United States Department of Agriculture Forest Service: Washington, DC, USA, 1990.
- McCullough, D.G.; Poland, T.M.; Cappaert, D. Attraction of the emerald ash borer to ash trees stressed by girdling, herbicide treatment, or wounding. Can. J. For. Res. 2009, 39, 1331–1345. [Google Scholar] [CrossRef]
- Smitley, D.; Davis, T.; Rebek, E. Progression of ash canopy thinning and dieback outward from the initial infestation of emerald ash borer (Coleoptera: Buprestidae) in southeastern Michigan. J. Econ. Entomol. 2008, 101, 1643–1650. [Google Scholar] [CrossRef] [PubMed]
- Knight, K.S.; Brown, J.P.; Long, R.P. Factors affecting the survival of ash trees (Fraxinus spp.) infested by emerald ash borer (Agrilus planipennis). Biol. Invasions 2013, 15, 371–383. [Google Scholar] [CrossRef]
- Flower, C.E.; Lynch, D.J.; Knight, K.S.; González-Meler, M.A. EAB induced tree mortality impacts tree water use and ecosystem respiration in an experimental forest. In Proceedings of the Emerald Ash Borer National Research and Technology Development Meeting, Wooster, OH, USA, 12–13 October 2011; FHTET-2011-06. pp. 115–116. [Google Scholar]
- Flower, C.E.; Knight, K.S.; Rebbeck, J.; Gonzalez-Meler, M.A. The relationship between the emerald ash borer (Agrilus planipennis) and ash (Fraxinus spp.) tree decline: Using visual canopy condition assessments and leaf isotope measurements to assess pest damage. For. Ecol. Manag. 2013, 303, 143–147. [Google Scholar] [CrossRef]
- Telander, A.C.; Slesak, R.A.; D’Amato, A.W.; Palik, B.J.; Brooks, K.N.; Lenhart, C.F. Sap flow of black ash in wetland forests of northern Minnesota, USA: Hydrologic implications of tree mortality due to emerald ash borer. Agric. For. Meteorol. 2015, 206, 4–11. [Google Scholar] [CrossRef]
- Drewniak, B.; Gonzalez-Meler, M.A. Earth system model needs for including the interactive representation of nitrogen deposition and drought effects on forested ecosystems. Forests 2017, 8, 267. [Google Scholar] [CrossRef]
- Paul, M.J.; Pellny, T.K. Carbon metabolite feedback regulation of leaf photosynthesis and development. J. Exp. Bot. 2003, 54, 539–547. [Google Scholar] [CrossRef] [PubMed]
- Rashke, K. Stomatal action. Annu. Rev. Plant Physiol. 1975, 26, 309–340. [Google Scholar] [CrossRef]
- Collatz, G.J.; Ball, J.T.; Grivet, C.; Berry, J.A. Physiological and environmental regulation of stomatal conductance, photosynthesis and transpiration—A model that includes a laminar boundary-layer. Agric. For. Meteorol. 1991, 54, 107–136. [Google Scholar] [CrossRef]
- Sperry, J.S. Hydraulic constraints on plant gas exchange. Agric. For. Meteorol. 2000, 104, 13–23. [Google Scholar] [CrossRef]
- Setter, T.L.; Brun, W.A.; Brenner, M.L. Effect of obstructed translocation on leaf abscisic Acid, and associated stomatal closure and photosynthesis decline. Plant Physiol. 1980, 65, 1111–1115. [Google Scholar] [CrossRef] [PubMed]
- Cheng, J.; Fan, P.; Liang, Z.; Wang, Y.; Niu, N.; Li, W.; Li, S. Accumulation of End Products in Source Leaves Affects Photosynthetic Rate in Peach via Alteration of Stomatal Conductance and Photosynthetic Efficiency. J. Am. Soc. Hortic. Sci. 2009, 134, 667–676. [Google Scholar]
- Azcón-Bieto, J.; Osmond, C.B. Relationship between photosynthesis and respiration—The effect of carbohydrate status on the rate of CO2 production by respiration in darkened and illuminated wheat leaves. Plant Physiol. 1983, 71, 574–581. [Google Scholar] [CrossRef] [PubMed]
- Munné-Bosch, S.; Alegre, L. Die and let live: Leaf senescence contributes to plant survival under drought stress. Funct. Plant Biol. 2004, 31, 203–216. [Google Scholar] [CrossRef]
- Otieno, D.O.; Schmidt, M.W.T.; Adiku, S.; Tenhunen, J. Physiological and morphological responses to water stress in two Acacia species from contrasting habitats. Tree Physiol. 2005, 25, 361–371. [Google Scholar] [CrossRef] [PubMed]
- Slesak, R.A.; Lenhart, C.F.; Brooks, K.N.; D’Amato, A.W.; Palik, B.J. Water table response to harvesting and simulated emerald ash borer mortality in black ash wetlands in Minnesota, USA. Can. J. For. Res. 2014, 44, 961–968. [Google Scholar] [CrossRef]
- Saurer, M.; Siegwolf, R.T.W.; Schweingruber, F.H. Carbon isotope discrimination indicates improving water-use efficiency of trees in northern Eurasia over the last 100 years. Glob. Chang. Biol. 2004, 10, 2109–2120. [Google Scholar] [CrossRef]
- Flower, C.E.; Dalton, J.E.; Knight, K.S.; Brikha, M.; Gonzalez-Meler, M.A. To treat or not to treat: Diminishing effectiveness of emamectin benzoate tree injections in ash trees heavily infested by emerald ash borer. Urban For. Urban Green. 2015, 14. [Google Scholar] [CrossRef]
- Ford, C.R.; McGuire, M.A.; Mitchell, R.; Teskey, R.O. Assensing variations in the radial profile of sap flow density in Pinus species and its effects on daily water use. Tree Physiol. 2004, 24, 241–249. [Google Scholar] [CrossRef] [PubMed]
- Kelliher, F.M.; Kostner, B.M.M.; Hollinger, D.Y.; Byers, J.N.; Hunt, J.E.; McSeveny, T.M.; Meserth, R.; Weir, P.L.; Schulze, E.D. Evaporation, Xylem Sap Flow, and Tree Transpiration in a New-Zealand Broad-Leaved Forest. Agric. For. Meteorol. 1992, 62, 53–73. [Google Scholar] [CrossRef]
- Young, A.; Mitchell, N. Microclimate and vegetation edge effects in a fragmented podocarp-broadleaf forest in New Zealand. Biol. Conserv. 1994, 67, 63–72. [Google Scholar] [CrossRef]
- Veen, A.W.L.; Klaassen, W.; Kruijt, B.; Hutjes, R.W.A. Forest edges and the soil-vegetation-atmosphere interaction at the landscape scale: The state of affairs. Prog. Phys. Geogr. 1996, 20, 292–310. [Google Scholar] [CrossRef]
- Davies-Colley, R.J.; Payne, G.W.; Van Elswijk, M. Microclimate gradients across a forest edge. N. Z. J. Ecol. 2000, 24, 111–121. [Google Scholar]
- Herbst, M.; Roberts, J.M.; Rosier, P.T.W.; Taylor, M.E.; Gowing, D.J. Edge effects and forest water use: A field study in a mixed deciduous woodland. For. Ecol. Manag. 2007, 250, 176–186. [Google Scholar] [CrossRef]
- Flower, C.E.; Knight, K.S.; González-Meler, M.A. Using stable isotopes as a tool to investigate the impacts of EAB on tree physiology and EAB spread. In Proceedings of the Emerald Ash Borer Research and Technology Development Meeting, Pittsburgh, PA, USA, 20–21 October 2009; FHTET-2010-01. USDA Forest Service, Forest Health Technology Enterprise Team: Morgantown, WV, USA, 2010; pp. 54–55. [Google Scholar]
- Smith, A. Effects of Community Structure on Forest Susceptibility and Response to the Emerald Ash Borer iNvasion of the Huron River Watershed in Southeast Michigan. Master’s Thesis, The Ohio State University, Columbus, OH, USA, 2006. [Google Scholar]
- Granier, A. A new method of sap flow measurement in tree stems. Ann. Des. Sci. For. 1985, 42, 193–200. [Google Scholar] [CrossRef]
- Do, F.; Rocheteau, A. Influence of natural temperature gradients on measurements of xylem sap flow with thermal dissipation probes. 2. Advantages and calibration of a noncontinuous heating system. Tree Physiol. 2002, 22, 649–654. [Google Scholar] [CrossRef] [PubMed]
- Meadows, J.S.; Hodges, J.D. Sapwood area as an estomator of leaf area and oliar weight in cherrybark oak and green ash. For. Sci. 2001, 48, 69–76. [Google Scholar]
- Jones, M.G.; Outlaw, W.H.; Lowry, O.H. Enzymic assay of 10−7 to 10−14 moles of sucrose in plant tissues. Plant Physiol. 1977, 60, 379–383. [Google Scholar] [CrossRef] [PubMed]
- Curtis, P.S.; Vogel, C.S.; Wang, X.Z.; Pregitzer, K.S.; Zak, D.R.; Lussenhop, J.; Kubiske, M.; Teeri, J.A. Gas exchange, leaf nitrogen, and growth efficiency of Populus tremuloides in a CO2-enriched atmosphere. Ecol. Appl. 2000, 10, 3–17. [Google Scholar]
- Possen, B.J.H.M.; Oksanen, E.; Rousi, M.; Ruhanen, H.; Ahonen, V.; Tervahauta, A.; Heinonen, J.; Heiskanen, J.; Kärenlampi, S.; Vapaavuori, E. Adaptability of birch (Betula pendula Roth) and aspen (Populus tremula L.) genotypes to different soil moisture conditions. For. Ecol. Manag. 2011, 262, 1387–1399. [Google Scholar] [CrossRef]
- Farquhar, G.D.; Ball, M.C.; Roksandic, Z.; City, C. Effect of salinity and humidity on δ13C value of halophytes-evidence for diffusional isotope fractionation determined by the ratio of intercellular/atmospheric partial pressure of CO2 under different environmental conditions. Oecologia 1982, 52, 121–124. [Google Scholar] [CrossRef] [PubMed]
- Farquhar, G.D.; Richards, R.A. Isotopic composition of plant carbon correlates with water-use efficiency of wheat genotypes. Aust. J. Plant Physiol. 1984, 11, 539–552. [Google Scholar] [CrossRef]
- Granier, A.; Anfodillo, T.; Sabatti, M.; Cochard, H.; Dreyer, E.; Tomasi, M.; Valentini, R.; Bréda, N. Axial and radial water flow in the trunk of oak trees: a quantitative and qualitative analysis. Tree Physiol. 1994, 14, 1383–1396. [Google Scholar] [CrossRef] [PubMed]
- Lu, P.; Biron, P.; Breda, N.; Granier, A. Water relations of adult Norway spruce (Picea abies (L) Karst) under soil drought in the Vosges mountains: water potential, stomatal conductance and transpiration. Ann. For. Sci. 1995, 52, 117–129. [Google Scholar] [CrossRef]
- Stöhr, A.; Lösch, R. Xylem sap flow and drought stress of Fraxinus excelsior saplings. Tree Physiol. 2004, 24, 169–180. [Google Scholar] [CrossRef] [PubMed]
- Chakraborty, S.; Whitehill, J.G.A.; Hill, A.L.; Opiyo, S.O.; Cipollini, D.; Herms, D.A.; Bonello, P. Effects of water availability on emerald ash borer larval performance and phloem phenolics of Manchurian and black ash. Plant Cell Environ. 2014, 37, 1009–1021. [Google Scholar] [CrossRef] [PubMed]
- Azcón-Bieto, J. Inhibition of photosynthesis by carbohydrates in wheat leaves. Plant Physiol. 1983, 73, 681–686. [Google Scholar] [CrossRef] [PubMed]
- Paul, M.J.; Foyer, C.H. Sink regulation of photosynthesis. J. Exp. Bot. 2001, 52, 1383–1400. [Google Scholar] [CrossRef] [PubMed]
- Iglesias, D.J.; Lliso, I.; Tandeo, F.R.; Talon, M. Regulation of photosynthesis through source: sink imbalance in citrus mediated by carbohydrate content in leaves. Physiol. Plant. 2002, 116, 563–572. [Google Scholar] [CrossRef]
- Goldschmidt, E.E.; Huber, S.C. Regulation of photosynthesis by end-product accumulation in leaves of plants storing starch, sucrose, and hexose sugars. Plant Physiol. 1992, 99, 1443–1448. [Google Scholar] [CrossRef] [PubMed]
- Jordan, M.-O.; Habib, R. Mobilizable carbon reserves in young peach trees as evidenced by trunk girdling experiments. J. Exp. Bot. 1996, 47, 79–87. [Google Scholar] [CrossRef]
- Myers, D.; Thomas, R.; DeLucia, E. Photosynthetic responses of loblolly pine (Pinus taeda) needles to experimental reduction in sink demand. Tree Physiol. 1999, 19, 235–242. [Google Scholar] [CrossRef] [PubMed]
- Yamaoka, Y.; Swanson, R.; Hiratsuka, Y. Inoculation of lodgepole pine with four blue-stain fungi associated with mountain pine beetle, monitored by a heat pulse velocity (HPV) insturment. Can. J. For. Res. 1990, 20, 31–36. [Google Scholar] [CrossRef]
- Mack, R. Characterization of emerald ash borer (EAB) pupal chamber location in ash log sections. In 2014 Emerald Ash Borer National Research and Technology Development Meeting; Buck, J., Parra, G., Lance, D., Reardon, R., Binion, D., Eds.; USDA Forest Service, Forest Health Technology Enterprise Team: Morgantown, WV, USA, 2015; p. 52. [Google Scholar]
- Farquhar, G.D.; O’Leary, M.H.; Berry, J.A. On the relationship between carbon isotope discrimination and the intercellular carbon dioxide concentration in leaves. Aust. J. Plant Physiol. 1982, 9, 121–137. [Google Scholar] [CrossRef]
- Running, S.W.; Coughlan, J.C. A general-model of forest ecosystem processes for regional applications. I. Hydrologic balance, canopy gas-exchange and primary production processes. Ecol. Model. 1988, 42, 125–154. [Google Scholar] [CrossRef]
- Richards, J.; Caldwell, M. Hydraulic lift: Substantial nocturnal water transport between soil layers by Artemisia tridentata roots. Oecologia 1987, 73, 486–489. [Google Scholar] [CrossRef] [PubMed]
- Caldwell, M.M.; Richards, J.H. Hydraulic lift: water efflux from upper roots improves effectiveness of water uptake by deep roots. Oecologia 1989, 79, 1–5. [Google Scholar] [CrossRef] [PubMed]
- Dawson, T.E. Determining water use by trees and forests from isotopic, energy balance and transpiration analyses: the roles of tree size and hydraulic lift. Tree Physiol. 1996, 16, 263–272. [Google Scholar] [CrossRef] [PubMed]
- Dawson, T.E. Hydraulic lift and water use by plants: implications for water balance, performance and plant-plant interactions. Oecologia 1993, 95, 565–574. [Google Scholar] [CrossRef] [PubMed]


| Tree No. | AC | DBH a (cm) | Tree Height (m) | Avg. Daily Sap Flux (kg/day ± se) | Leaf δ13C | % EAB Gallery Cover |
|---|---|---|---|---|---|---|
| 1 | 1 | 18.8 | 11.9 | 13.69 ± 0.33 | −28.12 | 0 |
| 2 | 1 | 22.4 | 13.2 | 13.13 ± 0.10 | −28.11 | 5 |
| 3 | 1 | 17.8 | 11.2 | 13.01 ± 0.31 | −27.39 | 5 |
| 4 | 2 | 20.1 | 12.1 | 4.54 ± 0.30 | −26.97 | 10 |
| 5 | 2 | 19.8 | 12.3 | 3.78 ± 0.28 | −25.94 | 17.5 |
| 6 | 3 | 19.3 | 11.6 | 3.74 ± 0.16 | −26.49 | 25 |
| 7 | 4 | 17.0 | 10.5 | 2.20 ± 0.15 | −25.91 | 45 |
| 8 | 4 | 18.2 | 11.7 | 1.17 ± 0.22 | −25.94 | 50 |
| 9 | 4 | 18.8 | 11.5 | 1.48 ± 0.10 | −25.92 | 55 |
| Source | Type III SS | df | MS | F-Ratio | p-Value |
|---|---|---|---|---|---|
| AC | 0.215 | 2 | 0.108 | 7.34 | 0.001 |
| VPD | 0.904 | 1 | 0.904 | 61.65 | <0.001 |
| Radiation | 11.867 | 1 | 11.867 | 809.37 | <0.001 |
| AC × VPD | 0.426 | 2 | 0.213 | 14.53 | <0.001 |
| AC × Radiation | 7.441 | 2 | 3.721 | 253.76 | <0.001 |
| AC × VPD × Radiation | 1.562 | 2 | 0.781 | 53.284 | <0.001 |
| Error | 13.562 | 925 | 0.015 |
| AC | Soluble Sugars | Starch | TNC |
|---|---|---|---|
| 1 | 38.0 (0.9) | 4.9 (1.5) | 42.9 (2.3) |
| 2/3 | 46.1 (4.0) | 4.7 (2.3) | 50.8 (2.1) |
| 4 | 28.3 (7.9) | 12.0 (5.9) | 40.3 (13.8) |
© 2018 by the authors. Licensee MDPI, Basel, Switzerland. This article is an open access article distributed under the terms and conditions of the Creative Commons Attribution (CC BY) license (http://creativecommons.org/licenses/by/4.0/).
Share and Cite
Flower, C.E.; Lynch, D.J.; Knight, K.S.; Gonzalez-Meler, M.A. Biotic and Abiotic Drivers of Sap Flux in Mature Green Ash Trees (Fraxinus pennsylvanica) Experiencing Varying Levels of Emerald Ash Borer (Agrilus planipennis) Infestation. Forests 2018, 9, 301. https://doi.org/10.3390/f9060301
Flower CE, Lynch DJ, Knight KS, Gonzalez-Meler MA. Biotic and Abiotic Drivers of Sap Flux in Mature Green Ash Trees (Fraxinus pennsylvanica) Experiencing Varying Levels of Emerald Ash Borer (Agrilus planipennis) Infestation. Forests. 2018; 9(6):301. https://doi.org/10.3390/f9060301
Chicago/Turabian StyleFlower, Charles E., Douglas J. Lynch, Kathleen S. Knight, and Miquel A. Gonzalez-Meler. 2018. "Biotic and Abiotic Drivers of Sap Flux in Mature Green Ash Trees (Fraxinus pennsylvanica) Experiencing Varying Levels of Emerald Ash Borer (Agrilus planipennis) Infestation" Forests 9, no. 6: 301. https://doi.org/10.3390/f9060301
APA StyleFlower, C. E., Lynch, D. J., Knight, K. S., & Gonzalez-Meler, M. A. (2018). Biotic and Abiotic Drivers of Sap Flux in Mature Green Ash Trees (Fraxinus pennsylvanica) Experiencing Varying Levels of Emerald Ash Borer (Agrilus planipennis) Infestation. Forests, 9(6), 301. https://doi.org/10.3390/f9060301