Abstract
Emerald ash borer (EAB) is an invasive beetle that kills native North American ash species, threatening their persistence. A classical biological control program for EAB was initiated in 2007 with the release of three specialized EAB parasitoids. Monitoring changes in the health and regeneration of ash where EAB biocontrol agents have been released is critical for assessing the success of EAB biocontrol and predicting future changes to the ash component of North American forests. We sampled release and control plots across southern Michigan over a three-year period to measure ash health and recruitment to begin assessing the long-term impact of EAB biological control on ash populations. We noted a reduced mortality of larger trees between 2012 and 2015 in release plots compared to control plots and increases in ash diameter, but our results were otherwise inconsistent. Ash regeneration was generally higher in release plots compared to control plots but highly variable among sites, suggesting some protection of ash saplings from EAB by parasitoids. We conclude that EAB biocontrol is likely to have a positive effect on ash populations, but that the study duration was not long enough to definitively deduce the long-term success of the biocontrol program in this region.
1. Introduction
Introduced insects and pathogens are some of the most significant threats to forest growth and diversity in North America [1]. Most genera of woody plants today are associated with one or more species of phytophagous invasive insect [2,3,4,5]. Although containment and eradication strategies may exist for some invasive species [6,7], the United States continues to experience establishment events by destructive, non-indigenous forest pests [4,8]. Increased rates of new introductions are facilitated by increases and advances in global trade and travel [4,8,9]. Moreover, a linear increase in the establishment of new insect species since 1860 has been documented, including an average of 2.5 nonindigenous forest insects established per year over the last 150 years, 14% of which have caused significant damage to native trees [4]. In particular, phloem- and wood-boring insects have dominated new establishments of nonindigenous insects into forests of the United States since 1980.
The emerald ash borer (EAB), Agrilus planipennis (Coleoptera: Buprestidae), is an invasive phloem-feeding beetle native to Asia that attacks and kills native North American species of ash (Fraxinus spp.) trees [10]. Unlike Asian ash species that co-evolved varying levels of resistance to EAB, North American ash species show little resistance to infestation and consequently are more vulnerable to EAB attack, phloem damage, and subsequent tree death [10,11,12]. Emerald ash borer was discovered in southeastern Michigan, USA and nearby Ontario, Canada in 2002 [13]. Despite early eradication efforts and ongoing quarantines, EAB has now spread to 33 states, the District of Columbia, and three Canadian provinces as of May 2018 [14]. Emerald ash borer attacks ash trees with a diameter at breast height (DBH) >2.5 cm [13,15] and has killed hundreds of millions of ash in urban and natural areas across North America at billions of dollars of estimated costs [16,17]. The loss or reduction of ash in North America will permanently alter forest ecosystems wherever ash represents a significant fraction of tree community composition, and many species that are dependent on ash are likely to be affected. For example, at least 44 species of arthropods within the current range of EAB are known to feed only on ash, including 24 lepidopterans and a number of coleopterans, and are now considered at risk should ash become rare or locally extinct [18,19,20].
In North America, the mortality rates of EAB caused by native insect natural enemies are relatively low compared to those attacking native species of Agrilus and EAB in Asia [20,21,22,23]. Consequently, EAB became a candidate for management using classical biological control–the importation and introduction of specialized natural enemies from the pest’s native range with the goal of permanent control [24,25,26]. In northeast China, researchers found three specialized hymenopteran parasitoids attacking EAB: Tetrastichus planipennisi Yang (Eulophidae), a larval endoparasitoid; Spathius agrili Yang (Braconidae), a larval ectoparasitoid; and Oobius agrili Zhang and Huang (Encyrtidae), an egg parasitoid [21,27]. After several years of research in quarantine laboratories in the United States and field studies in China, these parasitoids were found to have narrow host ranges and to reduce EAB populations in China [22,23]. The three parasitoids were first approved for release in Michigan in 2007 [28]. Similar research was completed for another EAB parasitoid, Spathius galinae Belokobylskij (Braconidae) from the Russian Far East, and its release was approved in 2015 [29]. To conserve native Fraxinus species, the United States Department of Agriculture (USDA) began an EAB biocontrol program in which approved EAB parasitoids are provided to researchers and land managers for release in EAB-infested areas of North America [30]. These cooperators are currently introducing the EAB biocontrol agents in most states and provinces invaded by EAB [26] with all parasitoid release and recovery data maintained in a geospatial database for long-term monitoring [31].
The establishment and spread of O. agrili and T. planipennisi have been studied at permanent research plots in southern Michigan since releases first began in 2007. The establishment of S. agrili, however, has not been confirmed [32,33]. The egg parasitoid O. agrili, which kills EAB before any phloem damage occurs regardless of ash diameter, is establishing and slowly expanding its distribution, but its impact on EAB population dynamics has been difficult to quantify [34]. The most dominant of the introduced parasitoids, T. planipennisi, is spreading quickly and was found to protect ash saplings and small ash trees up to ~15 cm DBH from EAB damage in forests recovering from the EAB invasion [32,33,35,36]. Releases of S. galinae began in Michigan and several other states in 2015. Although the reproduction and spread of S. galinae has been documented in Michigan and several other northern states [26], it is too early to confirm sustained establishment. In other regions of North America where early EAB parasitoid-release and recovery data are available, the establishment and spread of T. planipennisi and O. agrili, and recoveries of S. galinae, are also documented [31].
Monitoring changes in ash condition following the invasion of forests by EAB is critical for predicting future changes to the ash component. Initial efforts to assess the biological control impact on ash health, based on the decline rate and survival of ash trees and saplings >5 cm DBH, have detected a significant reduction in EAB density in saplings due to the released biocontrol agent T. planipennisi, but have failed to demonstrate the direct effect of the biocontrol agent on ash health and survival [36]. However, higher densities of ash saplings (<5 cm DBH) were found in proximity to EAB biocontrol release plots, suggesting that T. planipennisi may be protecting ash saplings from EAB and potentially favoring the recruitment of native hardwood regeneration over invasive plant species [37]. Nevertheless, data collected from long-term monitoring plots are necessary to evaluate the effects of EAB biological control, especially because ash trees survive for about five years once infested [38]. Results from other biological control programs have shown that there is a considerable lag time for the establishment and population increase of biocontrol agents [39,40]. In particular, baseline information on ash health and regeneration (specifically, monitoring the growth, density, and survival of seedlings, saplings, basal sprouts, some larger survivors, and seed production/germination) is needed to predict the long-term impact that parasitoids will have on EAB, and the potential outcome for ash species in North America.
In this study, we evaluated the impacts of the EAB biological control on ash health and recruitment in southern Lower Michigan in 2012 and again in 2015. This work was done at long-term biocontrol study sites, each comprised of paired biocontrol-release and non-release control plots. Our objectives were to (1) examine and characterize ash health, mortality, and regeneration in these EAB biocontrol study sites; and (2) quantify the initial impacts of EAB biocontrol on ash health conditions and regeneration and provide a framework for long-term comparisons of biocontrol-release and non-release plots. We predicted that plots with parasitoid releases should feature larger and healthier ash trees and higher ash regeneration densities compared to control plots.
2. Materials and Methods
2.1. Study Sites and Field Sampling
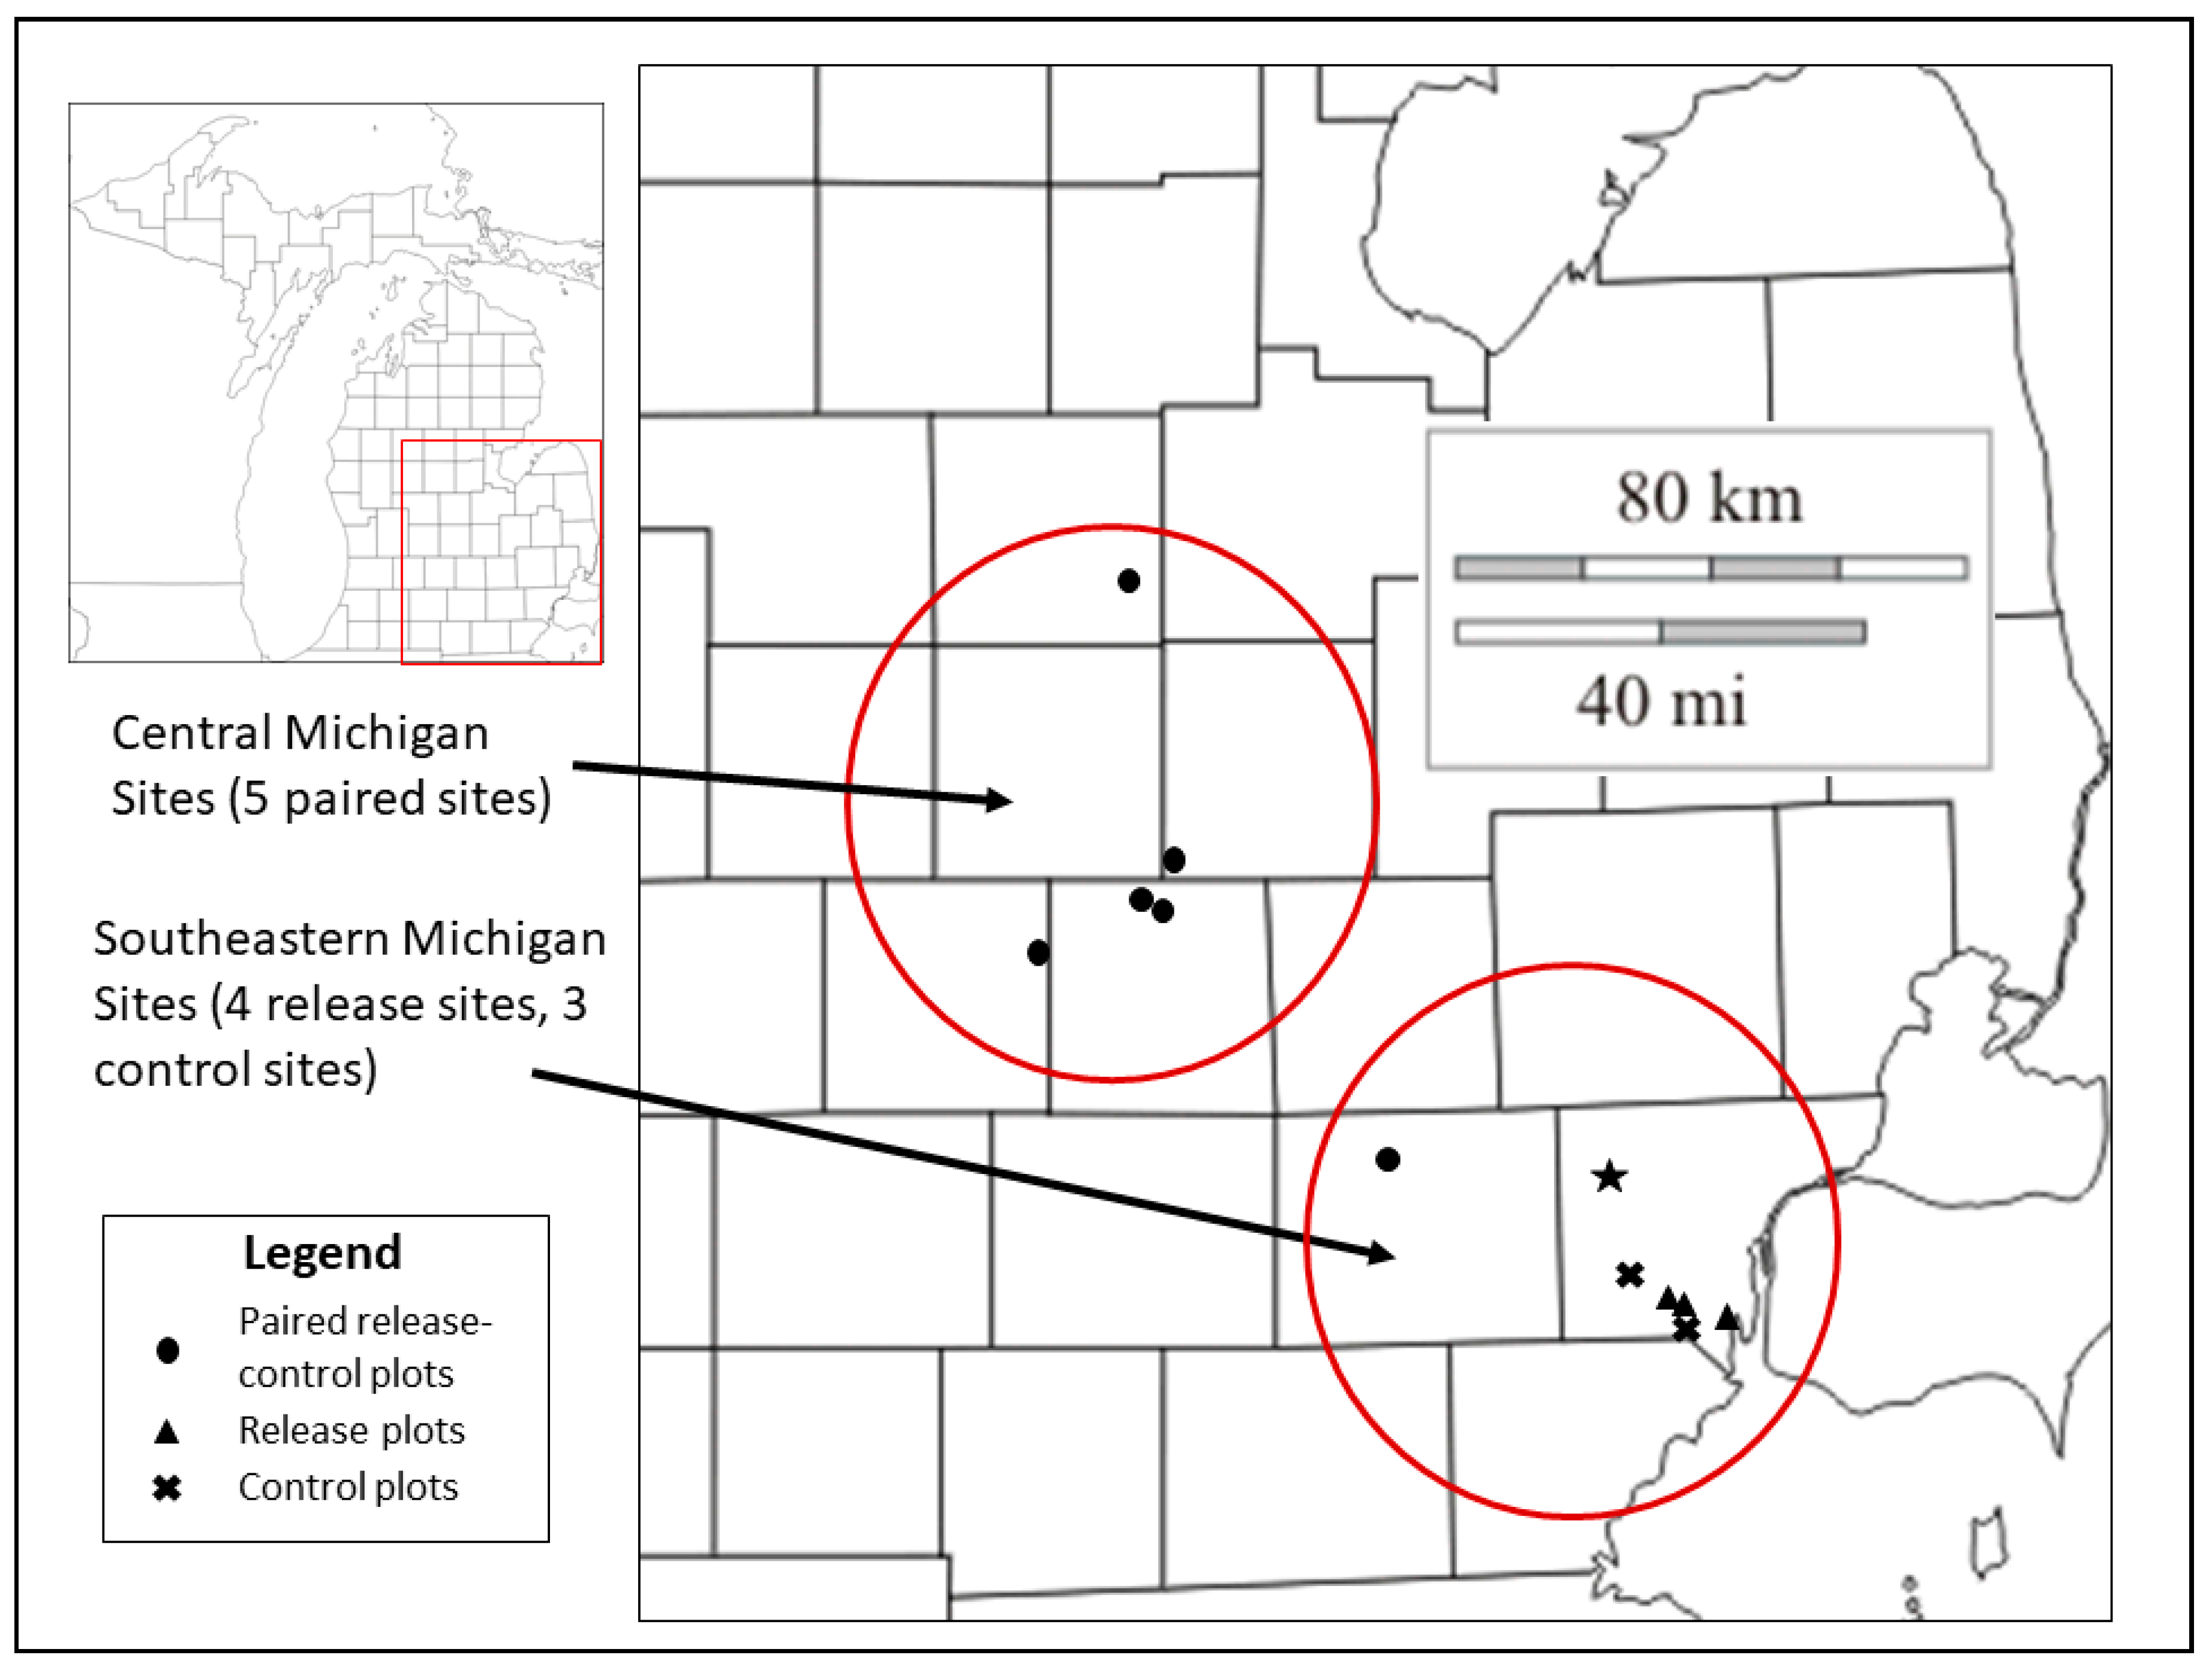
We examined ash health and regeneration at nine study sites, with a total of 17 sample plots, in two areas of southern Michigan (Figure 1, Appendix A and Appendix B). Sampling methods for ash health and plot design approximated those described in the Emerald Ash Borer Biological Control Release and Recovery Guidelines [30]. Forest composition was mixed and variable from site to site; ash sampled at study sites was either green ash (F. pennsylvanica Marsh.) or white ash (F. americana L.) and represented a small fraction of the overstory at the time of sampling (following EAB impact; Appendix A).
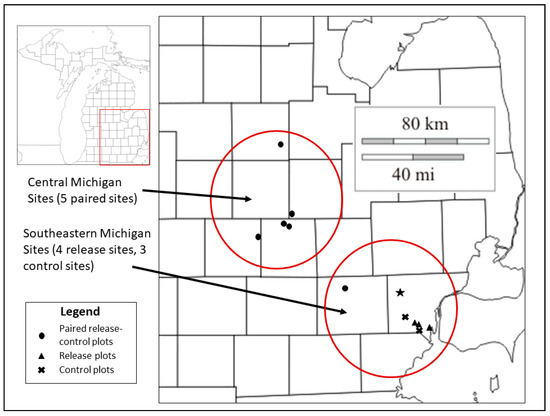
Figure 1.
Location of study sites in two regions of southern Michigan where ash health data collection occurred in 2012 and 2015. Central Michigan sites include five paired release and control plots with parasitoid releases from 2007 to 2010; southeastern Michigan sites include four release and three control plots with parasitoid releases in 2011 (Table 1, Appendix A and Appendix B). The star indicates the approximate location of the EAB introduction point in Wayne County, Michigan [44].
In central Michigan, we collected ash health data at five study sites, each consisting of a paired release and non-release control plot. Parasitoids were released between 2007 and 2010; EAB densities and overstory ash mortality peaked in 2010–2011 in this region (Appendix B) [32,34,36]. Results of annual sampling of infested ash trees at the central Michigan study sites since 2008 revealed that larval parasitism by T. planipennisi increased on average from ~1% to ~21% in release plots from 2009 to 2012, and from 0.2 to ~13% in control plots during this same period [32]. More recently, larval parasitism by T. planipennisi has spread more evenly across the control and release plots, although prevalence varies from year to year [33,36] [LSB,JJD unpublished data]. Egg parasitism by O. agrili was also detected in 2008 in release plots one year after first release, but not until 2012 in control plots. In 2012, egg parasitism averaged ~20% and ~5% in the release and control plots, respectively, and was variable between trees and sampling years [34,41] [LSB,JJD unpublished data].
In southeastern Michigan, ash health was evaluated at four release and three control plots (Figure 1) where the mortality of overstory ash had peaked in about 2007 across this region [42,43,44]. The EAB parasitoids were released in 2011 onto young ash trees, saplings, and basal sprouts, although EAB densities appeared low. In the winter of 2014–2015, ash trees were sampled for egg and larval parasitism, and the establishment and spread of T. planipennisi at both the release and control plots was confirmed [LSB, JRG unpublished data]. Larval parasitism by T. planipennisi was highly variable between sites and averaged ~26% and ~4% at release and control plots, respectively. Egg parasitism by O. agrili was confirmed at one release plot (Lake Erie Metropark) at a rate of ~6% [LSB, JRG unpublished data].
At each site, ash health and regeneration data were collected in 400 × 400 m release and control plots, each subdivided into 50-m2 grid cells, which allowed for a spatial reference of sampling in relation to parasitoid-release epicenter trees [30]. In 2012, 25 live ash trees >4 cm DBH (hereafter called “large trees”) were randomly selected beginning near the center of the 400 m2 grid. Trees were measured, permanently numbered with aluminum tags, and georeferenced with a GPS unit for re-measurement and assessment in subsequent sampling years. Live ash trees were identified to species and their DBH measured. Evidence of EAB attack in live ash trees was assessed using the identification of external symptoms, including EAB exit holes, epicormic sprouting, bark splitting, and woodpecker feeding [30,45]. Crown dieback and crown class were evaluated using a five-class categorical scale where 1 is a healthy tree and 5 is a dead tree [45]. This process was repeated for 25 sub-canopy trees and saplings 2.5–4.0 cm DBH (hereafter called “small trees”). Ash regeneration (all living ash <2.5 cm DBH or shorter than breast height) was sampled along two perpendicular belt transects that intersected the center point of the grid; transect length varied across sample plots but included a minimum of 300 m of total transect length at all plots. Ash regeneration was tallied into three height classes (<0.5 m, 0.5–1 m, >1 m) that served as a proxy for seedling/sapling age and potential for recruitment into the canopy [42]. Sampling was conducted at all sites in 2012 and then repeated in 2015.
2.2. Data Analysis
All data were pooled by region (central Michigan and southeastern Michigan, Figure 1) for analysis to coincide with parasitoid release dates and presumed effects on ash tree health and regeneration. Site was the experimental unit within each region (n = 5 in central Michigan; n = 4 in southeastern Michigan). Four of the five central Michigan study sites had parasitoid releases beginning in 2007, 2008, or 2009, three to five years prior to sampling; parasitoid releases occurred in 2010 in the fifth central Michigan site (Rose Lake; Table 1). Parasitoid establishment was confirmed at all central Michigan sites by 2012, and the spread of both T. planipennisi and O. agrili into control plots was observed by 2015 [32,33]. The southeastern Michigan sites included three control plots and four release plots (Lower Huron Metropark served as the control plot for both Willow Metropark North and Willow Metropark South release plots). Parasitoids were released at all southeastern Michigan plots in 2011, the year prior to initial sampling, and thus data sampled in southeastern Michigan in 2012 are probably more representative of pre-release conditions because parasitoid establishment was likely low or absent. This experimental design allowed us to make relevant comparisons between release and control plots in each year of sampling (2012 and 2015), but also within release and control plots across sample years (e.g., release plots in 2012 vs. 2015, control plots in 2012 vs. 2015). Therefore, we were able to directly examine the effect of the treatment (parasitoid release and establishment) each sample year. We were also able to examine changes in ash health and regeneration over a three-year period using time as the effect.

Table 1.
EAB biological control study sites in southern Lower Michigan.
Statistical analyses were conducted using IBM SPSS statistics version 23 [46]. All data were examined for normality and equal variances and analyzed using α = 0.05. Diameters of large trees (>4.0 cm DBH) and small trees (2.5–4.0 cm DBH) could not be normalized; differences in tree diameters between release and control plots within and among sample years were therefore analyzed with the nonparametric Wilcoxon ranked sign test. Counts of trees dying between sample years were compared for release and control plots using a chi-square test for heterogeneity. We compared changes in the health of large and small trees using crown condition class ratings and the presence of other EAB symptoms. Crown class ratings were ordinal data and were thus analyzed with a nonparametric Kruskal-Wallis test. When significant differences were found, pairwise comparisons were made with the Mann Whitney U test with a Bonferroni correction. We analyzed differences in the proportion of sampled living large and small trees exhibiting signs of EAB infestation using a chi-square test for heterogeneity. Seedling counts within belt transects were converted to density (stems/ha) and analyzed separately for each height class. Density values for seedlings <0.5 m were transformed using the formula [square root (x + 0.5)] to correct for normality and unequal variances and analyzed with a paired sample t-test. Density values for seedlings 0.5–1 m and >1 m could not be normalized, and were analyzed using a Wilcoxon signed rank test.
3. Results
3.1. Ash Tree Diameters and Mortality
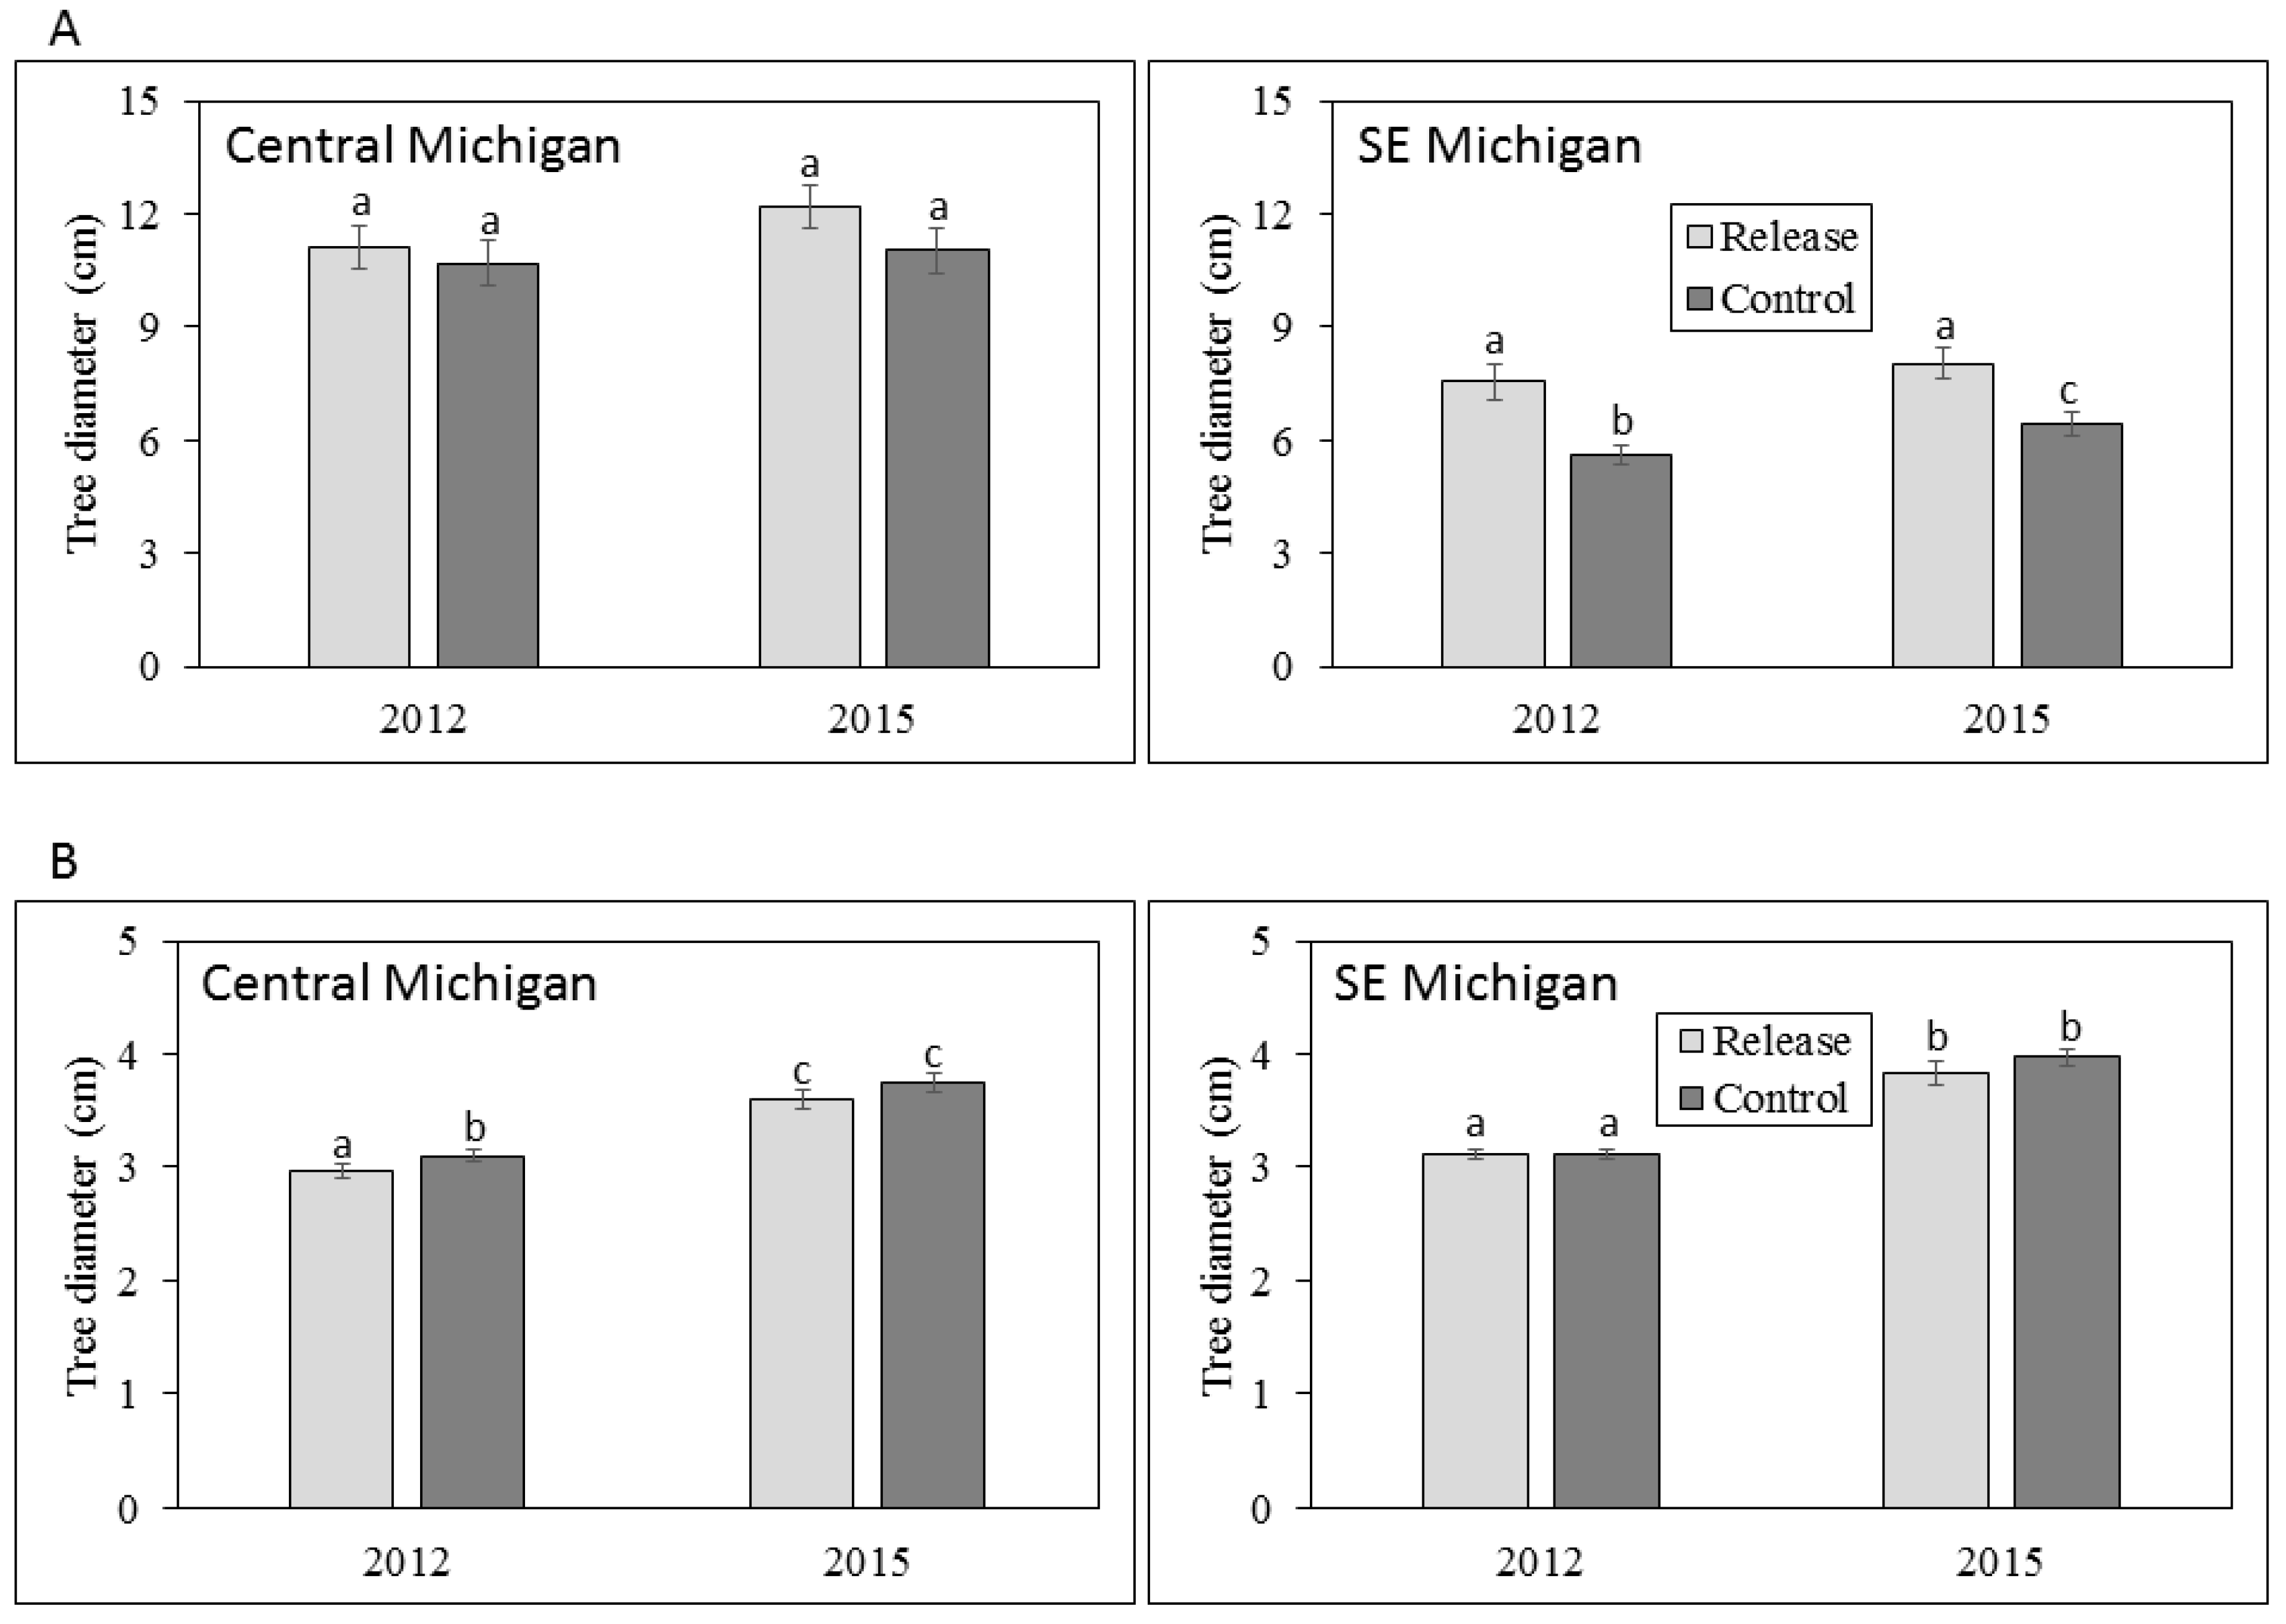
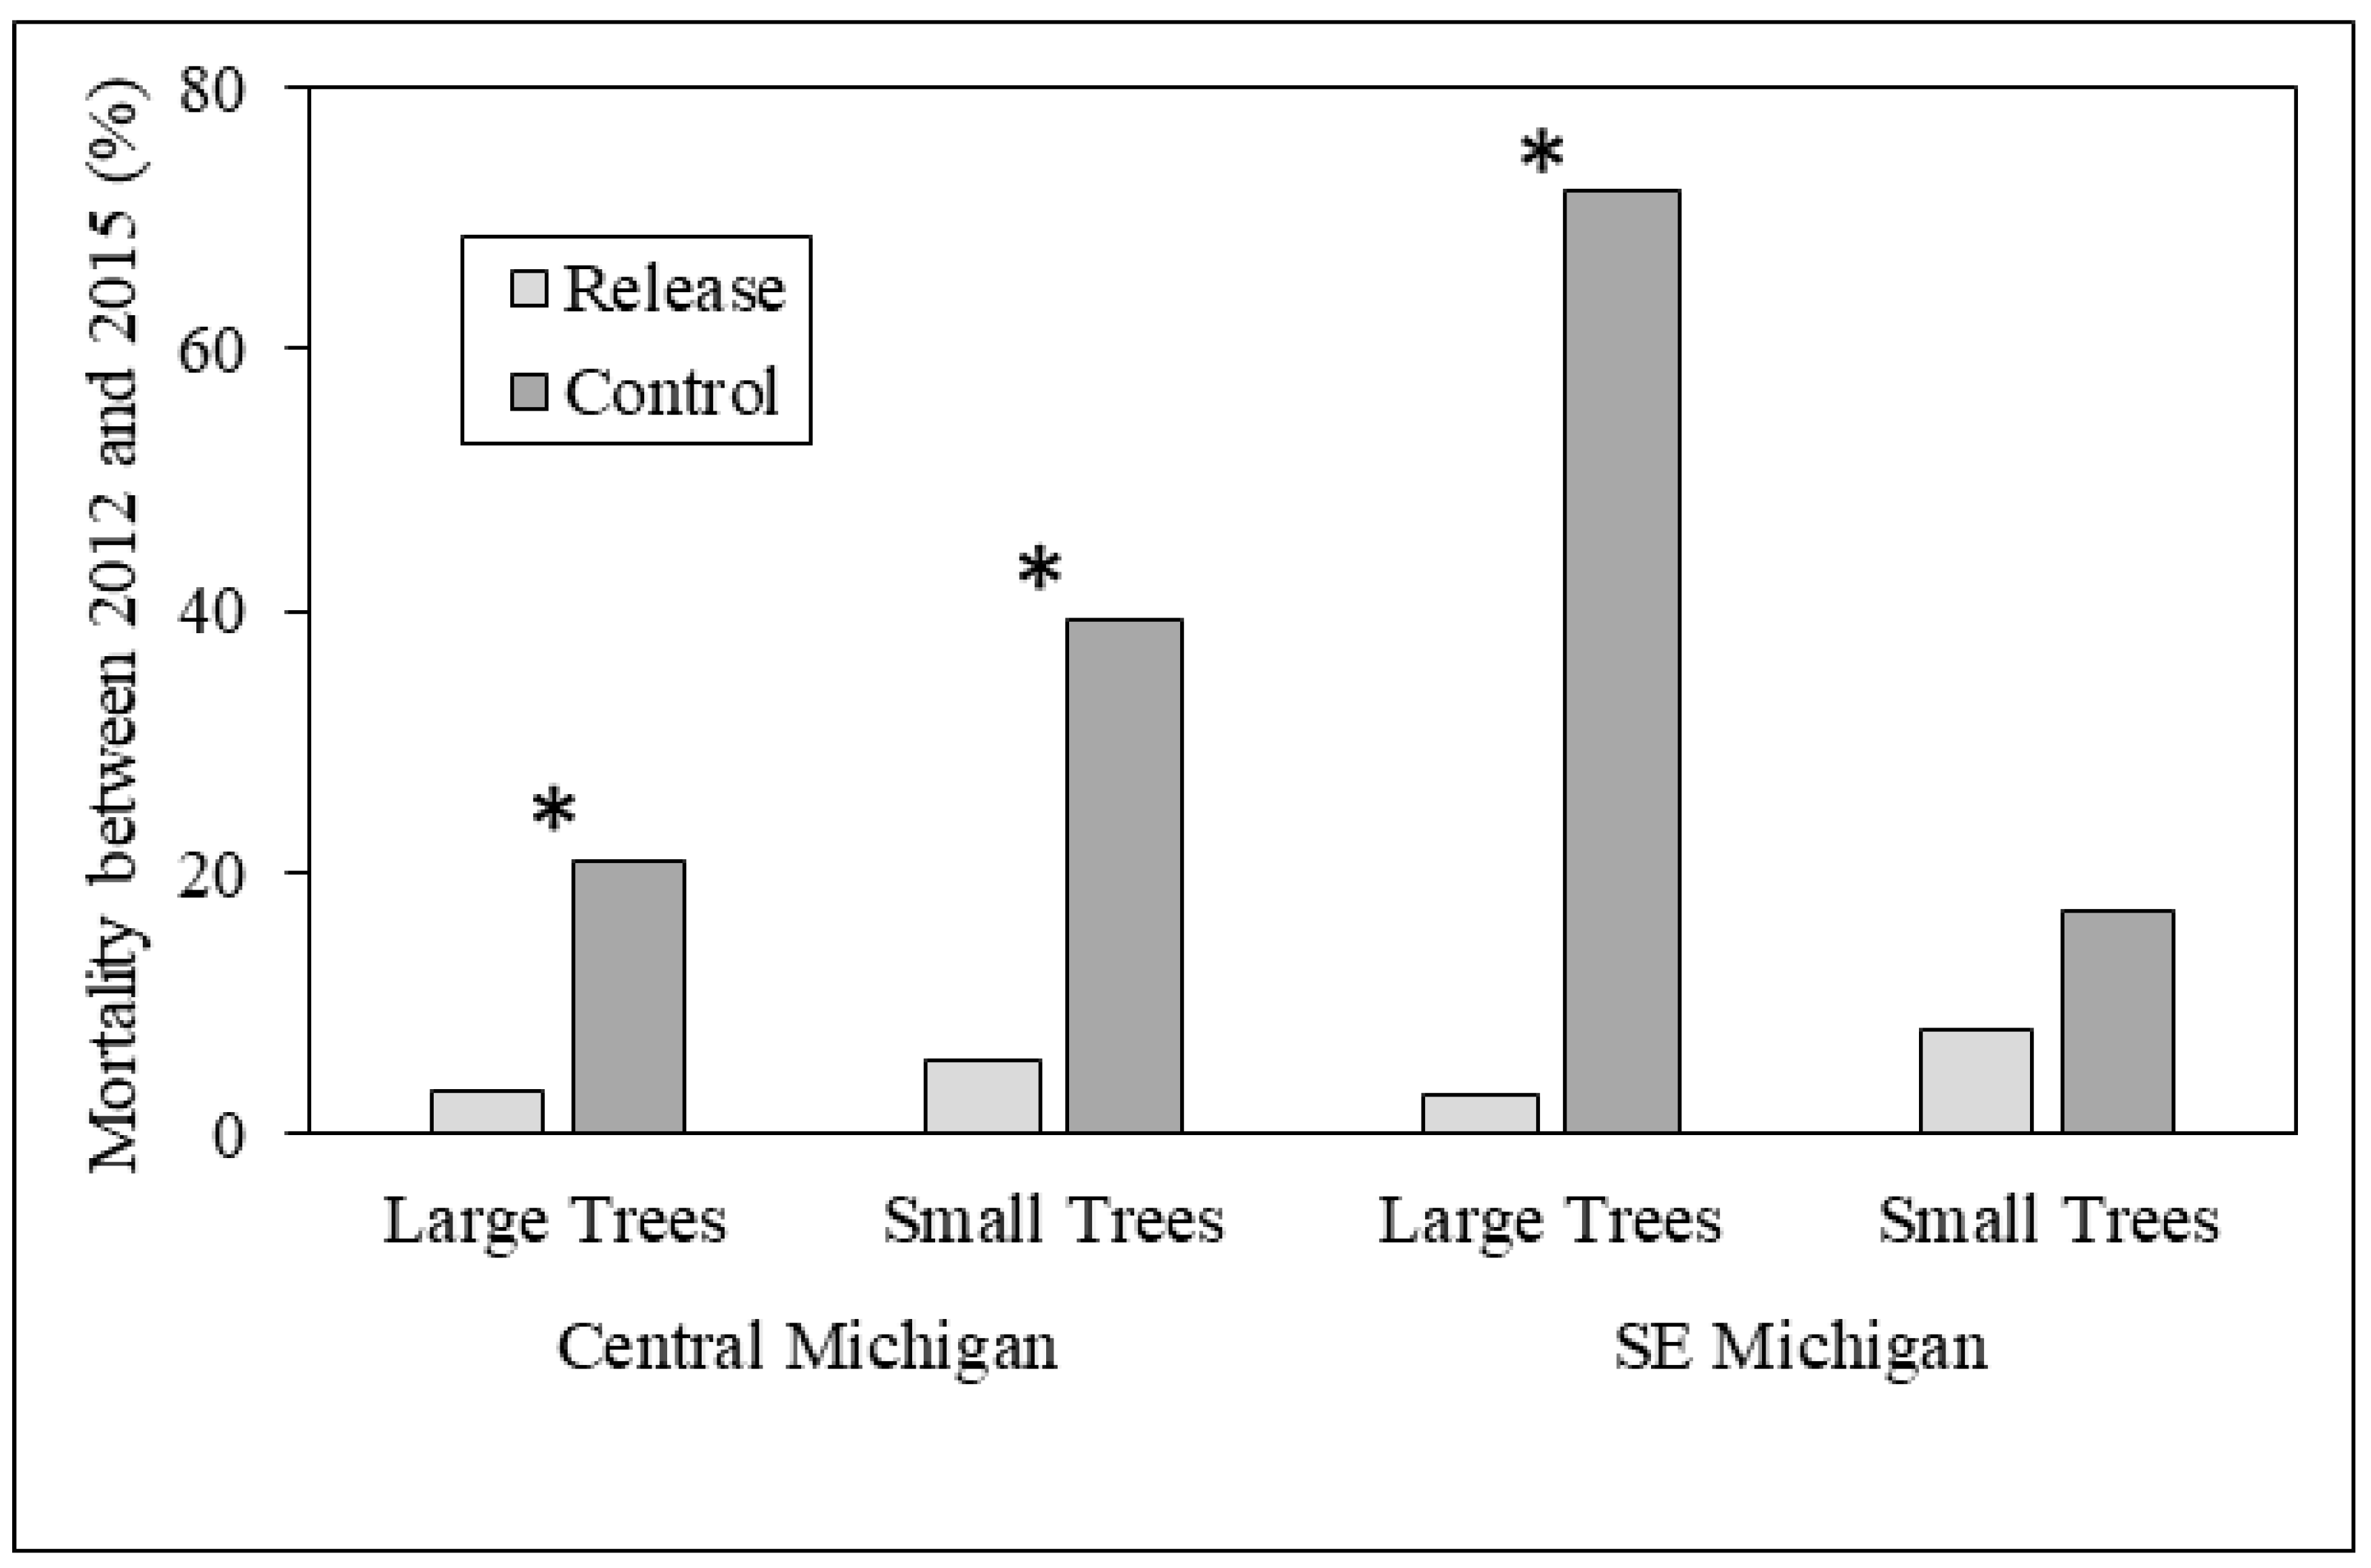
In the central Michigan sites, where parasitoids were released from 2007 to 2010, the mean diameter of living large trees did not differ between release and control plots in either 2012 or 2015; large tree diameter also did not differ within release or control plots among years (Figure 2). However, a higher proportion of large trees in control plots (20.8%) died between 2012 and 2015 than in release plots (3.2%; χ2 = 18.3, p < 0.001) (Figure 3). Mean diameter of small trees (2.5–4.0 cm DBH) was higher in control plots (3.1 cm) in 2012 compared to release plots (2.9 cm; Z = 2886.5, p < 0.001). The mean diameter of small trees was higher in 2015 than 2012 for both release plots (3.6 vs. 2.9 cm; Z = 3371, p < 0.001) and for control plots (3.8 vs. 3.1 cm; Z = 3257.5, p < 0.001), consistent with expected small tree growth over the three-year sampling period (Figure 2). The proportion of small trees that died between 2012 and 2015 was higher in control plots (Figure 3), and this difference was nearly significant (p = 0.058).
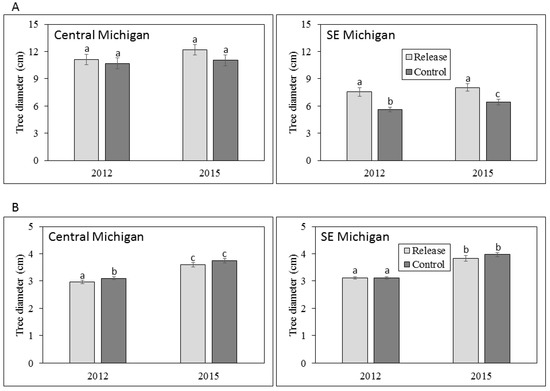
Figure 2.
Mean tree diameters at breast height (DBH) for (A) large trees >4.0 cm DBH and (B) small trees 2.5–4.0 cm DBH in central and southeastern Michigan in 2012 and 2015. Error bars represent ± 1 SE. Mean values with the same letter are not significantly different.

Figure 3.
Tree mortality between 2012 and 2015 in release and control plots in central and southeastern Michigan study sites. Differences between release and control plots were significant for large trees in both central and southeastern Michigan (p < 0.001 for both), and were nearly significant (p = 0.058) in central Michigan for small trees. Asterisks indicate significantly different comparisons between release and control plots.
In southeastern Michigan, where parasitoid releases occurred in 2011, mean large tree diameter was higher in release sites compared to control sites in both 2012 (7.6 vs. 5.6 cm; Z = 1165.5, p = 0.016) and in 2015 (8.0 vs. 6.4 cm; Z = 431.5, p = 0.019). In addition, mean large tree diameter was higher in 2015 than in 2012 for control sites (6.4 vs. 5.6 cm; Z = 63, p < 0.001) but not release sites. A much greater proportion of large trees died between 2012 and 2015 in control plots (72%) vs. release plots (3%; χ2 = 92.9, p < 0.001) (Figure 3). Mean diameter of small trees did not differ between release and control sites, but similar to that of large trees, mean diameter was higher in 2015 than in 2012 for both release sites (3.8 vs. 3.1 cm; Z = 287.5, p < 0.001) and control sites (4.0 vs. 3.1 cm; Z = 2239, p < 0.001; Figure 2). The proportion of small trees that died between 2012 and 2015 did not differ between release and control plots (Figure 3).
3.2. Ash Tree Health
In central Michigan, large tree crown class ratings did not differ between release and control sites in either 2012 or 2015 (Table 2). However, the crown condition for large trees worsened significantly from 2012 to 2015 in both release (2.6 to 3.5; U = 3017, p < 0.001) and control plots (2.3 to 3.3; U = 2625, p < 0.001), despite the recently established parasitoids.
Table 2.
Mean (±1 SE) crown condition ratings for large and small trees in release and control plots in central and southeastern Michigan in 2012 and 2015. Crown condition ratings range from “1” for a healthy tree to “5” for a dead tree.
Other symptoms of EAB infestation (EAB exit holes, epicormic sprouting, bark splitting, and/or woodpecker feeding) were found on a higher proportion of large trees in the release plots compared to the control plots in 2012 (86.4 vs. 72.8%; χ2 = 7.12, p = 0.007) but not in 2015 (Table 3). EAB symptoms were found on a higher percentage of large trees in 2015 compared to 2012 in both release plots (97.5 vs. 86.4%; χ2 = 10.18, p = 0.001) and control plots (94.9 vs. 72.8%; χ2 = 18.8, p < 0.001), consistent with our expectation that EAB infestation would continue over the three-year study period. Similar to that of large trees, the crown class rating of small trees did not differ between release and control plots in 2012 or 2015 (Table 2).
Table 3.
Mean proportions of trees exhibiting symptoms of EAB infestation (see text for explanation) for large and small trees in release and control plots in central and southeastern Michigan in 2012 and 2015. Differing superscripts (letters for large trees and numbers for small trees) represent significant differences at α = 0.05.
Small tree crown class rating worsened between 2012 and 2015 for both release (1.5 to 2.3; U = 4252.5, p < 0.001) and control plots (1.4 to 2.1; U = 3292.5, p < 0.001). The proportion of small trees exhibiting EAB symptoms did not differ between release and control plots in central Michigan in 2012, but was higher in control plots in 2015 (89.5 vs. 74.6, χ2 = 6.5, p = 0.01; Table 3). The proportion of infested trees increased between 2012 and 2015 for both release plots (48.8 to 74.6%; χ2 = 17.0, p < 0.001) and control plots (37.6 to 89.5%; χ2 = 52.0, p < 0.001).
In southeastern Michigan, trends in ash tree health were similar to those in central Michigan. Large tree crown class ratings did not differ between release and control plots in southeastern Michigan in either 2012 or 2015 (Table 2). Large tree crown condition declined from 2012 to 2015 in both release (1.8 to 3.5, U = 2209.5, p < 0.001) and control plots (1.9 to 2.7, U = 894, p < 0.001). Symptoms of EAB infestation were found on a higher proportion of large trees in the release plots (85%) compared to the control plots (70.7%) in 2012 (χ2 = 5.28, p = 0.02), but not in 2015 (Table 3). EAB symptoms were found on a higher proportion of large trees in 2015 compared to 2012 in control plots (χ2 = 16.2; p < 0.001), but not in release plots. Small tree crown class rating was lower in release plots (3.2) compared to control plots (2.7) in 2015 (U = 2223.5, p = 0.15) but did not differ in 2012 (Table 2). Similar to large trees, crown class rating for small trees declined from 2012 to 2015 for both control plots (1.9 to 2.7, U = 1635, p < 0.001) and release plots (1.8 to 3.2, U = 1671.5, p < 0.001). The proportion of small trees with EAB symptoms did not differ between release and control plots in 2012 or 2015 (Table 3), but the proportion of infested trees increased between 2012 and 2015 for both release plots (61 to 84.3%; χ2 = 12.1, p < 0.001) and control plots (50.7 to 85.5%; χ2 = 19.8, p < 0.001).
3.3. Ash Regeneration
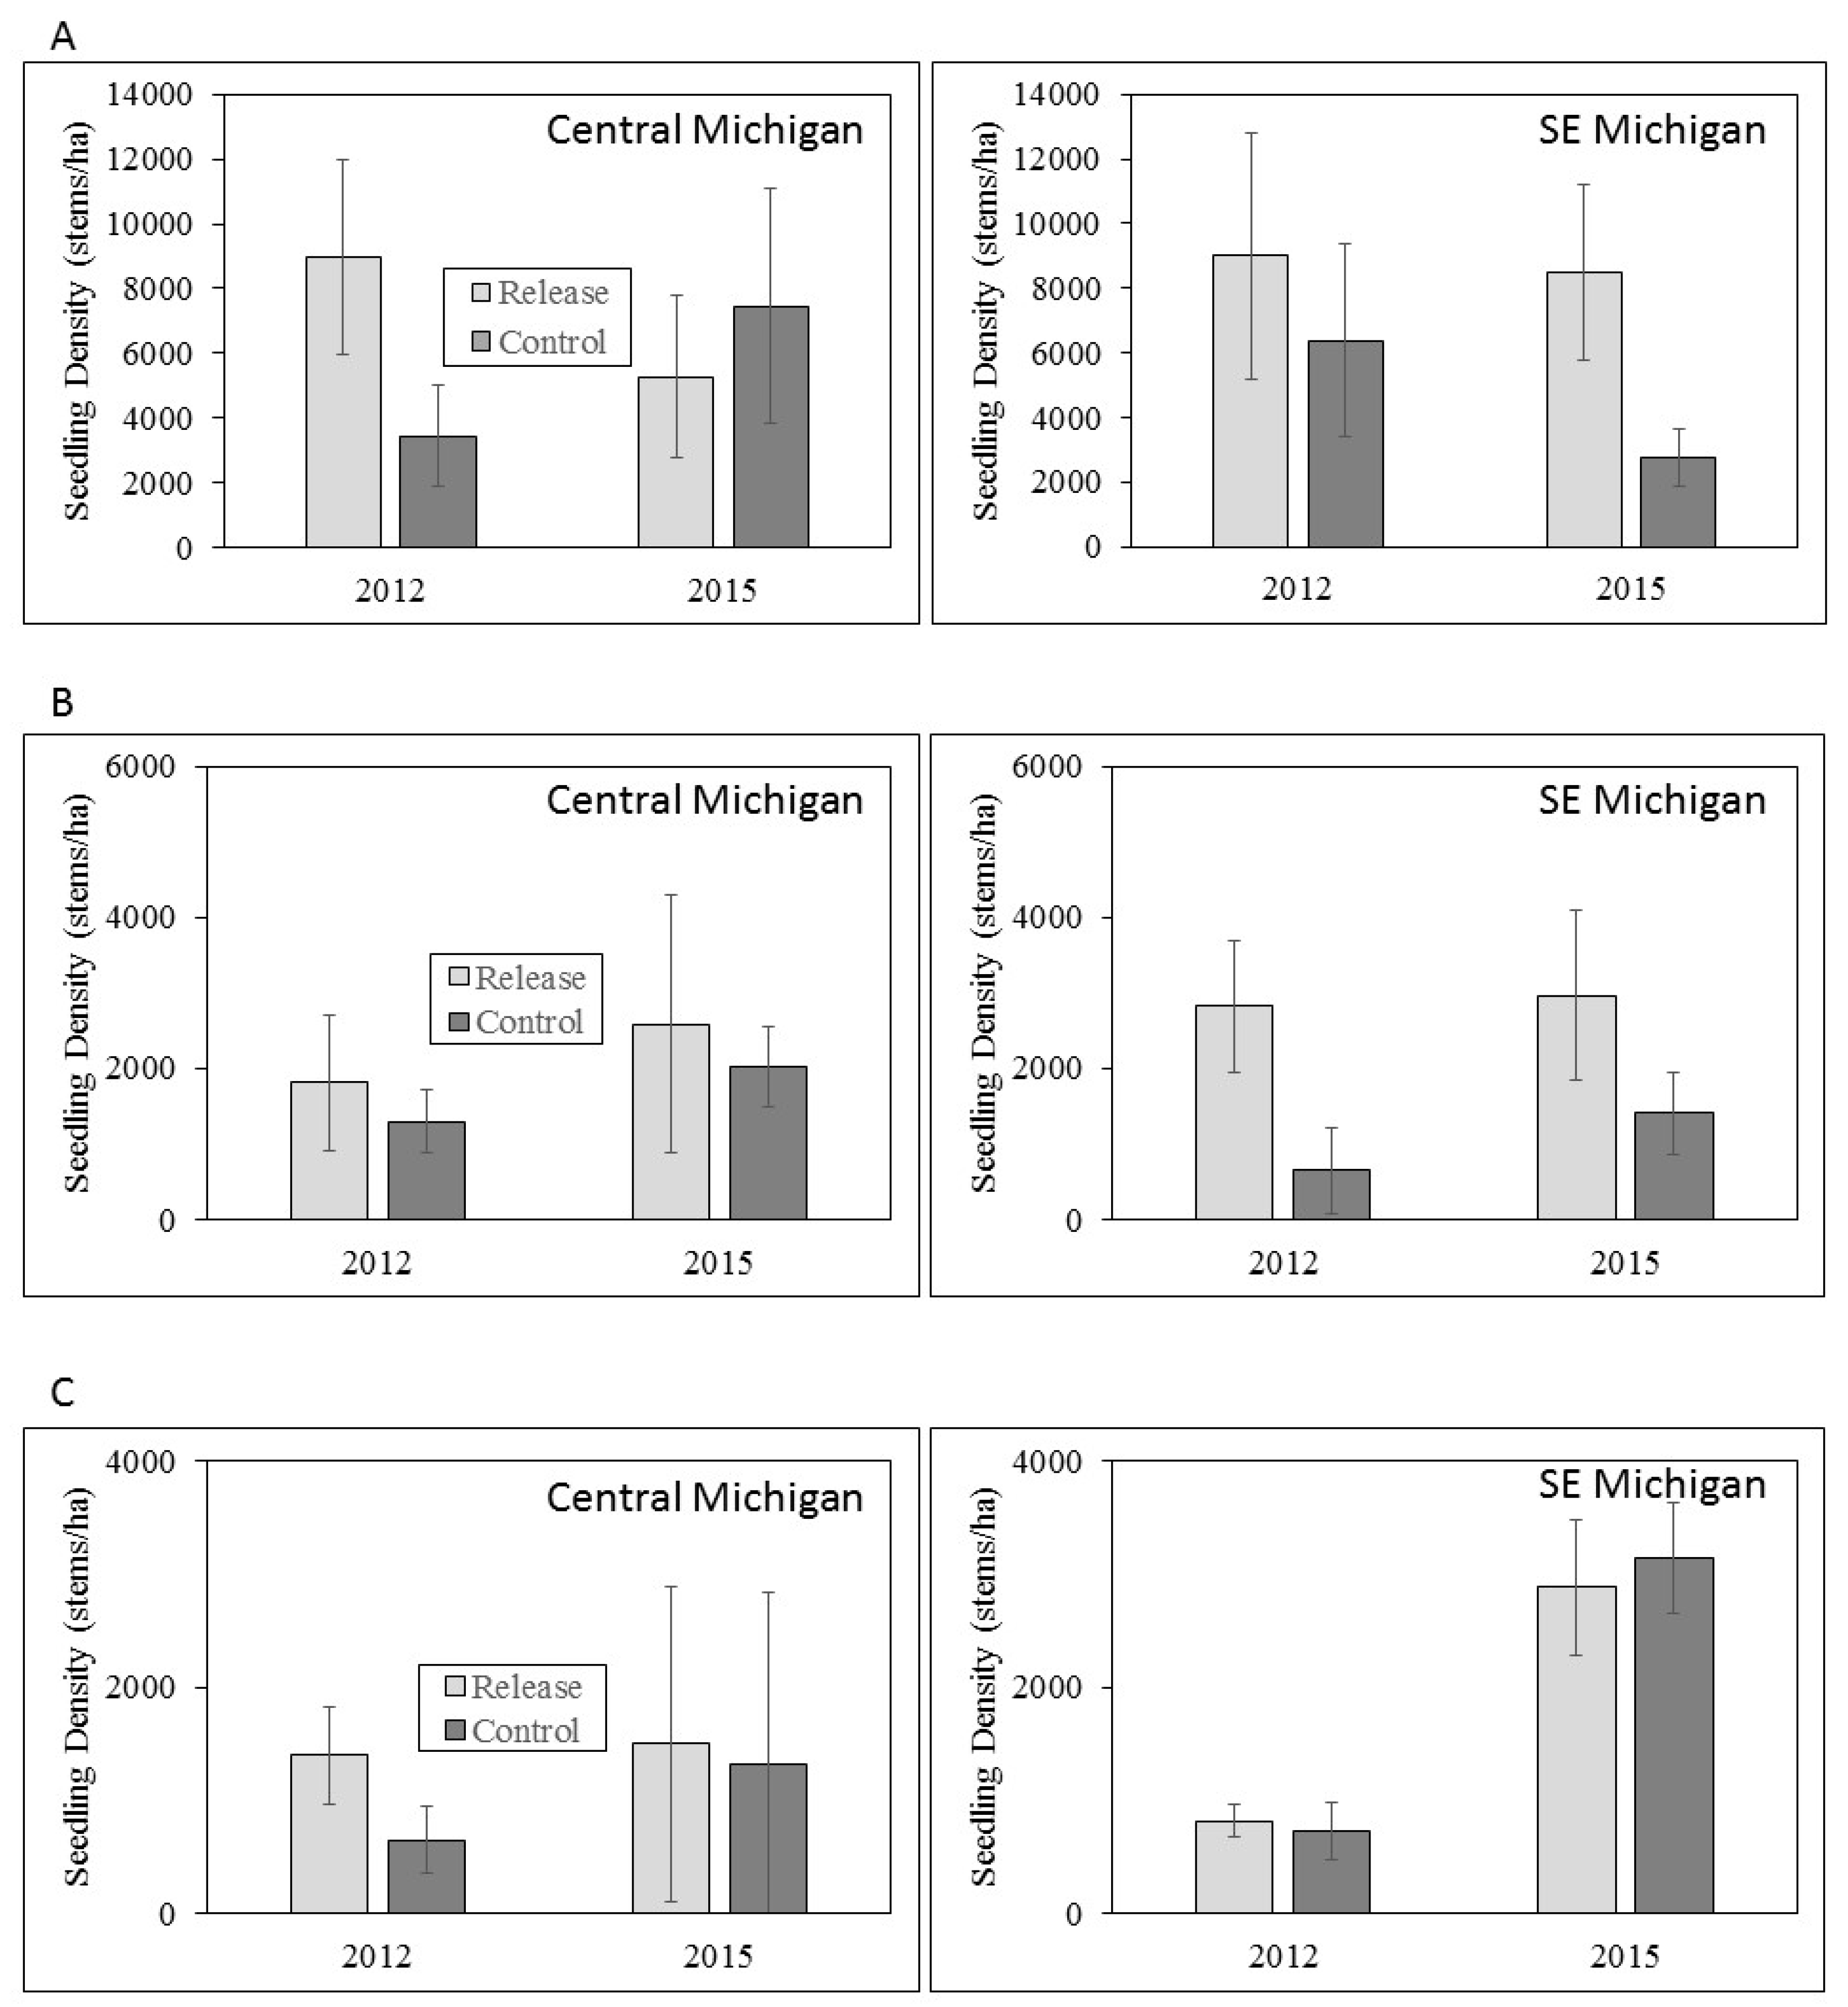
We found no differences in the densities of ash seedlings and saplings of any height class between release and control sites in either year of sampling, or among sample years. Extremely variable seedling densities among sites and years created high standard errors that led to a lack of statistical significance given the sample sizes available within our experimental design. Notably, however, seedling densities were consistently higher in release plots compared to the control plots, with two exceptions in the twelve comparisons (seedlings <0.5 m tall in central Michigan, and seedlings >1 m tall in southeastern Michigan; Figure 4). Seedlings were less abundant in successively taller size height classes in both central and southeastern Michigan, but did not show consistent trends across sample years (Figure 4).
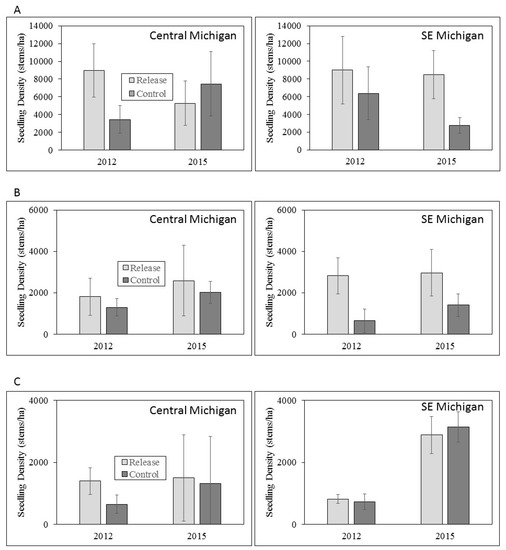
Figure 4.
Mean seedling densities for (A) seedlings <0.5 m tall; (B) seedlings 0.5 – 1.0 m tall; and (C) >1 m tall in central and southeastern Michigan in 2012 and 2015. Error bars represent ± 1 SE. Note differences in scale of Y axis among seedling height classes.
4. Discussion
The introduction and establishment of insect biocontrol agents requires monitoring and documenting impacts of the new natural enemy on the target pest. However, a comprehensive understanding of the subsequent changes in the impacts of the target pest on the host plant is critical for determining the future viability of the vegetation [24]. In the case of EAB, ash trees survive for about five years after infestation [38], whereas the lag time for parasitoid establishment and population increase is considerably longer. Thus it remains difficult to precisely assess the impacts of EAB biocontrol on ash populations. Moreover, up to 99% of the overstory ash trees were killed by high EAB population densities in southeastern Michigan by 2009 [43]. This widespread loss of most EAB host ash trees, as well as predation of EAB larvae by woodpeckers and some native parasitoids [23,33], resulted in the collapse of EAB populations below a density threshold that is currently favoring the survival and growth of small ash trees, basal sprouts, saplings, and seedlings [33,43,47]. Parasitoids introduced as part of biological control programs should therefore be effective in supporting the survival of sub-canopy and regenerating ash [36,37]. As such, long-term studies that assess and monitor the survival, growth, and density of ash at all its life stages are necessary to understand the potential for ash in North America to persist in the presence of EAB.
4.1. Ash Diameter and Health
Our work provided very mixed results in terms of the potential impacts of the EAB biocontrol on ash diameter and health. Optimally, impacts of biological control would result in the survival of both larger and smaller trees, and maintain the health of living ash trees (this would have been indicated in our study by the relative conditions of tree crowns and the presence or absence of EAB symptoms). At the central Michigan sites, large tree diameter did not differ between release and control plots and did not appear to increase over the three-year sampling period. These data suggest that the growth of larger trees was minimal, possibly due to EAB infestation. Small trees in central Michigan grew to larger diameters over the three years of the study, but were larger in control plots than release plots. Moreover, crown condition declined on large trees between 2012 and 2015 in both release and control plots, and parasitoid releases did not appear to reduce the evidence of EAB infestation.
Results were more similar to our expectations in southeastern Michigan, where both large and small trees exhibited significant diameter growth over the three-year period, and large tree diameter was higher in release compared to control plots in both 2012 and 2015 (Figure 2). Stronger evidence of biocontrol effects in southeastern Michigan was somewhat unexpected because parasitoid releases occurred in 2011, only the year before initial sampling. These observed differences in southeastern Michigan by 2015 may be explained by the high prevalence of T. planipennisi in the release plots compared to the control plots, and O. agrili had not spread beyond the release plots. In central Michigan, however, differences in ash growth between release to the control plots were not found because both T. planipennisi and O. agrili had spread throughout the area by 2012 [26,32,34,41]. Perhaps the best evidence for positive biocontrol effects in our study is that fewer large trees died between 2012 and 2015 in release plots compared to control plots in both central and southeastern Michigan. Our sampling was not done on an annual basis, and thus we are unable to document the timing of large tree death between 2012 and 2015 or to ascertain whether parasitoid establishment was directly correlated to reduced tree mortality, but the three-year trends are promising. Although tree diameter impacts are difficult to ascertain in a three-year study, trends in biocontrol impacts on ash diameters appear to be mixed at best.
4.2. Ash Regeneration
Our experimental design was insufficient to detect statistical differences in ash regeneration, but we expected that the survival and improved health of mature ash trees due to EAB biocontrol, if present, should increase ash seed rain such that biocontrol should indirectly increase the densities of seedlings and saplings [47]. We highlight that despite high standard errors, seedling densities were substantially higher in release plots compared to controls for most height classes in both central and southeastern Michigan. Given the lack of significant improvement of ash tree health or survival at our study sites, these trends support the conclusions of other researchers that ash seedlings and saplings are likely protected by the establishment of T. planipennisi [36,37]. In this context, EAB biocontrol agents may have a direct positive effect on ash sapling and seedling survival. Assuming that at least some of the ash regeneration and small trees at our study sites will grow to diameters >16 cm, when their bark becomes too thick for T. planipennisi to reach EAB larvae feeding in the phloem [35], expanded releases of S. galinae are warranted because they can attack EAB larvae in ash trees up to ~57 cm DBH [48]. We also note that browsing pressure by deer in both regions is likely to have a confounding effect on ash regeneration data in this and other studies [49]. Deer browsing appears to be especially prevalent in central Michigan (LSB, pers. observ) compared to southeastern Michigan [42], and could have important implications for ash persistence [49].
4.3. Future Research
The premise of EAB biocontrol is that the introduced parasitoids, once established, will work together with other biotic and abiotic mortality factors to maintain the EAB population below a threshold level such that at least some small ash trees and regeneration will be able to recruit to the overstory, thus maintaining a seed source and allowing ash to persist. Several studies have documented the persistence of blue ash (F. quadrangulata Michx.) [11,12], green ash [47], and white ash [12] in small populations in southeastern Michigan, not necessarily in the proximity of EAB parasitoid releases. Thus if even only partially successful, EAB biocontrol may have an important impact on ash persistence in an area where EAB populations have peaked and declined. Studies that document the degree of success of EAB biocontrol, therefore, are critical for predicting longer-term EAB impacts in areas where EAB populations have not yet peaked. To our knowledge, ours is the only empirical study to monitor ash health at all ash life stages as an attempt to directly assess the effects of classic biological control on the ash component of forests within the current range of EAB.
Despite the presence of some strong trends that suggest a positive impact of biocontrol on ash persistence both in the literature [36,37] and in our study, we suggest that it remains too soon to assess the effect of biocontrol on ash health and regeneration. The temporal scale of forest monitoring studies in general is longer than three years, given the life span of trees and their rates of growth and mortality. Particularly with ash responses to EAB, for example, a three-year monitoring study would be unable to capture trends in basal sprouting from killed ash trees, which has been shown to be an important vector of post-EAB ash persistence following a significant lag time before sprouts are observable [47]. Monitoring studies should also be long enough to capture the temporal dynamics of established parasitoids and EAB populations in the presence of the parasitoids, which a three-year study is unlikely to do. Moreover, we caution that our study lacks the pre-release vegetation data necessary to make short-term conclusions about the effects of EAB biocontrol on ash health and regeneration. Long-term studies of vegetation responses to biocontrol programs would reduce the importance of pre-release data once trends in the data become evident. Until that time and without pre-release data for comparison, our short-term results should be considered preliminary.
Finally, we emphasize that despite the susceptibility of all North American ash species to EAB, studies that document and monitor the response of ash to a biocontrol should be careful to examine ash response on a species-by-species basis. Our study examines green and white ash, which themselves have very different life history traits and are likely to respond quite differently to EAB [47] and thus EAB biocontrol in the long term. Other species of ash in the region, including black ash (F. nigra Marsh.) and pumpkin ash (F. profunda (Bush) Bush), are rarer in southern Michigan and were not sampled. Black ash is of significant concern, both for its cultural significance [50] and its dominance in other geographical regions [51], but both its site-species relationships and its life history traits differ from the other species to the extent that the effect of EAB biocontrol may also differ, and thus future EAB biocontrol research and monitoring should target this important species of Fraxinus.
5. Conclusions
Our data suggest that EAB biocontrol in southern Michigan is likely to have a positive effect on ash populations. Trends in our data that suggest the establishment of EAB parasitoids may reduce the death of large ash trees are promising, though inconsistent. Similarly, higher densities of ash regeneration in most release plots suggests that EAB biocontrol and its presumed protection of ash seedlings and saplings may provide an important avenue for future ash recruitment into the canopy. In either case, however, the study duration is currently too short to definitively deduce the long-term success of EAB biocontrol in this region, and additional data collection over a longer time period is therefore critical for EAB and ash management in other regions.
Author Contributions
D.M.K. and L.S.B. conceived and designed the study; D.M.K., L.S.B., B.A.S., J.J.D., and J.R.G. collected and analyzed the data; D.M.K. and L.S.B. wrote the paper.
Acknowledgments
This work was supported by USDA Forest Service Joint Venture Agreement 12-JV-11242303-053 and the Department of Biological Sciences at Wayne State University. We gratefully acknowledge the hard work by our field crews in 2012 and 2015, which included Jake Dombrowski, Dana Sugar, Clare Surmont, and Vanessa Verstraete; and we especially wish to acknowledge Doug Putt, who was instrumental in leading the 2015 field crew and entering all of the data (Wayne State University, Detroit, MI, USA). We also thank Deborah Miller (USDA FS NRS, Lansing, MI, USA) and Jonathan Lelito (USDA APHIS PPQ, Brighton, MI, USA) for providing many of the EAB parasitoids released at these study sites; Benjamin Sorensen (USDA APHIS CPHST, Brighton, MI USA) for help with parasitoid recovery in southeast Michigan; Kim Hoelmer (USDA ARS, Newark, DE, USA) and Noah Koller (USDA ARS, E. Lansing, MI, USA) for helpful reviews of this manuscript; and lastly, the tremendous encouragement and support provided by the late Kurt Gottschalk, USDA FS NRS Research Leader. We also thank the Michigan Department of Natural Resources, Meridian Township, Ingham County, and Clinton-Huron Metroparks for long-term use of the lands used in this study.
Conflicts of Interest
The authors declare no conflict of interest. The founding sponsors had no role in the design of the study; in the collection, analyses, or interpretation of data; in the writing of the manuscript, and in the decision to publish the results.
Appendix A
Table A1.
Dominant overstory vegetation at study sites in central and southeastern Michigan. Ash relative dominance was measured at the time of sampling (i.e., after EAB-caused ash mortality occurred).
Table A1.
Dominant overstory vegetation at study sites in central and southeastern Michigan. Ash relative dominance was measured at the time of sampling (i.e., after EAB-caused ash mortality occurred).
| Site Name * | Release-Plot Codes ** | Treatment *** | Ash Relative Dominance (%) | Dominant Overstory Tree Species |
|---|---|---|---|---|
| Central Michigan | ||||
| Central Park | CPNMLT | Release | 3.7 | American elm, boxelder |
| Control | 8.3 | American elm | ||
| Legg Park | LPRFLT | Release | 2.3 | Silver maple, American elm, hackberry |
| Control | 1.0 | Silver maple, sycamore, American elm | ||
| Burchfield | BFPKLT | Release | 3.8 | Silver maple, American elm |
| Control | 3.8 | Silver maple, American elm | ||
| Gratiot-Saginaw | GSW | Release | 2.1 | Red maple, red oak |
| Control | 1.9 | Red maple, red oak | ||
| Rose Lake | RL | Release | 1.7 | Red maple, basswood, American elm |
| Control | 1.1 | Red maple, black cherry, American elm | ||
| Southeastern Michigan | ||||
| Lake Erie | LKEMP | Release | 0.1 | American elm, silver maple |
| Oakwoods | Control | 0.1 | Red maple, American elm, shagbark hickory | |
| Pinckney | PNKSL | Release | 0.1 | Red oak, red maple |
| Control | 0.1 | Red oak, red maple | ||
| Willow North | WMPKN | Release | 0.1 | American elm |
| Willow South | WMPKS | Release | 4.0 | Eastern cottonwood |
| Lower Huron | Control | 0.1 | Silver maple, American elm | |
* See Table 1 and Appendix B for more information on locations. ** Codes used for release plots in Mapbiocontrol.org [31]. *** See Appendix B for more information on parasitoid releases.
Appendix B
Table A2.
Summary of adult O. agrili and T. planipennisi females released at the study release plots in central and southeastern Michigan.
Table A2.
Summary of adult O. agrili and T. planipennisi females released at the study release plots in central and southeastern Michigan.
| Site Codes | Year | O. agrili Released | T. planipennisi Released | ||||
|---|---|---|---|---|---|---|---|
| Month(s) | Total N (Females) | No. of Releases | Month(s) | Total N (Females) | No. of Releases | ||
| Central Michigan * | |||||||
| CPNMLT | 2007 | August | 700 | 6 | September–October | 870 | 3 |
| 2008 | June–August | 330 | 4 | June | 150 | 1 | |
| 2009 | June | 300 | 1 | June–October | 3000 | 9 | |
| LPRFLT | 2008 | July | 200 | 2 | September–October | 200 | 5 |
| 2009 | June | 300 | 1 | May–September | 3250 | 10 | |
| BFPKLT | 2008 | July–August | 200 | 2 | July | 110 | 1 |
| 2009 | June | 300 | 1 | May–September | 3200 | 9 | |
| GSW | 2009 | August | 375 | 1 | August–September | 700 | 2 |
| 2010 | June–July | 1110 | 2 | June–September | 3290 | 6 | |
| RL | 2010 | July | 1160 | 2 | June–September | 3880 | 7 |
| SE Michigan ** | |||||||
| LKEMP | 2011 | June | 240 | 1 | June | 1740 | 3 |
| PNKSL | 2011 | July–Aug | 300 | 3 | July | 710 | 2 |
| WMPKN | 2011 | June–July | 180 | 2 | June–July | 1830 | 2 |
| WMPKS | 2011 | June–July | 160 | 2 | June–July | 400 | 2 |
* Site codes for data reported in MapBiocontrol.org [31] and earlier publications [32,33,34,35,36,37,41]: CPNMLT (Central-Nancy Moore Parks) and LPRFLT (Legg Park-River Front Parks), Meridian Township Parks, Ingham County, Okemos, MI; BFPKLT (Burchfield Park), Ingham County Parks, Holt, MI; GSW (Gratiot-Saginaw State Game Area), Michigan Department of Natural Resources, Gratiot County, Ashley, MI; RL (Rose Lake State Wildlife Area), Michigan Department of Natural Resources, Shiawassee County, Bath, MI. ** Site codes for data in MapBiocontrol.org [31]: LKEMP (Lake Erie Metropark), Wayne County, Brownstown, MI; PNKSL (Pinckney Recreation Area), Washtenaw County, Pinckney, MI; WMPKN and WMPKS (Willow Metropark), Wayne County, New Boston, MI.
References
- Mattson, W.; Vanhanen, H.; Veteli, T.; Sivonen, S.; Niemelä, P. Few immigrant phytophagous insects on woody plants in Europe: Legacy of the European crucible? Biol. Invasions 2007, 9, 957–974. [Google Scholar] [CrossRef]
- Liebhold, A.M.; MacDonald, W.L.; Bergdahl, D.; Mastro, V.C. Invasion by exotic forest pests: A threat to forest ecosystems. For. Sci. Monogr. 1995, 41, 1–49. [Google Scholar] [CrossRef]
- Simberloff, D. Nonindigneous species: A global threat to biodiversity and stability. In Nature and Human Society: The Quest for a Sustainable World; Raven, P., Williams, T., Eds.; National Academy Press: Washington, DC, USA, 2000; pp. 325–336. [Google Scholar]
- Aukema, J.E.; McCullough, D.G.; Von Holle, B.; Liebhold, A.M.; Britton, K.; Frankel, S.J. Historical accumulation of non-indigenous forest pests in the continental United States. BioScience 2010, 60, 886–897. [Google Scholar] [CrossRef]
- Lovett, G.M.; Weiss, M.; Liebhold, A.M.; Holmes, T.; Leung, B.; Lambert, K.F.; Orwig, D.A.; Campbell, F.T.; Rosenthal, J.; McCullough, D.G.; et al. Nonnative forest insects and pathogens in the United States: Impacts and policy options. Ecol. Soc. Am. 2016, 26, 1437–1455. [Google Scholar] [CrossRef] [PubMed]
- Kenis, M.; Hurley, B.P.; Hajek, A.E.; Cock, M.J.W. Classical biological control of insect pests of trees: Facts and figures. Biol. Invasions 2017, 19, 3401–3417. [Google Scholar] [CrossRef]
- Sadof, C.S.; Hughes, G.P.; Witte, A.R.; Peterson, D.J.; Ginzel, M.D. Tools for staging and managing emerald ash borer in the urban forest. Arboric. Urban For. 2017, 43, 15–26. [Google Scholar]
- Liebhold, A.M.; McCullough, D.G.; Blackburn, L.M.; Frankel, S.J.; Von Holle, B.; Aukema, J.E. A highly aggregated geographical distribution of forest pest invasions in the USA. Divers. Distrib. 2013, 19, 1208–1216. [Google Scholar] [CrossRef]
- Levine, J.M.; D’Antonio, C.M. Forecasting biological invasions with increasing international trade. Conserv. Biol. 2003, 17, 322–326. [Google Scholar] [CrossRef]
- Rebek, E.J.; Herms, D.A.; Smitley, D.R. Interspecific variation in resistance to emerald ash borer (Coleoptera: Buprestidae) among North American and Asian ash (Fraxinus spp.). Environ. Entomol. 2008, 37, 242–246. [Google Scholar] [CrossRef]
- Tanis, S.R.; McCullough, D.G. Differential persistence of blue ash (Fraxinus quadrangulata) and white ash (Fraxinus americana) following emerald ash borer (Agrilus planipennis) invasion. Can. J. For. Res. 2012, 42, 1542–1550. [Google Scholar] [CrossRef]
- Spei, B.A.; Kashian, D.M. Potential for persistence of blue ash in the presence of emerald ash borer in southeastern Michigan. For. Ecol. Manag. 2017, 392, 137–143. [Google Scholar] [CrossRef]
- Cappaert, D.; McCullough, D.G.; Poland, T.M.; Siegert, N.W. Emerald ash borer in North America: A research and regulatory challenge. Am. Entomol. 2005, 51, 152–165. [Google Scholar] [CrossRef]
- USDA–APHIS. Initial County EAB Detection Map. 2018. Available online: https://www.aphis.usda.gov/plant_health/plant_pest_info/emerald_ash_b/downloads/MultiState.pdf (accessed on 15 May 2018).
- Marshall, J.M.; Smith, E.L.; Mech, R. Estimates of Agrilus planipennis infestation rates and potential survival of ash. Am. Midland Nat. 2013, 169, 179–193. [Google Scholar] [CrossRef]
- Nowak, D.; Crane, D.; Stevens, J.; Walton, J. Potential Damage from Emerald Ash Borer; United States Department of Agriculture, Forest Service, Northern Research Station: Syracuse, NY, USA, 2003; pp. 1–5. Available online: https://www.nrs.fs.fed.us/disturbance/invasive_species/eab/local-resources/downloads/EAB_potential.pdf (accessed on 20 March 2018).
- Herms, D.A.; McCullough, D.G. Emerald ash borer invasion of North America: History, biology, ecology, impacts, and management. Ann. Rev. Entomol. 2014, 59, 13–30. [Google Scholar] [CrossRef] [PubMed]
- Wagner, D.L.; Todd, K.J. New ecological assessment for the emerald ash borer: A cautionary tale about unvetted host-plant literature. Am. Entomol. 2016, 62, 26–35. [Google Scholar] [CrossRef]
- Jennings, D.E.; Duan, J.J.; Bean, D.; Kimberly, A.R.; Williams, G.L.; Bells, S.K.; Shurtleff, A.S.; Shrewsbury, P.M. Effects of the emerald ash borer invasion on the community composition of arthropods associated with ash tree boles in Maryland, U.S.A. Agric. For. Entomol. 2017, 19, 122–129. [Google Scholar] [CrossRef]
- Taylor, P.B.; Duan, J.J.; Fuester, R.W.; Hoddle, M.; Van Driesche, R.G. Parasitoid Guilds of Agrilus Woodborers Coleoptera: Buprestidae: Their Diversity and Potential for Use in Biological Control. Psyche 2012, 2012, 813929. [Google Scholar]
- Liu, H.; Bauer, L.S.; Gao, R.; Zhao, T.; Petrice, T.R.; Haack, R.A. Exploratory survey for the emerald ash borer, Agrilus planipennis (Coleoptera: Buprestidae), and its natural enemies in China. Great Lakes Entomol. 2003, 36, 191–204. [Google Scholar]
- Liu, H.; Bauer, L.S.; Miller, D.L.; Zhao, T.; Gao, R.; Song, L.; Luan, Q.; Jin, R.; Gao, C. Seasonal abundance of Agrilus planipennis (Coleoptera: Buprestidae) and its natural enemies Oobius agrili (Hymenoptera: Encyrtidae) and Tetrastichus planipennisi (Hymenoptera: Eulophidae) in China. Biol. Control 2007, 42, 61–71. [Google Scholar] [CrossRef]
- Bauer, L.S.; Duan, J.J.; Gould, J.R. Emerald ash borer Agrilus planipennis Fairmaire Coleoptera: Buprestidae. In The Use of Classical Biological Control to Preserve Forests in North America; FHTET-2013-2; Van Driesche, R., Reardon, R., Eds.; United States Department of Agriculture, Forest Service, Forest Health and Technology Enterprise Team: Morgantown, WV, USA, 2014; pp. 189–209. Available online: https://www.nrs.fs.fed.us/pubs/48051 (accessed on 20 March 2018).
- Van Driesche, R.; Hoddle, M.; Center, T. Control of Pests and Weeds by Natural Enemies; Blackwell Publishing: Malden, MA, USA, 2008. [Google Scholar]
- Bauer, L.S.; Duan, J.J.; Gould, J.R.; Van Driesche, R.G. Progress in the classical biological control of Agrilus planipennis Fairmaire (Coleoptera: Buprestidae) in North America. Can. Entomol. 2015, 147, 300–317. [Google Scholar] [CrossRef]
- Duan, J.J.; Bauer, L.S.; Van Driesche, R.G.; Gould, J.G. Progress and challenges of protecting North American ash trees from the emerald ash borer using biological control. Forests 2018, 9, 142. [Google Scholar] [CrossRef]
- Wang, X.Y.; Cao, L.M.; Yang, Z.Q.; Duan, J.J.; Gould, J.R.; Bauer, L.S. Natural enemies of emerald ash borer (Coleoptera: Buprestidae) in northeast China, with notes on two species of parasitic Coleoptera. Can. Entomol. 2016, 148, 329–342. [Google Scholar] [CrossRef]
- Federal Register. Availability of an environmental assessment for the proposed release of three parasitoids for the biological control of the emerald ash borer Agrilus planipennis in the Continental United States. Fed. Regist. 2007, 72, 28947–28948. Available online: http://www.regulations.gov/#!documentDetail;D= APHIS-2007-0060-0043 (accessed on 20 March 2018).
- Federal Register. Availability of an environmental assessment for field release of the parasitoid Spathius galinae for the biological control of the emerald ash borer (Agrilus planipennis) in the contiguous United States. Fed. Regist. 2015, 80, 7827–7828. Available online: https://www.regulations.gov/docket?D=APHIS-2014-0094 (accessed on 20 March 2018).
- USDA–APHIS/ARS/FS. USDA Animal Plant Health Inspection Service/Agricultural Research Service/Forest Service. Emerald Ash Borer Biological Control Release and Recovery Guidelines. 2017. Available online: https://www.aphis.usda.gov/plant_health/plant_pest_info/emerald_ash_b/downloads/EAB-FieldRelease-Guidelines.pdf (accessed on 20 March 2018).
- MapBioControl.org. Agent Release Tracking and Data Management for Federal, State, and Researchers Releasing Biocontrol Agents for Management of the Emerald Ash Borer. 2018. Available online: http://www.mapbiocontrol.org/ (accessed on 20 March 2018).
- Duan, J.J.; Bauer, L.S.; Abell, K.J.; Lelito, J.P.; Van Driesche, R.G. Establishment and abundance of Tetrastichus planipennisi (Hymenoptera: Eulophidae) in Michigan: Potential for success in classical biocontrol of the invasive emerald ash borer (Coleoptera: Buprestidae). J. Econ. Entomol. 2013, 106, 1145–1154. [Google Scholar] [CrossRef] [PubMed]
- Duan, J.J.; Bauer, L.S.; Abell, K.J.; Ulyshen, M.D.; Van Driesche, R.G. Population dynamics of an invasive forest insect and associated natural enemies in the aftermath of invasion: Implications for biological control. J. Appl. Ecol. 2015, 52, 1246–1254. [Google Scholar] [CrossRef]
- Abell, K.J.; Bauer, L.S.; Duan, J.J.; Van Driesche, R.G. Long-term monitoring of the introduced emerald ash borer (Coleoptera: Buprestidae) egg parasitoid, Oobius agrili (Hymenoptera: Encyrtidae), in Michigan, USA and evaluation of a newly developed monitoring technique. Biol. Control. 2014, 79, 36–42. [Google Scholar] [CrossRef]
- Abell, K.J.; Duan, J.J.; Bauer, L.S.; Lelito, J.P.; Van Driesche, R.G. The effect of bark thickness on the effectiveness of Tetrastichus planipennisi (Hymen: Eulophidae) and Atanycolus spp. (Hymen: Braconidae) two parasitoids of emerald ash borer (Coleop: Buprestidae). Biol. Control. 2012, 63, 320–325. [Google Scholar] [CrossRef]
- Duan, J.J.; Bauer, L.S.; Van Driesche, R.G. Emerald ash borer biocontrol in ash saplings: The potential for early stage recovery of North American ash trees. For. Ecol. Manag. 2017, 394, 64–72. [Google Scholar] [CrossRef]
- Margulies, E.; Bauer, L.; Ibanez, I. Buying time: Preliminary assessment of biocontrol in the recovery of native forest vegetation in the aftermath of the invasive emerald ash borer. Forests 2017, 8, 369. [Google Scholar] [CrossRef]
- Knight, K.S.; Brown, J.P.; Long, R.P. Factors affecting the survival of ash (Fraxinus spp.) trees infested by emerald ash borer (Agrilus planipennis). Biol. Invasions 2013, 15, 371–383. [Google Scholar] [CrossRef]
- Vercken, E.; Vincent, F.; Mailleret, L.; Ris, N.; Tabone, E.; Fauvergue, X. Time-lag in extinction dynamics in experimental populations: Evidence for a genetic Allee effect? J. Anim. Ecol. 2013, 82, 621–631. [Google Scholar] [CrossRef] [PubMed]
- Vercken, E.; Fauvergue, X.; Ris, N.; Crochard, D.; Mailleret, L. Temporal autocorrelation in host density increases establishment success of parasitoids in an experimental system. Ecol. Evol. 2015, 5, 2684–2693. [Google Scholar] [CrossRef] [PubMed]
- Abell, K.J.; Bauer, L.S.; Miller, D.L.; Duan, J.J.; Van Driesche, R.G. Monitoring the establishment and flight phenology of parasitoids of emerald ash borer (Coleoptera: Buprestidae) in Michigan by using sentinel eggs and larvae. Fla. Entomol. 2016, 99, 667–672. [Google Scholar] [CrossRef]
- Kashian, D.M.; Witter, J.A. Assessing the potential for ash canopy tree replacement via current regeneration following emerald ash borer-caused mortality on southeastern Michigan landscapes. For. Ecol. Manag. 2011, 261, 480–488. [Google Scholar] [CrossRef]
- Klooster, W.S.; Herms, D.A.; Knight, K.S.; Herms, C.P.; McCullough, D.G.; Smith, A.S.; Gandhi, K.J.K.; Cardina, J. Ash (Fraxinus spp.) mortality, regeneration, and seed bank dynamics in mixed hardwood forests following invasion by emerald ash borer (Agrilus planipennis). Biol. Invasions 2014, 16, 859–873. [Google Scholar] [CrossRef]
- Siegert, N.W.; McCullough, D.G.; Liebhold, A.M.; Telewski, F.W. Dendrochronological reconstruction of the epicentre and early spread of emerald ash borer in North America. Divers. Distrib. 2014, 20, 847–858. [Google Scholar] [CrossRef]
- Smith, A. Effects of community structure on forest susceptibility and response to the emerald ash borer invasion of the Huron River Watershed in southeastern Michigan. Master’s Thesis, Ohio State University, Columbus, OH, USA, 2006. [Google Scholar]
- IBM Corp. IBM SPSS Statistics for Windows, version 23.0; Released; IBM Corp.: Armonk, NY, USA, 2015. [Google Scholar]
- Kashian, D.M. Sprouting and seed production may promote persistence of green ash in the presence of the emerald ash borer. Ecosphere 2016, 7, 1–15. [Google Scholar] [CrossRef]
- Murphy, T.C.; Van Dreische, R.G.; Gould, J.R.; Elkinton, J. Can Spathius galinae attack emerald ash borer larvae feeding in large ash trees? Biol. Control 2017, 114, 8–14. [Google Scholar] [CrossRef]
- Hausman, C.E. The Ecological Impacts of the Emerald Ash Borer (Agrilus plannipennis): Identification of Conservation and Forest Management Strategies. Ph.D. Thesis, Kent State University, Kent, OH, USA, 2010; p. 174. [Google Scholar]
- Costanza, K.K.L.; Livingston, W.H.; Kashian, D.M.; Slesak, R.A.; Tardif, J.C.; Dech, J.P.; Diamond, A.K.; Daigle, J.J.; Ranco, D.J.; Siegert, N.W.; et al. The precarious state of a cultural keystone species: Biological and tribal assessments of the role and future of black ash. J. For. 2017, 115, 435–446. [Google Scholar] [CrossRef]
- Palik, B.J.; Ostry, M.E.; Venette, R.C.; Abdela, E. Tree regeneration in black ash (Fraxinus nigra) stands exhibiting dieback in northern Minnesota. For. Ecol. Manag. 2012, 269, 26–30. [Google Scholar] [CrossRef]
© 2018 by the authors. Licensee MDPI, Basel, Switzerland. This article is an open access article distributed under the terms and conditions of the Creative Commons Attribution (CC BY) license (http://creativecommons.org/licenses/by/4.0/).