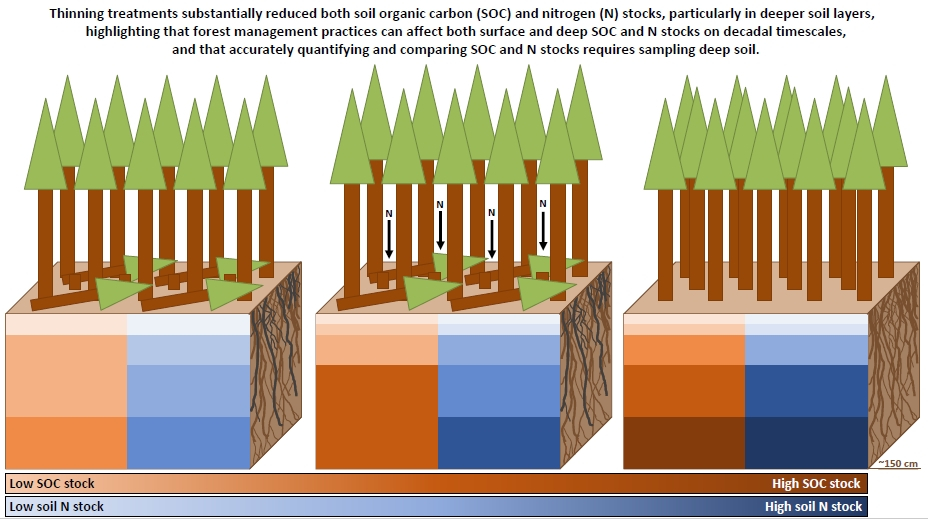
Thinning Treatments Reduce Deep Soil Carbon and Nitrogen Stocks in a Coastal Pacific Northwest Forest †


Abstract
:
1. Introduction
1.1. Increased Soil Temperature
1.2. Microbial Priming
1.3. Nitrate Leaching
1.4. Groundwater-Level Rise
1.5. Summary and Objectives
2. Materials and Methods
3. Results
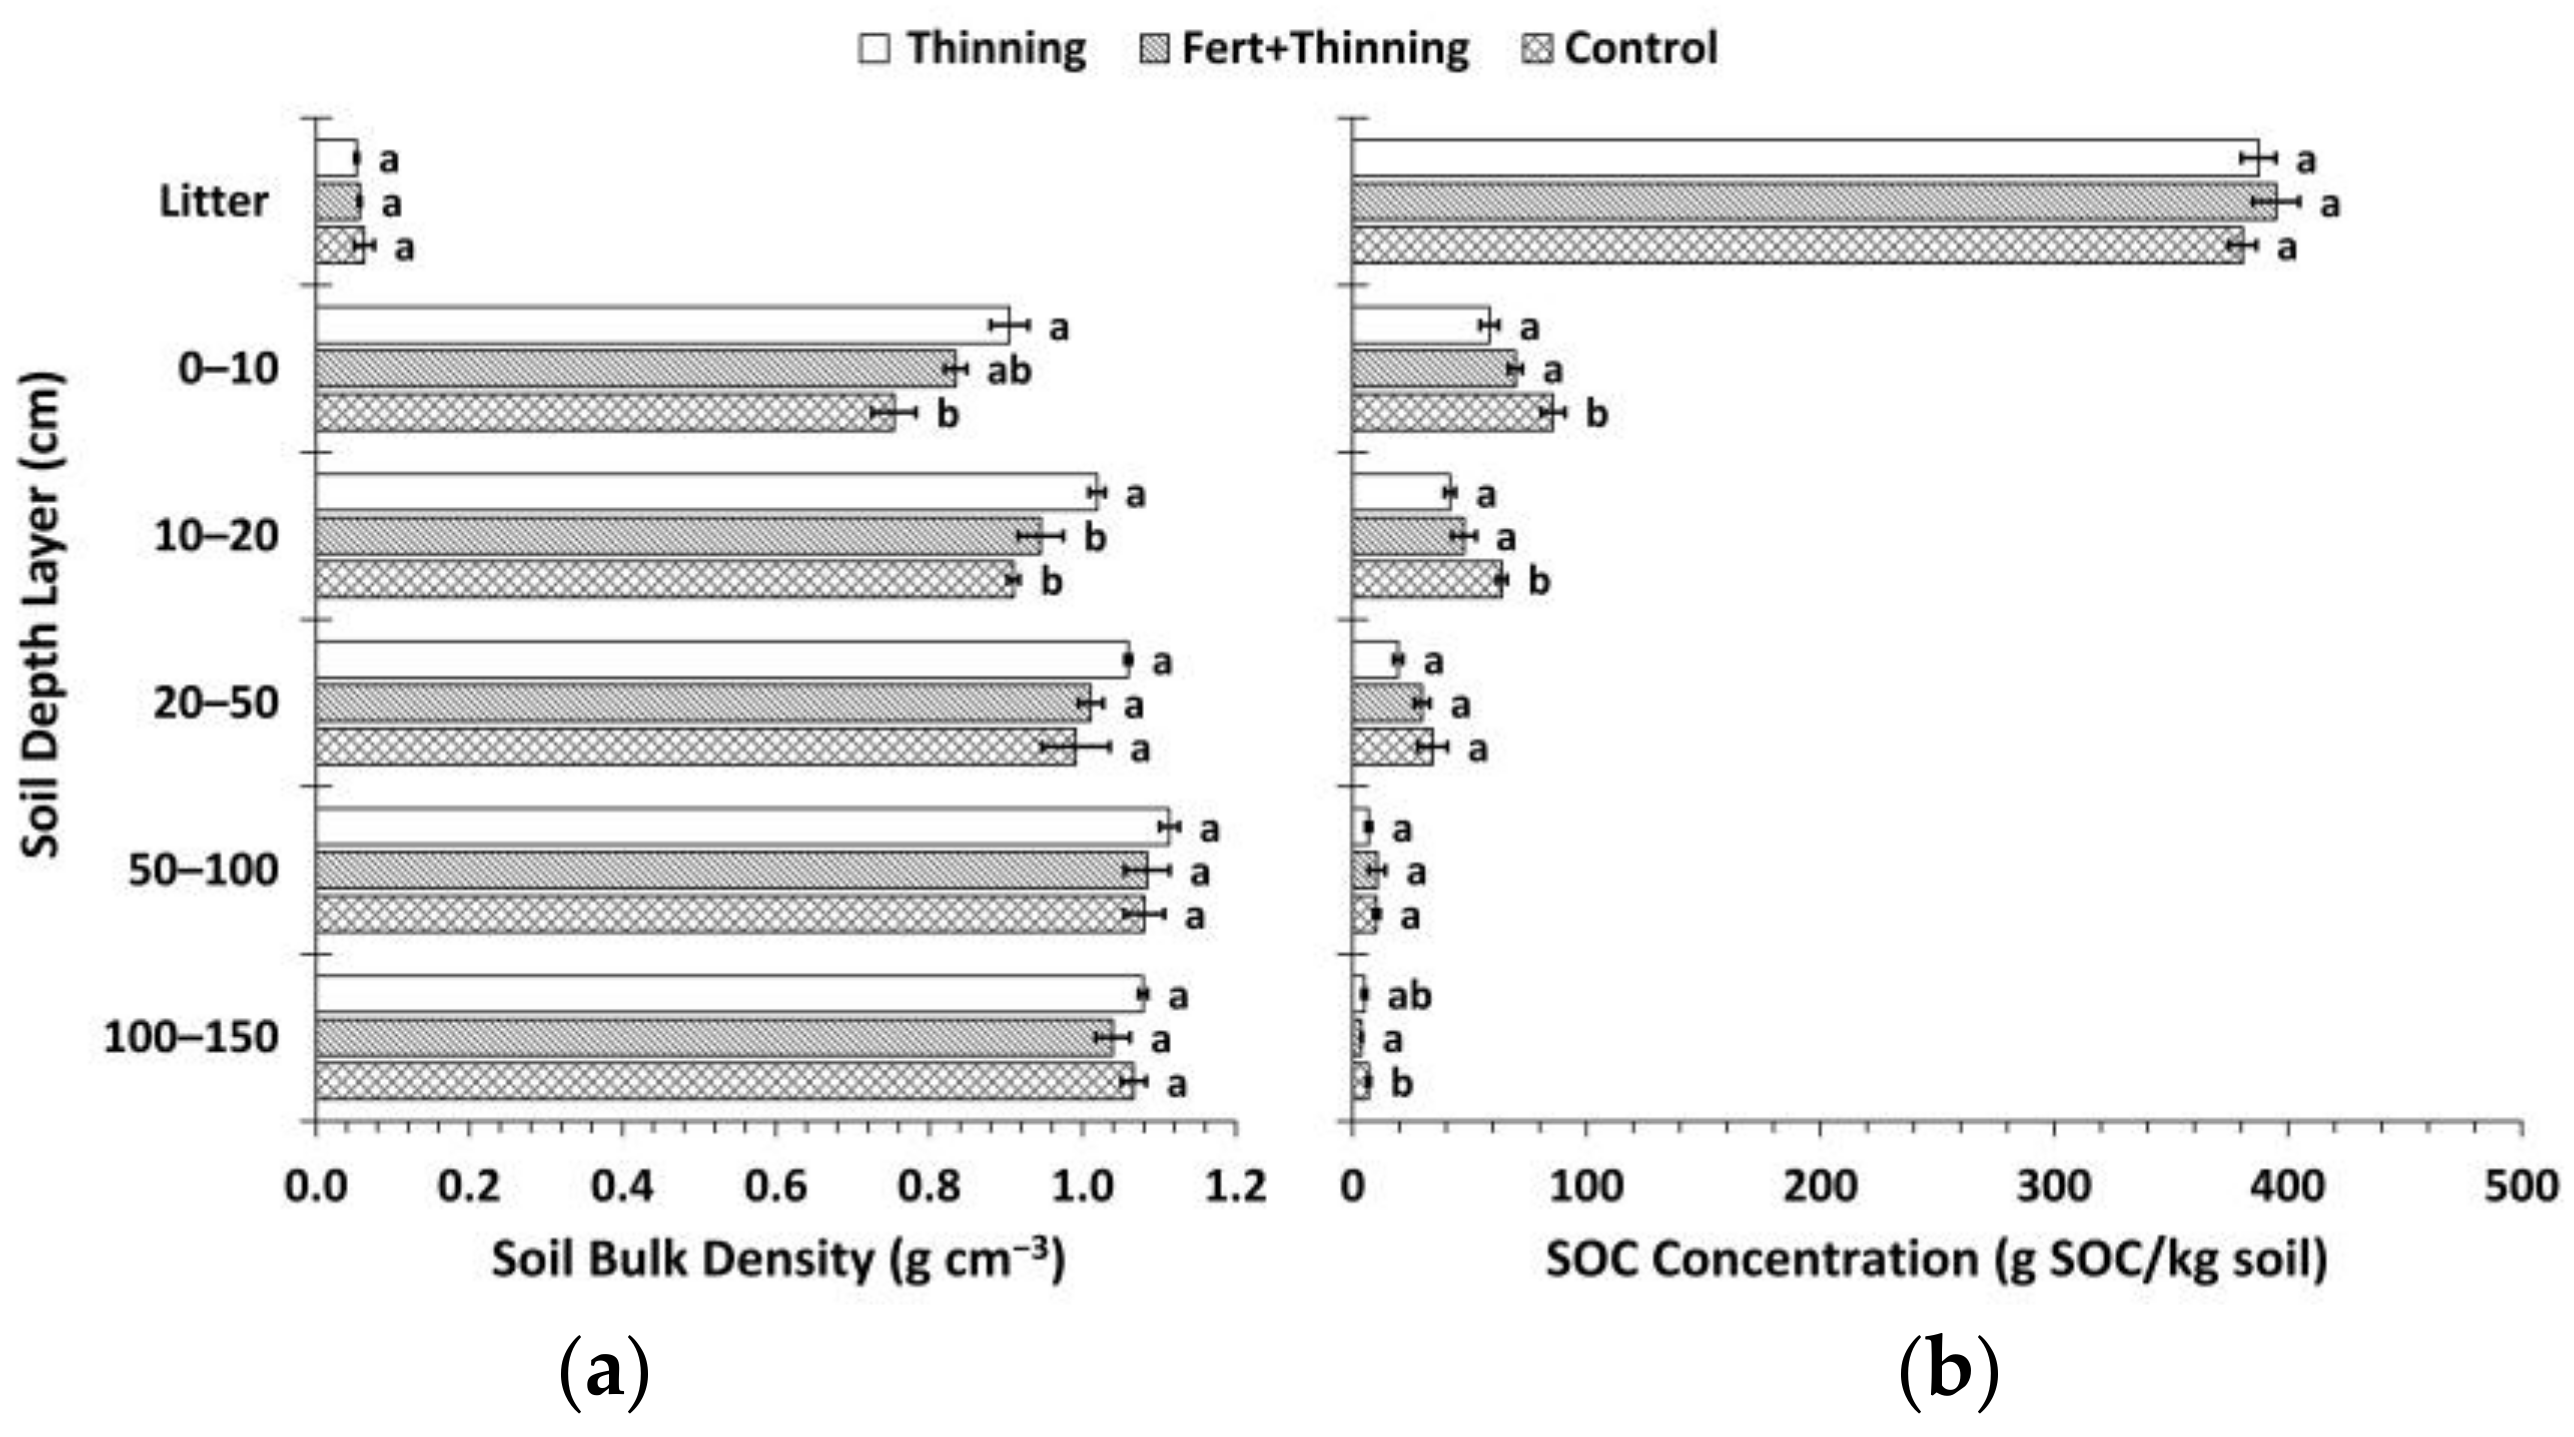
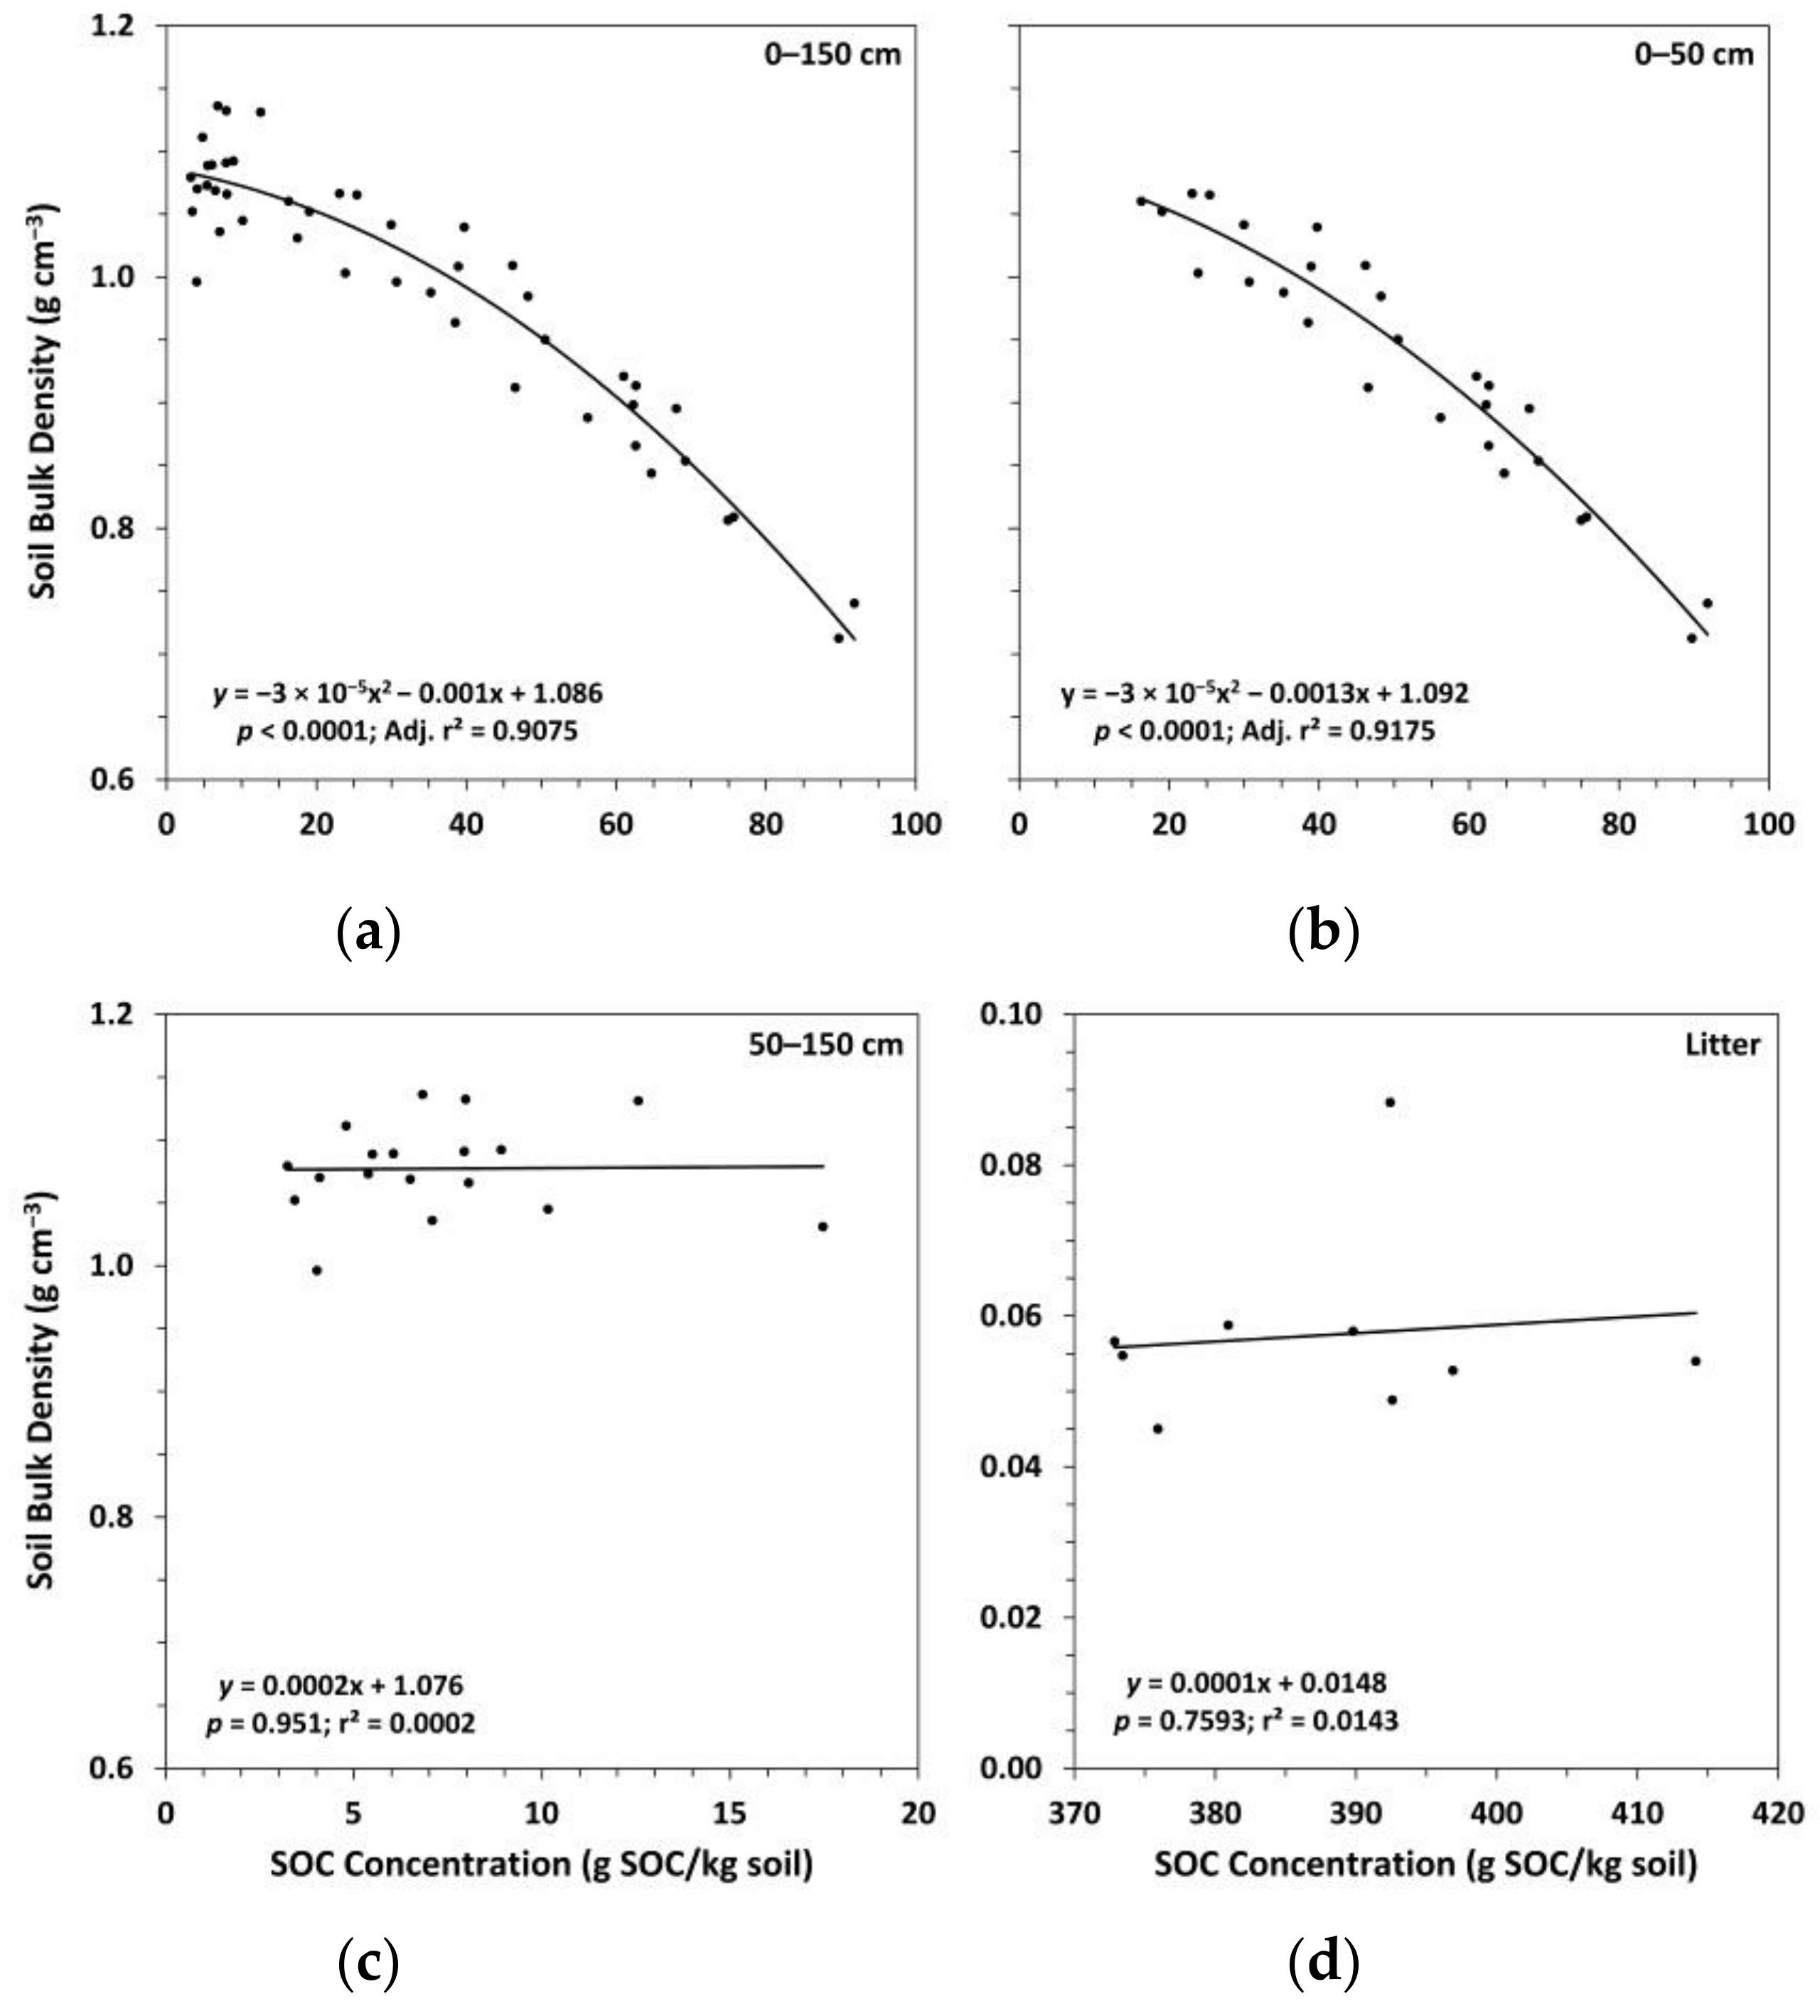
3.1. Soil Bulk Density and Organic Carbon Concentrations
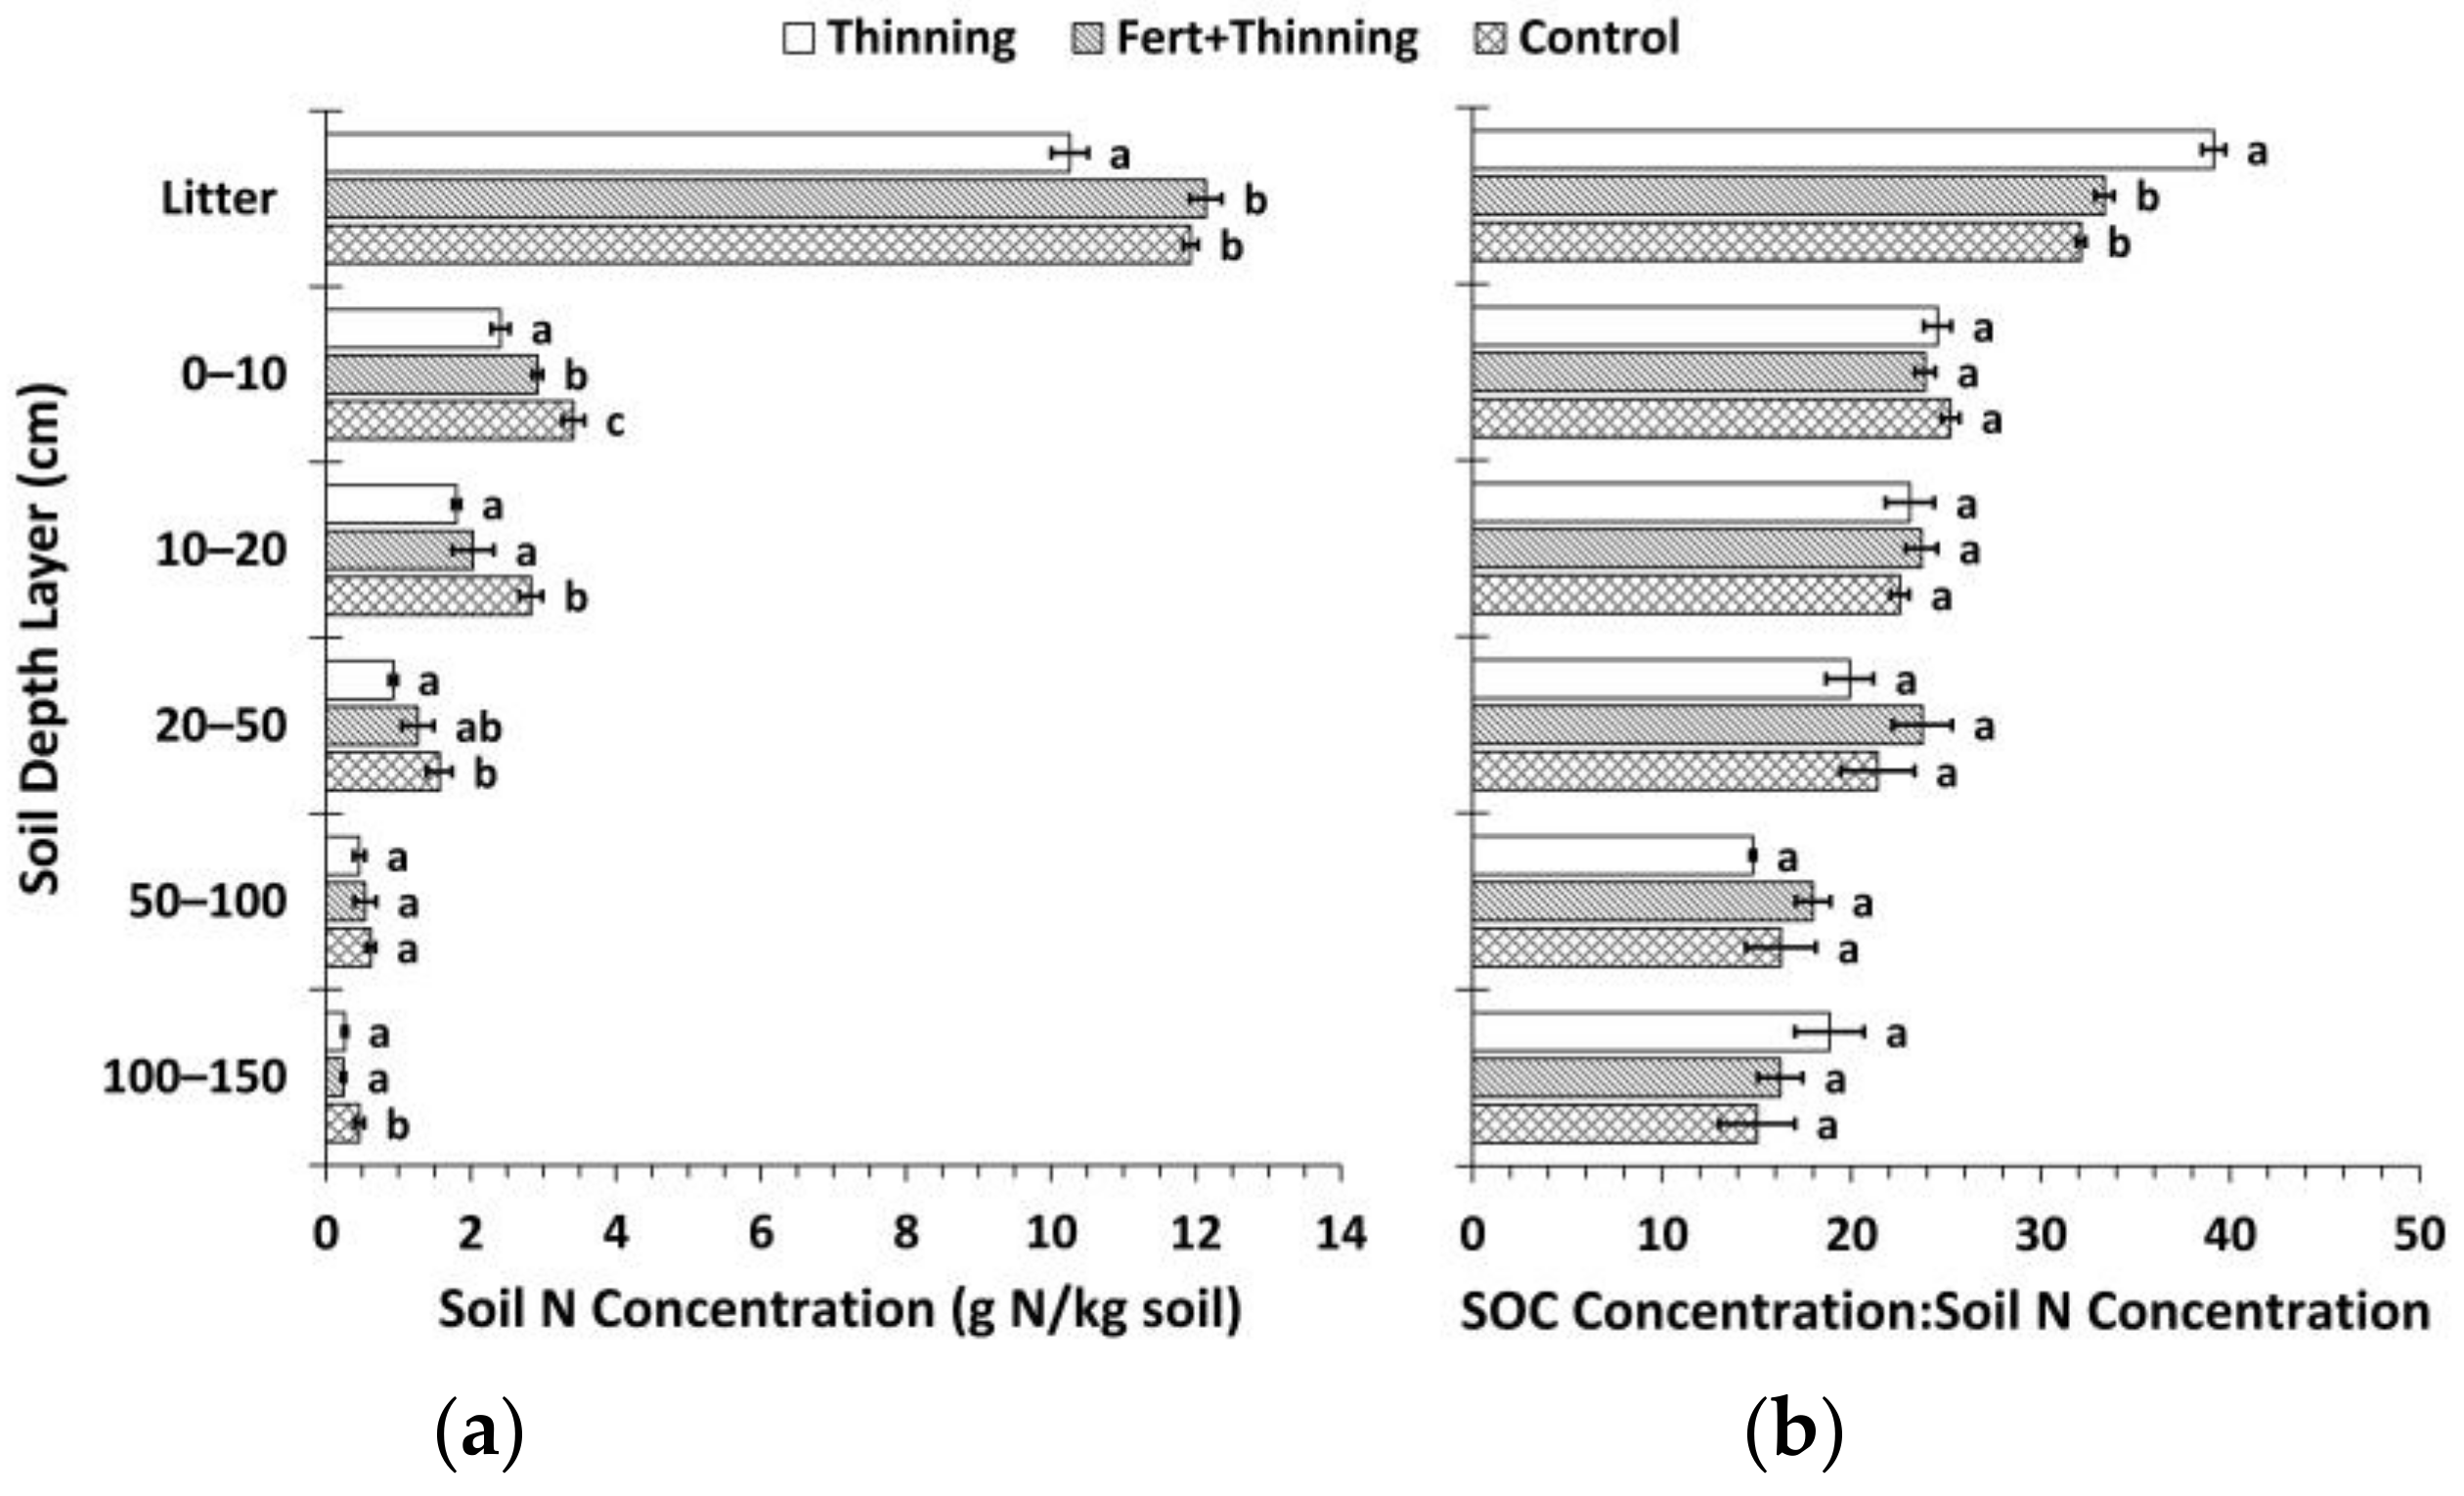
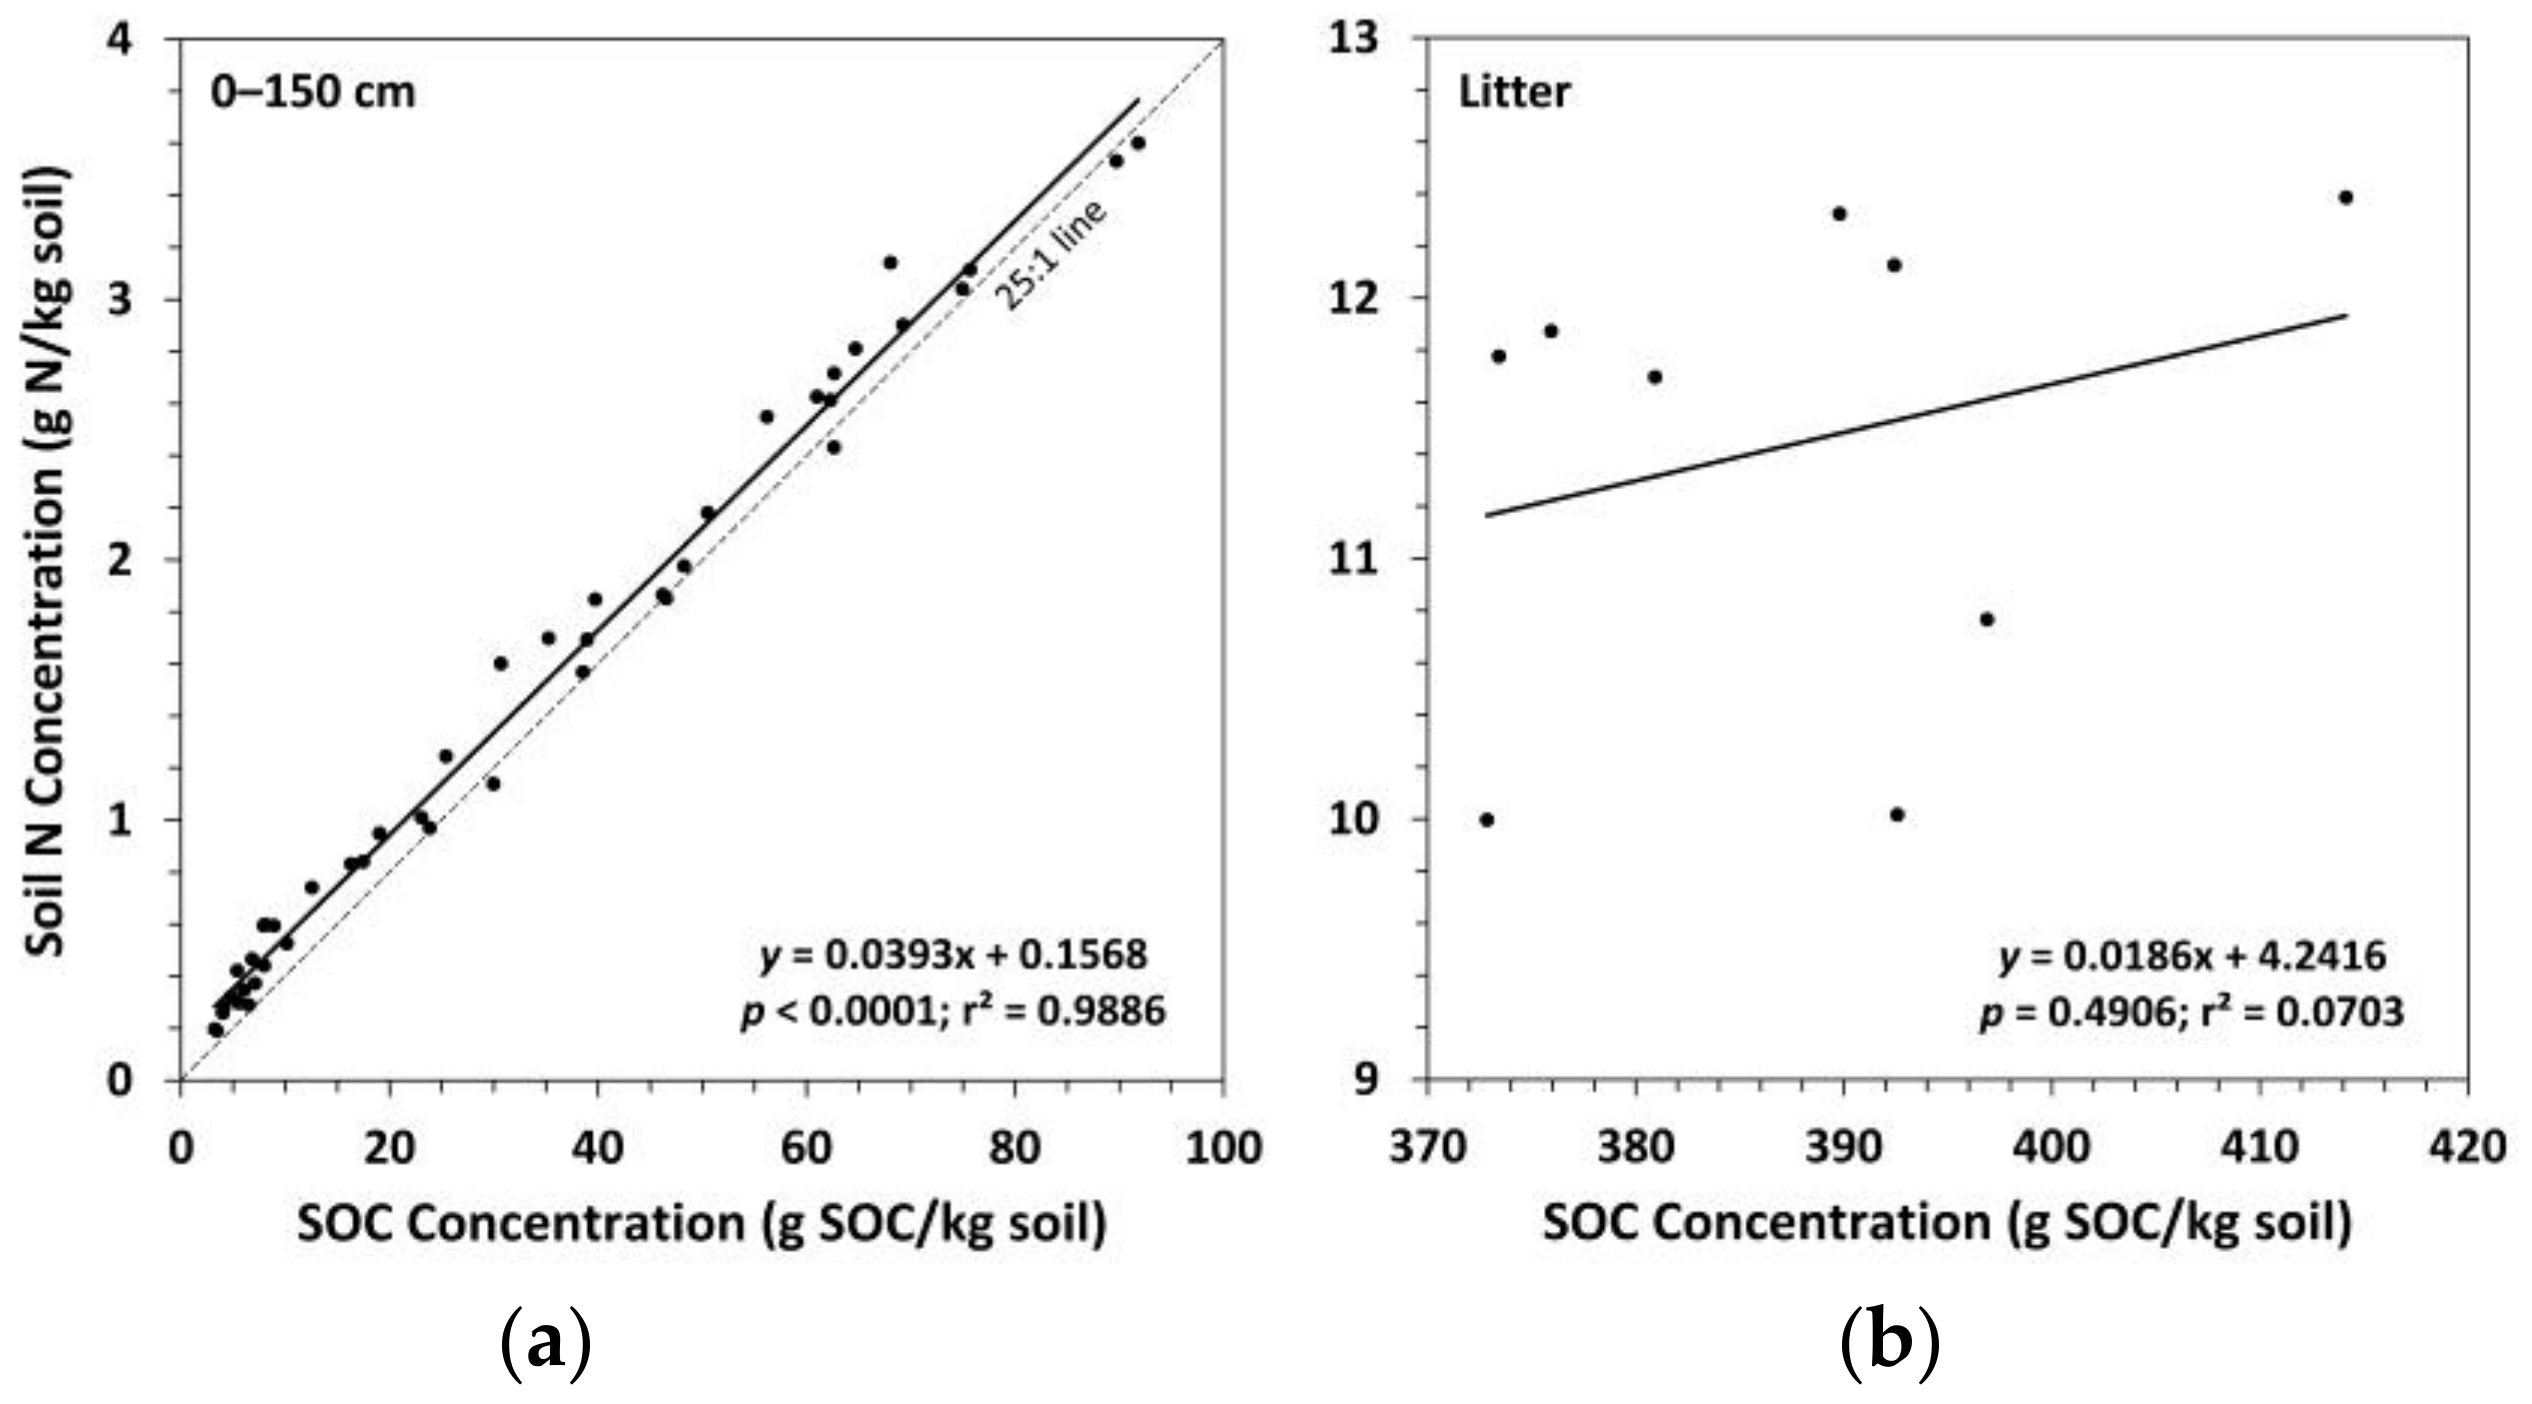
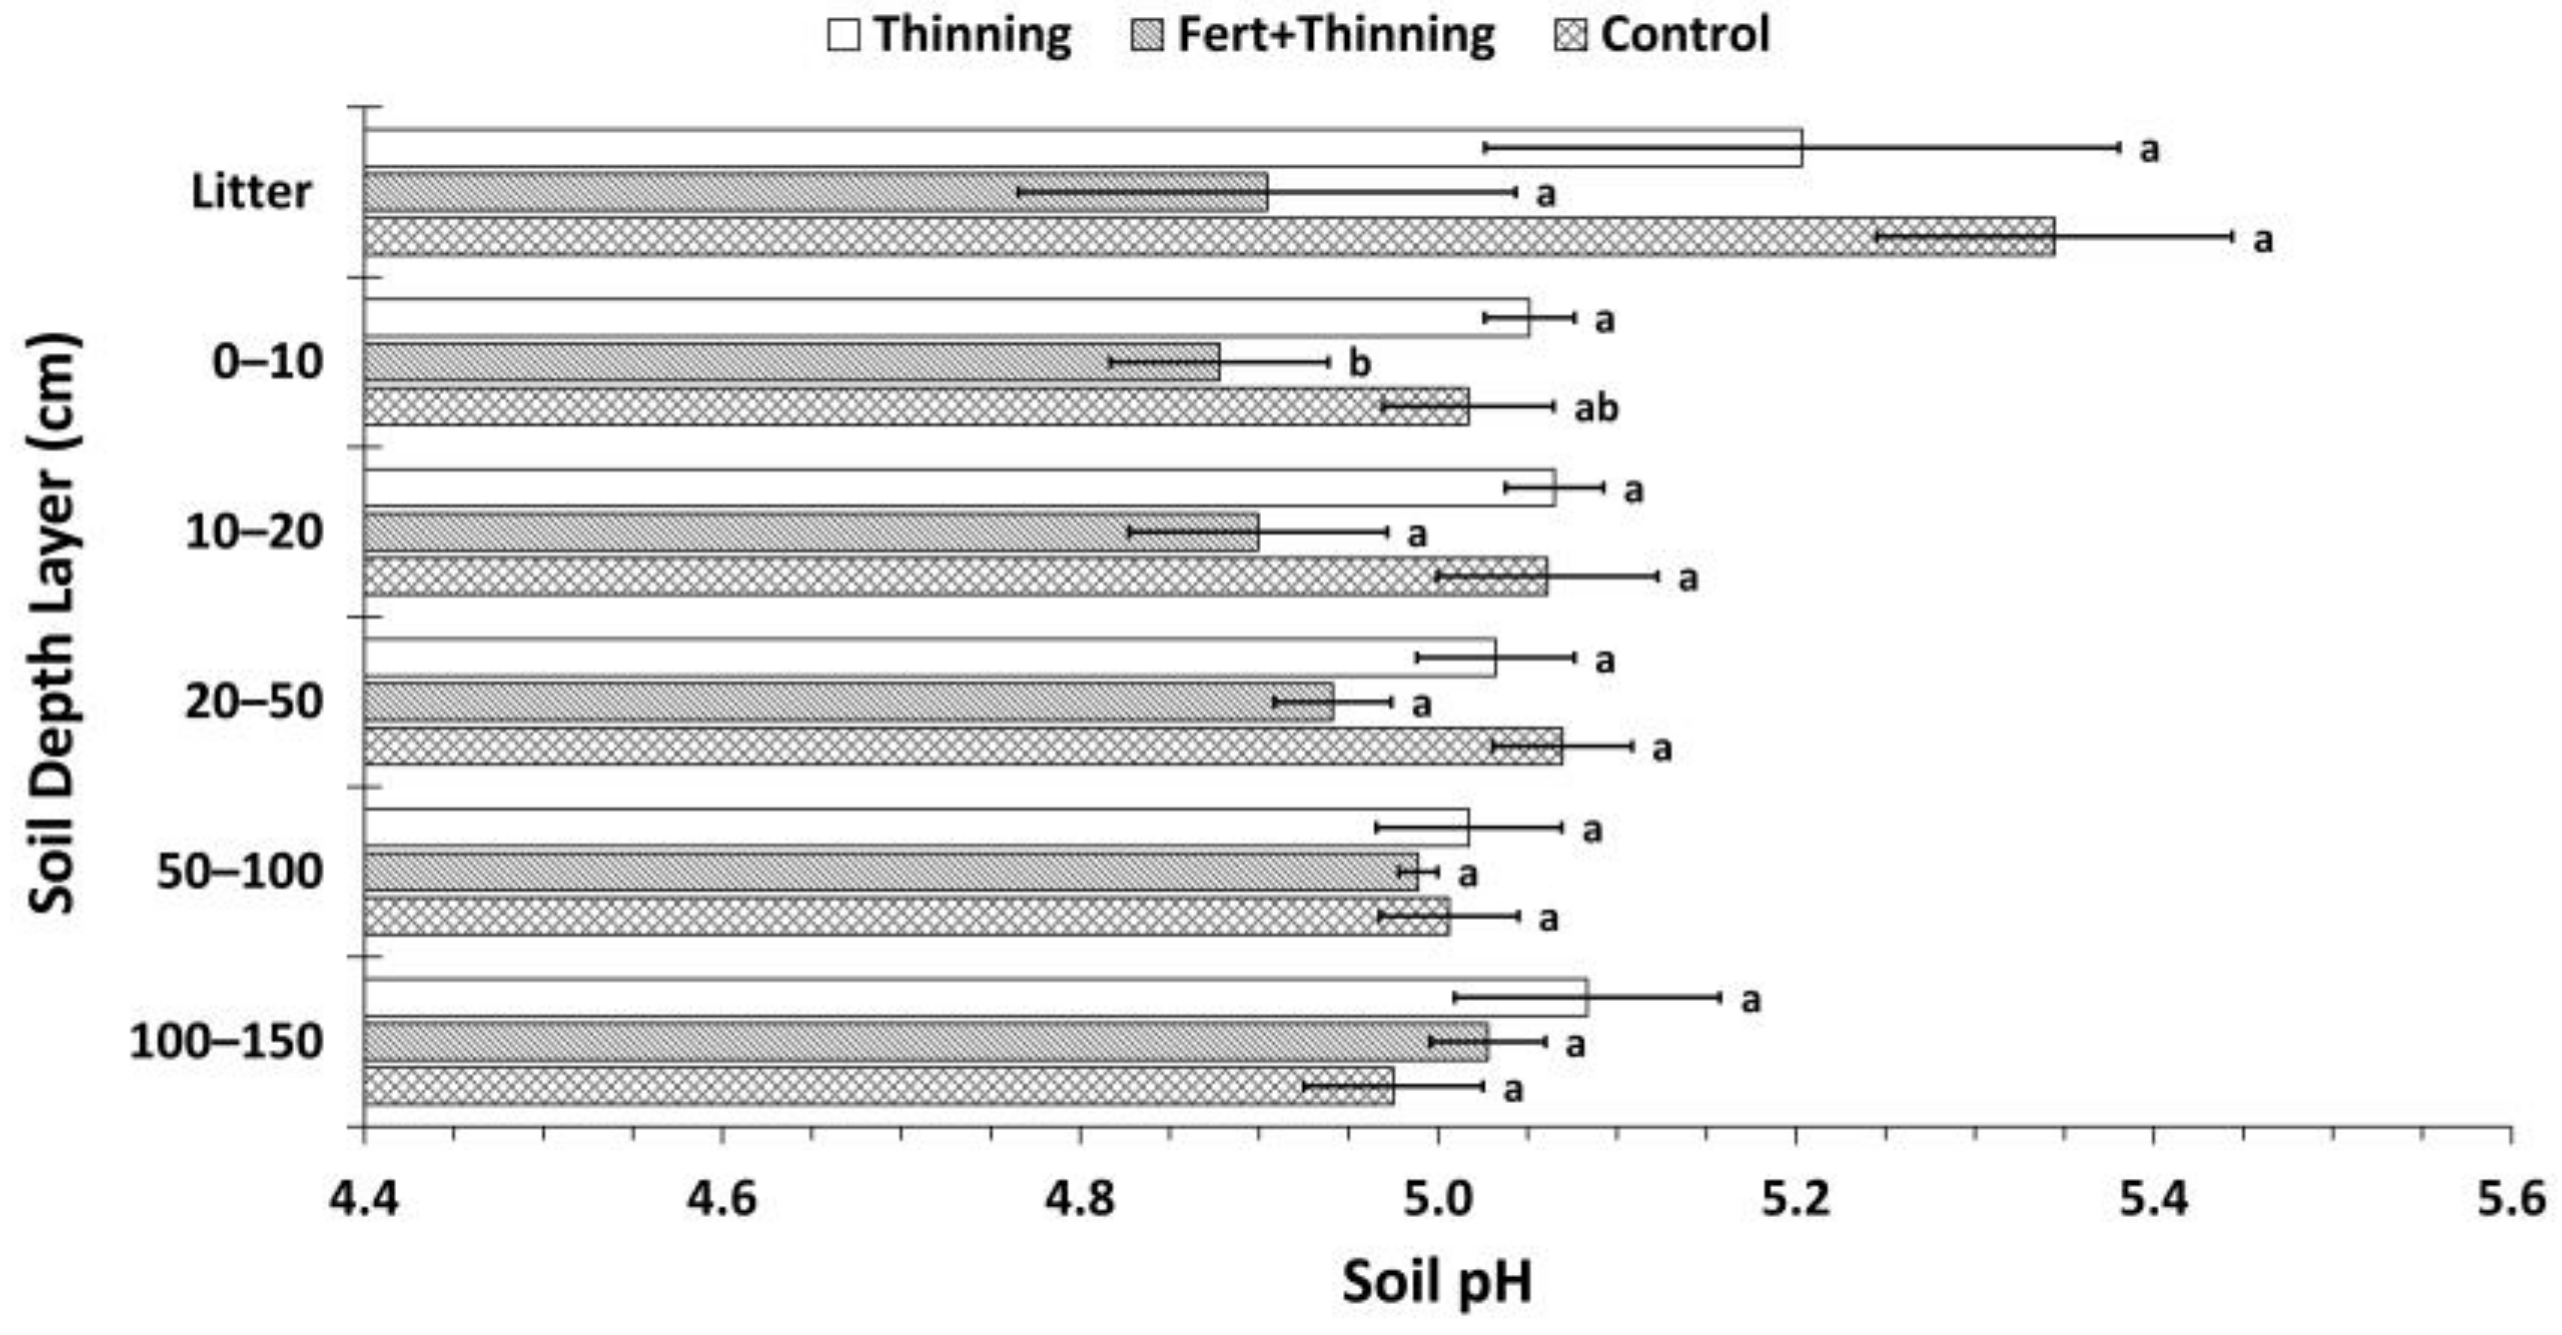
3.2. Soil Nitrogen Concentrations, Carbon to Nitrogen Ratios, and pH
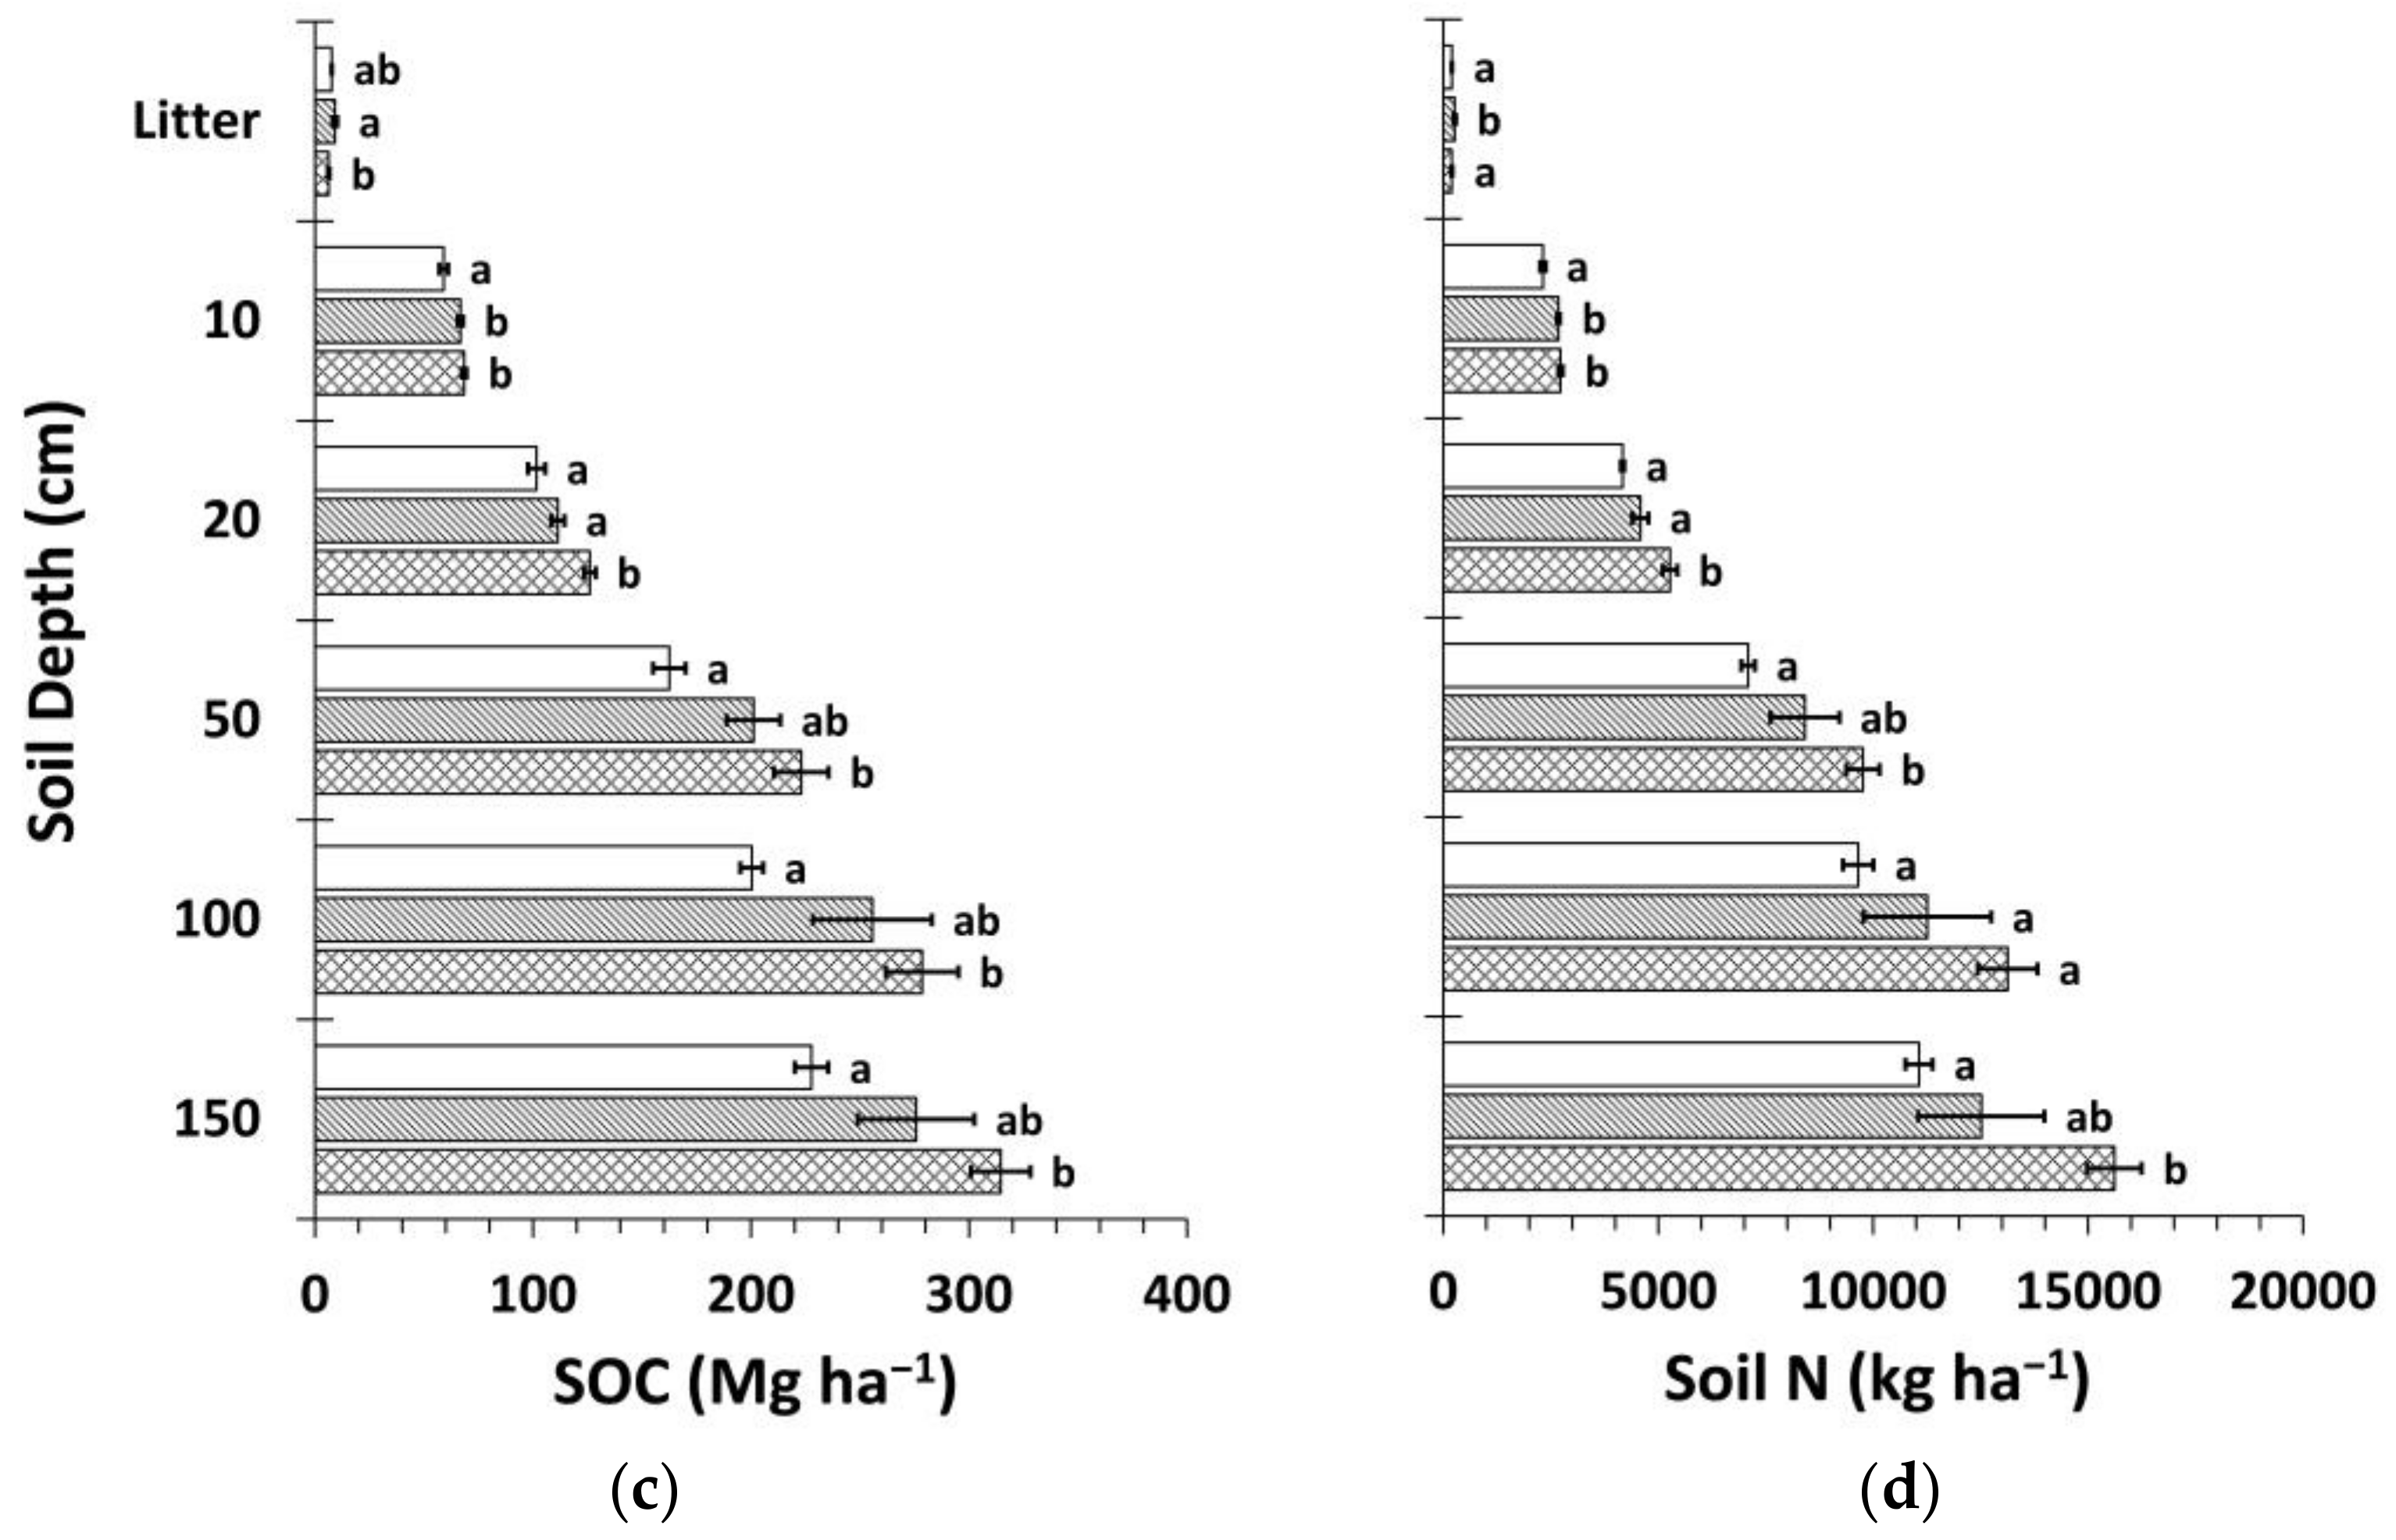
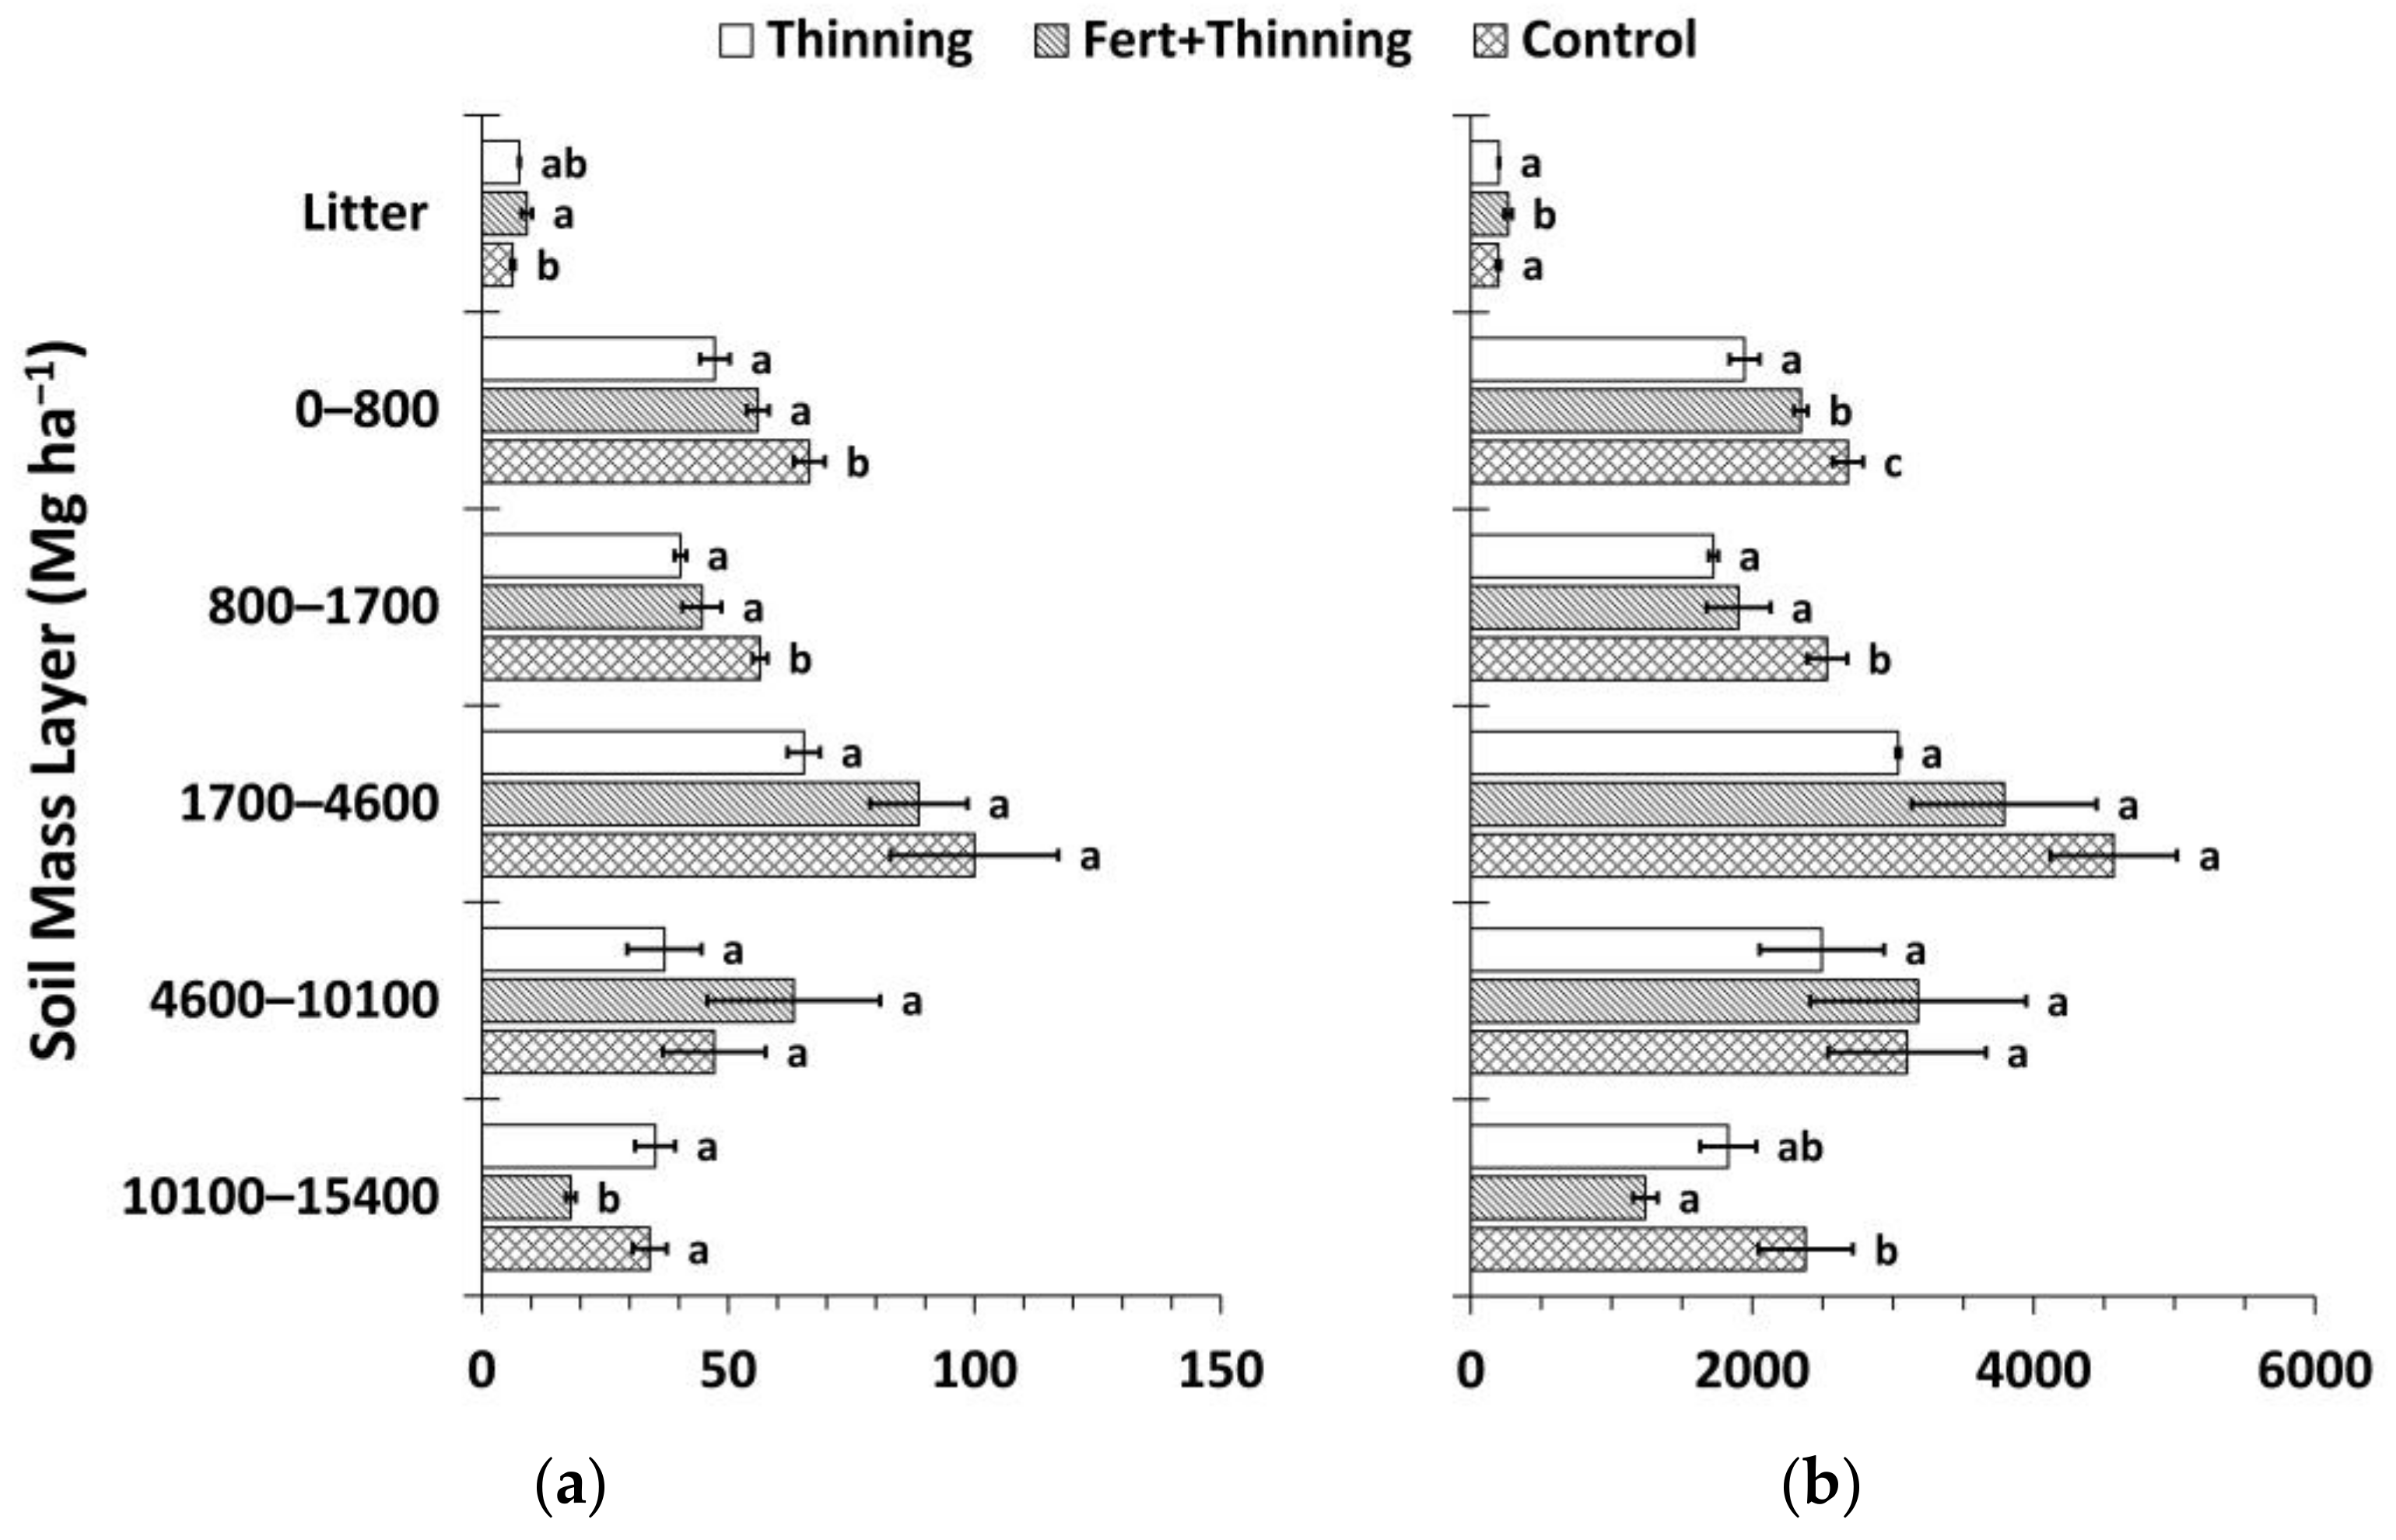
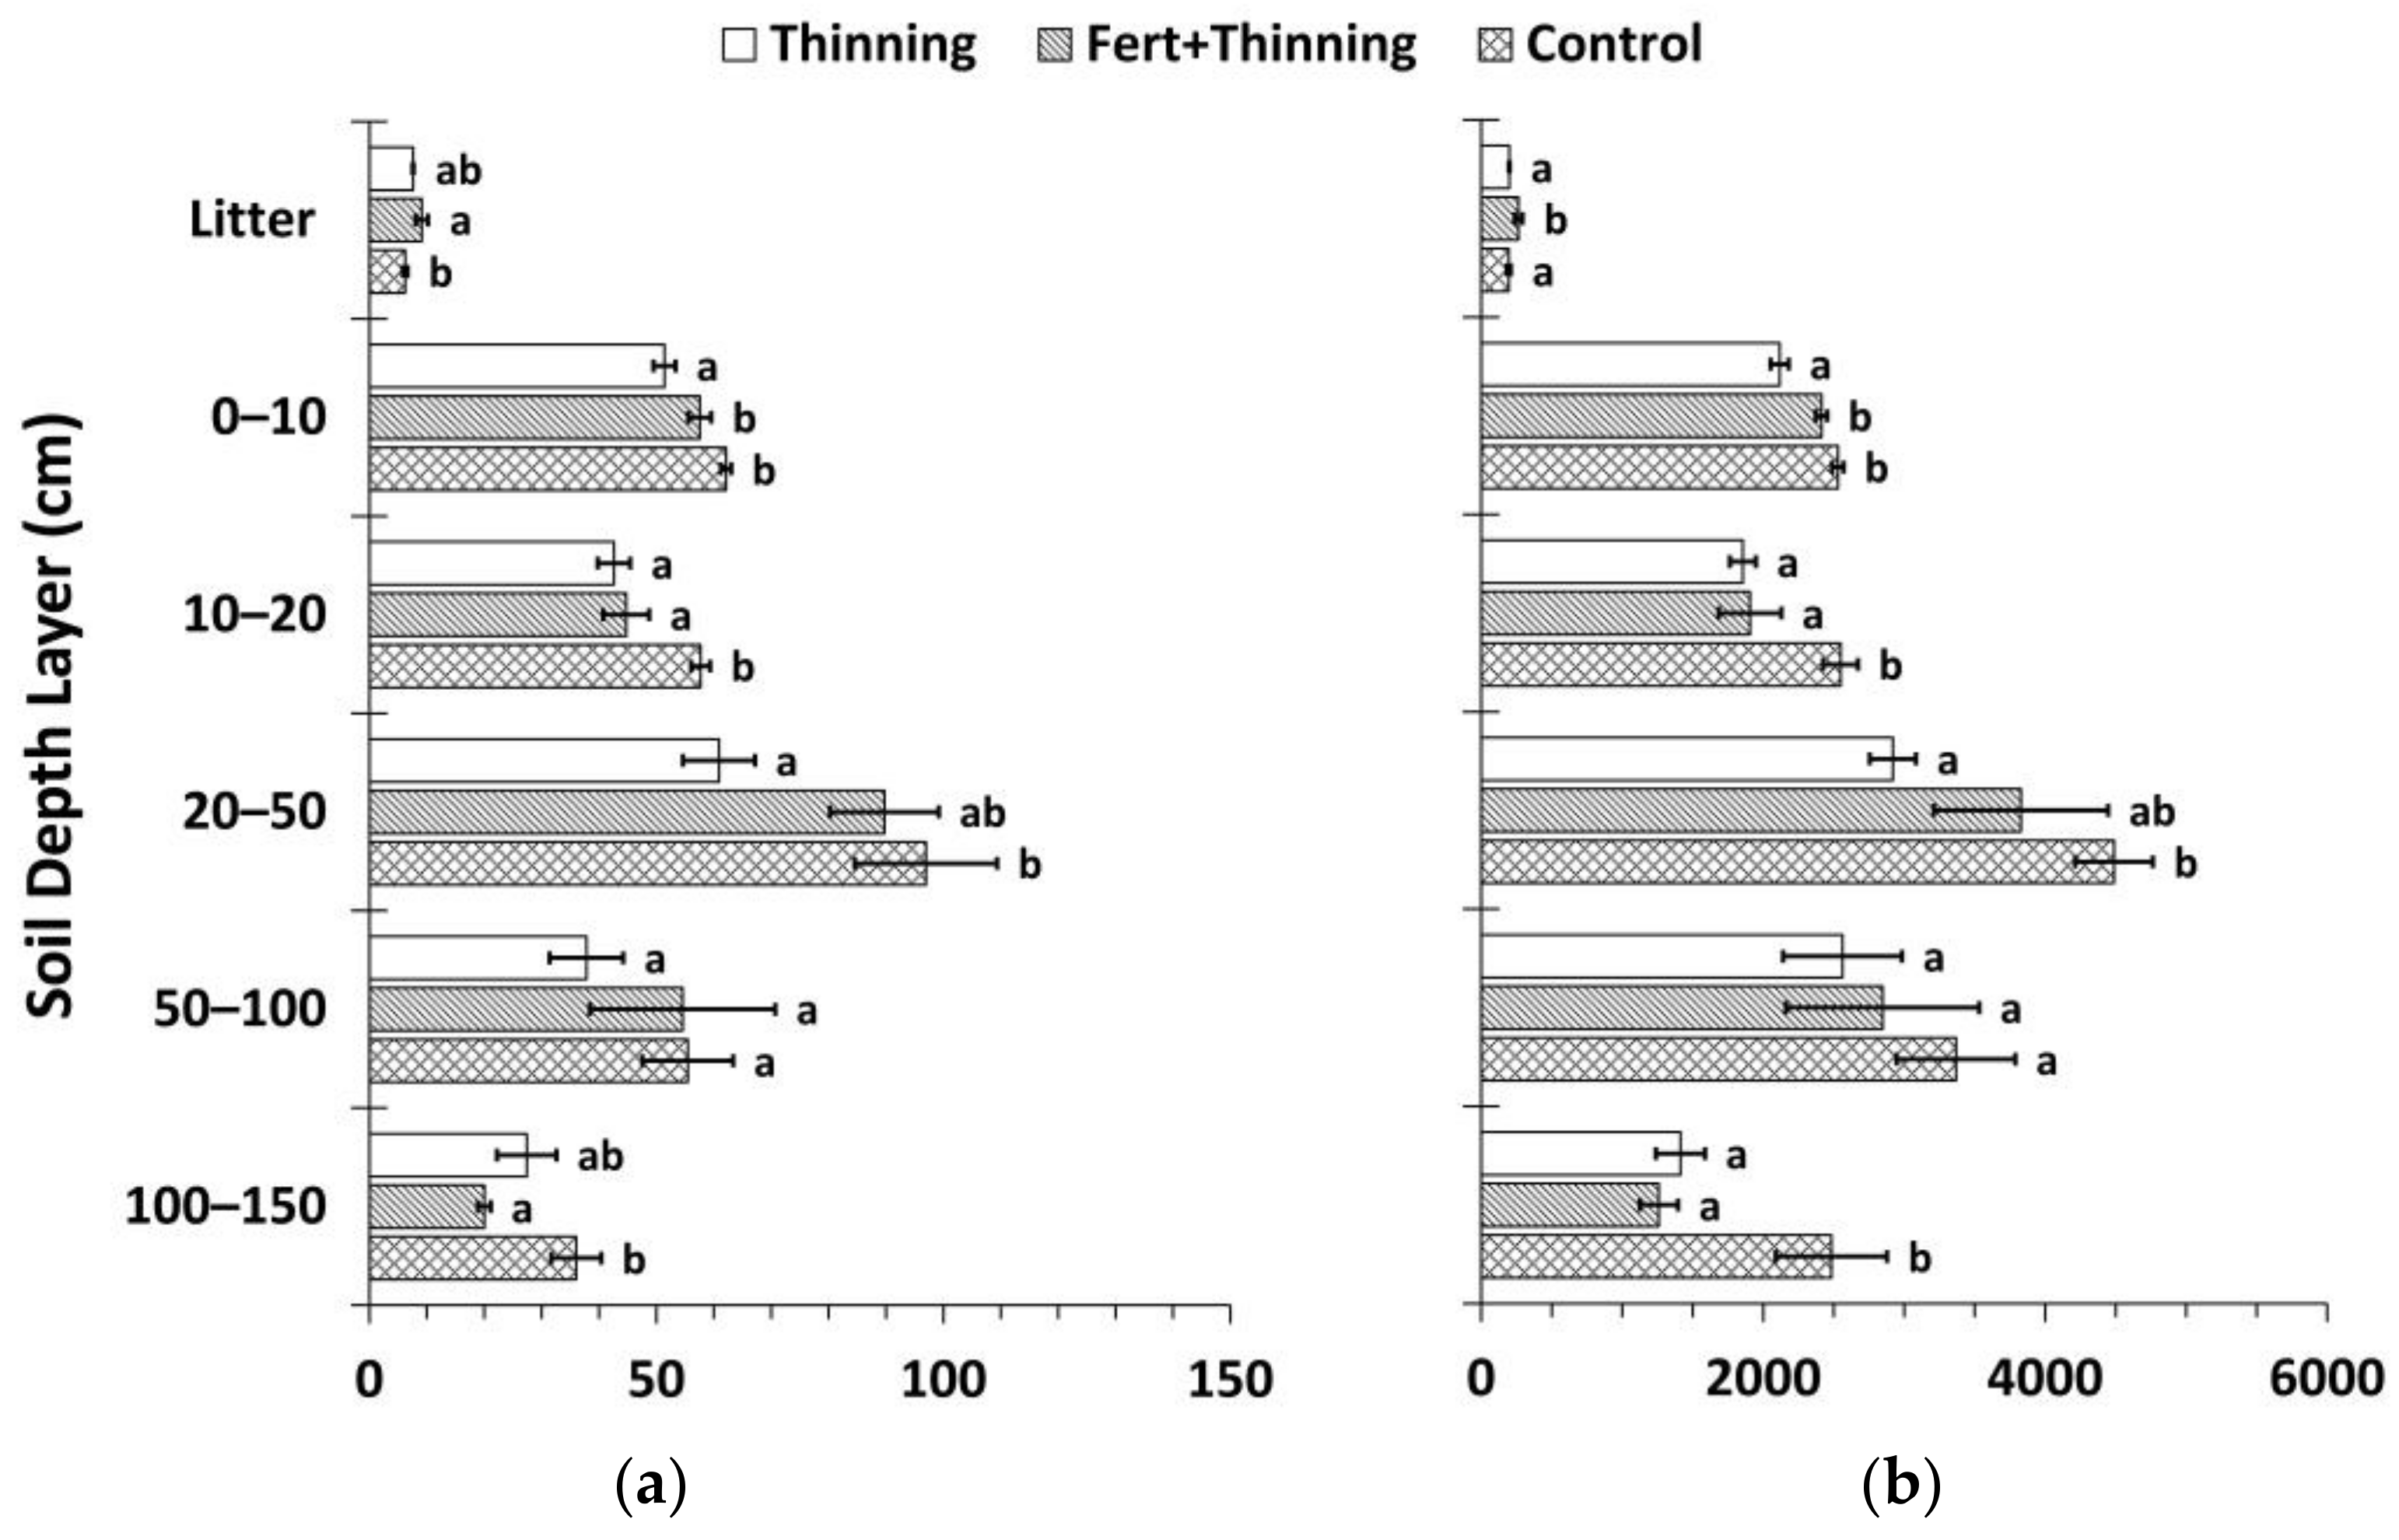
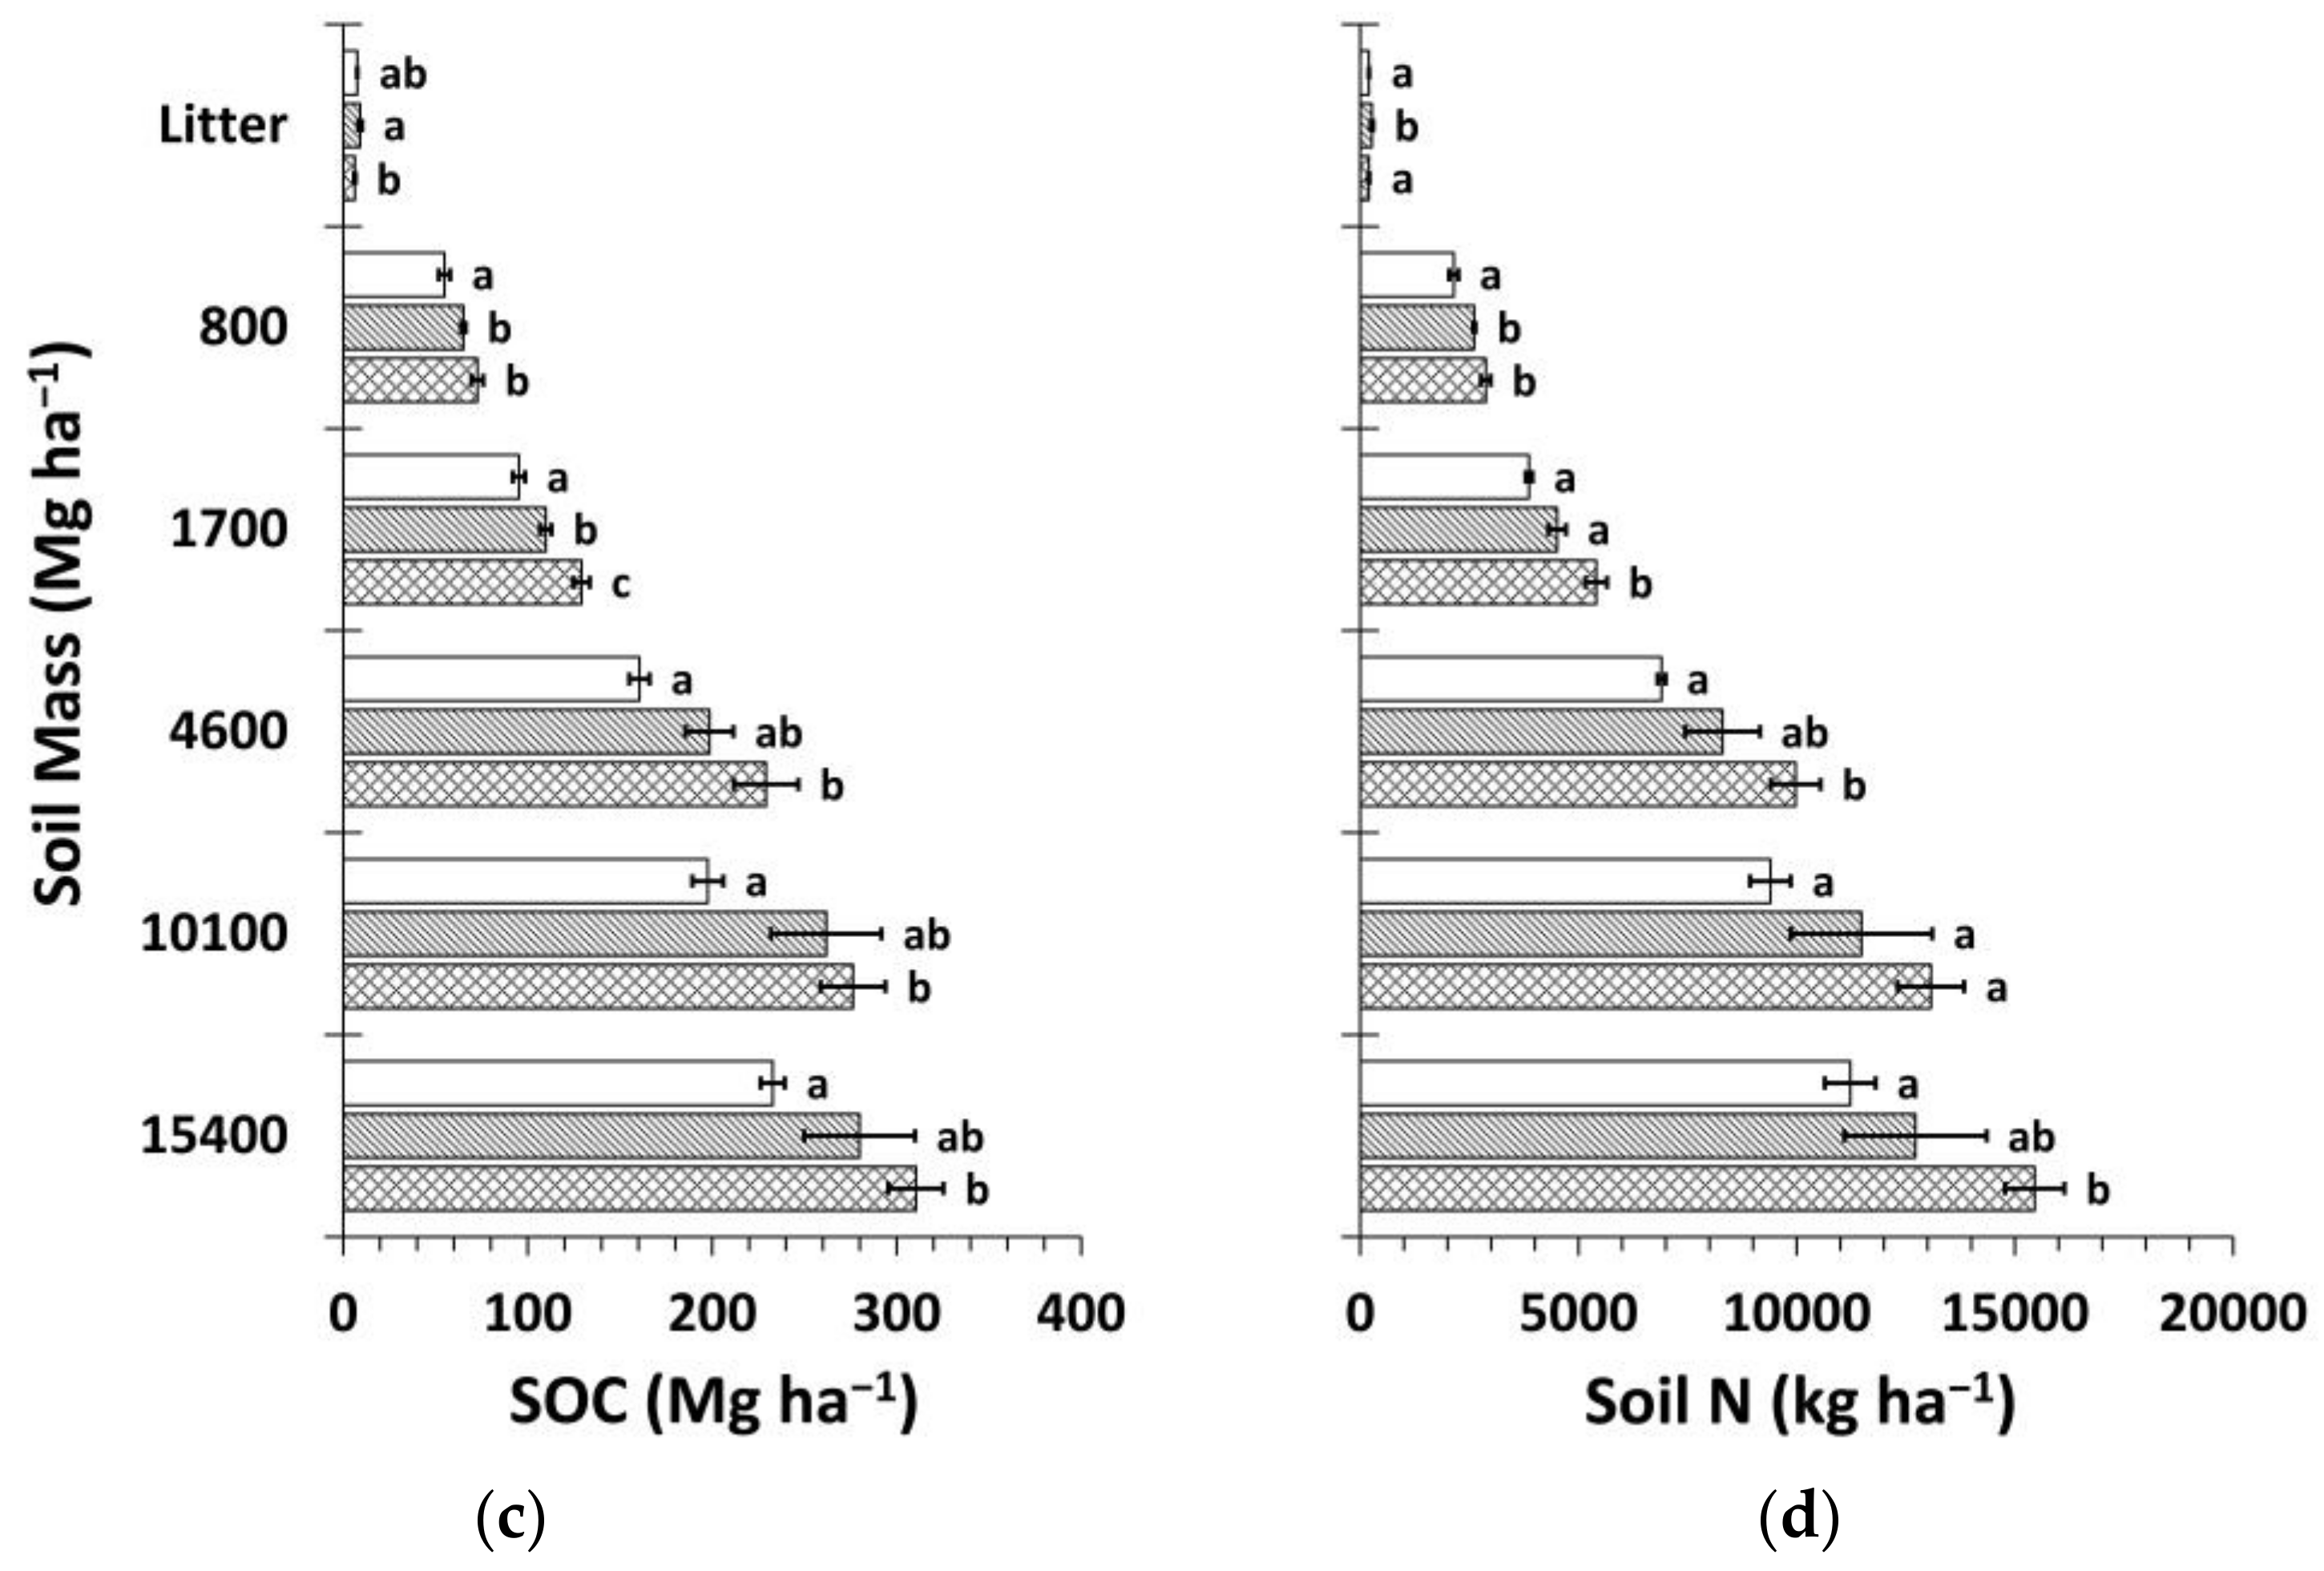
3.3. Soil Organic Carbon and Nitrogen Stocks
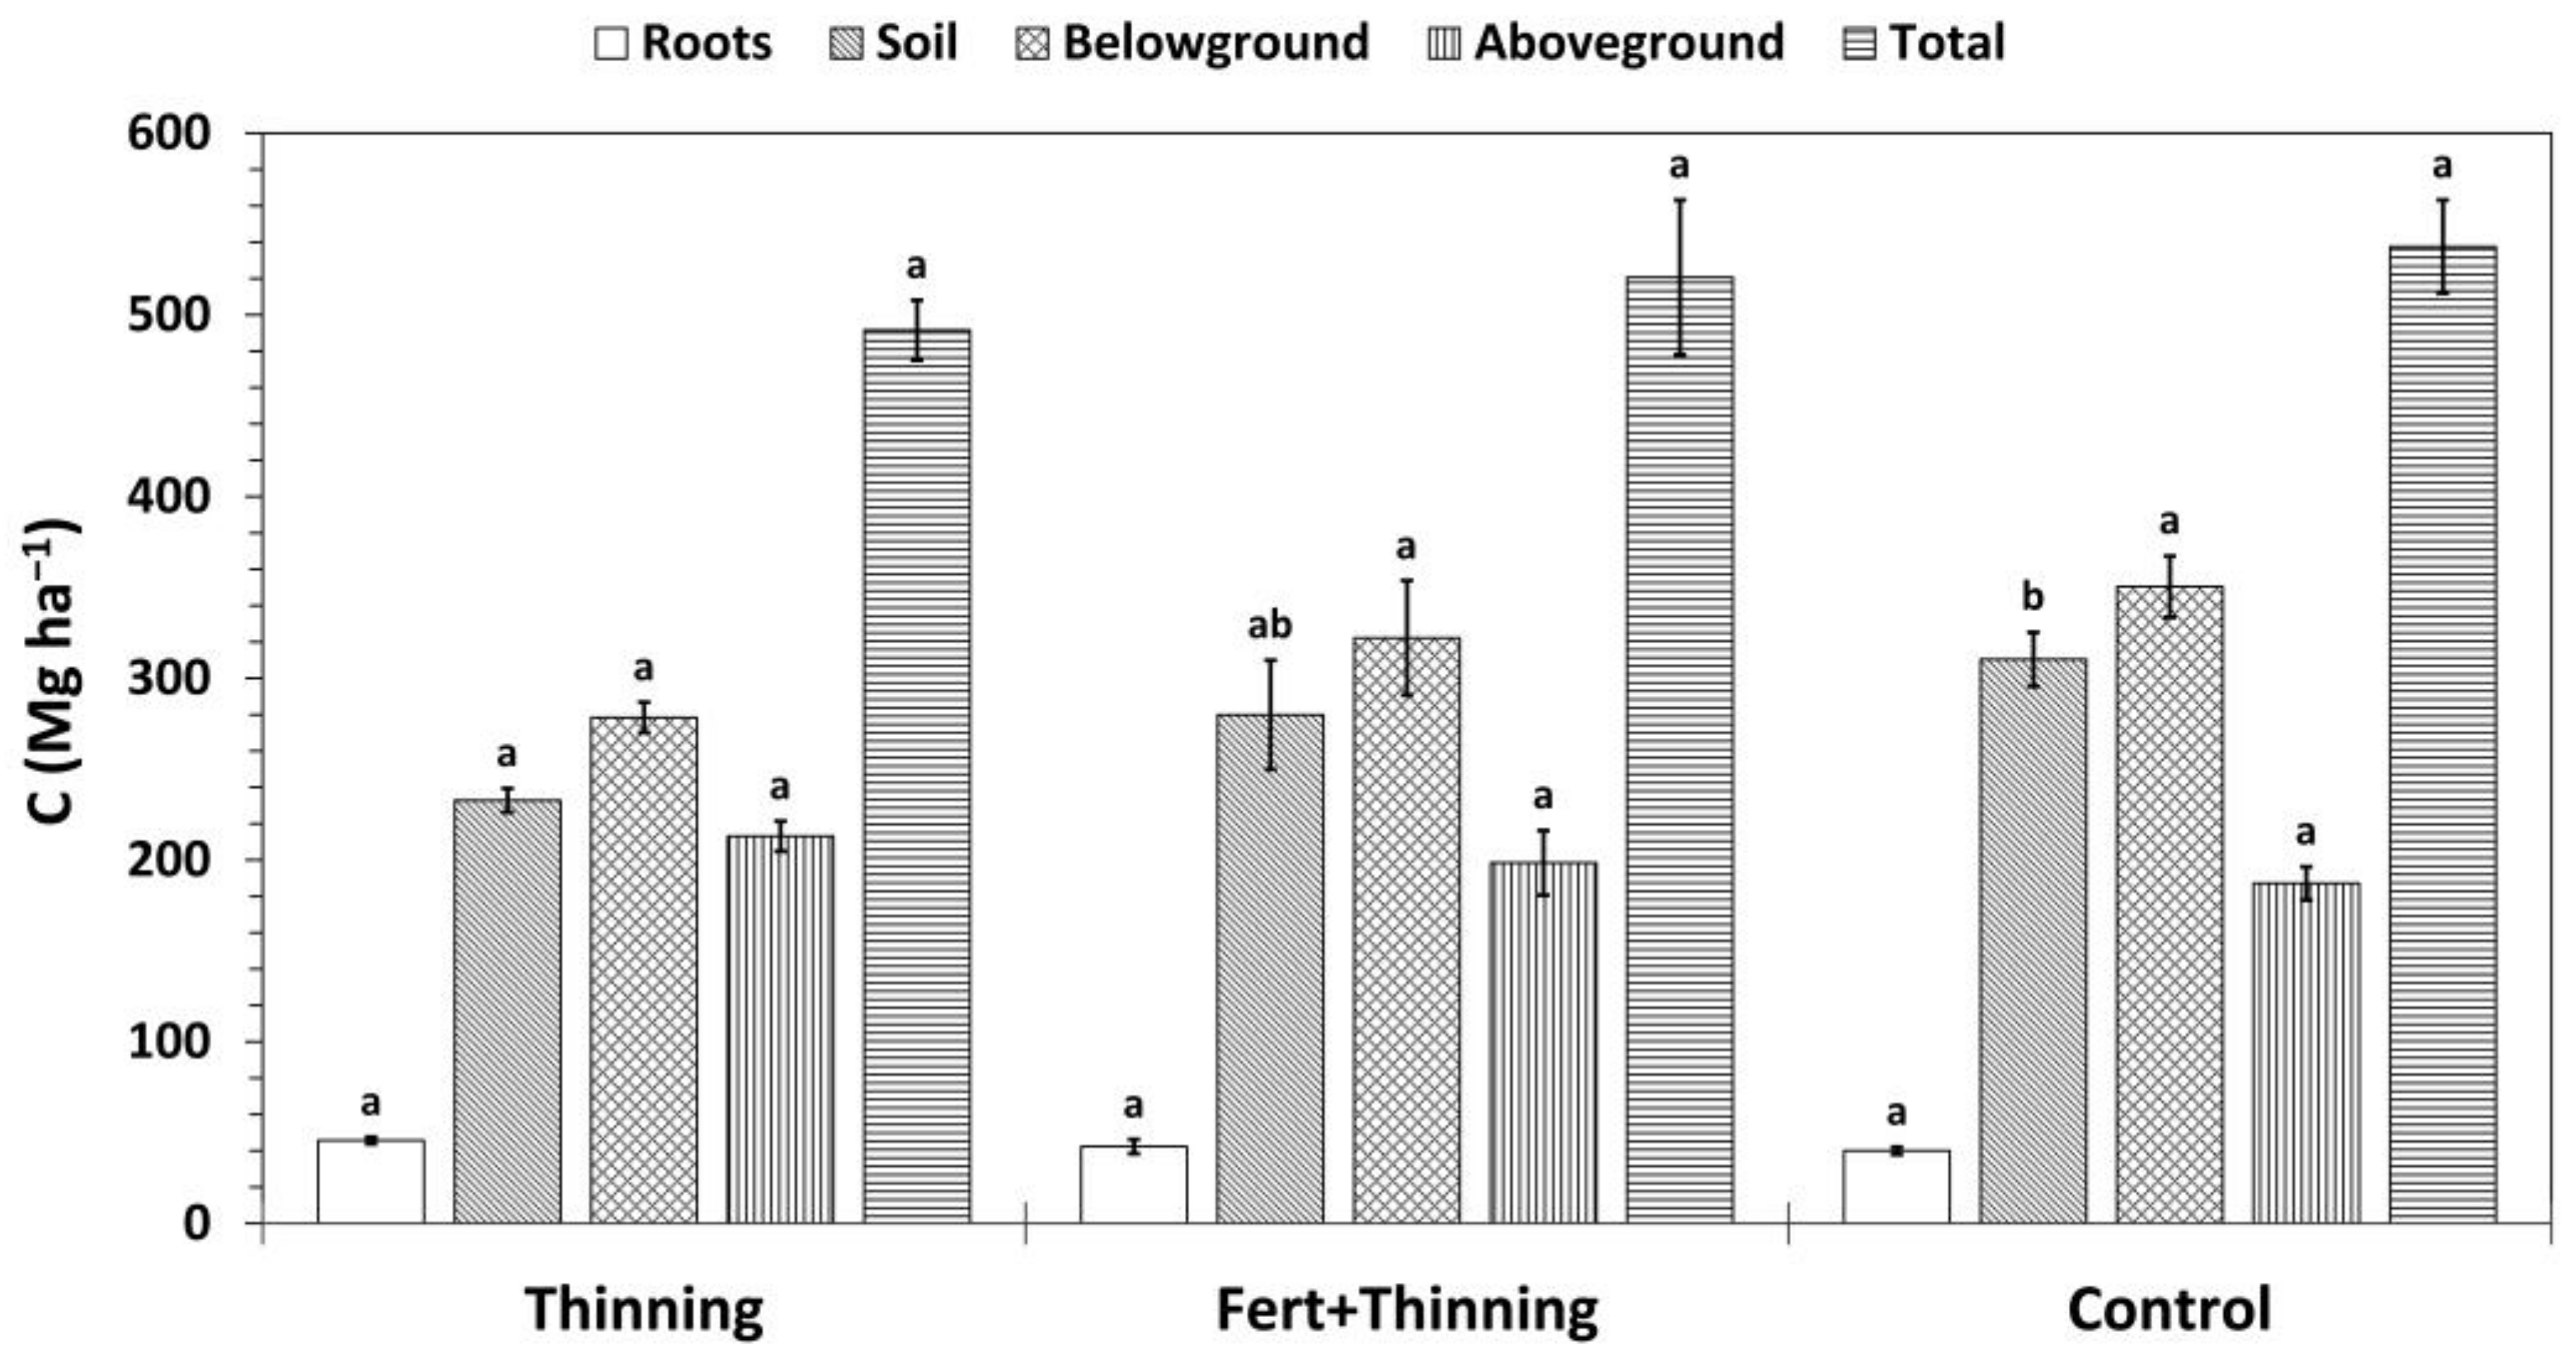
3.4. Carbon Stocks and Sequestration
3.5. Merchantable Volume
4. Discussion
5. Conclusions
Author Contributions
Funding
Acknowledgments
Conflicts of Interest
References
- Bellassen, V.; Luyssaert, S. Carbon sequestration: Managing forests in uncertain times. Nature 2014, 506, 153–155. [Google Scholar] [CrossRef] [PubMed]
- Pan, Y.; Birdsey, R.A.; Fang, J.; Houghton, R.; Kauppi, P.E.; Kurz, W.A.; Phillips, O.L.; Shvidenko, A.; Lewis, S.L.; Canadell, J.G.; et al. A large and persistent carbon sink in the world’s forests. Science 2011, 333, 988–993. [Google Scholar] [CrossRef] [PubMed]
- Lal, R. Forest soils and carbon sequestration. For. Ecol. Manag. 2005, 220, 242–258. [Google Scholar] [CrossRef]
- Stockmann, U.; Adams, M.A.; Crawford, J.W.; Field, D.J.; Henakaarchchi, N.; Jenkins, M.; Minasny, B.; McBratney, A.B.; de Courcelles, V.D.R.; Singh, K.; et al. The knowns, known unknowns and unknowns of sequestration of soil organic carbon. Agric. Ecosyst. Environ. 2013, 164, 80–99. [Google Scholar] [CrossRef]
- Clarke, N.; Gundersen, P.; Jönsson-Belyazid, U.; Kjønaas, O.J.; Persson, T.; Sigurdsson, B.D.; Stupak, I.; Vesterdal, L. Influence of different tree-harvesting intensities on forest soil carbon stocks in boreal and northern temperate forest ecosystems. For. Ecol. Manag. 2015, 351, 9–19. [Google Scholar] [CrossRef]
- Jobbágy, E.G.; Jackson, R.B. The vertical distribution of soil organic carbon and its relation to climate and vegetation. Ecol. Appl. 2000, 10, 423–436. [Google Scholar] [CrossRef]
- Dixon, R.K.; Brown, S.; Houghton, R.A.; Solomon, A.M.; Trexler, M.C.; Wisniewski, J. Carbon pools and flux of global forest ecosystems. Science 1994, 263, 185–190. [Google Scholar] [CrossRef] [PubMed]
- Milne, E.; Banwart, S.A.; Noellemeyer, E.; Abson, D.J.; Ballabio, C.; Bampa, F.; Bationo, A.; Batjes, N.H.; Bernoux, M.; Bhattacharyya, T.; et al. Soil carbon, multiple benefits. Environ. Dev. 2015, 13, 33–38. [Google Scholar] [CrossRef]
- Carter, R.E.; Klinka, K. Relationships between growing-season soil water-deficit, mineralizable soil nitrogen and site index of coastal Douglas fir. For. Ecol. Manag. 1990, 30, 301–311. [Google Scholar] [CrossRef]
- Blake, J.I.; Chappell, H.N.; Bennett, W.S.; Gessel, S.P.; Webster, S.R. Douglas fir growth and foliar nutrient responses to nitrogen and sulfur fertilization. Soil Sci. Soc. Am. J. 1990, 54, 257. [Google Scholar] [CrossRef]
- Chappell, H.N.; Cole, D.W.; Gessel, S.P.; Walker, R.B. Forest fertilization research and practice in the Pacific Northwest. Fertil. Res. 1991, 27, 129–140. [Google Scholar] [CrossRef]
- Jandl, R.; Lindner, M.; Vesterdal, L.; Bauwens, B.; Baritz, R.; Hagedorn, F.; Johnson, D.W.; Minkkinen, K.; Byrne, K.A. How strongly can forest management influence soil carbon sequestration? Geoderma 2007, 137, 253–268. [Google Scholar] [CrossRef]
- Li, W.; Jin, C.; Guan, D.; Wang, Q.; Wang, A.; Yuan, F.; Wu, J. The effects of simulated nitrogen deposition on plant root traits: A meta-analysis. Soil Biol. Biochem. 2015, 82, 112–118. [Google Scholar] [CrossRef]
- James, J.; Harrison, R. The effect of harvest on forest soil carbon: A meta-analysis. Forests 2016, 7, 308. [Google Scholar] [CrossRef]
- Bird, J.A.; Kleber, M.; Torn, M.S. 13C and 15N stabilization dynamics in soil organic matter fractions during needle and fine root decomposition. Org. Geochem. 2008, 39, 465–477. [Google Scholar] [CrossRef]
- Chase, C.W.; Kimsey, M.J.; Shaw, T.M.; Coleman, M.D. The response of light, water, and nutrient availability to pre-commercial thinning in dry inland Douglas-fir forests. For. Ecol. Manag. 2016, 363, 98–109. [Google Scholar] [CrossRef]
- Cheng, X.; Han, H.; Kang, F.; Liu, K.; Song, Y.; Zhou, B.; Li, Y. Short-term effects of thinning on soil respiration in a pine (Pinus tabulaeformis) plantation. Biol. Fertil. Soils 2014, 50, 357–367. [Google Scholar] [CrossRef]
- Thibodeau, L.; Raymond, P.; Camiré, C.; Munson, A.D. Impact of precommercial thinning in balsam fir stands on soil nitrogen dynamics, microbial biomass, decomposition, and foliar nutrition. Can. J. For. Res. 2000, 30, 229–238. [Google Scholar] [CrossRef]
- Hicks Pries, C.E.; Castanha, C.; Porras, R.; Torn, M.S. The whole-soil carbon flux in response to warming. Science 2017, 355, 1420–1423. [Google Scholar] [CrossRef] [PubMed]
- Gallo, A.C. Response of Soil Temperature, Moisture, and Respiration Two Years Following Intensive Organic Matter and Compaction Manipulations in Oregon Cascade Forests. MS Thesis, Oregon State University, Corvallis, OR, USA, 2016. [Google Scholar]
- Brady, N.C.; Weil, R.R. The Nature and Properties of Soils, 14th ed.; Pearson: Upper Saddle River, NJ, USA, 2008. [Google Scholar]
- Staaf, H.; Berg, B. Accumulation and release of plant nutrients in decomposing Scots pine needle litter. Long-term decomposition in a Scots pine forest II. Can. J. Bot. 1982, 60, 1561–1568. [Google Scholar] [CrossRef]
- Fontaine, S.; Barot, S.; Barré, P.; Bdioui, N.; Mary, B.; Rumpel, C. Stability of organic carbon in deep soil layers controlled by fresh carbon supply. Nature 2007, 450, 277–280. [Google Scholar] [CrossRef] [PubMed]
- Carrillo, Y.; Bell, C.; Koyama, A.; Canarini, A.; Boot, C.M.; Wallenstein, M.; Pendall, E. Plant traits, stoichiometry and microbes as drivers of decomposition in the rhizosphere in a temperate grassland. J. Ecol. 2017, 105, 1750–1765. [Google Scholar] [CrossRef]
- Kalbitz, K.; Solinger, S.; Park, J.-H.; Michalzik, B.; Matzner, E. Controls on the dynamics of dissolved organic matter in soils: A review. Soil Sci. 2000, 165, 277–304. [Google Scholar] [CrossRef]
- Schmidt, M.W.I.; Torn, M.S.; Abiven, S.; Dittmar, T.; Guggenberger, G.; Janssens, I.A.; Kleber, M.; Kögel-Knabner, I.; Lehmann, J.; Manning, D.A.; et al. Persistence of soil organic matter as an ecosystem property. Nature 2011, 478, 49–56. [Google Scholar] [CrossRef] [PubMed]
- Harrison, R.B.; Footen, P.W.; Strahm, B.D. Deep soil horizons: Contribution and importance to soil carbon pools and in assessing whole-ecosystem response to management and global change. For. Sci. 2011, 57, 67–76. [Google Scholar]
- Hicks Pries, C.E.; Schuur, E.A.G.; Natali, S.M.; Crummer, K.G. Old soil carbon losses increase with ecosystem respiration in experimentally thawed tundra. Nat. Clim. Chang. 2016, 6, 214–218. [Google Scholar] [CrossRef]
- Neff, J.C.; Asner, G.P. Dissolved organic carbon in terrestrial ecosystems: Synthesis and a model. Ecosystems 2001, 4, 29–48. [Google Scholar] [CrossRef]
- Sanderman, J.; Baldock, J.A.; Amundson, R.; Baldock, J.A. Dissolved organic carbon chemistry and dynamics in contrasting forest and grassland soils. Biogeochemistry 2008, 89, 181–198. [Google Scholar] [CrossRef]
- Strahm, B.D.; Harrison, R.B.; Terry, T.A.; Harrington, T.B.; Adams, A.B.; Footen, P.W. Changes in dissolved organic matter with depth suggest the potential for postharvest organic matter retention to increase subsurface soil carbon pools. For. Ecol. Manag. 2009, 258, 2347–2352. [Google Scholar] [CrossRef]
- Deb, S.K.; Shukla, M.K. A review of dissolved organic matter transport processes affecting soil and environmental quality. J. Environ. Anal. Toxicol. 2011, 1. [Google Scholar] [CrossRef]
- Bundt, M.; Widmer, F.; Pesaro, M.; Zeyer, J.; Blaser, P. Preferential flow paths: Biological “hot spots” in soils. Soil Biol. Biochem. 2001, 33, 729–738. [Google Scholar] [CrossRef]
- Hagedorn, F.; Bundt, M. The age of preferential flow paths. Geoderma 2002, 108, 119–132. [Google Scholar] [CrossRef]
- Strahm, B.D.; Harrison, R.B.; Terry, T.A.; Flaming, B.L.; Licata, C.W.; Petersen, K.S. Soil solution nitrogen concentrations and leaching rates as influenced by organic matter retention on a highly productive Douglas-fir site. For. Ecol. Manag. 2005, 218, 74–88. [Google Scholar] [CrossRef]
- Emmett, B.A.; Anderson, J.M.; Hornung, M. The controls on dissolved nitrogen losses following two intensities of harvesting in a Sitka spruce forest (N. Wales). For. Ecol. Manag. 1991, 41, 65–80. [Google Scholar] [CrossRef]
- Nieminen, M. Export of dissolved organic carbon, nitrogen and phosphorus following clear-cutting of three Norway spruce forests growing on drained peatlands in southern Finland. Silva Fenn. 2004, 38, 123–132. [Google Scholar] [CrossRef]
- Staaf, H.; Olsson, B.A. Effects of slash removal and stump harvesting on soil water chemistry in a clearcutting in SW Sweden. Scand. J. For. Res. 1994, 9, 305–310. [Google Scholar] [CrossRef]
- Rosén, K.; Lundmark-Thelin, A. Increased nitrogen leaching under piles of slash—A consequence of modern forest harvesting techniques. Scand. J. For. Res. 1987, 2, 21–29. [Google Scholar] [CrossRef]
- Fox, T.R. Nitrogen mineralization following fertilization of Douglas-fir forests with urea in western Washington. Soil Sci. Soc. Am. J. 2004, 68, 1720–1728. [Google Scholar] [CrossRef]
- Laudon, H.; Hedtjärn, J.; Schelker, J.; Bishop, K.; Sørensen, R.; Agren, A. Response of dissolved organic carbon following forest harvesting in a boreal forest. Ambio 2009, 38, 381–386. [Google Scholar] [CrossRef] [PubMed]
- Mobley, M.L.; Lajtha, K.; Kramer, M.G.; Bacon, A.R.; Heine, P.R.; Richter, D.D. Surficial gains and subsoil losses of soil carbon and nitrogen during secondary forest development. Glob. Chang. Biol. 2015, 21, 986–996. [Google Scholar] [CrossRef] [PubMed]
- Diochon, A.C.; Kellman, L. Physical fractionation of soil organic matter: Destabilization of deep soil carbon following harvesting of a temperate coniferous forest. J. Geophys. Res. Biogeosci. 2009, 114, 1–9. [Google Scholar] [CrossRef]
- Richter, D.D.; Markewitz, D.; Trumbore, S.E.; Wells, C.G. Rapid accumulation and turnover of soil carbon in a re-establishing forest. Nature 1999, 400, 56–58. [Google Scholar] [CrossRef]
- Batjes, N.H. Total carbon and nitrogen in the soils of the world. Eur. J. Soil Sci. 1996, 47, 151–163. [Google Scholar] [CrossRef]
- Tarnocai, C.; Canadell, J.G.; Schuur, E.A.G.; Kuhry, P.; Mazhitova, G.; Zimov, S. Soil organic carbon pools in the northern circumpolar permafrost region. Glob. Biogeochem. Cycles 2009, 23. [Google Scholar] [CrossRef]
- Stone, E.L.; Kalisz, P.J. On the maximum extent of tree roots. For. Ecol. Manag. 1991, 46, 59–102. [Google Scholar] [CrossRef]
- Jandl, R.; Rodeghiero, M.; Martinez, C.; Cotrufo, M.F.; Bampa, F.; van Wesemael, B.; Harrison, R.B.; Guerrini, I.A.; deB Richter, D., Jr.; Rustad, L.; et al. Current status, uncertainty and future needs in soil organic carbon monitoring. Sci. Total Environ. 2014, 468–469, 376–383. [Google Scholar] [CrossRef] [PubMed]
- Curtis, R.O. A simple index of stand density for Douglas-fir. For. Sci. 1982, 28, 92–94. [Google Scholar]
- PRISM Climate Group. Oregon State University, Corvallis, OR, USA, created 4 Feb 2004. Available online: http://prism.oregonstate.edu (accessed on 17 February 2017).
- Gross, C.D.; Harrison, R.B. Quantifying and comparing soil carbon stocks: Underestimation with the core sampling method. Soil Sci. Soc. Am. J. 2018. [Google Scholar] [CrossRef]
- Hamburg, S.P. Simple rules for measuring changes in ecosystem carbon in forestry-offset projects. Mitag. Adapt. Strateg. Glob. Chang. 2000, 5, 25–37. [Google Scholar] [CrossRef]
- Holub, S.M. Soil Carbon Change in Pacific Northwest Coastal Douglas-Fir Forests: Change Detection Following Harvest—Soils Establishment Report; Weyerhaeuser NR, Timberlands Technology, Production Forestry West: Albany, OR, USA, 2011. [Google Scholar]
- Harrison, R.B.; Adams, A.B.; Licata, C.; Flaming, B.; Wagoner, G.L.; Carpenter, P.; Vance, E.D. Quantifying deep-soil and coarse-soil fractions: Avoiding sampling bias. Soil Sci. Soc. Am. J. 2003, 67, 1602–1606. [Google Scholar] [CrossRef]
- Soil Survey Staff, Natural Resources Conservation Service, United States Department of Agriculture. Web Soil Survey. Available online: https://websoilsurvey.sc.egov.usda.gov/ (accessed on 5 July 2017).
- Walthert, L.; Graf, U.; Kammer, A.; Luster, J.; Pezzotta, D.; Zimmermann, S.; Hagedorn, F. Determination of organic and inorganic carbon, δ13C, and nitrogen in soils containing carbonates after acid fumigation with HCl. J. Plant Nutr. Soil Sci. 2010, 173, 207–216. [Google Scholar] [CrossRef]
- Tisdall, A.L. Comparison of methods of determining apparent density of soils. Aust. J. Agric. Res. 1951, 2, 349–354. [Google Scholar] [CrossRef]
- Wendt, J.W.; Hauser, S. An equivalent soil mass procedure for monitoring soil organic carbon in multiple soil layers. Eur. J. Soil Sci. 2013, 64, 58–65. [Google Scholar] [CrossRef]
- Wendt, J.W. ESM Sample Spreadsheets, 2012. Available online: https://drive.google.com/file/d/0BzxNFfzLbFxjSG9RWlpwQ0FXc0k/view?usp=sharing (accessed on 16 May 2017).
- Lee, J.; Hopmans, J.W.; Rolston, D.E.; Baer, S.G.; Six, J. Determining soil carbon stock changes: Simple bulk density corrections fail. Agric. Ecosyst. Environ. 2009, 134, 251–256. [Google Scholar] [CrossRef]
- Throop, H.L.; Archer, S.R.; Monger, H.C.; Waltman, S. When bulk density methods matter: Implications for estimating soil organic carbon pools in rocky soils. J. Arid Environ. 2012, 77, 66–71. [Google Scholar] [CrossRef]
- Zabowski, D.; Whitney, N.; Gurung, J.; Hatten, J. Total soil carbon in the coarse fraction and at depth. For. Sci. 2011, 57, 11–18. [Google Scholar] [CrossRef]
- Corti, G.; Ugolini, F.C.; Agnelli, A.; Certini, G.; Cuniglio, R.; Berna, F.; Fernández Sanjurjo, M.J. The soil skeleton, a forgotten pool of carbon and nitrogen in soil. Eur. J. Soil Sci. 2002, 53, 283–298. [Google Scholar] [CrossRef]
- Whitney, N.; Zabowski, D. Soil total nitrogen in the coarse fraction and at depth. Soil Sci. Soc. Am. J. 2004, 68, 612–619. [Google Scholar] [CrossRef]
- Jenkins, J.C.; Chojnacky, D.C.; Heath, L.S.; Birdsey, R.A. National-scale biomass estimators for United States tree species. For. Sci. 2003, 49, 12–35. [Google Scholar]
- Miles, P.D.; Smith, W.B. Specific Gravity and Other Properties of Wood and Bark for 156 Tree Species Found in North America; US Department of Agriculture, Forest Service, Northern Research Station: Newtown Square, PA, USA, 2009.
- Birdsey, R.A. Carbon Storage and Accumulation in United States Forest Ecosystems; United States Department of Agriculture, Forest Service, Northeastern Forest Experiment Station: Radnor, PA, USA, 1992.
- Zar, J.H. Biostatistical Analysis, 5th ed.; Prentice-Hall/Pearson: Upper Saddle River, NJ, USA, 2010. [Google Scholar]
- RStudio Team. RStudio: Integrated Development for R; RStudio Inc.: Boston, MA, USA, 2016. [Google Scholar]
- Schrumpf, M.; Schulze, E.D.; Kaiser, K.; Schumacher, J. How accurately can soil organic carbon stocks and stock changes be quantified by soil inventories? Biogeosciences 2011, 8, 1193–1212. [Google Scholar] [CrossRef]
- Wuest, S.B. Correction of bulk density and sampling method biases using soil mass per unit area. Soil Sci. Soc. Am. J. 2009, 73, 312. [Google Scholar] [CrossRef]
- Mikha, M.M.; Benjamin, J.G.; Halvorson, A.D.; Nielsen, D.C. Soil carbon changes influenced by soil management and calculation method. Open J. Soil Sci. 2013, 3, 123–131. [Google Scholar] [CrossRef]
- Ellert, B.H.; Bettany, J.R. Calculation of organic matter and nutrients stored in soils under contrasting management regimes. Can. J. Soil Sci. 1995, 75, 529–538. [Google Scholar] [CrossRef]
- Post, W.M.; Kwon, K.C.A. Soil carbon sequestration and land-use change: Processes and potential. Glob. Chang. Biol. 2000, 6, 317–327. [Google Scholar] [CrossRef]
- Raich, J.W.; Schlesinger, W.H. The global carbon dioxide flux in soil respiration and its relationship to vegetation and climate. Tellus B 1992, 44, 81–99. [Google Scholar] [CrossRef]
- Tang, J.; Qi, Y.; Xu, M.; Misson, L.; Goldstein, A.H. Forest thinning and soil respiration in a ponderosa pine plantation in the Sierra Nevada. Tree Physiol. 2005, 25, 57–66. [Google Scholar] [CrossRef] [PubMed]
- Lin, H. Three principles of soil change and pedogenesis in time and space. Soil Sci. Soc. Am. J. 2011, 75, 2049. [Google Scholar] [CrossRef]
- Jackson, R.B.; Canadell, J.; Ehleringer, J.R.; Mooney, H.A.; Sala, O.E.; Schulze, E.D. A global analysis of root distributions for terrestrial biomes. Oecologia 1996, 108, 389–411. [Google Scholar] [CrossRef] [PubMed]
- Fierer, N.; Schimel, J.P.; Holden, P.A. Variations in microbial community composition through two soil depth profiles. Soil Biol. Biochem. 2003, 35, 167–176. [Google Scholar] [CrossRef]
- Davidson, S. Combating soil acidity: Three approaches. Rural Res. 1987, 134, 4–10. [Google Scholar]
- James, J.N.; Dietzen, C.; Furches, J.C.; Harrison, R.B. Lessons on buried horizons and pedogenesis from deep forest soils. Soil Horizons 2015, 56. [Google Scholar] [CrossRef]
- Chang, S.X.; Preston, C.M. Understorey competition affects tree growth and fate of fertilizer-applied 15N in a coastal British Columbia plantation forest: 6-year results. Can. J. For. Res. 2000, 30, 1379–1388. [Google Scholar] [CrossRef]
- Footen, P.W.; Harrison, R.B.; Strahm, B.D. Long-term effects of nitrogen fertilization on the productivity of subsequent stands of Douglas-fir in the Pacific Northwest. For. Ecol. Manag. 2009, 258, 2194–2198. [Google Scholar] [CrossRef]
- Zhang, H.; Wu, H.; Yu, Q.; Wang, Z.; Wei, C.; Long, M.; Kattge, J.; Smith, M.; Han, X. Sampling date, leaf age and root size: Implications for the study of plant C:N:P stoichiometry. PLoS ONE 2013, 8. [Google Scholar] [CrossRef] [PubMed]
- Smith, A.P.; Marín-Spiotta, E.; Balser, T. Successional and seasonal variations in soil and litter microbial community structure and function during tropical postagricultural forest regeneration: A multiyear study. Glob. Chang. Biol. 2015, 21, 3532–3547. [Google Scholar] [CrossRef] [PubMed]


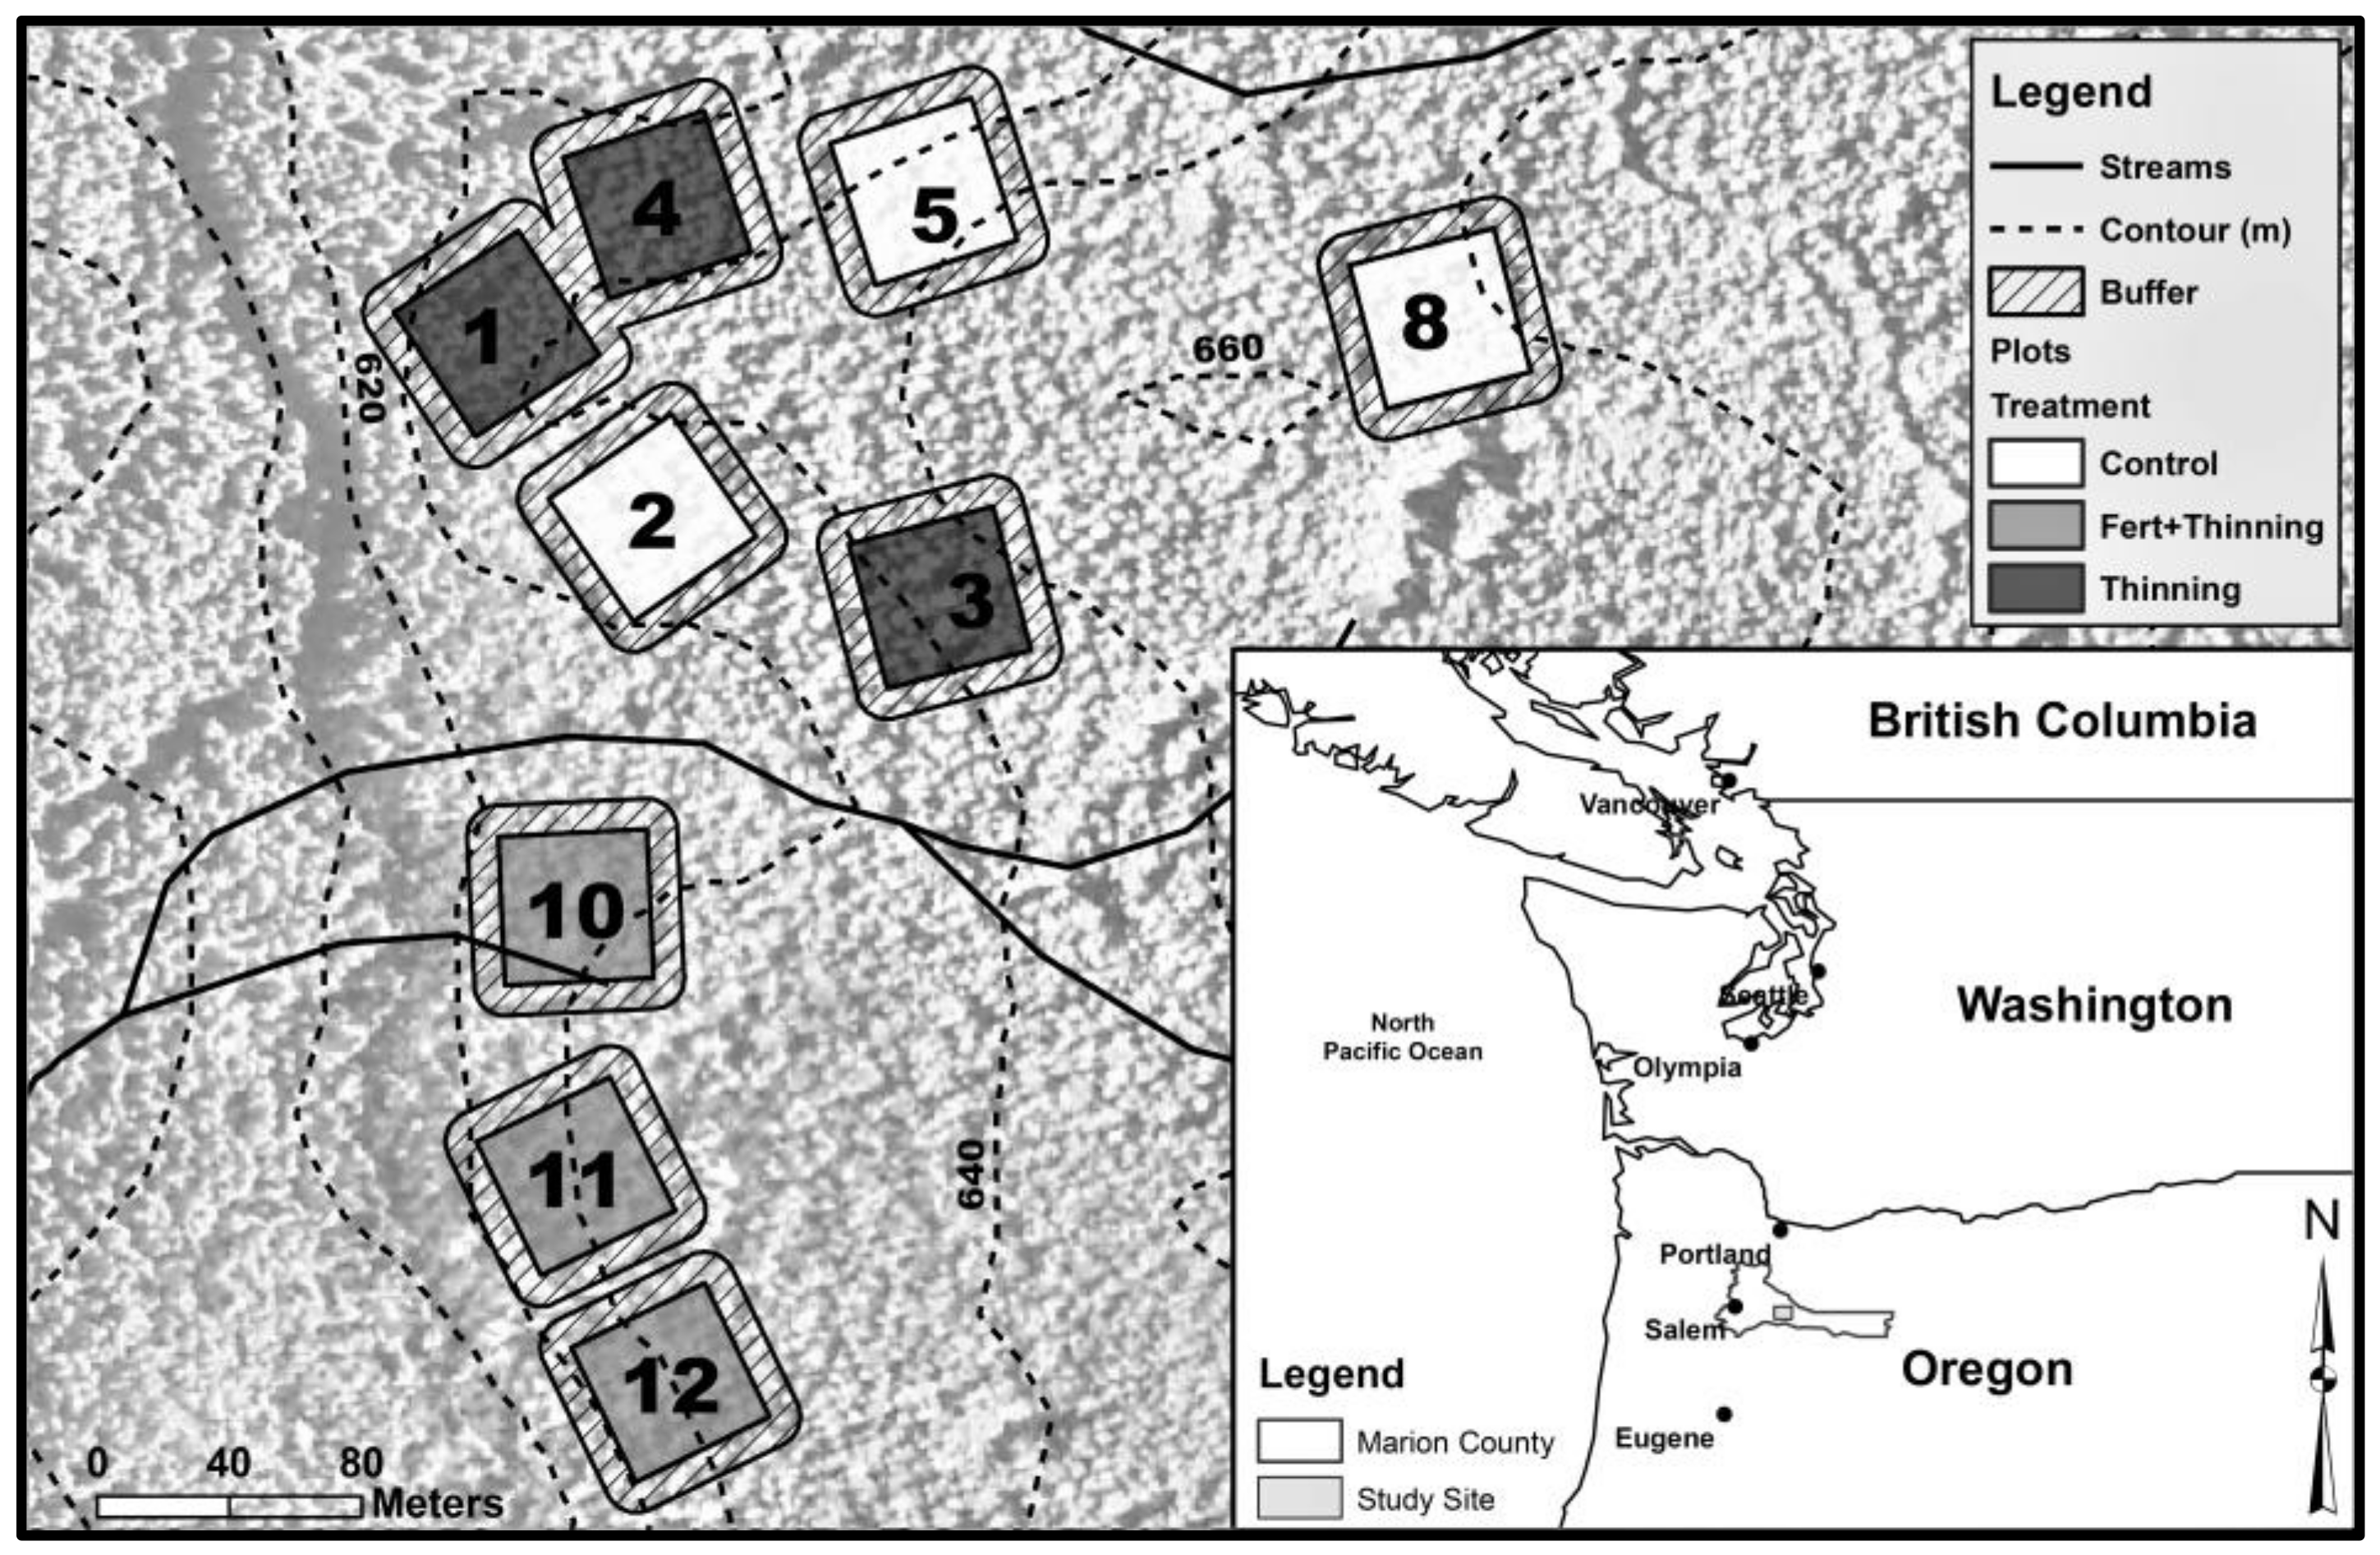
| Plot | Initial Trees (ha−1) | Treatment Group | Fertilized § | Thinning Treatment | Thinning Year | Stems Left on Forest Floor # |
|---|---|---|---|---|---|---|
| 1 | 1117 | Thinning | No | RD55→RD35 | 2001 | Yes |
| 2 | 297 † | Control | No | None | - | - |
| 3 | 558 ‡ | Thinning | No | RD55→RD35 | 2011 | No |
| 4 | 1181 | Thinning | No | RD55→RD35 | 1999 | Yes |
| 5 | 1196 | Control | No | None | - | - |
| 8 | 554 ‡ | Control | No | None | - | - |
| 10 | 1240 | Fert + Thinning | Yes | RD55→RD35 | 1997 | Yes |
| RD55→RD40 | 2005 | No | ||||
| 11 | 558 ‡ | Fert + Thinning | Yes | RD55→RD35 | 2009 | No |
| 12 | 311 † | Fert + Thinning | Yes | None | - | - |
| Horizons | Depth (cm) | Color (moist) | Texture | Structure | Roots | Rock (%) |
|---|---|---|---|---|---|---|
| Oi | 3.5–0 | Gr < 2% | ||||
| Cb < 5% | ||||||
| St < 5% | ||||||
| A | 0–15 | 10 YR 3/3 dark brown | Sandy clay loam | Medium to coarse granular, weak to moderate | Many fine, medium, and coarse | Gr < 2% |
| Cb < 5% | ||||||
| St < 5% | ||||||
| BA | 15–30 | 10YR 3/4 dark yellowish brown | Sandy clay | Medium to coarse subangular blocky, moderate | Many fine and medium; few coarse | Gr < 2% |
| Cb < 5% | ||||||
| St < 5% | ||||||
| Bt1 | 30–80 | 5YR 4/4 reddish brown | Sandy clay to clay | Coarse to very coarse subangular blocky, moderate to strong | Common fine, few medium; very few coarse | Gr < 2% |
| Cb < 5% | ||||||
| St < 5% | ||||||
| Bt2 | 80–150+ | 10YR 4/4 dark yellowish brown | Sandy clay | Coarse subangular blocky, moderate | Few fine and medium; very few coarse | Gr < 2% |
| Cb < 5% | ||||||
| St < 5% |
© 2018 by the authors. Licensee MDPI, Basel, Switzerland. This article is an open access article distributed under the terms and conditions of the Creative Commons Attribution (CC BY) license (http://creativecommons.org/licenses/by/4.0/).
Share and Cite
Gross, C.D.; James, J.N.; Turnblom, E.C.; Harrison, R.B. Thinning Treatments Reduce Deep Soil Carbon and Nitrogen Stocks in a Coastal Pacific Northwest Forest. Forests 2018, 9, 238. https://doi.org/10.3390/f9050238
Gross CD, James JN, Turnblom EC, Harrison RB. Thinning Treatments Reduce Deep Soil Carbon and Nitrogen Stocks in a Coastal Pacific Northwest Forest. Forests. 2018; 9(5):238. https://doi.org/10.3390/f9050238
Chicago/Turabian StyleGross, Cole D., Jason N. James, Eric C. Turnblom, and Robert B. Harrison. 2018. "Thinning Treatments Reduce Deep Soil Carbon and Nitrogen Stocks in a Coastal Pacific Northwest Forest" Forests 9, no. 5: 238. https://doi.org/10.3390/f9050238
APA StyleGross, C. D., James, J. N., Turnblom, E. C., & Harrison, R. B. (2018). Thinning Treatments Reduce Deep Soil Carbon and Nitrogen Stocks in a Coastal Pacific Northwest Forest. Forests, 9(5), 238. https://doi.org/10.3390/f9050238