Article

Evidence of Ash Tree (Fraxinus spp.) Specific Associations with Soil Bacterial Community Structure and Functional Capacity

by
Michael P. Ricketts
1,*,
Charles E. Flower
1,2,
Kathleen S. Knight
2 and
Miquel A. Gonzalez-Meler
1
1
Biological Sciences Department, Ecology and Evolution, University of Illinois at Chicago, 845 W. Taylor St., Chicago, IL 60607, USA
2
USDA Forest Service, Northern Research Station, 359 Main Rd, Delaware, OH 43015, USA
*
Author to whom correspondence should be addressed.
Forests 2018, 9(4), 187; https://doi.org/10.3390/f9040187
Submission received: 1 March 2018 / Revised: 29 March 2018 / Accepted: 3 April 2018 / Published: 5 April 2018
(This article belongs to the Special Issue Understanding and Managing Emerald Ash Borer Impacts on Ash Forests)

Abstract

:
The spread of the invasive emerald ash borer (EAB) across North America has had enormous impacts on temperate forest ecosystems. The selective removal of ash trees (Fraxinus spp.) has resulted in abnormally large inputs of coarse woody debris and altered forest tree community composition, ultimately affecting a variety of ecosystem processes. The goal of this study was to determine if the presence of ash trees influences soil bacterial communities and/or functions to better understand the impacts of EAB on forest successional dynamics and biogeochemical cycling. Using 16S rRNA amplicon sequencing of soil DNA collected from ash and non-ash plots in central Ohio during the early stages of EAB infestation, we found that bacterial communities in plots with ash differed from those without ash. These differences were largely driven by Acidobacteria, which had a greater relative abundance in non-ash plots. Functional genes required for sulfur cycling, phosphorus cycling, and carbohydrate metabolism (specifically those which breakdown complex sugars to glucose) were estimated to be more abundant in non-ash plots, while nitrogen cycling gene abundance did not differ. This ash-soil microbiome association implies that EAB-induced ash decline may promote belowground successional shifts, altering carbon and nutrient cycling and changing soil properties beyond the effects of litter additions caused by ash mortality.

Graphical Abstract

1. Introduction

Anthropogenic disturbances to Earth’s ecosystems have the potential to alter the abundances and distributions of organisms worldwide, [1,2] and therefore the structure and function of their environments [3,4,5,6]. Such disturbances include warming air temperatures, changing precipitation patterns, severe weather events, atmospheric nutrient deposition, or the introduction of invasive species. In temperate forest ecosystems of eastern North America, ash trees (Fraxinus spp.) have suffered significant declines over the past two decades due to the infestation of the invasive emerald ash borer (EAB; Agrilus planipennis), a wood boring beetle introduced from Asia [7,8]. The EAB selectively deposits eggs on the bark of ash trees where hatched larvae burrow into cambial tissue to feed, creating serpentine galleries and severing the distribution of water and nutrients between the roots and shoots [9]. This results in ~99% ash tree mortality within two to five years after infestation [10,11] and complete mortality within a stand in roughly five to seven years [12]. Ash trees are widely distributed throughout North America and are a major component of forest and urban tree communities, representing roughly 2.5% of the aboveground biomass stocks in the US and storing ~0.303 Pg of carbon (C) [13,14,15,16]. The widespread decline of ash has multiple cascading effects on ecosystem productivity, structure, and function, as the transformation from live standing biomass to fallen trees [17], plant litter, and soil organic matter (SOM) unfolds. Specifically, rapidly reduced water flux and plant respiration, coupled with large inputs of coarse woody debris and altered tree community composition, may significantly alter ecosystem hydrology, C and nutrient dynamics, forest tree community succession, edaphic factors, and belowground microbial community structure and function [9,18,19,20].
Soil microorganisms play a key role in the decomposition of SOM and regulation of nutrient availability to plants [21,22], both of which have important implications for ecosystem biogeochemical cycling and net primary productivity (NPP) [23]. Microbial functional responses to disturbances or environmental shifts, such EAB-induced ash decline, are dependent on the microbial community’s resilience to change and the degree of functional redundancy within the community [24]. While functional redundancies often exist between microbial taxa, large shifts in microbial community structure may result in the altered functional capacity of the community to access and degrade SOM or perform nutrient transformations and mobilization [24,25,26,27]. Thus, identifying factors that influence microbial community structure is important to understanding potential changes in the functions of decomposers. A variety of edaphic factors are thought to influence soil microorganisms, including pH, C-availability, moisture, O2 availability, and bulk density [28]. In particular, soil pH has been shown to be one of the governing forces driving soil microbial community structure [29,30,31]. Aboveground vegetation may also influence belowground microbial community structure, with specific plant species associating with (and even recruiting) unique microbial assemblages [32,33,34]. These above-belowground associations are most often studied at the community or ecosystem level (e.g., forest vs. grassland, deciduous vs. coniferous forests), while soil microbial associations with individual plant species or genera remain poorly understood.
This study aimed to examine soil microbial community associations with ash trees to better understand belowground consequences of EAB disturbance. Microbial functional potentials were estimated with respect to nutrient and C-cycling processes that, in turn, may affect forest recovery trajectories. If soil microbes exhibit a different community structure under stands with ash trees when compared to stands without ash trees, this would suggest a strong, genera specific relationship between the presence of, decline of, or mortality of ash trees and soil microbial communities. If instead belowground microbial communities are similar across the heterogeneous forest landscape, this would indicate a whole forest, community level influence governed by varying degrees of environmental, physical, and edaphic factors. To address these competing hypotheses, we used 16S rRNA metagenomic sequencing methods, which specifically target bacterial and archaeal organisms, to analyze archived soil DNA samples collected from paired ash and non-ash forest plots in 2011 during the early stages of EAB infestation. If differences were observed in the soil bacterial community structure between ash and non-ash plots, then we expected the functional potential to cycle C and nutrients to reflect the specific differences in the bacterial community. This work provides a unique snapshot of soil bacterial communities, their functional potentials, and their associations with dominant tree genera, during the early stages of EAB disturbance in an ash-dominated forest near the core area of infestation.

2. Materials and Methods

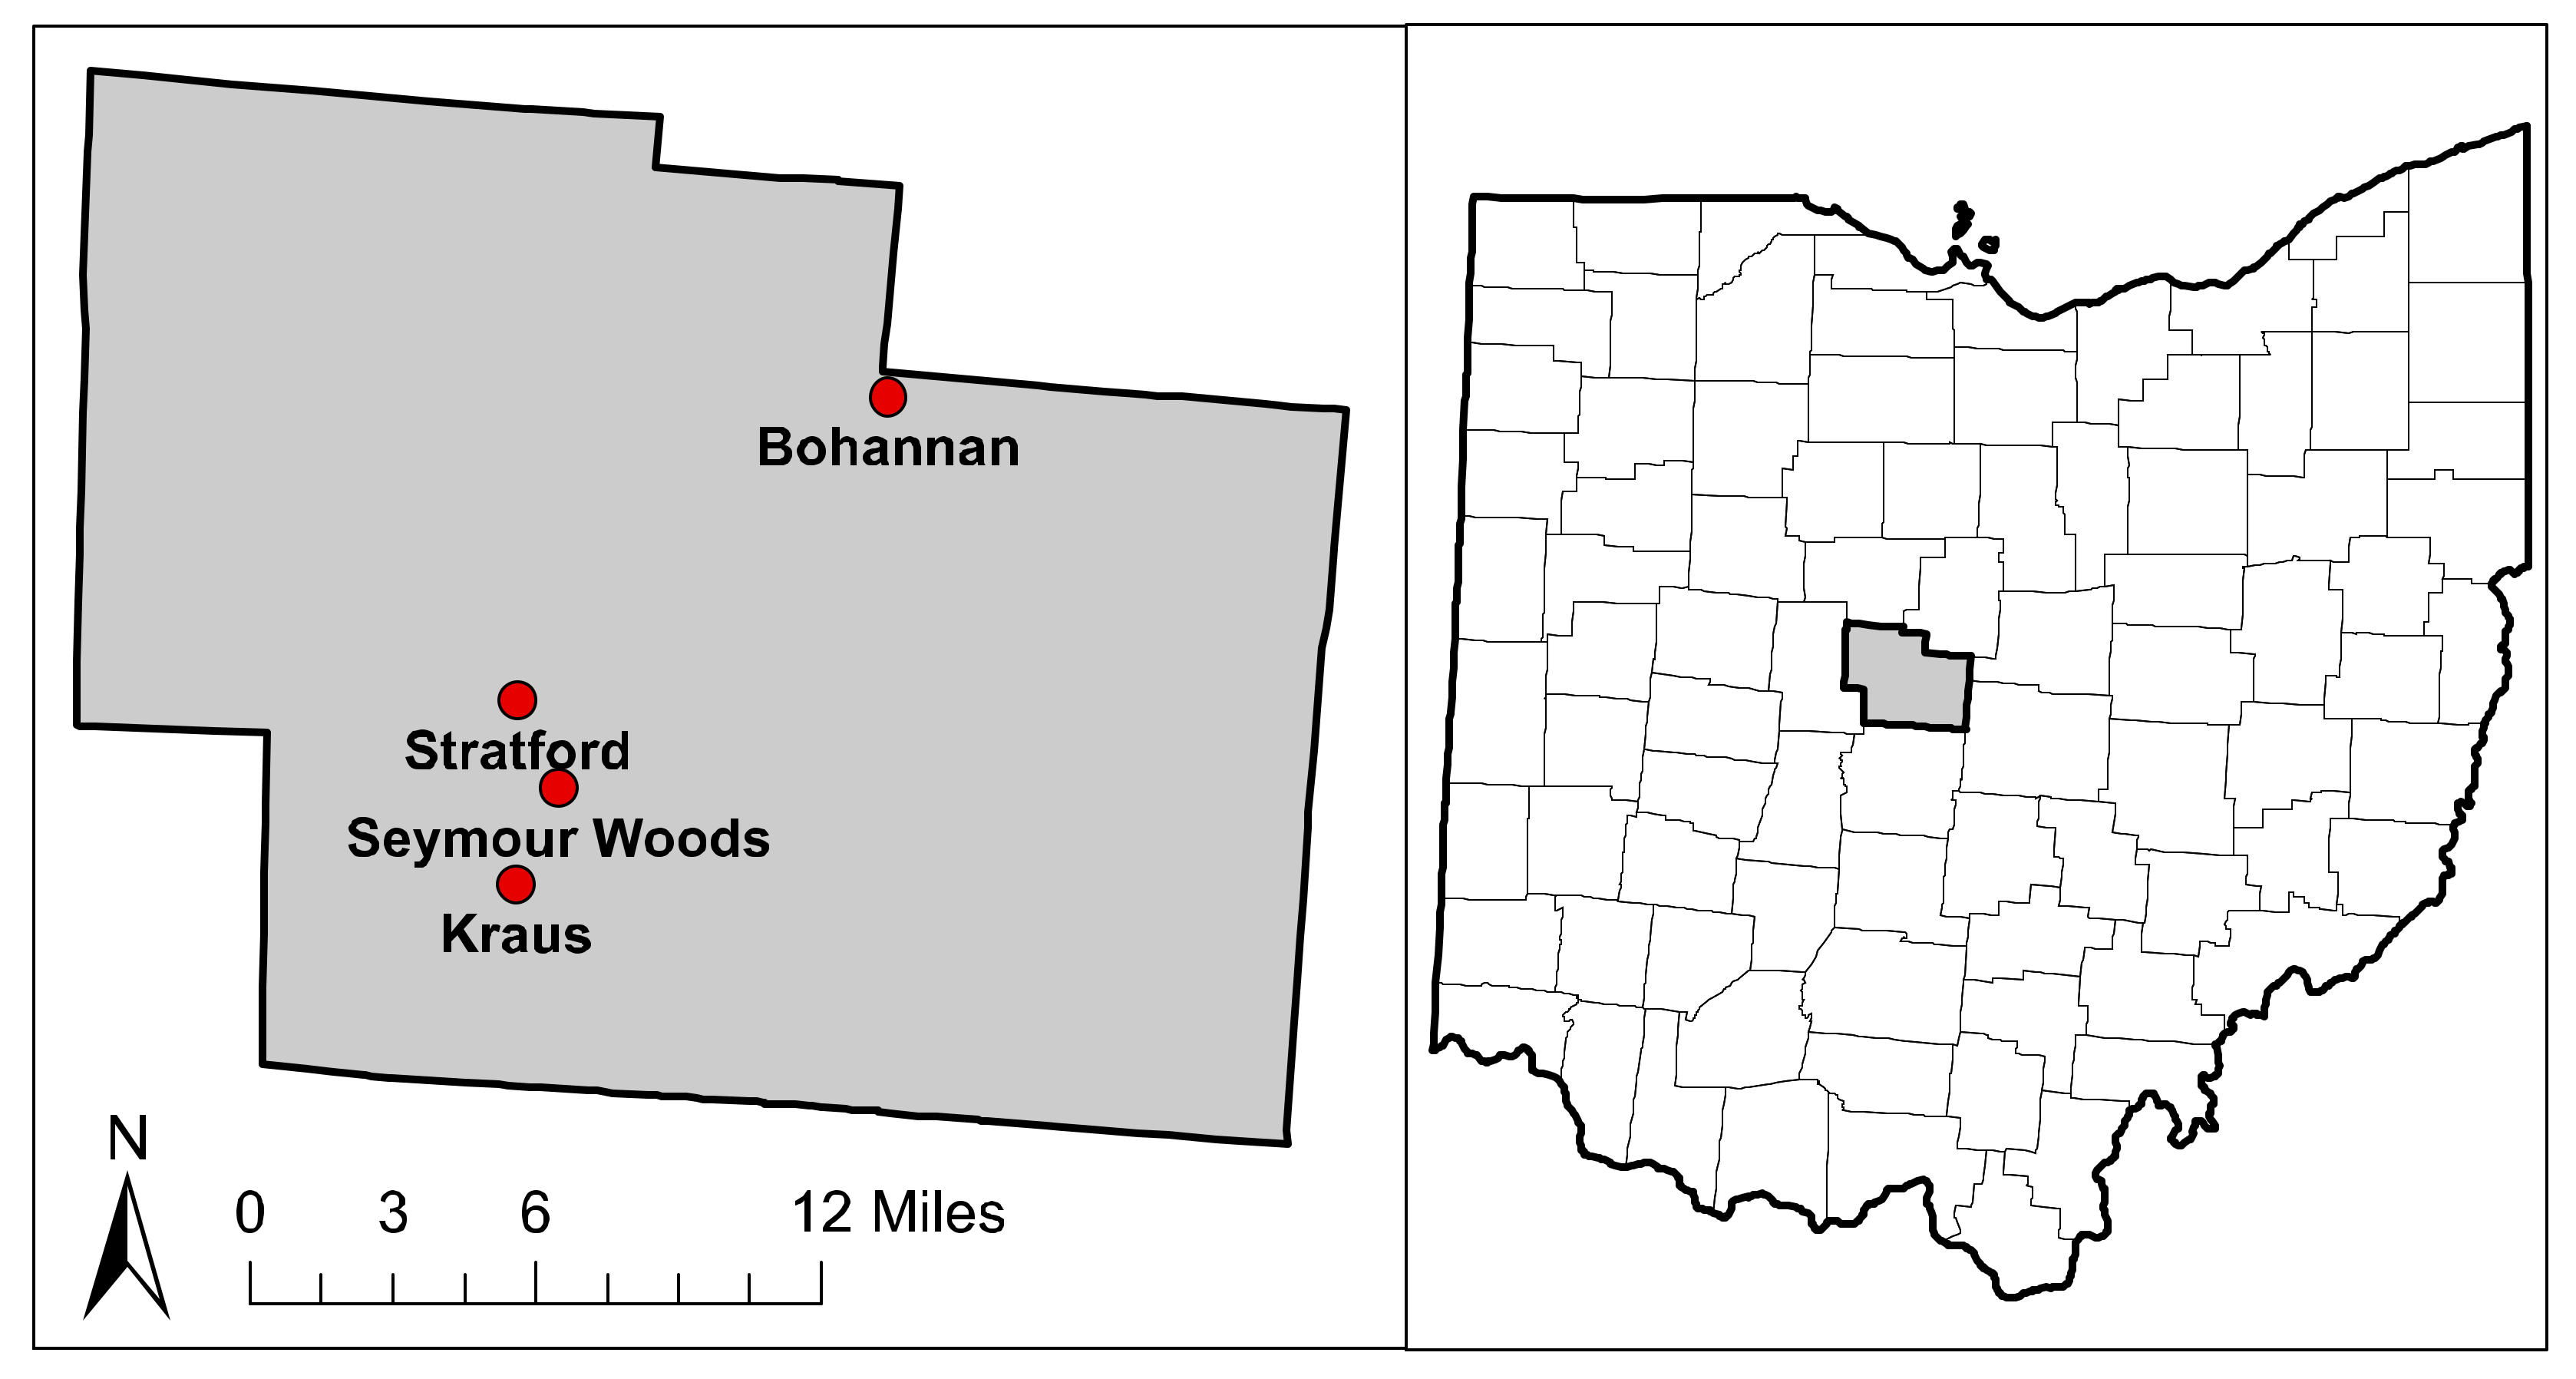
2.1. Site Description

In 2011, four forest sites, Bohannan Nature Preserve (BHN), Kraus Nature Preserve (KRS), Seymour Woods State Nature Preserve (SYM), and Stratford Ecological Center (STR), were selected within Delaware County, Ohio (Figure 1 and Table 1). These sites are secondary successional forests largely dominated by ash (Fraxinus americana L., F. pennsylvanica Marshall and F. quadrangulata). Other canopy tree genera include maple (Acer saccharinum, A. saccharum, A. rubrum), oak (Quercus palustris, Q. rubra, Q. alba.), beech (Fagus grandifolia), shagbark hickory (Carya ovata), cottonwood (Populus deltoids), elm (Ulmus americana, U. rubrum), black cherry (Prunus serotina), black walnut (Juglans nigra), and willow (Salix spp.). In each site, we randomly established two or three “ash” plots (11.28 m radius), which contained ash trees as a major component of the canopy (48.8 ± 4.8% (mean ± S.E.) of total basal area), and two or three “non-ash” plots, which did not contain ash trees as a major component of the understory or canopy (defined as <5% of total basal area; see Table 1 and Table S3 for details). Ash and non-ash plots were located between 50–100 m away from one another and were selected to represent similar topography, soil type, and moisture regimes. Within each plot, trees >10 cm in diameter at breast height were identified and measured and the total basal area (BA) per hectare (m2/ha), number of stems per hectare (#/ha), and relative tree dominance (%) by BA were calculated (Table 1 and Table S3).
By 2011, EAB had reached forests of central Ohio and ash trees had begun to exhibit visual symptoms of infestation at our sites. While this may not be ideal for establishing baseline associations with healthy ash trees, we were able to collect samples in the early stages of EAB infestation before complete ash mortality occurred, which is rapidly becoming more difficult to find in high-density ash tree forests. To quantify the health of trees within the plots, we used ash tree canopy condition (AC), a metric for tracking the health of ash trees exposed to EAB, which is correlated to EAB densities and tree physiology [35,36]. This assessment is a non-linear five-point categorical scale which assigns healthy trees a value of 1 and standing dead trees a value of 5. At the plot-level, ash canopy health was calculated as the mean AC of all ash trees within a plot. To account for the potential effects associated with ash trees in later states of decline, we performed a separate analysis which removed all sites that contained any plots with mean AC scores > 3, resulting in two sites consisting of six ash (AC = 2.42 ± 0.30) and four non-ash plots (Table S1).

2.2. Soil Collection and Characterization

To characterize potential associations between ash trees and soil bacterial communities, we randomly selected 30 locations in each plot and extracted 0–10 cm soil cores with a 1.9 cm diameter soil probe (Oakfield Model L tube sampler soil probe), which was cleaned and sterilized with 100% ethanol between plots. Soils were sampled in late July during the peak period of NPP. Roots were removed and soil samples from each plot were homogenized on site, placed in a cooler with dry ice, and stored at −80 °C until DNA extraction. Soil subsamples were analyzed for pH and a variety of solubilized soil minerals (Ca, K, Mg, P, Al, B, Cu, Fe, Mn, Na, S, and Zn) by the University of Maine Soils Lab using a modified Morgan nutrient extraction procedure and a TJA Model 975 AtomComp ICP-AES. Soil C and nitrogen (N) concentrations (%) were measured at the University of Illinois at Chicago (UIC) Stable Isotope lab using a Costech elemental analyzer (Valencia, CA, USA). Prior to analysis, samples were dried until no mass lost in a 60 °C oven, pulverized using a ball mill, and ~5mg of sample was placed into a tin capsule.

2.3. DNA Extraction, Sequencing, Quality Control and Bioinformatics

DNA was extracted from ~0.25 g of each soil sample using MoBio’s PowerSoil®-htp 96 Well Soil DNA Isolation Kit as per the manufacturer’s protocol. Amplification of the V4 region of the 16S SSU rRNA gene was performed using PCR primers 515F/806R following protocols outlined by the Earth Microbiome Project [37]. Final amplicon DNA concentrations were quantified using the PicoGreen® dsDNA Assay Kit and amplicons were sequenced using an Illumina MiSeq instrument (2 × 150 bp paired-end). All sequences have been deposited in the NCBI Sequence Read Archive under SRA study #SRP136455. Initial sequence data quality filtering, paired-end assembly, demultiplexing, closed reference operational taxonomic unit (OTU) picking, and phylogenetic assignments were performed using the QIIME software package version 1.9.1 (http://qiime.org/) [38]. OTU abundance data was normalized to account for estimated 16S rRNA gene copy number within each OTU assignment using the python script normalize_by_copy_number.py from the PICRUSt software package [39]. OTU picking identified 9387 OTU’s, with an average of 2283 ± 146 OTU’s per sample. In total, there were 39 phyla identified, the 10 most abundant of which encompassed 98% of all bacteria/archaea. Sequences were rarefied at 5900 sequences per sample for diversity analysis. More detailed methods can be found in Ricketts et al., 2016 [25].
The genetic functional potential of bacterial/archaeal communities was determined by estimating gene abundance using the PICRUSt software package version 1.1.0 (http://picrust.github.io/picrust/) [39]. Genetic pathways necessary for biogeochemical metabolisms were selected based on the KEGG ortholog hierarchical system, which is a knowledge database dedicated to linking genomic information to cellular and metabolic functional pathways [40]. This framework allows individual gene abundance data to be collated into broader functional groups, providing a more practical basis for functional gene analysis. We focused our analysis specifically on the energy metabolism and carbohydrate metabolism level 2 KEGG groups. Within these groups, all level 3 KEGG metabolic pathways, organized at a finer functional scale, were also analyzed.

2.4. Statistical Analyses

Bacterial community differences were explored by examining Hellinger transformed abundance data in two ways. First, the bacterial abundance differences of the 10 most abundant phyla (98.1% of total bacteria), the 20 most abundant classes (93.8% of total bacteria), and the 30 most abundant orders (90.9% of total bacteria), were analyzed between ash and non-ash plots using Mann–Whitney U tests and between sites using Kruskal-Wallis and posthoc Nemenyi tests, both with a significance threshold of p < 0.05, using the R statistical program [41]. Second, overall bacterial community structure differences between ash and non-ash plots and between sites, were analyzed by comparing Bray-Curtis dissimilarity matrices of Hellinger transformed bacterial abundances using adonis tests (similar to PERMANOVA) in R with 99,999 permutations. Assumptions of the adonis test were verified using the betadisper function in the R package vegan [42], which tests the multivariate homogeneity of group dispersions (variances). A non-metric multidimensional scaling (NMDS) plot (stress = 0.080, Shepard plot non-metric R2 = 0.994) was created using the R package phyloseq [43] and the same Bray–Curtis dissimilarity matrices to visualize differences in bacterial community structure between ash and non-ash plots and sites.
All other variables, including AC, BA, stem density, relative tree dominance, bacterial and tree alpha-diversities (Shannon diversity index), and soil factors, were analyzed for differences between ash and non-ash plots using Mann-Whitney U tests (p < 0.05) and for differences between sites using Kruskal-Wallis with the posthoc Nemenyi tests (p < 0.05). Euclidean distance matrices constructed from each variable using the dist function in the R package vegan [42] were compared to the soil bacterial community Bray-Curtis distance matrix (described above) using Mantel tests (p < 0.05) to determine how strongly each variable correlated with (or influenced) bacterial community structure. In addition, the overall soil environment was analyzed by combining all soil variables into a single Euclidian dissimilarity matrix, which was tested for ash vs. non-ash differences and site differences using adonis tests and effects on bacterial community structure using a Mantel test. To better understand the effects of EAB-induced tree stress on bacterial community structure within ash plots, linear relationships between mean AC and the ten most abundant bacterial phyla were analyzed and a Mantel test for mean AC (as described above) was performed using only ash plots.
Ash vs. non-ash differences in PICRUSt estimated functional gene abundances for the selected KEGG ortholog groups were tested in STAMP [44] using Welch’s two-tailed t-test. To assess the significance and adjust for potential false discoveries, we utilized the Benjamini-Hochberg procedure where original p-values were ranked in order of significance, multiplied by the number of comparisons (Lvl 2 n = 64, Lvl 3 n = 328), and divided by their respective rank numbers to obtain a corrected p-value (q-value). The significance threshold used was q < 0.05. In addition, Pearson’s correlations were used to determine relationships between Hellinger transformed bacterial phyla abundance and level 3 KEGG ortholog functional group gene abundance. To account for potential false discoveries here, we used the more conservative Bonferroni adjustment, where original p-values are simply multiplied by the number of comparisons (n = 240) and assigned a threshold of p < 0.05. It is important to remember that relationships between bacterial abundance and gene abundance are predetermined by algorithms used by the PICRUSt software, as all estimated gene abundance information is directly derived from bacterial abundance data in combination with genomic databases. However, it does provide information on inherent functional relationships within each bacterial phylum and reveals potential differences in function as a result of abundance differences in individual bacterial taxonomic groups.

3. Results

3.1. Environmental and Site Differences

The overall soil environment was similar between ash and non-ash plots (adonis H = 0.098, p = 0.065), but differed across sites (adonis H = 0.301, p = 0.003). Specifically, only two of the 16 soil variables, Cu (W = 12.5, p = 0.006) and Fe (W = 18, p = 0.016), differed between ash and non-ash plots (Table 2), where Cu and Fe were both greater in non-ash plots. Between sites, the %C (H = 11.51, p = 0.009), %N (H = 12.96, p = 0.005), C:N (H = 10.15, p = 0.017), P (H = 12.35, p = 0.006), Al (H = 9.71, p = 0.021), and Zn (H = 9.79, p = 0.020) were different (Table 2). Posthoc tests revealed both %C and %N to be significantly lower at SYM compared to the other sites, while C:N remained constant across sites, with the exception of being significantly lower at BHN. Similarly, soil P, Al, and Zn were lower at SYM (Table S2).
Analysis of non-soil variables revealed ash tree health (mean AC) to be variable between sites (H = 9.24, p = 0.026; Table 2). Total BA (m2/ha) did not differ between ash and non-ash plots or between sites, although it was somewhat lower at SYM where the stem density (#/ha) was highest (H = 8.78, p = 0.032) due to a large number of small trees (Tables S2 and S3). Of the five most abundant tree genera, only oak species relative dominance differed between ash and non-ash plots (p = 0.003) and only beech tree relative dominance differed between sites (p = 0.007; Table 2). Oak trees had a higher relative dominance in non-ash plots vs. ash plots and beech trees were more dominant in KRS than any of the other sites. Tree community alpha-diversity was not different between plots (W = 60.5, p = 0.425) or sites (H = 5.67, p = 0.129) and did not correlate with the soil bacterial community (mantel r-statistic = −0.048, p = 0.631; Table 2 and Table S2).

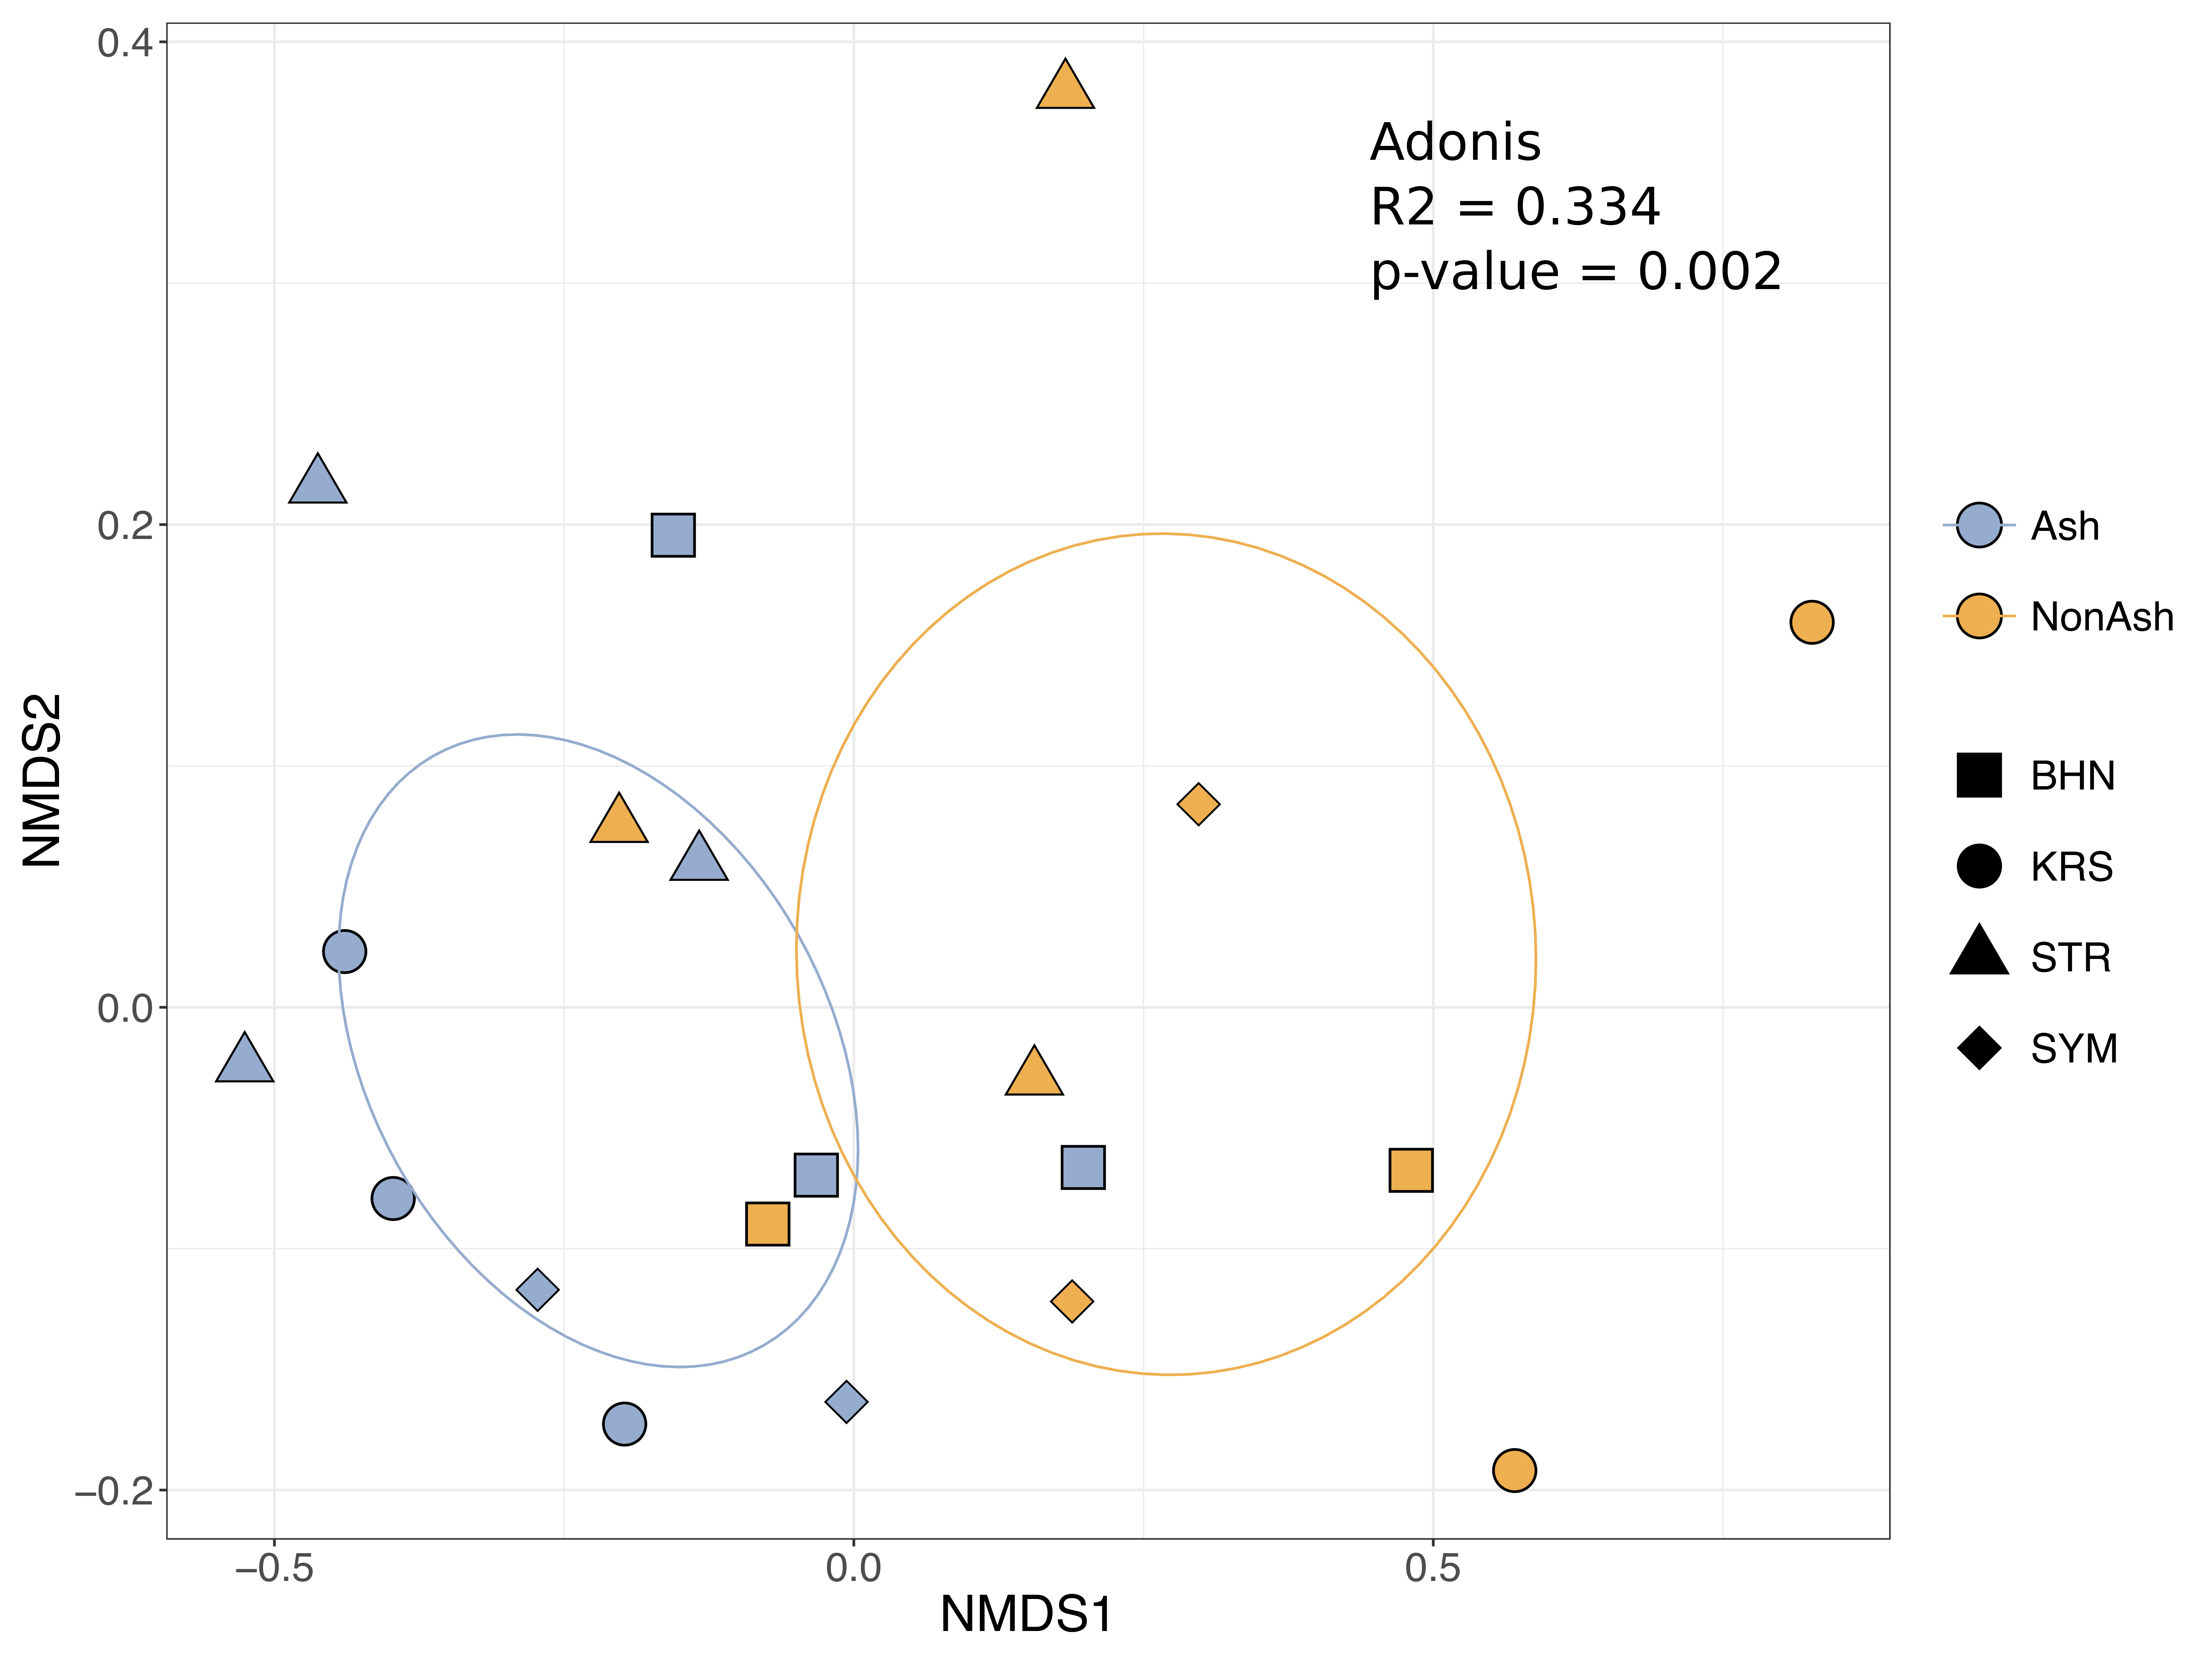
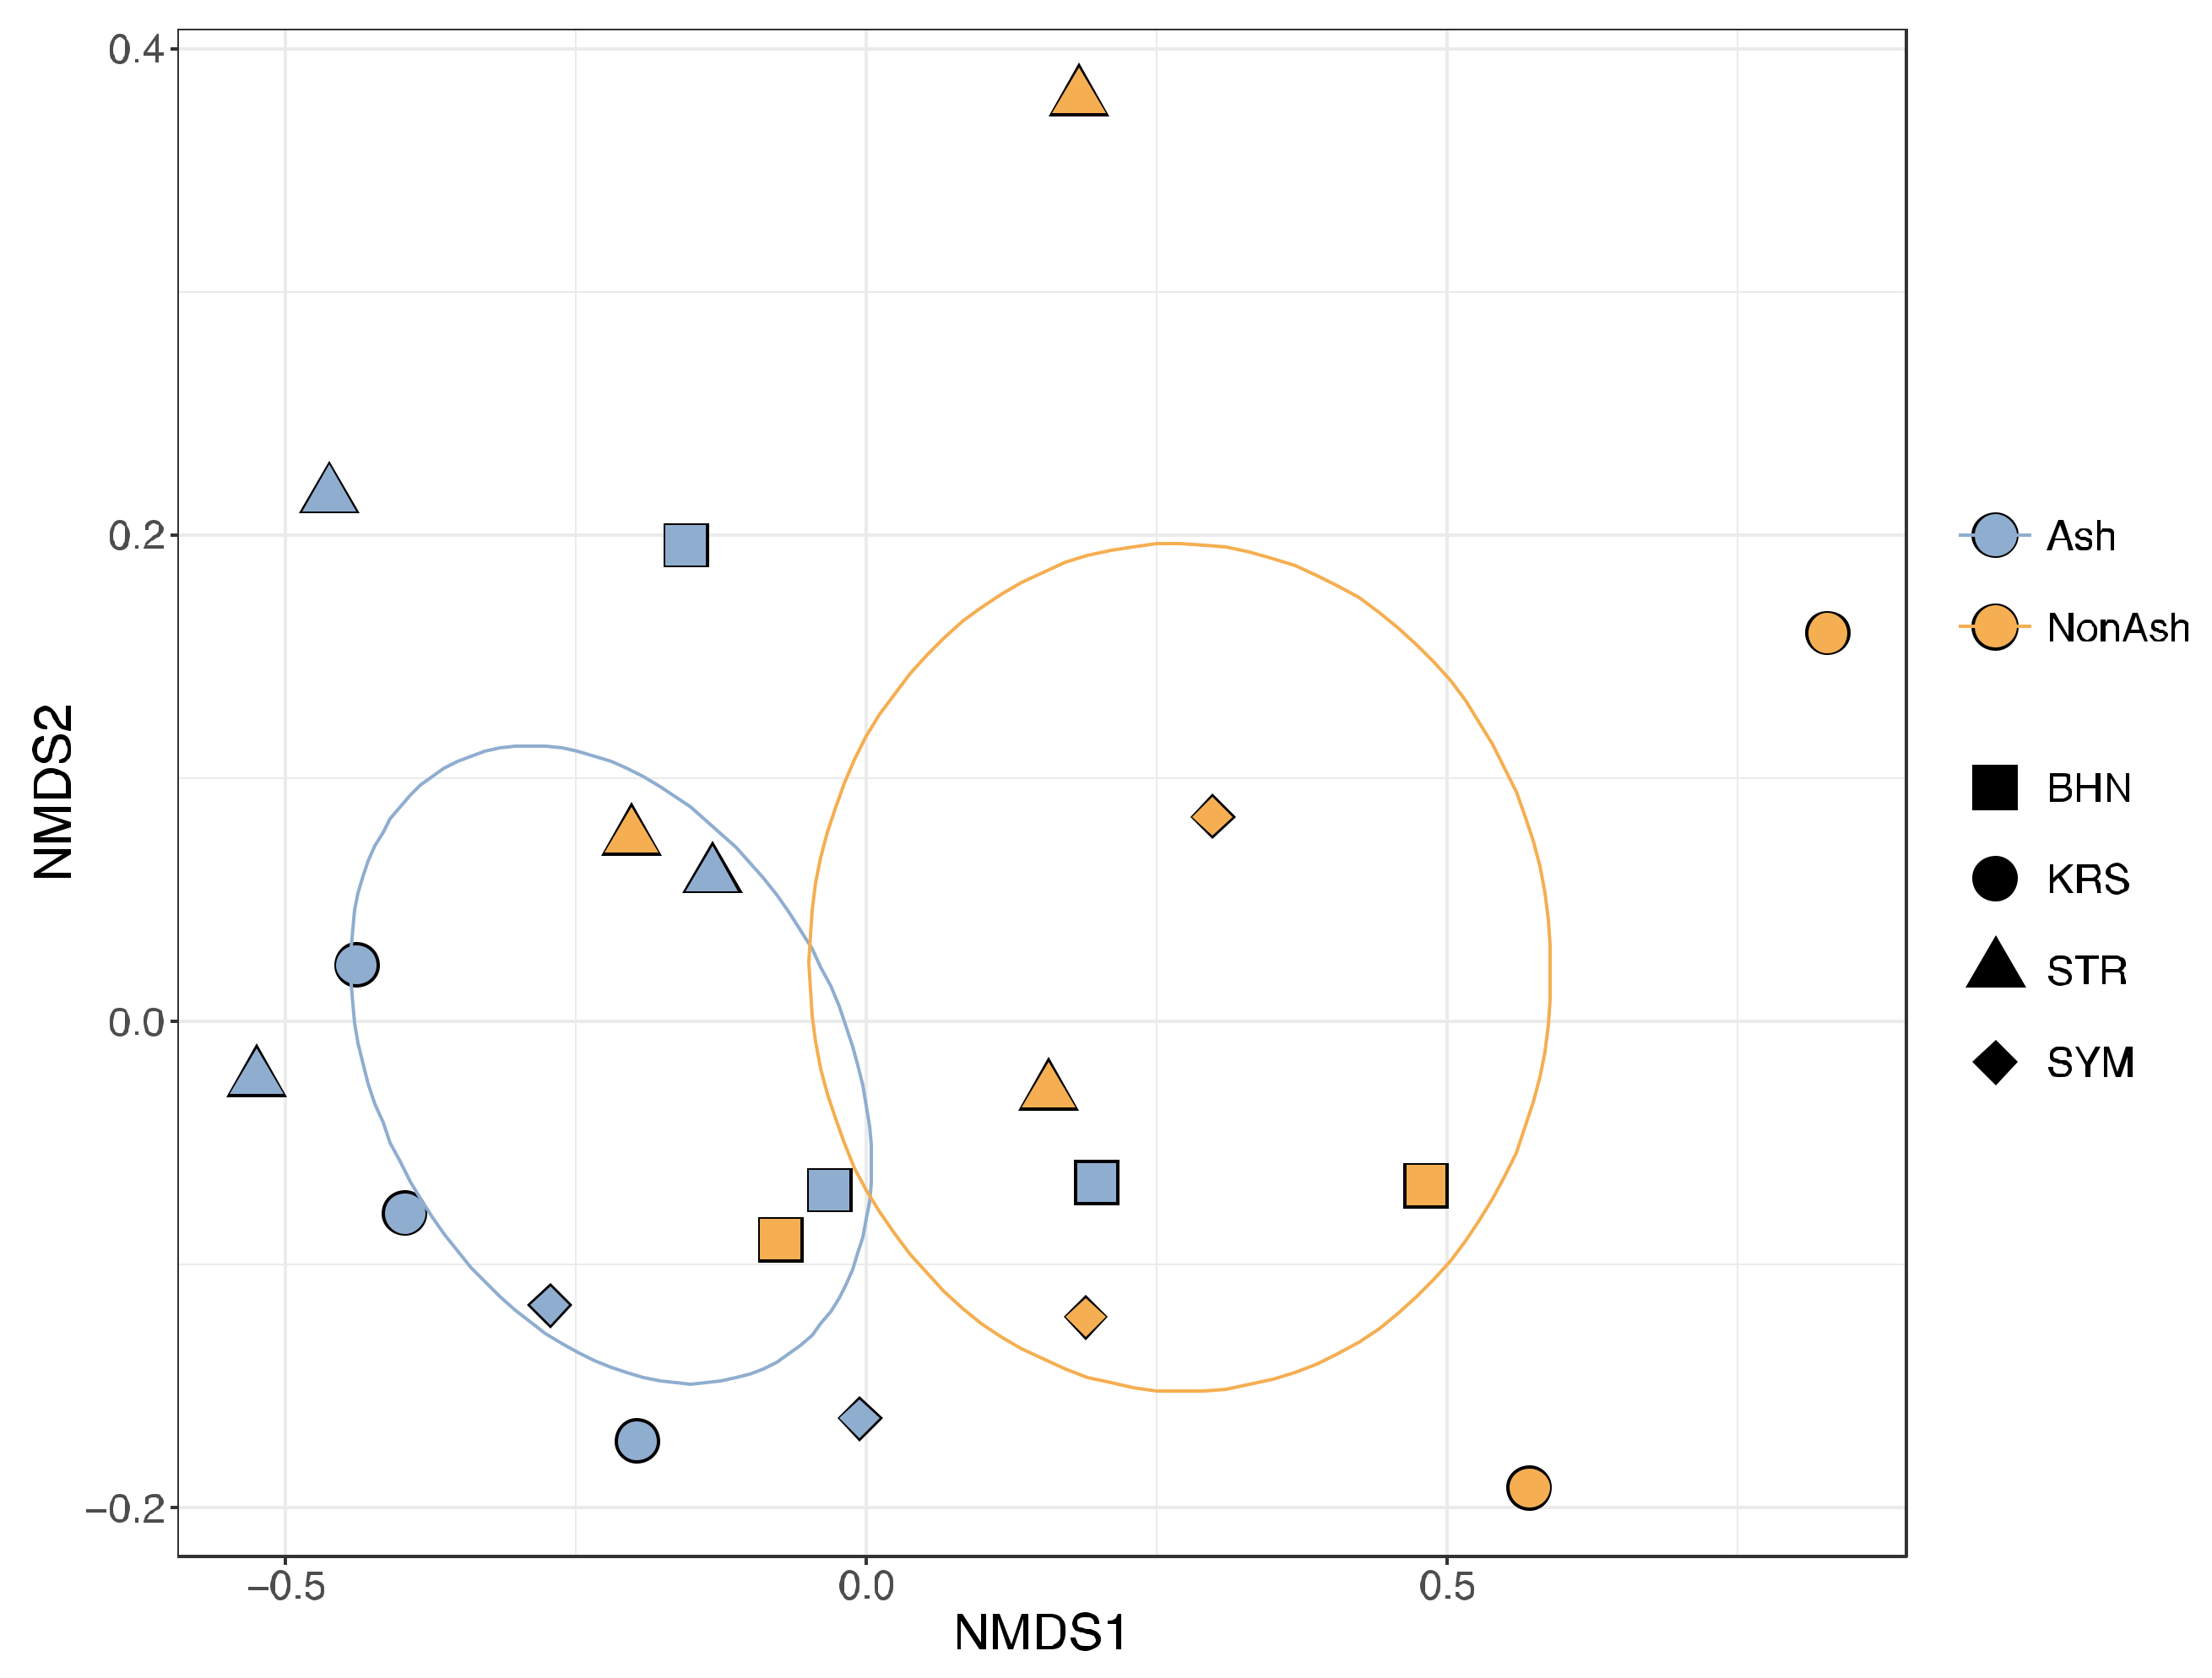
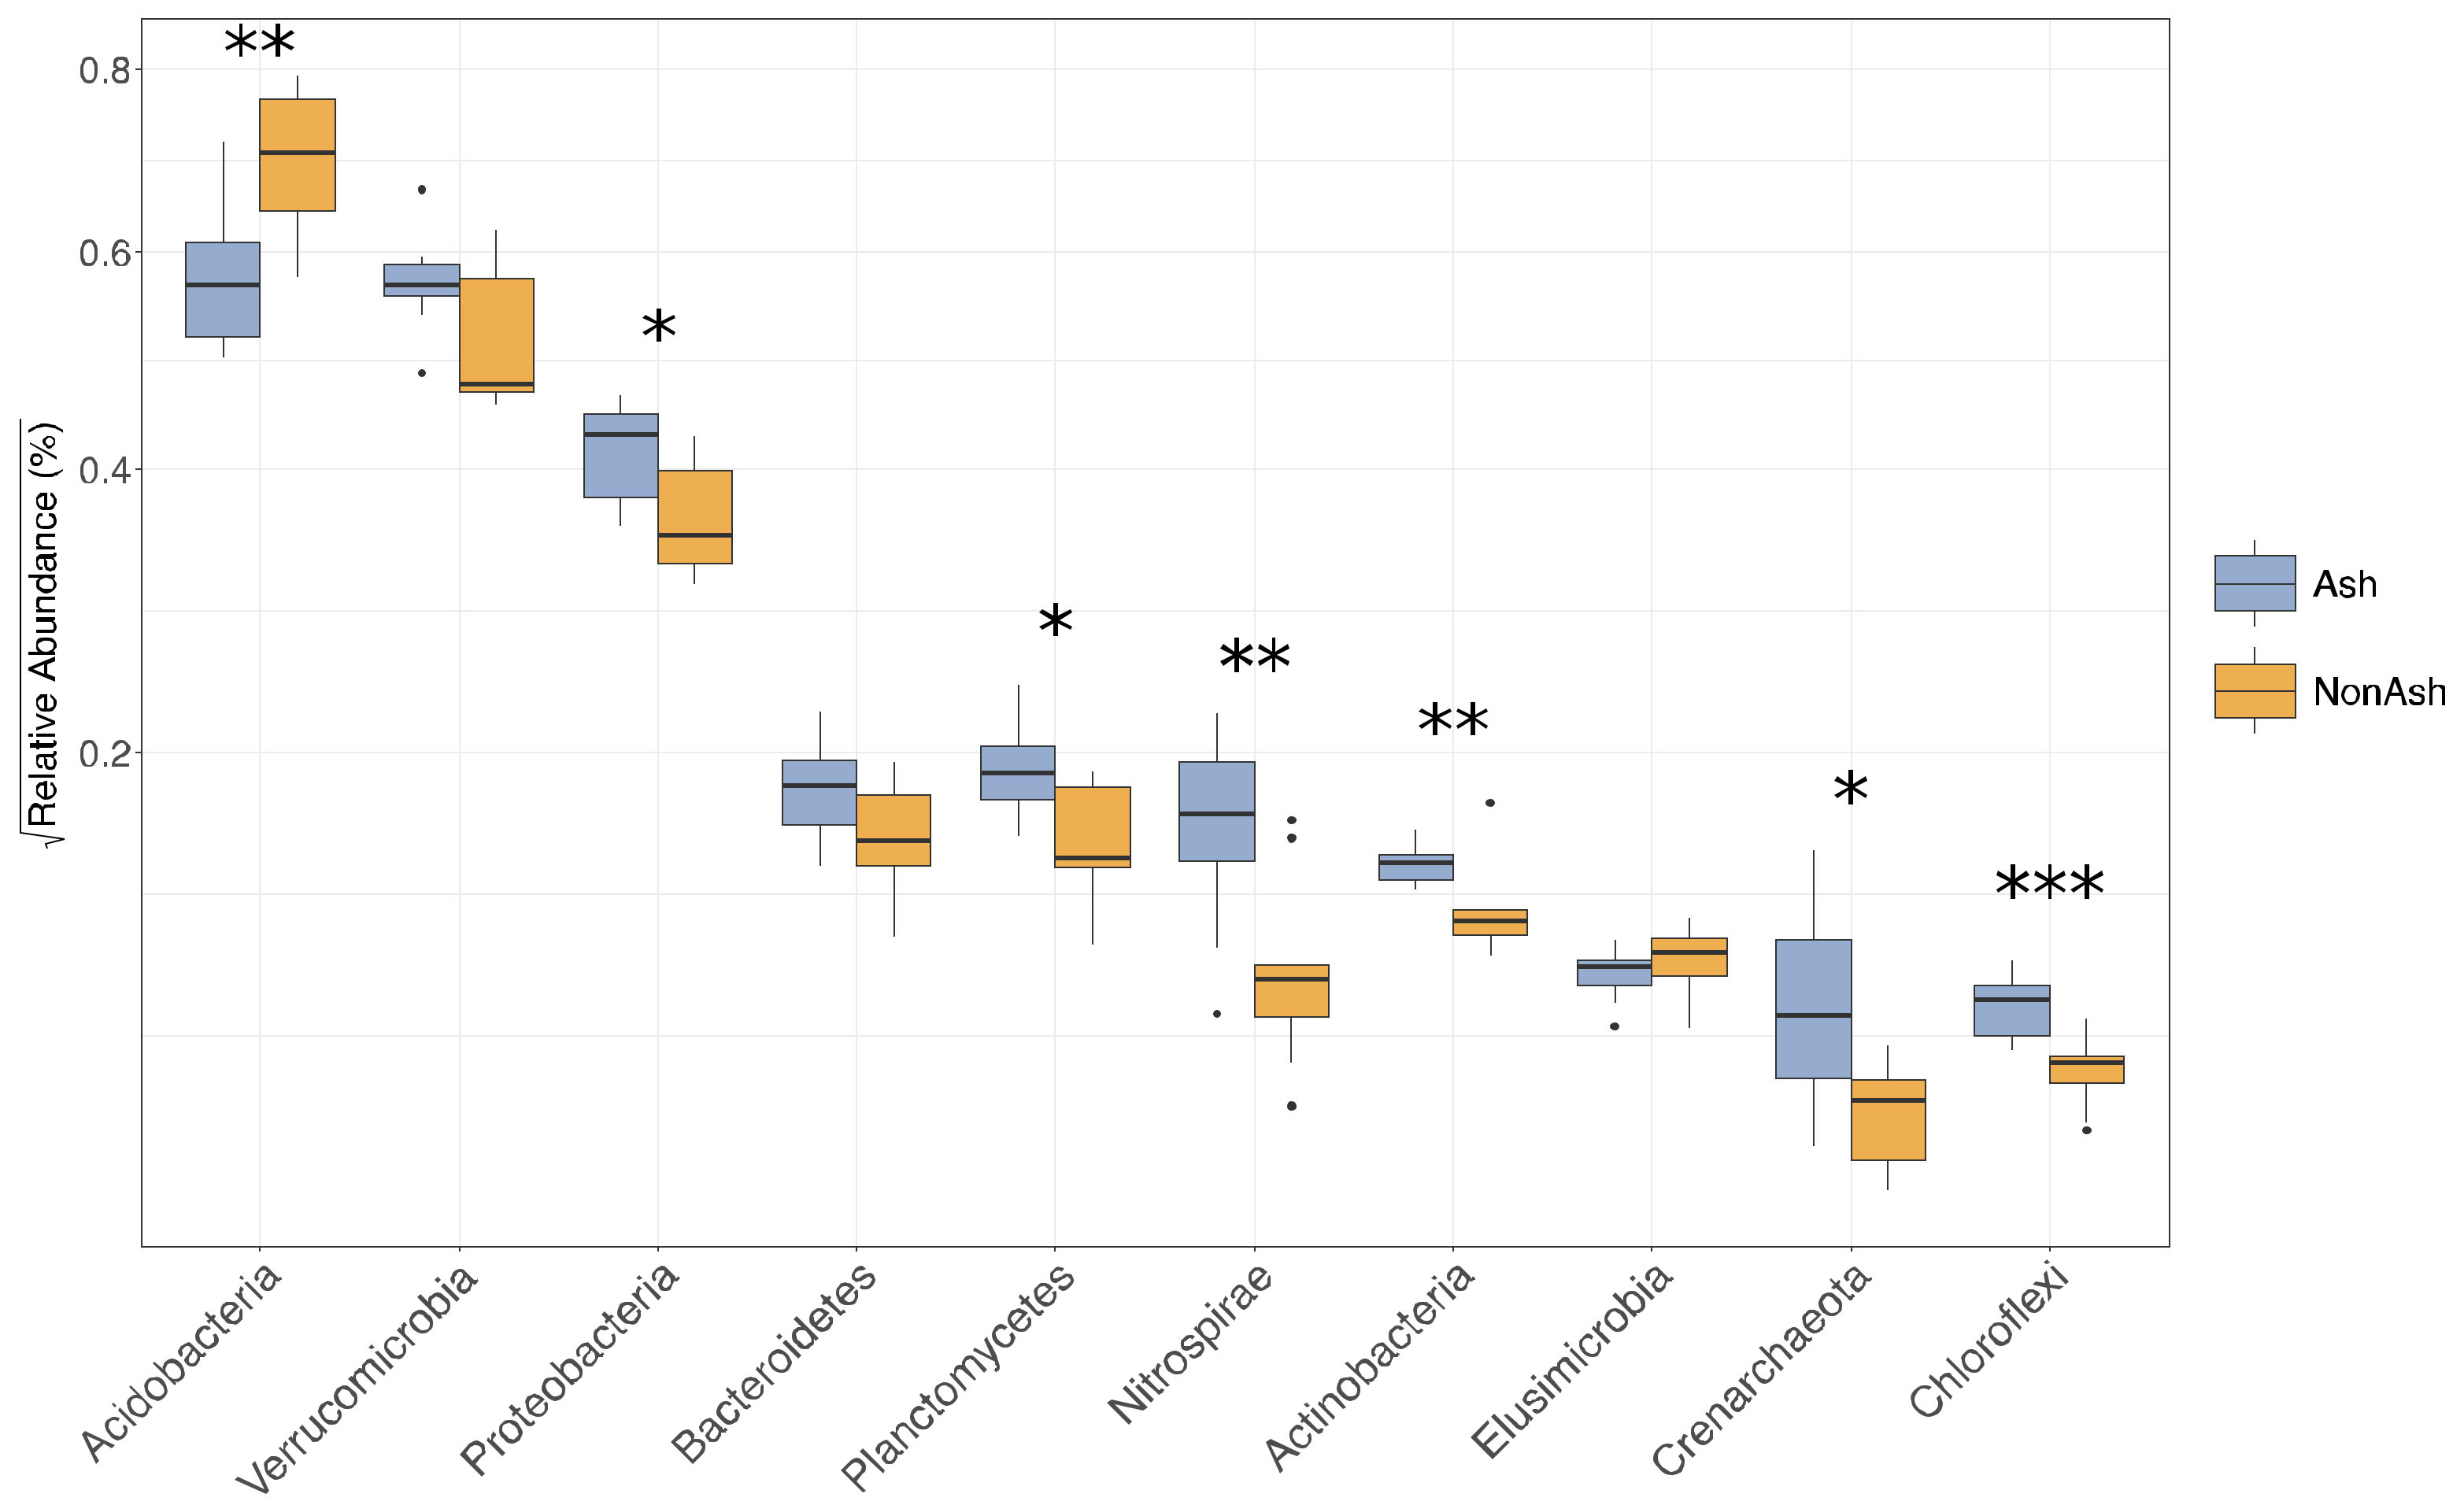
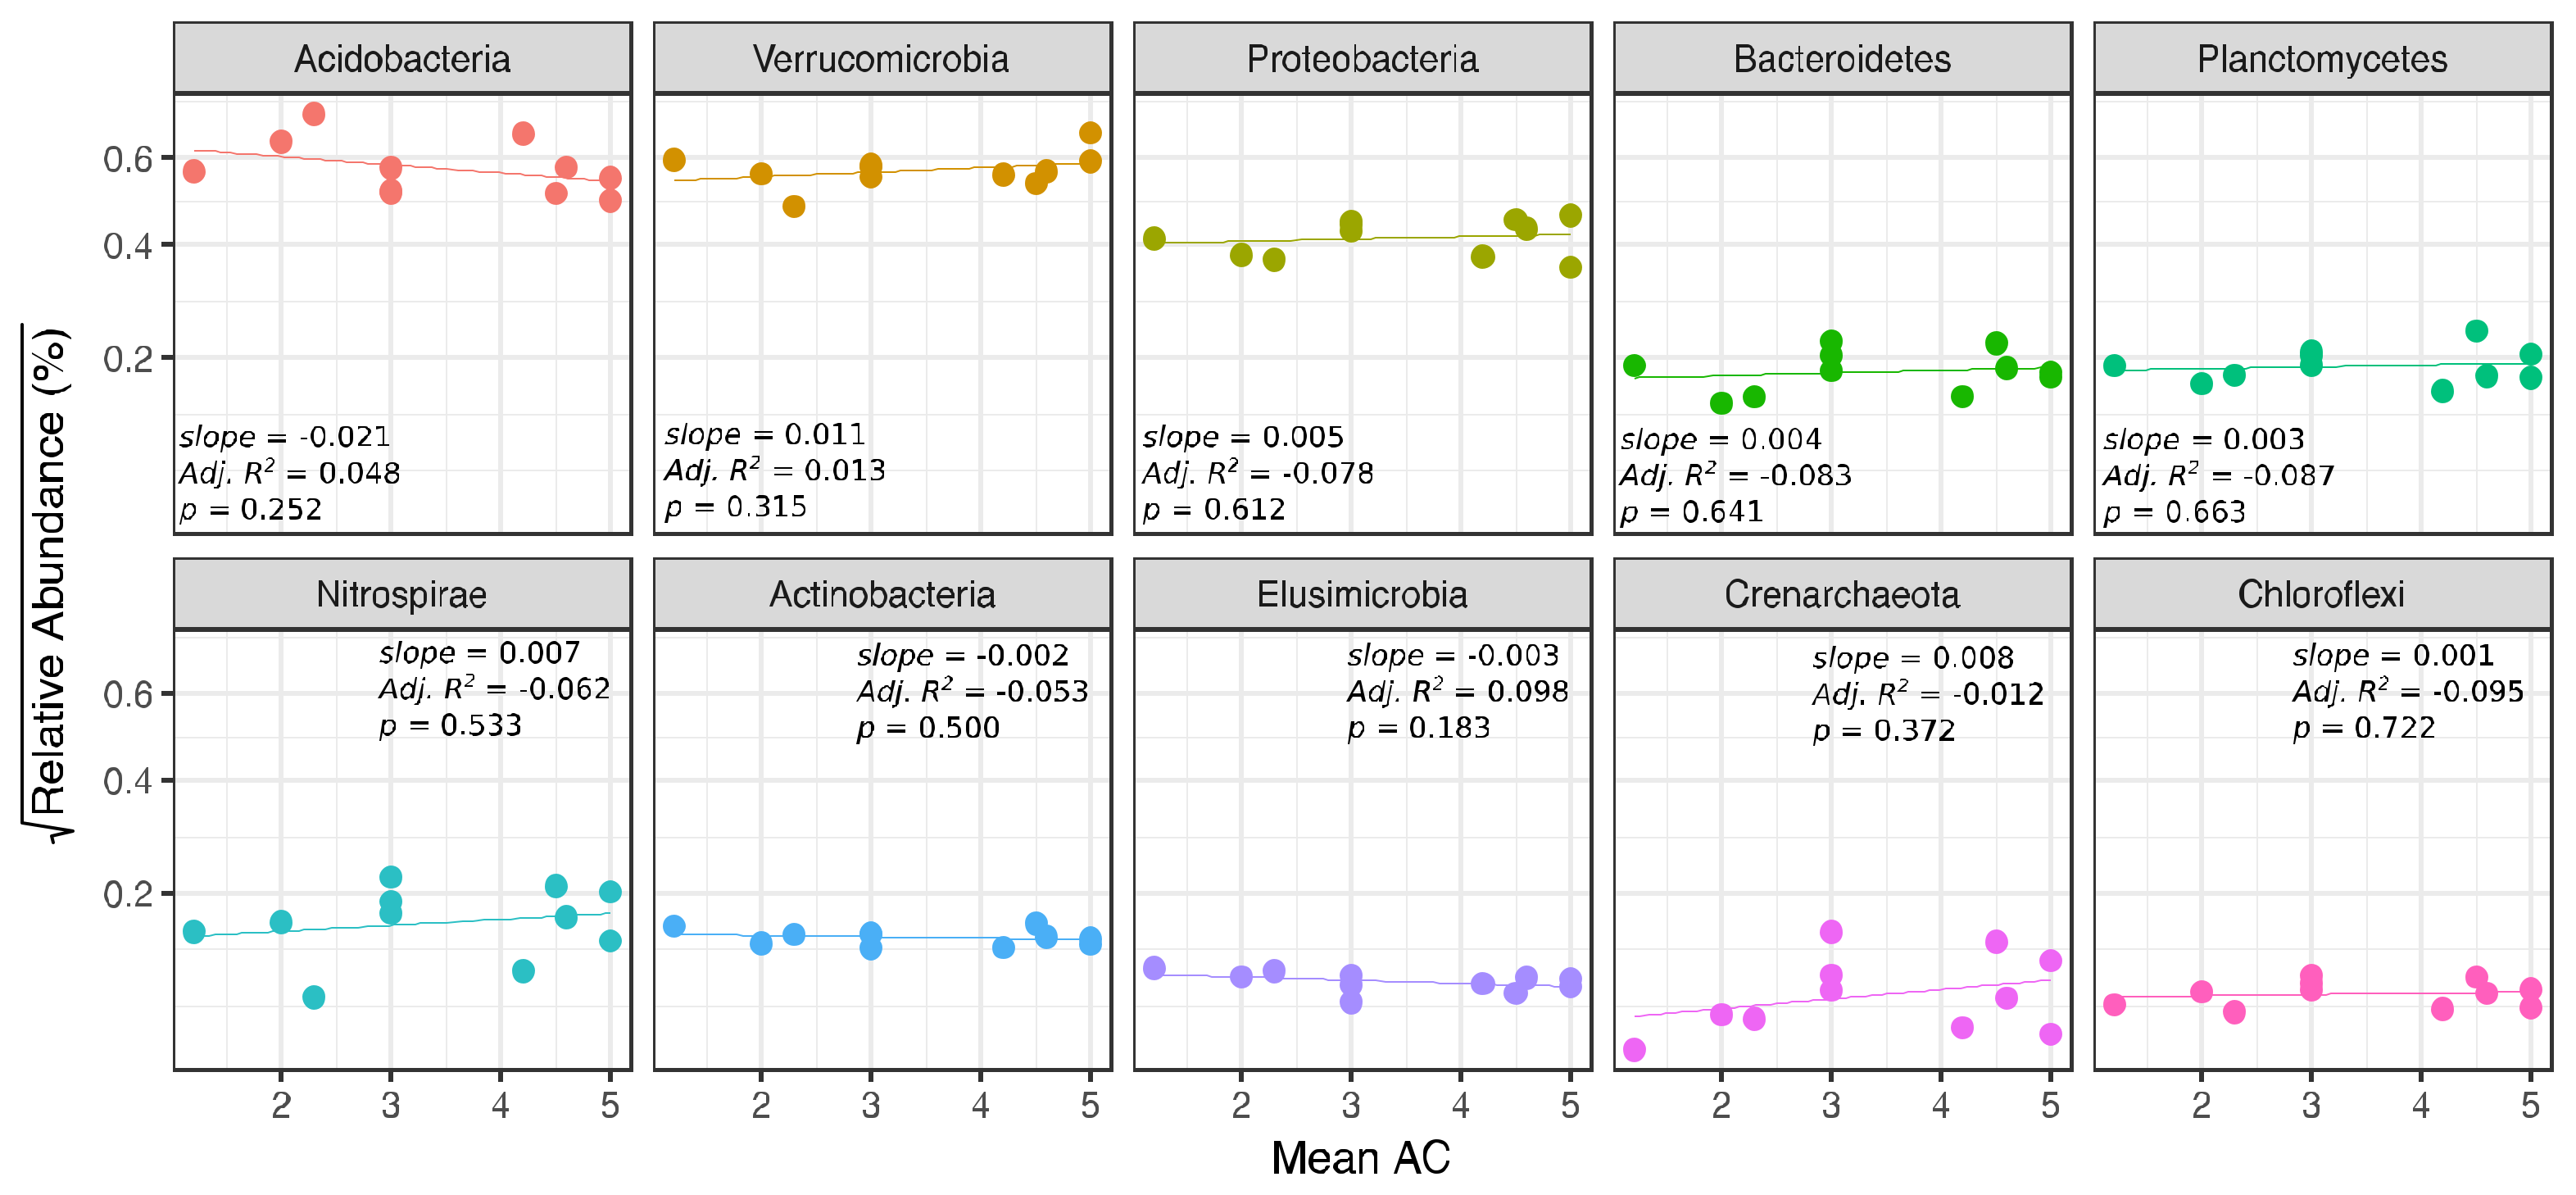
3.2. Bacterial Community Differences

Soil bacterial community structure (i.e., beta-diversity) differed between ash and non-ash plots (adonis R2 = 0.334, p = 0.002), but not between sites (adonis R2 = 0.140, p = 0.501; Figure 2 and Table 2). Ash tree relative dominance was the only tree genera to show a significant correlation with bacterial community structure (mantel r-statistic = 0.264, p = 0.007). Although the overall soil environment did not show a strong relationship with bacterial community structure (mantel r-statistic = 0.053, p = 0.305), certain individual soil variables did, including soil pH (mantel r-statistic = 0.289, p = 0.006), Ca (mantel r-statistic = 0.304, p = 0.007), Mg (mantel r-statistic = 0.274, p = 0.011), and Al (mantel r-statistic = 0.177, p = 0.045; Table 2). It should be noted that Mg, Ca, and Al are all highly correlated with soil pH (>0.79, p < 0.001).
We also found significant differences between ash and non-ash plots in the relative abundances of seven out of 10 of the most abundant bacterial phyla (Figure 3); however, between forest sites, there were no abundance differences in any of the phyla. Likewise, EAB-induced tree stress (i.e., mean AC) did not affect bacterial abundances (Figure 4). All phyla were less abundant in non-ash plots, except Acidobacteria and Elusimicrobia, which were more abundant in non-ash plots (p = 0.004 and p = 0.261 respectively). At finer taxonomic levels, these differences were not as noticeable, with only two out of 20 of the most abundant classes and two out of 30 of the most abundant orders showing significant differences between ash and non-ash plots (Figures S1 and S2). Interestingly, all four of these differences were in the Actinobacteria phylum, which were more abundant in the ash plots. Soil bacterial alpha-diversity did not vary between ash and non-ash plots (W = 54, p = 0.766) or between sites (H = 4.07, p = 0.254) and showed no relationship with bacterial community structure (mantel r-statistic = 0.264, p = 0.007; Table 2 and Table S2).

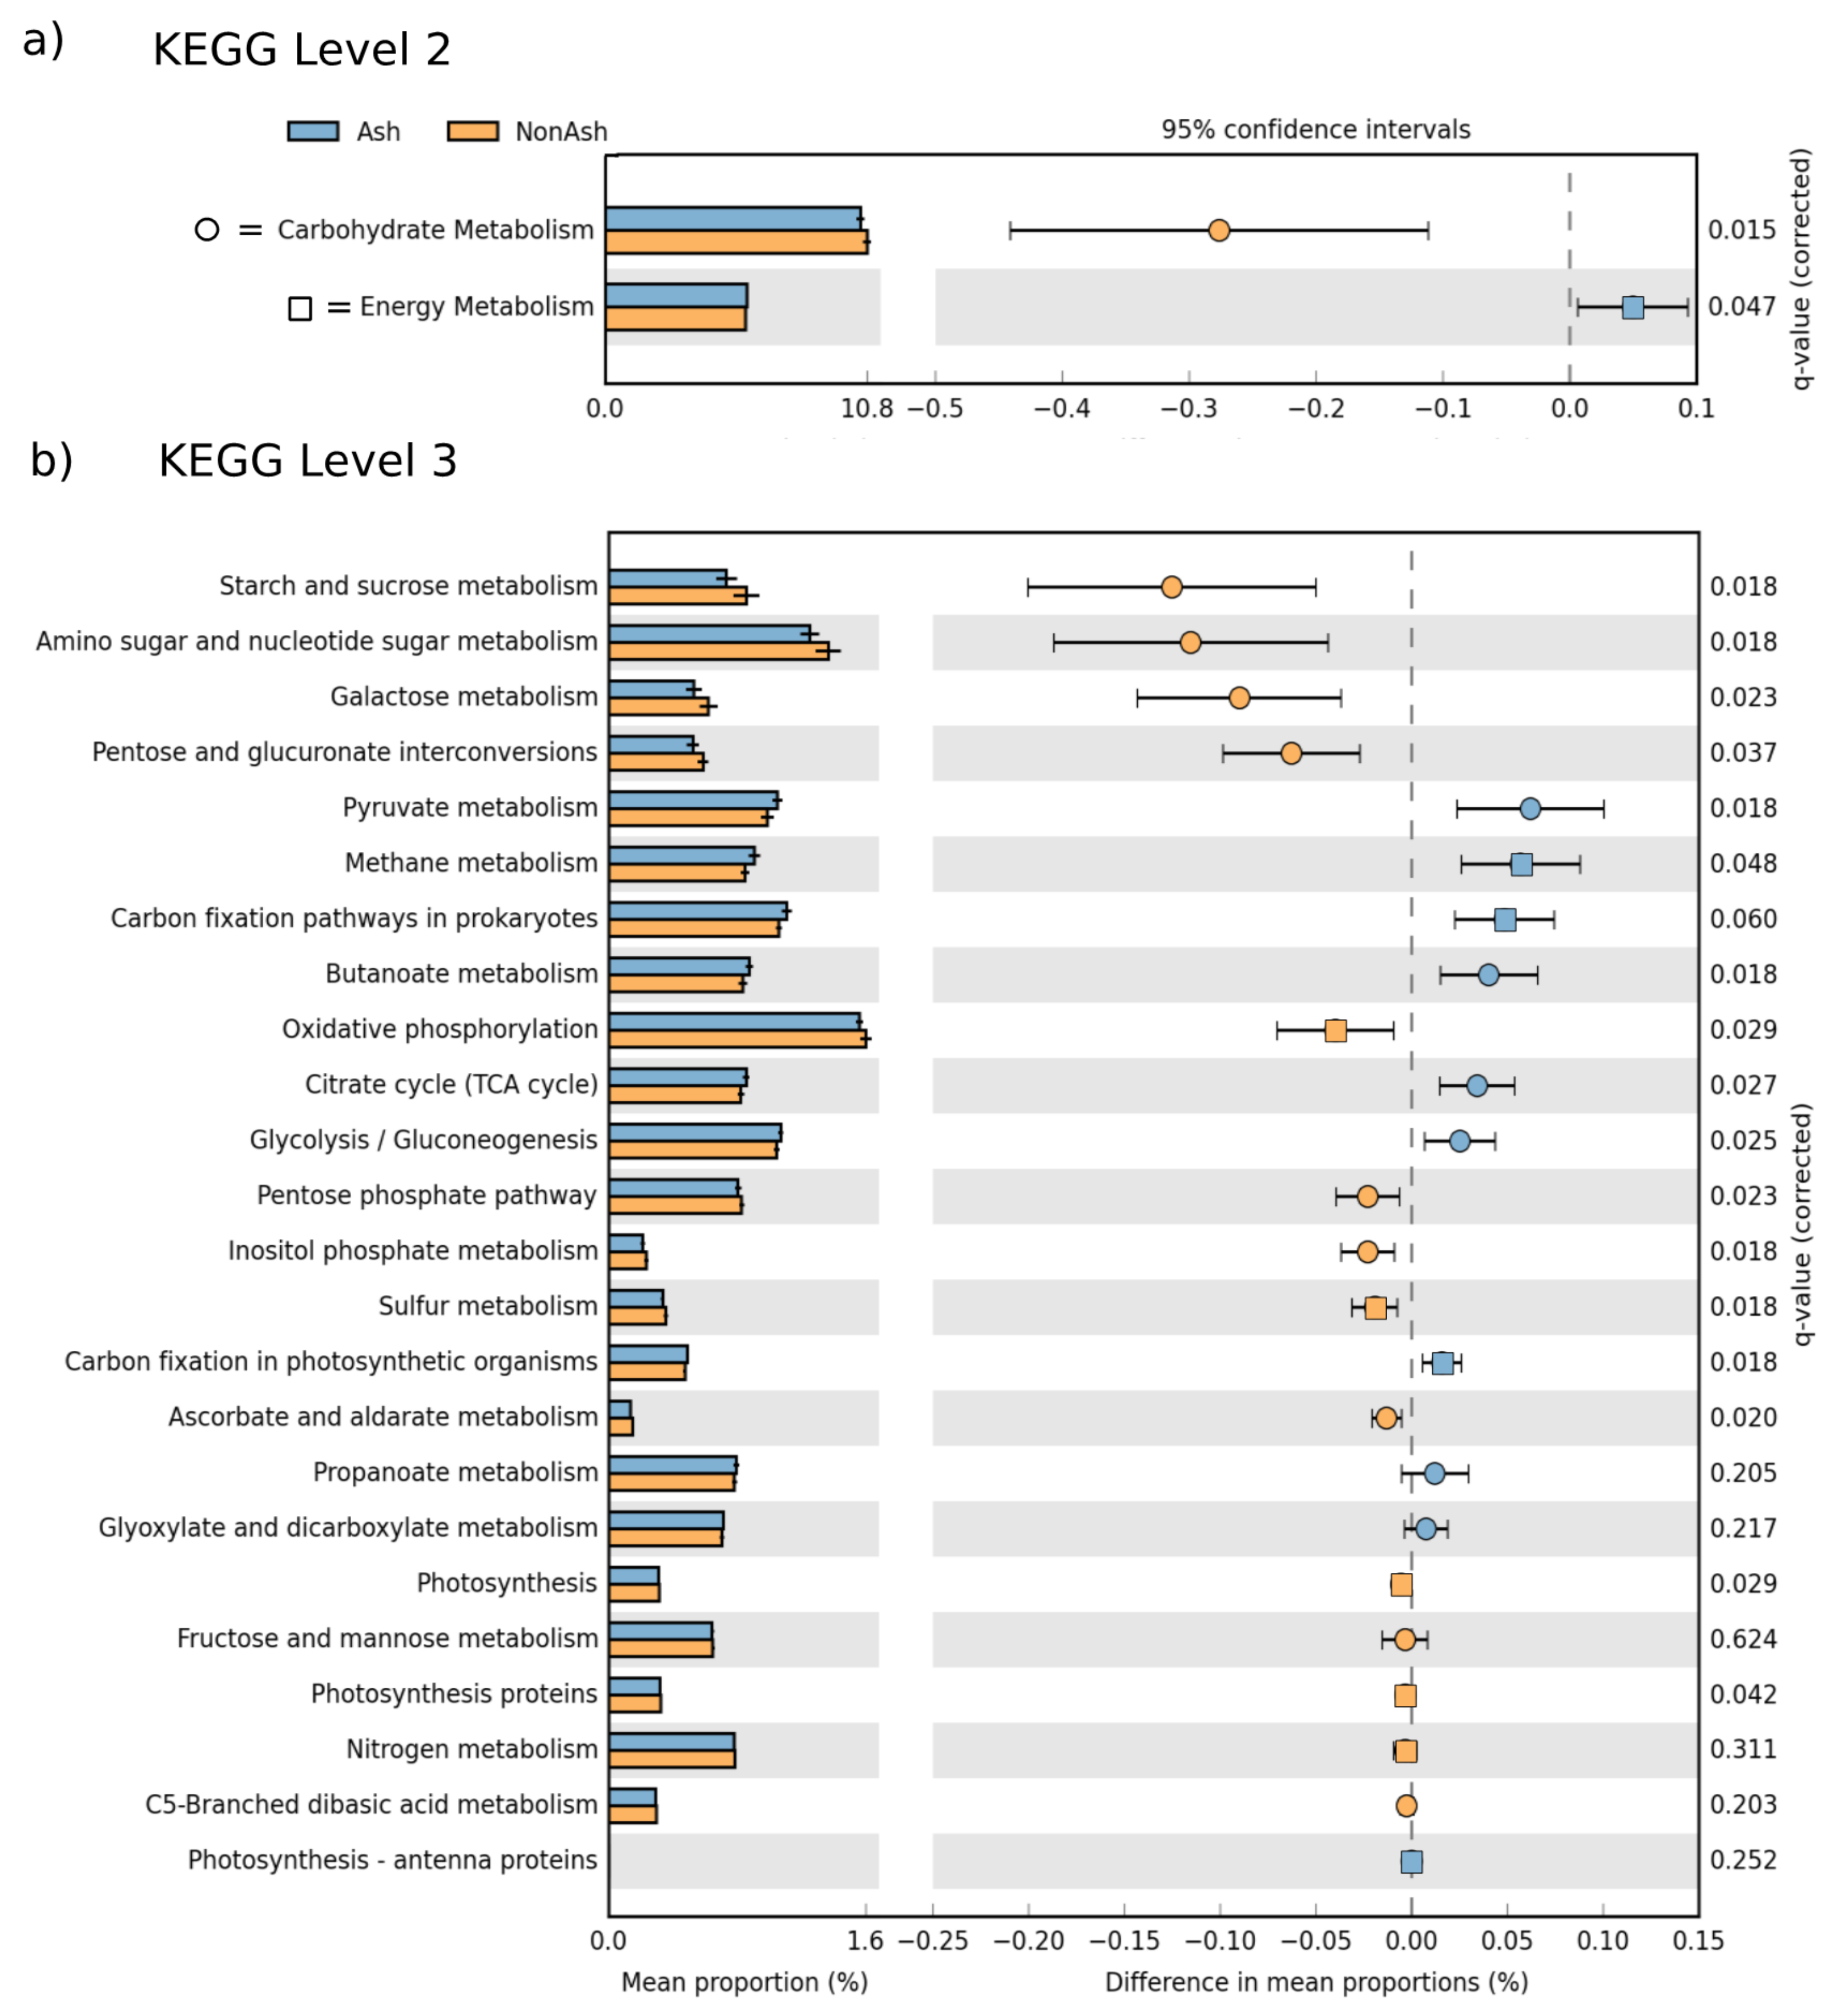
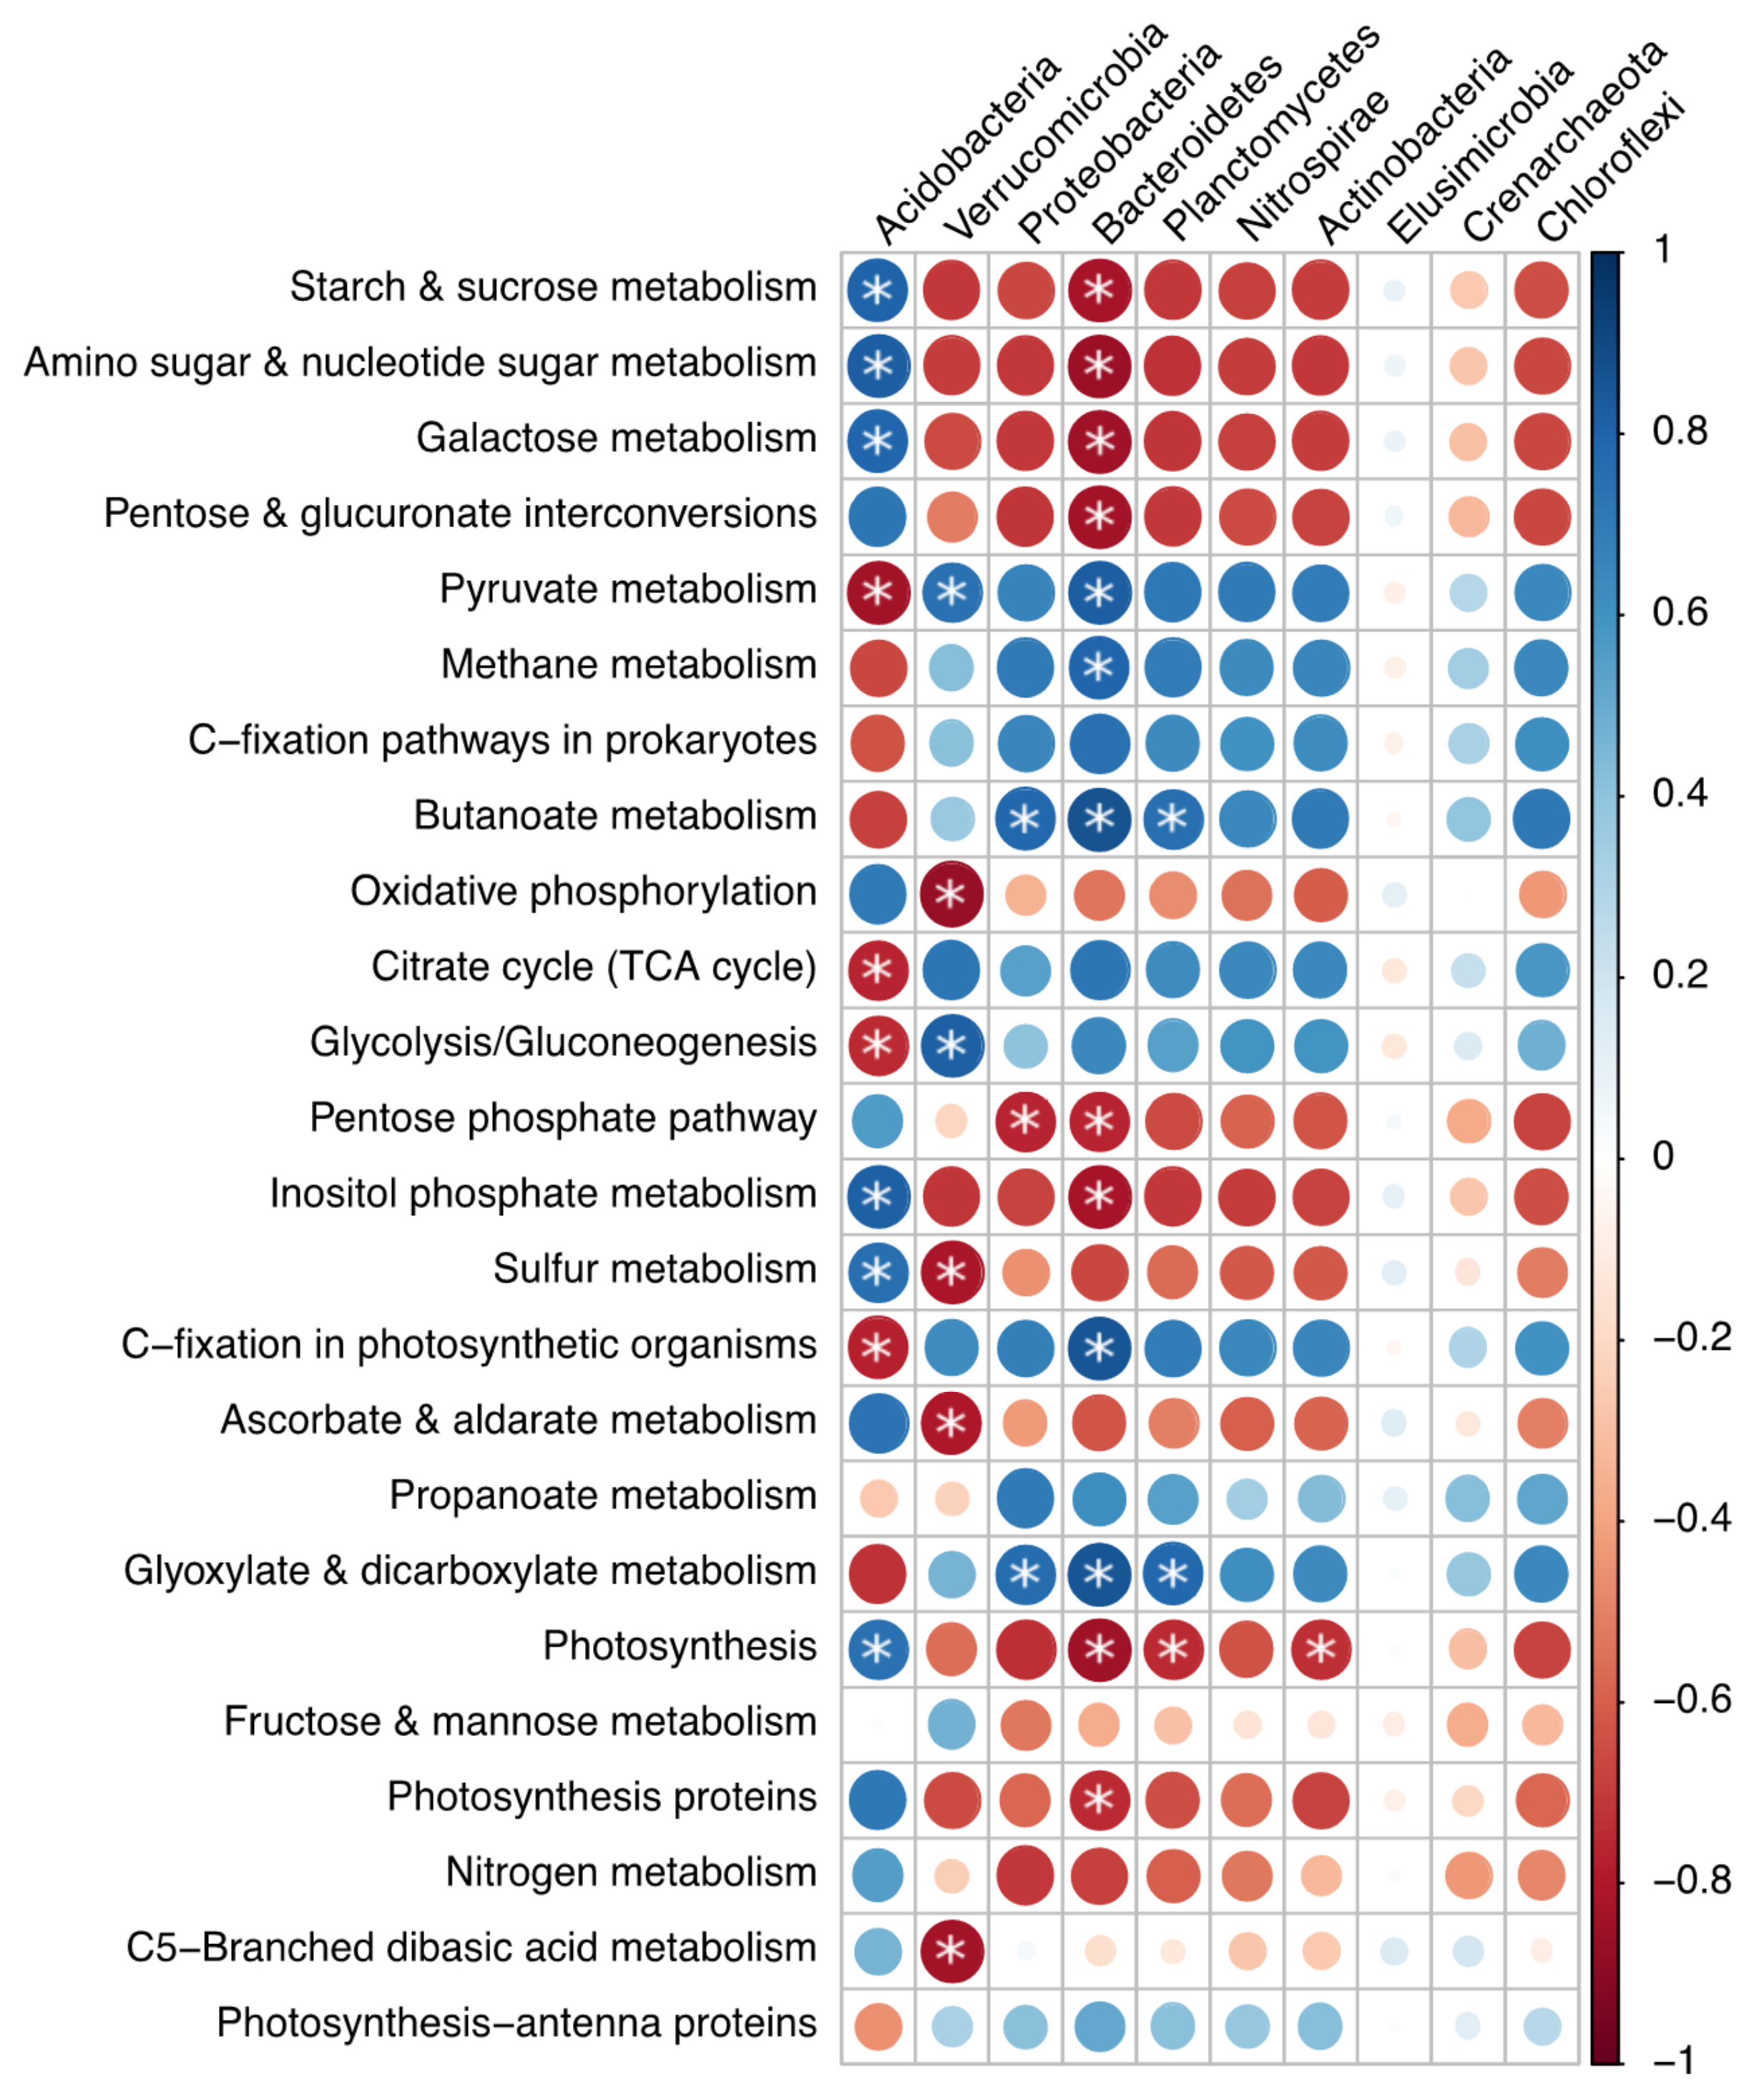
3.3. Bacterial Functional Differences

Bacterial community differences between ash and non-ash plots resulted in estimated functional potential differences. At KEGG level 2 (see methods), differences in PICRUSt-estimated functional gene abundances were found in both energy metabolism (ash > non-ash; d = 1.13, q = 0.047) and carbohydrate metabolism (non-ash > ash; d = −1.68, q = 0.015; Figure 5). At KEGG level 3 within the energy metabolic pathways, three of the nine ortholog groups (carbon fixation pathways in prokaryotes, d = 1.82, q = 0.060; methane metabolism, d = 1.80, q = 0.048; and carbon fixation in photosynthetic organisms, d = 1.56, q = 0.018) were significantly more abundant in ash plots than non-ash. In contrast, four of the nine groups (sulfur metabolism, d = −1.66, q = 0.018; photosynthesis, d = −1.37, q = 0.029; oxidative phosphorylation, d = −1.37, q = 0.029; and photosynthesis proteins, d = −1.27, q = 0.042) were more abundant in non-ash plots (Figure 5b). Nitrogen metabolism capacity was not different in ash vs. non-ash plots.
Within the KEGG carbohydrate metabolic pathways, seven out of 15 ortholog groups were significantly more abundant in non-ash plots (Figure 5b). These include pentose and glucuronate interconversions (d = −1.74, q = 0.037), galactose metabolism (d = −1.71, q = 0.023), ascorbate and aldarate metabolism (d = −1.68, q = 0.020), starch and sucrose metabolism (d = −1.70, q = 0.018), inositol phosphate metabolism (d = −1.67, p = 0.018), amino sugar and nucleotide sugar metabolism (d = −1.65, q = 0.018), and the pentose phosphate pathway (d = −1.36, q = 0.023). However, four out of the 15 groups were significantly more abundant in ash plots, including the tricarboxylic acid (TCA) cycle (a.k.a. Krebs cycle; d = 1.74, q = 0.027), pyruvate metabolism (d = 1.66, q = 0.018), butanoate metabolism (d = 1.61, q = 0.018), and glycolysis/gluconeogenesis (d = 1.38, q = 0.025).
General patterns in the correlation relationships between bacterial phyla and functional roles reveal that Acidobacteria specializes in unique functional roles compared to other phyla (Figure 6). Acidobacteria, the most abundant phylum and with large differences between ash and non-ash plots, was positively correlated with many of the KEGG level 3 functional groups, including those that were significantly higher in non-ash plots (Figure 5). Specifically, Acidobacteria relative abundance correlated with starch and sucrose metabolism (r = 0.810, p = 0.004), amino sugar and nucleotide sugar metabolism (r = 0.821, p = 0.002), galactose metabolism (r = 0.799, p = 0.006), inositol phosphate metabolism (r = 0.817, p = 0.003), and sulfur metabolism (r = 0.755, p = 0.029). Although Bacteroidetes was not one of the seven phyla which differed between ash and non-ash plots, it did have the most corollary relationships with the KEGG functional groups we analyzed (13 out of 24 with r > 0.750 and p < 0.05).

4. Discussion

Here, we present evidence that plots containing ash trees at varying stages of EAB-induced decline have different belowground bacterial and functional characteristics than non-ash plots, in spite of having similar soil environmental factors (Table 1 and Table 2). These soil bacterial community differences between ash and non-ash plots (Figure 2), which were largely driven by Acidobacteria relative abundance (Figure 3), suggest that in temperate forest ecosystems, ash trees may exhibit a genera specific relationship with soil microorganisms and contribute to shaping soil bacterial community assemblages, which may influence specific functional capacities. The estimated functional data suggest that soil communities in ash plots may have different functional capabilities from those in non-ash plots with respect to C and P metabolism, but not with N metabolism (Figure 5). Based on these results and because of the inherent linkage between above- and belowground communities, the loss of ash trees to EAB infestation will likely drive changes in soil microbial communities that lead to altered C and nutrient cycling in this forest ecosystem beyond the expected increase in litter inputs. These fundamental biogeochemical and successional shifts may make this ecosystem susceptible to invasive plant species or pathogenic microorganisms [45].
Although the direct effects of tree decline on the belowground community were not explicitly evaluated in this study, the degree of EAB disturbance severity, as indicated by AC, did not affect the overall soil bacterial community structure (Mantel test—Table 2) or the individual abundances of major bacterial phyla within the ash stands (Figure 4). Likewise, the removal of sites with severely affected ash trees from the analysis (AC > 3) did not alter the results (Table S1). This indicates that ash associated bacterial communities may persist throughout EAB infestation and the eventual ash tree mortality. Changes in the microbial community may be expected some years after ash mortality is completed, depending on the species that occupy the newly available niche. The ash legacy ecosystem effects on soil properties deserve further investigation.
Other studies have reported that dominant tree genera may contribute to shaping soil microbial communities [46,47,48], but to our knowledge, few studies have investigated soil microbial community associations with ash trees specifically. The mechanisms by which trees exert influence on soil communities are generally attributed to direct and persistent inputs to the soil environment, likely from the chemical nature of litter deposition and root exudates. However, while there were obvious differences in bacterial community structure between ash and non-ash plots in our study (Figure 2 and Figure 3), determining causation can be challenging. A variety of biotic and abiotic factors may contribute to shaping the soil microbiome at a given site. For example, the presence/absence of other non-ash tree species within the plots may confound the interpretation of results. Oak tree relative dominance was low in the plots with ash trees and was higher in plots without ash trees (Table 2 and Table S3). These results may indicate that the bacterial community differences we see between ash and non-ash plots could also be due to oak tree influence. However, results from the Mantel test analysis suggest that oak tree dominance did not have an effect on bacterial community structure (p = 0.338), while ash tree dominance did (p = 0.007), providing a stronger case for soil bacterial association with ash trees specifically. Likewise, bacterial community structure has been shown to be highly influenced by soil pH [29,30,31], which along with other correlated soil variables (Mg, Al, and Ca), is supported by our data (Table 2). The most abundant phylum in these sites was Acidobacteria, which are known to prefer acidic environments [49]. This phylum had a 1.5-fold greater relative abundance in non-ash plots when compared to ash plots (Figure 3) and may very well be driving the overall soil bacterial community structure differences at these sites. While soil pH was only marginally statistically different between ash and non-ash plots (W = 73, p = 0.080), it was more acidic in non-ash plots where Acidobacteria were more abundant. So, while ash trees are tolerant of a wide range of soil pH values, including very acidic ones [50], it is possible that soil pH may be contributing to both bacterial and tree community structure.
Besides being the most abundant phyla in these soils and a major driver of bacterial community structure, Acidobacteria exhibit a number interesting patterns. Overall, our data reveal opposite trends in Acidobacteria relative abundance (ash vs. non-ash) and functional correlations when compared to eight of the nine remaining most abundant bacterial phyla (Figure 3 and Figure 6). Acidobacteria were found to be more abundant in non-ash plots, while the other eight phyla were more abundant in ash plots (Figure 3). This pattern also holds true for correlations made with functional gene abundances, where a positive correlation with Acidobacteria often occurred alongside a negative correlation with the other phyla and vice versa (Figure 6). Our data suggests that Acidobacteria correlate positively with the breakdown of complex sugars leading to glycolysis (i.e., starch, sucrose, galactose and amino sugar metabolisms), while other phyla, such as Proteobacteria, Verrucomicrobia, and Bacteroidetes, correlate positively with enzymes tied more closely to the TCA cycle (i.e., glycolysis/gluconeogenesis and pyruvate, glycoxylate, dicarboxylate, and butanoate metabolisms). Even though the relative abundances of some major phyla (e.g., Verrucomicrobia and Bacteroidetes) did not differ greatly between ash and non-ash plots (Figure 3) and were highly correlated with the above-mentioned functions (Figure 6), the ash vs. non-ash differences in these same functional groups were still significant (Figure 5). This suggests that the combined directional relationships of non-Acidobacteria phyla with these functions may also contribute to ash vs. non-ash functional differences; however, Acidobacteria remain the most likely driver of relative abundance and functional differences. Acidobacteria are typically aerobic heterotrophs capable of utilizing a range of C sources from simple sugars to hemicellulose, cellulose, and chitin. Although this group is able to reduce nitrate and nitrite [49,51], it is incapable of N2 fixation or nitrification and overall N metabolism was not affected by Acidobacteria abundance differences in this study, indicating some degree of functional redundancy within the bacterial community for N cycling. However, inositol phosphate and sulfur metabolic capacities, which are indicative of organic phosphorus (P) and sulfur (S) cycling capacities, respectively, are both positively correlated with Acidobacteria and are greater in non-ash forest plots when compared to ash plots (Figure 5). Phosphatases are enzymes which extract P from organic sources and their activity varies according to climate variables, soil C and N, and organic-P (as opposed to available-P measured in this study) [52]. As climate, soil C, and soil N did not vary between ash and non-ash plots, organic-P appears to be a proportionally larger source of microbial P in non-ash forest stands. Because a substantial amount of organic-P is thought to be in microbial biomass [53], this enhanced capacity to access organic-P in non-ash plots may indicate a relative difference in P availability between ash and non-ash plots via solubilisation, mobilization, and/or microbial turnover [54]. Based on our results, if future soil bacterial communities in ash forests become more similar to those in non-ash plots in the wake of EAB infestation, then these differences in P metabolism may be an indicator of future soil transformations. It also highlights the potential role of Acidobacteria in the biogeochemical cycling of nutrients in this forest system. Therefore, future abundance shifts in this phyla due to ash tree decline as a result of EAB could result in alterations of both soil C and nutrient dynamics that will go beyond the addition of dead ash woody litter, which is currently the subject of ongoing investigations.
While our results suggest that ash trees may contribute to shaping soil bacterial community structure and the loss of ash due to EAB infestation may lead to belowground alterations, this may not hold true for all tree species and/or may not affect the bacterial community over time. Ecosystem responses of soil microbes to disturbance remain poorly understood and above- belowground associations may vary across the plant kingdom. For example, Ferrenberg et al., 2014 [55] found that soil bacterial communities remained stable over a five year chronosequence following coniferous tree mortality due to bark beetle in the Rocky Mountains. Ecological resilience in the belowground environment, where the slow turnover of the plant-derived soil C may have a long legacy of the vegetation history of the site, may retain structural and functional attributes long after the removal of trees from the system. Therefore, collecting data on specific above- belowground relationships, as done here, is imperative to understanding if and how communities may respond to the loss of a given species or genera.
Research is underway to track the successional trajectory of bacterial communities over time in the wake of ash decline. If soil bacterial communities are resilient to disturbance, driven by edaphic factors that have long-term legacy effects and are not directly influenced by live ash trees, then the loss of ash trees in temperate forests may not affect bacterial community structure (Figure 7; Scenario 1). However, if instead ash trees form unique assemblages with their belowground bacterial community and the ecological memory of the soil environment is short-lived, then the loss of ash trees will likely cause major shifts in microbial community structure and, in consequence, ecosystem function. The successional trajectory of these communities could either become more similar to those in non-ash plots (Figure 7; Scenario 2), or progress into an unknown community structure potentially driven by incoming replacement plant species (Figure 7; Scenario 3). The resilience of belowground communities and the functions they perform after disturbance will ultimately govern the future states of overall ecosystem biogeochemical cycling and aboveground community structure.

5. Conclusions

Using archived DNA samples extracted from forest soils which were collected in the early stages of EAB infestation, we compared the bacterial community structures of plots containing ash trees to those that did not contain ash trees and found that they were different. This indicates that either ash trees directly or indirectly associate with, or influence, belowground microbial organisms. However, co-occurring factors such as soil pH, correlations with other tree species, or the active decline of ash tree health cannot be fully ruled out as contributing driving forces of bacterial community structure. Estimated functional gene abundances within the soil community were also different between ash and non-ash plots as a result of phylogenetic community differences. Specifically, greater relative abundances of Acidobacteria in non-ash plots may drive increases in sugar metabolisms which lead to glycolysis, but decrease functional pathways more tightly linked to the TCA cycle, likely altering C dynamics. Although N cycling was not affected by these bacterial abundance differences, both P and S metabolic potential was elevated in non-ash plots. While we are unable to determine how the loss of ash trees due to EAB will affect belowground community structure and function over time, we provide a foundational framework to predict future successional trajectories and establish a context within which to generate new hypotheses.

Supplementary Materials

The following are available online at https://www.mdpi.com/1999-4907/9/4/187/s1. Table S1: Analysis of “healthy ash” sites, Table S2: Forest site characteristics, Table S3: Tree health, dominance and diversity, Figure S1: Twenty most abundant bacterial classes, Figure S2: Thirty most abundant bacterial orders. Additional files include “R_scripts.R” which contains R code for statistical analysis and figure production, and “Code.txt”, which contains computer scripts for bioinformatics using QIIME and PICRUSt.

Acknowledgments

This research was supported by the National Science Foundation DGE-0549245, “Landscape Ecological and Anthropogenic Processes” (C.E.F.), the UIC Hadley grant (M.P.R.), the US Forest Service grant 15-JV-11242302-038 (M.A.G-M.), and the Stable Isotope Lab at UIC. Open access publishing fees were supported by the Research Open Access Publishing (ROAAP) Fund of UIC. The authors thank D. Johnston for assistance in the conception and sample collection phase of this research, as well as K. Costilow for assistance with sample collection. We would also like to thank J. Dalton, C. Whelan, E. Dias de Oliveira, and S. O’Brien for comments and advice.

Author Contributions

M.P.R. analyzed the data and wrote the paper; C.E.F. conceived and designed sample collection and collected soil samples; K.S.K. provided the plot network and contributed materials; and M.A.G.-M. contributed reagents/materials/analysis tools, provided feedback on experiments and edited the manuscript.

Conflicts of Interest

The authors declare no conflict of interest.

References

  1. Parmesan, C.; Yohe, G. A globally coherent fingerprint of climate change impacts across natural systems. Nature 2003, 421, 37–42. [Google Scholar] [CrossRef] [PubMed]
  2. Settele, J.; Scholes, R.J.; Betts, R.A.; Bunn, S.; Leadley, P.; Nepstad, D.; Overpeck, J.T.; Toboada, M.A. Chapter 4—Terrestrial and inland water systems. In Climate Change 2014: Impacts, Adaptation, and Vulnerability. Part A: Global and Sectoral Aspects; Contribution of Working Group II to the Fifth Assessment Report of the Intergovernmental Panel on Climate Change; Field, C.B., Barros, V.R., Dokken, D.J., Mach, K.J., Mastrandrea, M.D., Bilir, T.E., Chatterjee, M., Ebi, K.L., Estrada, Y.O., Genova, R.C., et al., Eds.; Cambridge University Press: Cambridge, UK; New York, NY, USA, 2014; pp. 271–359. ISBN 1102700991936. [Google Scholar]
  3. Cramer, W.; Bondeau, A.; Woodward, F.I.; Prentice, I.C.; Betts, R.A.; Brovkin, V.; Cox, P.M.; Fisher, V.; Foley, J.A.; Friend, A.D.; et al. Global response of terrestrial ecosystem structure and function to CO2 and climate change: Results from six dynamic global vegetation models. Glob. Chang. Biol. 2001, 7, 357–373. [Google Scholar] [CrossRef]
  4. Drewniak, B.; Gonzalez-Meler, M.A. Earth system model needs for including the interactive representation of nitrogen deposition and drought effects on forested ecosystems. Forests 2017, 8, 267. [Google Scholar] [CrossRef]
  5. Gonzalez-Meler, M.A.; Rucks, J.S.; Aubanell, G. Mechanistic insights on the responses of plant and ecosystem gas exchange to global environmental change: Lessons from Biosphere 2. Plant Sci. 2014, 226, 14–21. [Google Scholar] [CrossRef] [PubMed]
  6. Mcnickle, G.G.; Gonzalez-Meler, M.A.; Lynch, D.J.; Baltzer, J.L.; Brown, J.S. The world’s biomes and primary production as a triple tragedy of the commons foraging game played among plants. Proc. R. Soc. B Biol. Sci. 2016, 283, 20161993. [Google Scholar] [CrossRef] [PubMed]
  7. Cappaert, D.; McCullough, D.G.; Poland, T.M.; Siegert, N.W. Emerald Ash Borer in North America: A Research and Regulatory Challenge. Am. Entomol. 2005, 51, 152–165. [Google Scholar] [CrossRef]
  8. Wang, X.Y.; Yang, Z.Q.; Gould, J.R.; Zhang, Y.N.; Liu, G.J.; Liu, E. The Biology and Ecology of the Emerald Ash Borer, Agrilus planipennis, in China. J. Insect Sci. 2010, 10, 1–23. [Google Scholar] [CrossRef] [PubMed]
  9. Flower, C.E.; Lynch, D.J.; Knight, K.S.; Gonzalez-Meler, M.A. Biotic and abiotic drivers of sap flux in mature green ash trees (Fraxinus pennsylvanica) experiencing varying levels of emerald ash borer (Agrilus planipennis) infestation. Forests 2018, in press. [Google Scholar]
  10. McCullough, D.G.; Katovich, S.A. Emerald ash borer. Pest Alert 2004, 4–5. [Google Scholar] [CrossRef]
  11. Knight, K.S.; Robert, P.; Rebbeck, J. How Fast Will Trees Die? A Transition Matrix Model of Ash Decline in Forest Stands Infested by Emerald Ash Borer; U.S. Department of Agriculture, Forest Service: Washington, DC, USA, 2008; pp. 28–29.
  12. Costilow, K.C.; Knight, K.S.; Flower, C.E. Disturbance severity and canopy position control the radial growth response of maple trees (Acer spp.) in forests of northwest Ohio impacted by emerald ash borer (Agrilus planipennis). Ann. For. Sci. 2017, 74. [Google Scholar] [CrossRef]
  13. Birdsey, R.A. Carbon Storage and Accumulation in United States Forest Ecosystems; General Technical Report WO-59; United States Department of Agriculture, Forest Service: Washington, DC, USA, 1992.
  14. Birdsey, R.A.; Heath, L.S. Carbon Changes in U.S. Forests. In Productivity of America’s Forests and Climate Change; General Technical Report RM-GTR-271; Joyce, L.A., Ed.; United States Department of Agriculture, Forest Service, Rocky Mountain Forest and Experiment Station: Fort Collins, CO, USA, 1995; pp. 56–70. [Google Scholar]
  15. Goodale, C.L.; Apps, M.J.; Birdsey, R.A.; Field, C.B.; Heath, L.S.; Houghton, R.A.; Jenkins, J.C.; Kohlmaier, G.H.; Liu, S.; Nabuurs, G.; et al. Forest Carbon Sinks in the Northern Hemisphere. Ecol. Appl. 2002, 12, 891–899. [Google Scholar] [CrossRef]
  16. Flower, C.E.; Knight, K.S.; Gonzalez-Meler, M.A. Impacts of the emerald ash borer (Agrilus planipennis Fairmaire) induced ash (Fraxinus spp.) mortality on forest carbon cycling and successional dynamics in the eastern United States. Biol. Invasions 2013, 15, 931–944. [Google Scholar] [CrossRef]
  17. Higham, M.; Hoven, B.M.; Gorchov, D.L.; Knight, K.S. Patterns of Coarse Woody Debris in Hardwood Forests across a Chronosequence of Ash Mortality Due to the Emerald Ash Borer (Agrilus planipennis). Nat. Areas J. 2017, 37, 406–411. [Google Scholar] [CrossRef]
  18. Lovett, G.M.; Canham, C.D.; Arthur, M.A.; Weathers, K.C.; Fitzhugh, R.D. Forest ecosystem responses to exotic pests and pathogens in eastern North America. Bioscience 2006, 56, 395–405. [Google Scholar] [CrossRef]
  19. Telander, A.C.; Slesak, R.A.; D’Amato, A.W.; Palik, B.J.; Brooks, K.N.; Lenhart, C.F. Sap flow of black ash in wetland forests of northern Minnesota, USA: Hydrologic implications of tree mortality due to emerald ash borer. Agric. For. Meteorol. 2015, 206, 4–11. [Google Scholar] [CrossRef]
  20. Flower, C.E.; Gonzalez-Meler, M.A. Responses of Temperate Forest Productivity to Insect and Pathogen Disturbances. Annu. Rev. Plant Biol. 2015, 66, 547–569. [Google Scholar] [CrossRef] [PubMed]
  21. Hopkins, F.; Gonzalez-Meler, M.A.; Flower, C.E.; Lynch, D.J.; Czimczik, C.; Tang, J.; Subke, J.A. Ecosystem-level controls on root-rhizosphere respiration. New Phytol. 2013, 199, 339–351. [Google Scholar] [CrossRef] [PubMed]
  22. Cheng, W.; Parton, W.J.; Gonzalez-Meler, M.A.; Phillips, R.; Asao, S.; McNickle, G.G.; Brzostek, E.; Jastrow, J.D. Synthesis and modeling perspectives of rhizosphere priming. New Phytol. 2014, 201, 31–44. [Google Scholar] [CrossRef] [PubMed]
  23. Van Der Heijden, M.G.A.; Bardgett, R.D.; Van Straalen, N.M. The unseen majority: Soil microbes as drivers of plant diversity and productivity in terrestrial ecosystems. Ecol. Lett. 2008, 11, 296–310. [Google Scholar] [CrossRef] [PubMed]
  24. Allison, S.S.D.; Martiny, J.B.H. Resistance, resilience, and redundancy in microbial communities. Proc. Natl. Acad. Sci. USA 2008, 105, 11512–11519. [Google Scholar] [CrossRef] [PubMed]
  25. Ricketts, M.P.; Poretsky, R.S.; Welker, J.M.; Gonzalez-Meler, M. Soil bacterial community and functional shifts in response to altered snowpack in moist acidic tundra of Northern Alaska. Soil 2016, 2, 459–474. [Google Scholar] [CrossRef]
  26. Bailey, V.L.; Fansler, S.J.; Stegen, J.C.; McCue, L.A. Linking microbial community structure to β-glucosidic function in soil aggregates. ISME J. 2013, 7, 2044–2053. [Google Scholar] [CrossRef] [PubMed]
  27. Schimel, J.P.; Schaeffer, S.M. Microbial control over carbon cycling in soil. Front. Microbiol. 2012, 3, 1–11. [Google Scholar] [CrossRef] [PubMed]
  28. Fierer, N. Embracing the unknown: Disentangling the complexities of the soil microbiome. Nat. Rev. Microbiol. 2017, 15, 579–590. [Google Scholar] [CrossRef] [PubMed]
  29. Fierer, N.; Jackson, R.B. The diversity and biogeography of soil bacterial communities. Proc. Natl. Acad. Sci. USA 2006, 103, 626–631. [Google Scholar] [CrossRef] [PubMed]
  30. Lauber, C.L.; Hamady, M.; Knight, R.; Fierer, N. Pyrosequencing-Based Assessment of Soil pH as a Predictor of Soil Bacterial Community Structure at the Continental Scale. Appl. Environ. Microbiol. 2009. [Google Scholar] [CrossRef] [PubMed]
  31. Cho, S.J.; Kim, M.H.; Lee, Y.O. Effect of pH on soil bacterial diversity. J. Ecol. Environ. 2016, 40, 10. [Google Scholar] [CrossRef]
  32. Schlatter, D.C.; Bakker, M.G.; Bradeen, J.M.; Kinkel, L.L. Plant community richness and microbial interactions structure bacterial communities in soil. Ecology 2015, 96, 134–142. [Google Scholar] [CrossRef] [PubMed]
  33. Bakker, M.G.; Bradeen, J.M.; Kinkel, L.L. Effects of plant host species and plant community richness on streptomycete community structure. FEMS Microbiol. Ecol. 2013, 83, 596–606. [Google Scholar] [CrossRef] [PubMed]
  34. Prescott, C.E.; Grayston, S.J. Tree species influence on microbial communities in litter and soil: Current knowledge and research needs. For. Ecol. Manag. 2013, 309, 19–27. [Google Scholar] [CrossRef]
  35. Flower, C.E.; Knight, K.S.; Rebbeck, J.; Gonzalez-Meler, M.A. The relationship between the emerald ash borer (Agrilus planipennis) and ash (Fraxinus spp.) tree decline: Using visual canopy condition assessments and leaf isotope measurements to assess pest damage. For. Ecol. Manage. 2013, 303, 143–147. [Google Scholar] [CrossRef]
  36. Smith, A. Effects of Community Structure on Forest Susceptibility and Response to the Emerald Ash Borer Invasion of the Huron River Watershed in Southeast Michigan. Doctor’s Dissertation, Ohio State University, Columbus, OH, USA, 2006. [Google Scholar]
  37. Gilbert, J.A.; Jansson, J.K.; Knight, R. The Earth Microbiome project: Successes and aspirations. BMC Biol. 2014, 12, 69. [Google Scholar] [CrossRef] [PubMed]
  38. Caporaso, J.; Kuczynski, J.; Stombaugh, J. QIIME allows analysis of high—Throughput community sequencing data. Nat. Methods 2010, 7, 335–336. [Google Scholar] [CrossRef] [PubMed]
  39. Langille, M.G.I.; Zaneveld, J.; Caporaso, J.G.; McDonald, D.; Knights, D.; Reyes, J.A.; Clemente, J.C.; Burkepile, D.E.; Vega Thurber, R.L.; Knight, R.; et al. Predictive functional profiling of microbial communities using 16S rRNA marker gene sequences. Nat. Biotechnol. 2013, 31, 814–821. [Google Scholar] [CrossRef] [PubMed] [Green Version]
  40. Kanehisa, M.; Goto, S. KEGG: Kyoto encyclopedia of genes and genomes. Nucleic Acids Res. 2000, 28, 27–30. [Google Scholar] [CrossRef] [PubMed]
  41. R Core Team. R: A language and environment for statistical computing. R Foundation for Statistical Computing, Vienna, Austria. 2013. Available online: http://www.R-project.org/ (accessed on 3 March 2018).
  42. Oksanen, J.; Blanchet, F.G.; Friendly, M.; Kindt, R.; Legendre, P.; Mcglinn, D.; Minchin, P.R.; O’Hara, R.B.; Simpson, G.L.; Solymos, P.; et al. Vegan: Community Ecology Package. R Package Version 2.4-5. 2017. Available online: https://CRAN.R-project.org/package=vegan (accessed on 3 March 2018).
  43. McMurdie, P.J.; Holmes, S. Phyloseq: An R Package for Reproducible Interactive Analysis and Graphics of Microbiome Census Data. PLoS ONE 2013, 8. [Google Scholar] [CrossRef] [PubMed]
  44. Parks, D.H.; Tyson, G.W.; Hugenholtz, P.; Beiko, R.G. STAMP: Statistical analysis of taxonomic and functional profiles. Bioinformatics 2014, 30, 3123–3124. [Google Scholar] [CrossRef] [PubMed]
  45. Hobbs, R.J.; Huenneke, L.F. Disturbance, Diversity, and Invasion: Implications for Conservation. Conserv. Biol. 1992, 6, 324–337. [Google Scholar] [CrossRef]
  46. Kaiser, C.; Koranda, M.; Kitzler, B.; Fuchslueger, L.; Schnecker, J.; Schweiger, P.; Rasche, F.; Zechmeister-Boltenstern, S.; Sessitsch, A.; Richter, A. Belowground carbon allocation by trees drives seasonal patterns of extracellular enzyme activities by altering microbial community composition in a beech forest soil. New Phytol. 2010, 187, 843–858. [Google Scholar] [CrossRef] [PubMed]
  47. Urbanová, M.; Šnajdr, J.; Baldrian, P. Composition of fungal and bacterial communities in forest litter and soil is largely determined by dominant trees. Soil Biol. Biochem. 2015, 84, 53–64. [Google Scholar] [CrossRef]
  48. Lejon, D.P.H.; Chaussod, R.; Ranger, J.; Ranjard, L. Microbial Community Structure and Density under Different Tree Species in an Acid Forest Soil (Morvan, France). Microb. Ecol. 2005, 50, 614–625. [Google Scholar] [CrossRef] [PubMed]
  49. Ward, N.L.; Challacombe, J.F.; Janssen, P.H.; Henrissat, B.; Coutinho, P.M.; Wu, M.; Xie, G.; Haft, D.H.; Sait, M.; Badger, J.; et al. Three Genomes from the Phylum Acidobacteria Provide Insight into the Lifestyles of These Microorganisms in Soils. Appl. Environ. Microbiol. 2009, 75, 2046–2056. [Google Scholar] [CrossRef] [PubMed]
  50. Burns, R.M.; Honkala, B.H. Fraxinus. In Silvics of North America: Volume 2, Hardwoods; Agriculture Handbook 654; United States Department of Agriculture, Forest Service: Washington, DC, USA, 1990; Volume 2, pp. 333–357. ISBN 1800553684. [Google Scholar]
  51. Kielak, A.M.; Barreto, C.C.; Kowalchuk, G.A.; van Veen, J.A.; Kuramae, E.E. The ecology of Acidobacteria: Moving beyond genes and genomes. Front. Microbiol. 2016, 7, 1–16. [Google Scholar] [CrossRef] [PubMed]
  52. Margalef, O.; Sardans, J.; Fernández-Martínez, M.; Molowny-Horas, R.; Janssens, I.A.; Ciais, P.; Goll, D.; Richter, A.; Obersteiner, M.; Asensio, D.; et al. Global patterns of phosphatase activity in natural soils. Sci. Rep. 2017, 7, 1–13. [Google Scholar] [CrossRef] [PubMed]
  53. Turner, B.L.; Lambers, H.; Condron, L.M.; Cramer, M.D.; Leake, J.R.; Richardson, A.E.; Smith, S.E. Soil microbial biomass and the fate of phosphorus during long-term ecosystem development. Plant Soil 2013, 367, 225–234. [Google Scholar] [CrossRef]
  54. Richardson, A.E.; Simpson, R.J. Soil Microorganisms Mediating Phosphorus Availability Update on Microbial Phosphorus. Plant Physiol. 2011, 156, 989–996. [Google Scholar] [CrossRef] [PubMed]
  55. Ferrenberg, S.; Knelman, J.E.; Jones, J.M.; Beals, S.C.; Bowman, W.D.; Nemergut, D.R. Soil bacterial community structure remains stable over a 5-year chronosequence of insect-induced tree mortality. Front. Microbiol. 2014, 5, 1–11. [Google Scholar] [CrossRef] [PubMed]
Figure 1. Map of study sites within Delaware County, Ohio.
Forests 09 00187 g001
Figure 2. Non-metric multidimensional scaling (NMDS) plot where each point represents the bacterial/archaeal community structure of a sample (stress = 0.080, Shepard plot non-metric R2 = 0.994). Color indicates ash vs. non-ash plots and shape indicates forest site. Ellipses represent 95% confidence intervals of centroids for ash and non-ash plots. Bacterial/archaeal community structures differed significantly between ash and non-ash plots (adonis p = 0.002).
Forests 09 00187 g002
Figure 3. Boxplot comparing the average Hellinger transformed abundances of the 10 most abundant bacterial/archaeal phyla between ash (blue) and non-ash (orange) plots. Mann-Whitney U-test significance is denoted by asterisks, where * = p < 0.05, ** = p < 0.01 and *** = p < 0.001.
Forests 09 00187 g003
Figure 4. Linear relationships between canopy tree health (mean AC) of ash plots only (n = 11) and Hellinger transformed abundances of the 10 most abundant bacterial phyla.
Forests 09 00187 g004
Figure 5. Functional gene abundance comparisons between ash (blue) and non-ash (orange) plots at KEGG levels 2 (a) and 3 (b). Extended bar graphs (left) show differences in the mean proportions of functional genes required for biogeochemical cycling and are ordered by decreasing effect size (right), calculated by subtracting non-ash from ash mean proportions. The color of the effect size markers indicate in which plots gene abundance was greater and the shape indicates KEGG grouping, where circles represent carbohydrate metabolism and squares represent energy metabolism. Error bars represent 95% Welch’s inverted confidence intervals. Welch’s two-tailed t-test was used with Benjamini-Hochberg FDR procedure to obtain corrected q-values. All statistics and graphics were produced using STAMP software.
Forests 09 00187 g005
Figure 6. Pearson’s correlation matrix comparing the ten most abundant bacterial phyla to level 3 KEGG functional categories, ordered as in Figure 5. Circle color indicates either a positive (blue) or negative (red) correlation and circle size and shading are proportional to correlation coefficients regardless of statistical significance. Bonferroni adjusted significance (p < 0.05) is indicated by white asterisks.
Forests 09 00187 g006
Figure 7. Theoretical diagram representing possible successional trajectories of bacterial communities over time in forests suffering from ash decline as a result of EAB infestation, where in Scenario 1 the communities stay the same, in Scenario 2 they become more similar to communities in non-ash plots, and in Scenario 3 they develop a community structure different than in either ash or non-ash plots. NMDS ordination space represents hypothetical differences in bacterial community structure based on Figure 2.
Forests 09 00187 g007
Table 1. Summary of site characteristics. The total basal area (BA) is the mean ± standard error of all plots, while the relative BA of ash trees is from only ash plots.
ForestSoil Type 1Number of Plots (Ash/Non-ash)BA (m2/ha)Relative BA of Ash Trees (%)
Bohannan (BHN)Cardington silt loam3/237.7 ± 2.549.3 ± 5.7
Kraus (KRS)Glynwood silt loam3/234.7 ± 3.063.2 ± 4.4
Seymour (SYM)Blount silt loam2/226.0 ± 3.046.5 ± 6.0
Stratford (STR)Glynwood silt loam3/333.9 ± 5.035.5 ± 13.0
1 Primary soil type ascertained from NRCS web soil survey.
Table 2. Summary of statistical results. Adonis tests were used to analyze differences in overall bacterial community structure and overall soil chemical characteristics between categorical variables (a). Continuous variables were analyzed individually (b) for differences between ash and non-ash plots (Mann-Whitney U test), differences in forest sites (Kruskal-Wallis), and for correlations between overall bacterial community structure and individual variables (Mantel test). Alpha diversity was calculated using the Shannon diversity index (H). Text in bold and italics represents a significant result (p < 0.05).
(a)Adonis Test
Bacterial CommunitySoil Environment
Categorical VariablesR2p-valueR2p-value
Ash vs. Non-ash0.3340.0020.0980.066
Forest site0.1400.5020.3010.003
(b)Mann-Whitney U Test
(Ash vs. Non-Ash)
Kruskal-Wallis Test
(Forest Site; df = 3)
Mantel Test
(Bacterial Community)
Continuous VariablesWp-valueHp-valuer-statisticp-value
Mean AC (ash only)--9.240.026−0.0600.620
Mean Stems (#/ha)75.50.0518.780.032−0.1270.870
Mean BA (m2/ha)690.1525.230.1560.0600.261
Ash (%)--1.190.7550.2640.007
Maple (%)491.0004.420.2200.0410.306
Oak (%)110.0034.130.2470.0300.338
Beech (%)570.57012.090.0070.1820.097
Hickory (%)53.50.7433.030.3870.0280.334
α-diversity (tree)60.50.4255.670.129−0.0480.631
α-diversity (bacteria)540.7664.070.2540.0390.329
Soil pH730.0803.880.2750.2890.006
%C49.51.00011.510.009−0.1730.981
%N580.54112.960.005−0.1750.986
C:N34.50.27010.150.017−0.1340.911
Ca690.1524.530.2100.3040.007
K420.6033.710.295−0.0300.594
Mg670.2014.810.1860.2740.011
P491.00012.350.006−0.0880.846
Al290.1319.710.0210.1770.045
B400.4943.640.303−0.0750.708
Cu12.50.0060.320.9570.0470.304
Fe180.0161.490.6850.2730.010
Mn480.9412.110.550−0.1430.921
Na560.6566.370.0950.0020.439
S240.0560.880.831−0.1430.924
Zn400.5039.790.0200.0830.241

