1. Introduction
The impacts of the loss of tree species to forest pests and diseases highlight the need to understand the drivers of tree susceptibility to these threats. Two potential drivers of tree susceptibility to pests and diseases are tree neighborhood composition and soil nutrient availability. Tree neighborhood composition is influenced by tree interactions, such as competition, facilitation, and spread of pests and diseases. Plant composition is hypothesized to be based on a tradeoff between plants competing at high quality soil nutrient sites and tolerating poor quality soil nutrient sites [
1]. Tree composition can change rapidly with the introduction or increase in tree pests and diseases. Insects that differ in their biology may exhibit different relationships with the density of their host. Some insects have greater impacts on host trees when host density is high, a phenomenon called the Resource Concentration Hypothesis [
2]. Others have lower impact at high host density, supporting the Resource Dilution Hypothesis [
3]. Emerald ash borer, (EAB) (
Agrilus planipennis) has shown patterns in accordance with the resource dilution hypothesis during the initial outbreak, causing more rapid mortality in natural tree stands with low ash densities [
4]. Therefore, tree composition of an area can influence ash survival, and the spatial distribution of ash may be related to the influence of soil nutrient availability and tree composition.
Soil nutrient availability may influence tree survival of pests and diseases. Some have hypothesized that trees fend off and/or survive pests and disease better in resource limited environments because in those conditions, plants put more energy into creating chemical defenses [
5]. However, research results on effects of soil nutrients on defenses have varied, as the degree of defense that trees exhibit can be attributed to multiple factors, both environmental and genetic. Research results from pine weevil (
Hylobius abietis) studies that added soil nutrients to trees for protection showed no difference in pest damage [
6] or an increase in pest damage [
7]. In another study, addition of soil nutrients to aspen seedlings showed varying changes in three foliar defense chemicals [
8]. Variations in the degree of defense that trees exhibit can be attributed to multiple factors, including both genetic and environmental variation as well as interactions between the two. Unfortunately, tree defenses are usually not adapted to non-native diseases or pests.
The invasive EAB beetle has devastated populations of North American ash species. EAB is a specialist beetle from Asia that feeds and reproduces on all
Fraxinus species, and was introduced near Detroit, MI, USA [
9,
10]. EAB spreads by flight and had been estimated to have a maximum cumulative flight distance of 9.8 km over a female beetle’s life span [
11]. EAB seeks out ash using both visual and olfactory cues [
12]. EAB scale of dispersal from host trees has been estimated as 100 m to 200 m, dependent on ash phloem abundance, indicating that the scale of dispersal may be different in an aftermath forest which contains a different amount of ash phloem abundance [
13]. There are multiple indicators of EAB damage including development of basal or epicormics sprouts, woodpecker holes, and EAB exit holes, although EAB exit holes are usually the last indicator to be seen on the tree trunk [
10]. The damage EAB create usually starts in the upper canopy, and research has shown that ash canopy health is highly indicative of the amount of EAB damage done [
14].
Green ash (
Fraxinus pennsylvanica) is a deciduous tree that can grow up to 20 m tall and has small (50 mm × 6 mm) winged seeds that are wind and water dispersed [
15]. The lifespan of green ash in natural stands averages 65 years [
16]. In natural areas, green ash is typically found in bottomland forests, but is adapted to a variety of areas across the Eastern United States [
17]. This species is tolerant of several environmental stressors including high salinity, flooding, drought, and high alkalinity [
9].
While EAB typically kills most of the mature ash trees in forest settings [
4] a small number of surviving ash remain. The term lingering ash refers to healthy ash trees with a diameter at breast height (DBH) >10 cm that have survived for at least two years after the initial ash mortality rate reached 95% from EAB. Although some lingering ash trees may simply be the last to be infested, others have been shown to have rare phenotypes that increase their resistance [
18]. Despite the ability of lingering ash to remain healthy longer, they are still vulnerable to infestation by EAB. Lingering ash trees were first identified in the Oak Openings Preserve Metropark of Northwest Ohio and Indian Springs Metropark of Southeast Michigan in 2009 [
19].
The Oak Openings Region is a mixed disturbance landscape containing natural ecosystems in a mosaic of small to large remnant habitat patches, surrounded by a matrix of agriculture and urban development. Prior to human settlement the area was composed of oak savanna, oak woodland, oak barrens, wet prairie, floodplain forests, and surrounded by black swamp forest [
20]. Composition of Oak Openings Preserve Metropark floodplain includes sections that are considered silver maple-elm-cottonwood forest and maple-ash-elm forest [
21]. Multiple studies have included this ash population in investigations related to EAB [
4,
14,
18,
19]. EAB is still present in the floodplain which contains a remnant cohort of lingering green ash within other smaller size classes of green ash that may not have been infested when the initial infestation occurred. Floodplain forest soil types consist of loam and sandy variations [
22]. This region is a biodiversity hotspot that is undergoing large changes from the EAB invasion and other factors.
The objectives of this study were to determine if neighboring tree composition and/or soil nutrient variables differed among ash canopy health classes. Specifically, we compared the effects of ash tree neighbors, other tree species neighbors, and soil nutrients within the A horizon of ash tree root area on ash canopy health. We expected that healthier ash would be in locations with fewer tree competitors in soils with more available limiting nutrients important for growth, such as phosphorus. Investigation of this study site will help us better understand changes in a natural forest after the initial EAB decline in ash trees and may provide insights into potential restoration and land management options that could improve natural ash remnants.
2. Materials and Methods
An ash survey was conducted in the summer yearly from 2010 to 2017 at the Oak Openings Preserve Metropark Swan Creek floodplain in Ohio, which is approximately 1.23 km
2 (41.582133, −83.861483 to 41.538543, −83.824938). For each ash the following data were recorded: DBH (cm), canopy health class, crown ratio (the ratio of crown length to total tree height), presence of flowers or seeds, and signs of EAB. Signs of EAB included bark splitting, EAB exit holes and woodpecker feeding holes on the trunk between 1.25 and 1.75 cm from the ground, and the presence of basal and epicormic branching. Bark splitting and presence of basal and epicormic branching indicate tree response to stress and damage, while woodpecker holes and EAB holes indicate EAB presence. Woodpecker holes and EAB exit holes higher in the tree may appear earlier in the infestation of the tree but were not visible from the ground and thus were not counted. Therefore, the lack of exit holes or woodpecker holes on the lower trunk does not mean the tree was uninfested. Canopy health class was categorized from 1 to 5 based on thinning and dieback, with 1 having a full/healthy canopy, 2 having thinning of leaves but no dieback, 3 having a canopy with <50% dieback, 4 having a canopy with >50% dieback, and 5 having no canopy leaves, but epicormics sprouts may be present [
23,
24].
A subset of focal ash trees was chosen using stratified random sampling of ash trees surveyed in 2016, stratified based on their canopy health class. With trees rated 5, we only kept those most recently deceased (2016) and removed others rated 5. We checked that the selected trees were at least 50 m from each other (checked in ArcGIS with their GPS points) to reduce spatial autocorrelation. When checking for spatial autocorrelation if one tree had to be removed, we gave preference to keep trees with more years of data. We included up to 10 trees within each canopy health class, but the spatial rule constrained some canopy health class categories to fewer trees. Thus, each ash canopy health class included seven to ten trees (n = 44; class 1 = 9, class 2 = 10, class 3 = 7, class 4 = 10, class 5 = 8).
Distance to nearest living neighbor trees and their species identity were recorded. Nearest neighbor trees were defined as any tree or woody shrub over 1.37 m tall within a 6-m radius of the focal ash tree. The neighborhood of each ash tree was set at a radius of 6 m since effects from other trees have been shown to occur at smaller spatial scales [
25,
26].
To assess available nutrients, soil samples were taken once during June 2016 at each selected focal ash tree (n = 44). A galvanized 1-inch diameter soil corer was used to collect samples from the first 6 inches of the soil, removing surface organic material. Soil samples taken at each focal ash tree consisted of 4 sub-sampling points located 2 m from the tree trunk at cardinal directions. Soil samples from treeless floodplain sites were taken as a comparison (n = 8). Treeless samples had 4 sub-sampling points at cardinal directions 4 m from the center of an 8-m diameter circular area where no trees were present. The 4 sub-samples from one tree were homogenized in one plastic bag and kept cool till it could later be air dried. The soil corer was cleaned with distilled water and wiped dry after each sample was collected. Standard analyses of soils were performed (Brookside Laboratories, New Breman, OH, USA) including: pH in water, base saturation of cations (%), organic matter (%, based on the loss on ignition method), estimated nitrogen release (#’s N/acre, estimate of amount released annually through organic matter decomposition, based on the loss on ignition method), Bray II phosphorus (mg/kg), and total exchange capacity (meq/100 g). Percentages of the following nutrients pertaining to the total exchange capacity of the soil were analyzed: potassium, calcium, magnesium, sodium, hydrogen, other bases. Mehlich III extractables analyzed included: potassium (mg/kg), phosphorus (mg/kg), calcium (mg/kg), magnesium (mg/kg), sodium (mg/kg), zinc (mg/kg), copper (mg/kg), manganese (mg/kg), iron (mg/kg), aluminum (mg/kg), sulfur (ppm), and boron (mg/kg). The type of soil present at each tree site was identified from Lucas County soil survey data (2003) created by the United States Department of Agriculture, Natural Resources Conservation Service viewed in ArcMap 10.2 (ESRI, Redlands, CA, USA).
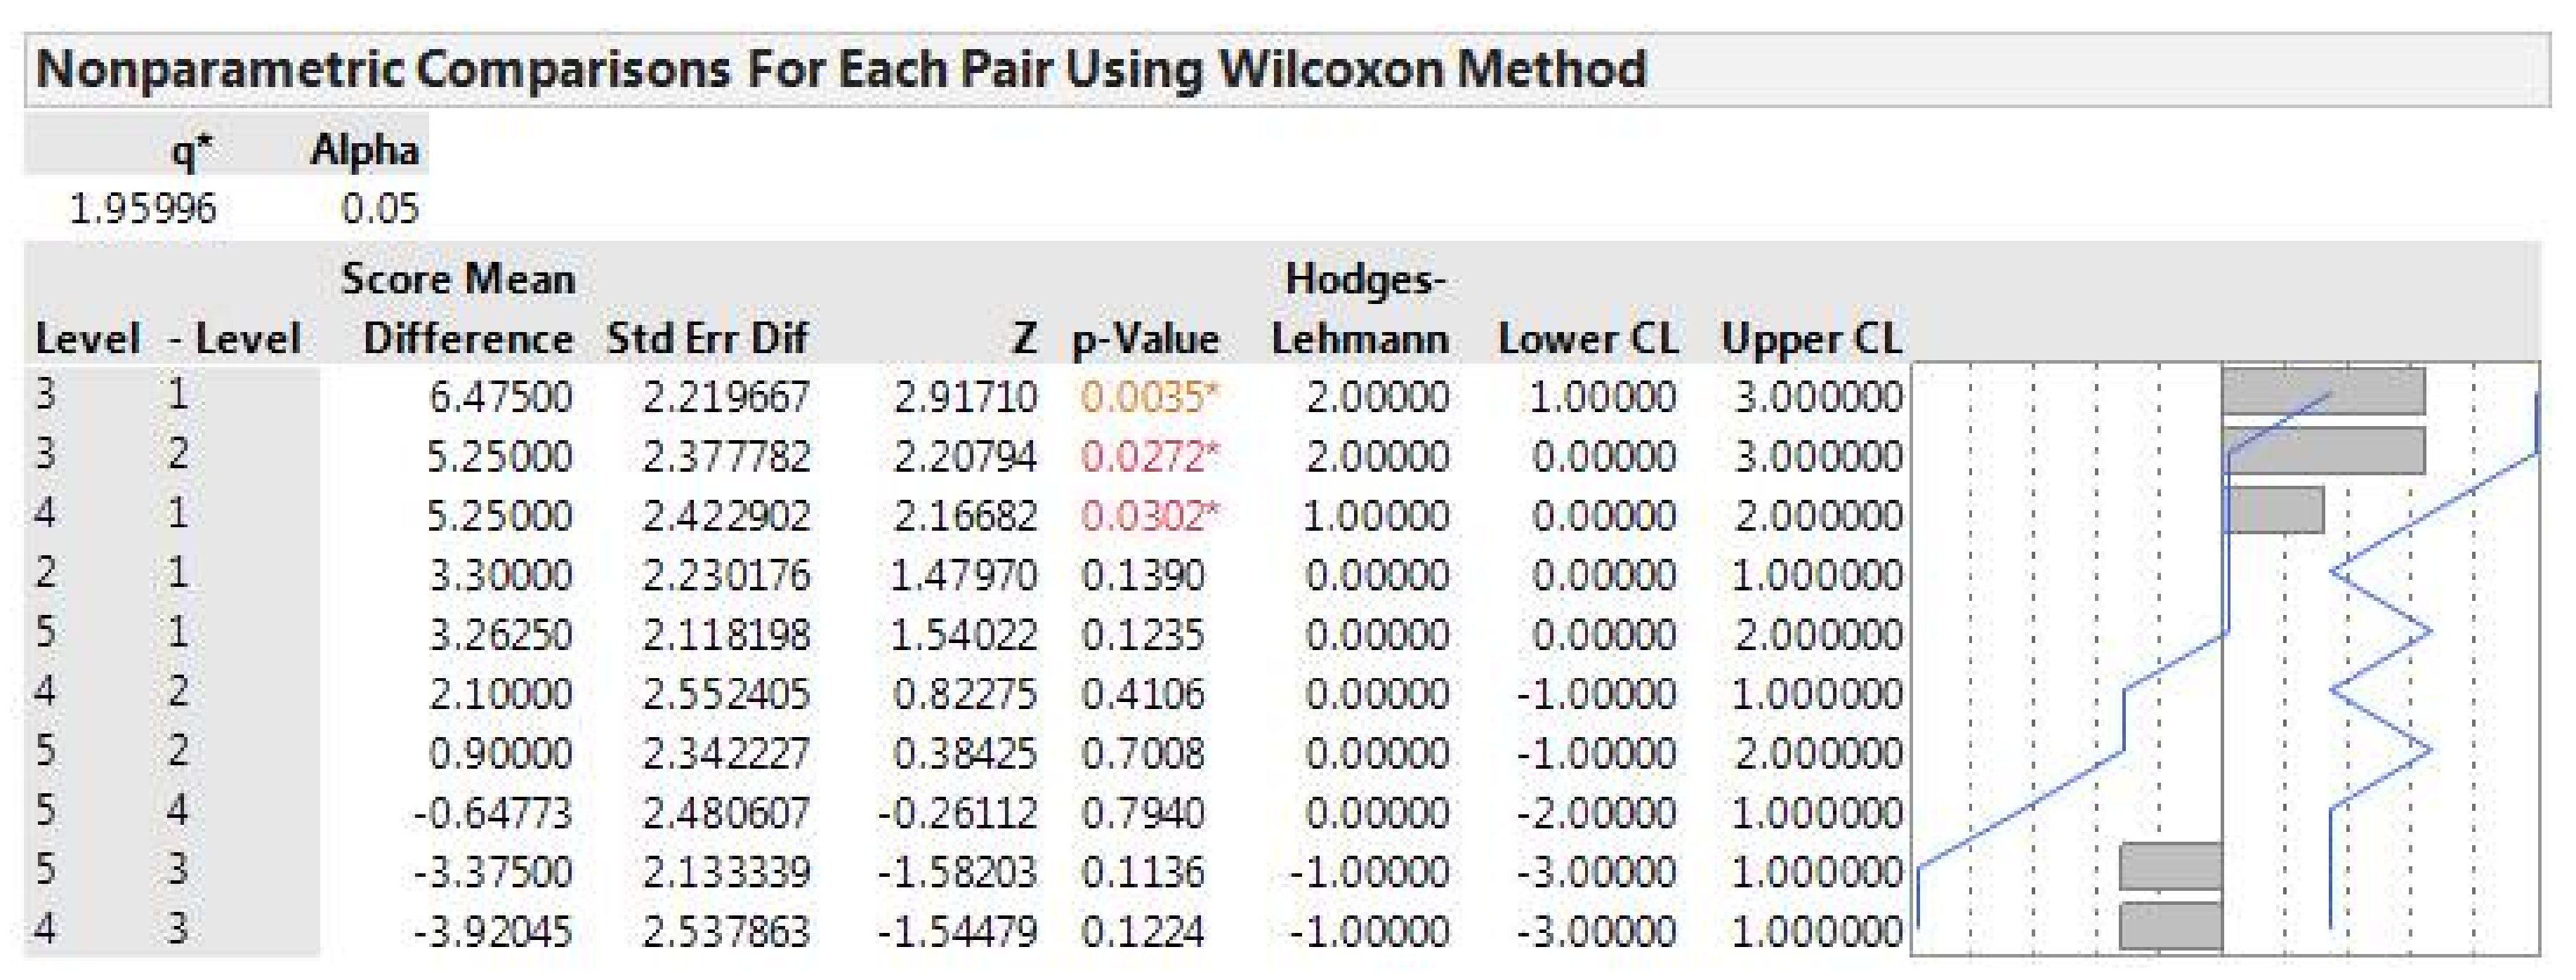
Data collected were not normally distributed; therefore, we used a nonparametric Wilcoxon rank sum test in JMP (SAS Institute, Cary, NC, USA) to examine the relationship between measured variables and focal ash canopy health classes. These variables were the total number of nearest neighbors (all species), number of nearest living ash trees, and select uncorrelated individual soil nutrients. A post-hoc paired Wilcoxon test was performed among ash canopy health classes and significant variables (
Appendix A). A Spearman’s correlation was used to compare the nutrient variables with each other, and those highly correlated (
ñ > 0.70) with another nutrient were removed. The ones that were removed were chosen because they correlated with estimated nitrogen or phosphorus, identified as important nutrients in the literature. A Spearman’s correlation test was also used to assess relationships between the ten select nutrient variables (pH, estimated nitrogen release, sulfur, phosphorus, Brays II phosphorus, sodium, boron, magnesium, copper, aluminum), number of ash neighbors, and total number of neighbors to check for strong correlations. To assess if tree presence alone had any effect on select soil nutrients, a Wilcoxon rank sum test was used to compare between ash tree sites and treeless sites. We used a Bonferroni correction for multiple comparisons to establish a cut-off for statistical significance.
3. Results
In the floodplain forest, the most prominent neighbor tree species found (from most to least numerous): green ash, Eastern cottonwood (
Populus deltoides), boxelder (
Acer negundo), willow (
Salix spp.), American elm (
Ulmus americana), buttonbush (
Cephalanthus occidentalis), hawthorn (
Crataegus sps.), silver maple (
Acer saccharinum), and oak (
Quercus spp.) (
Table 1). For the neighbor analysis, the highest number of neighbors any one ash tree had in the 6-m radius was seven trees. Over all the 44 focal trees, 54% of the neighboring trees were green ash.
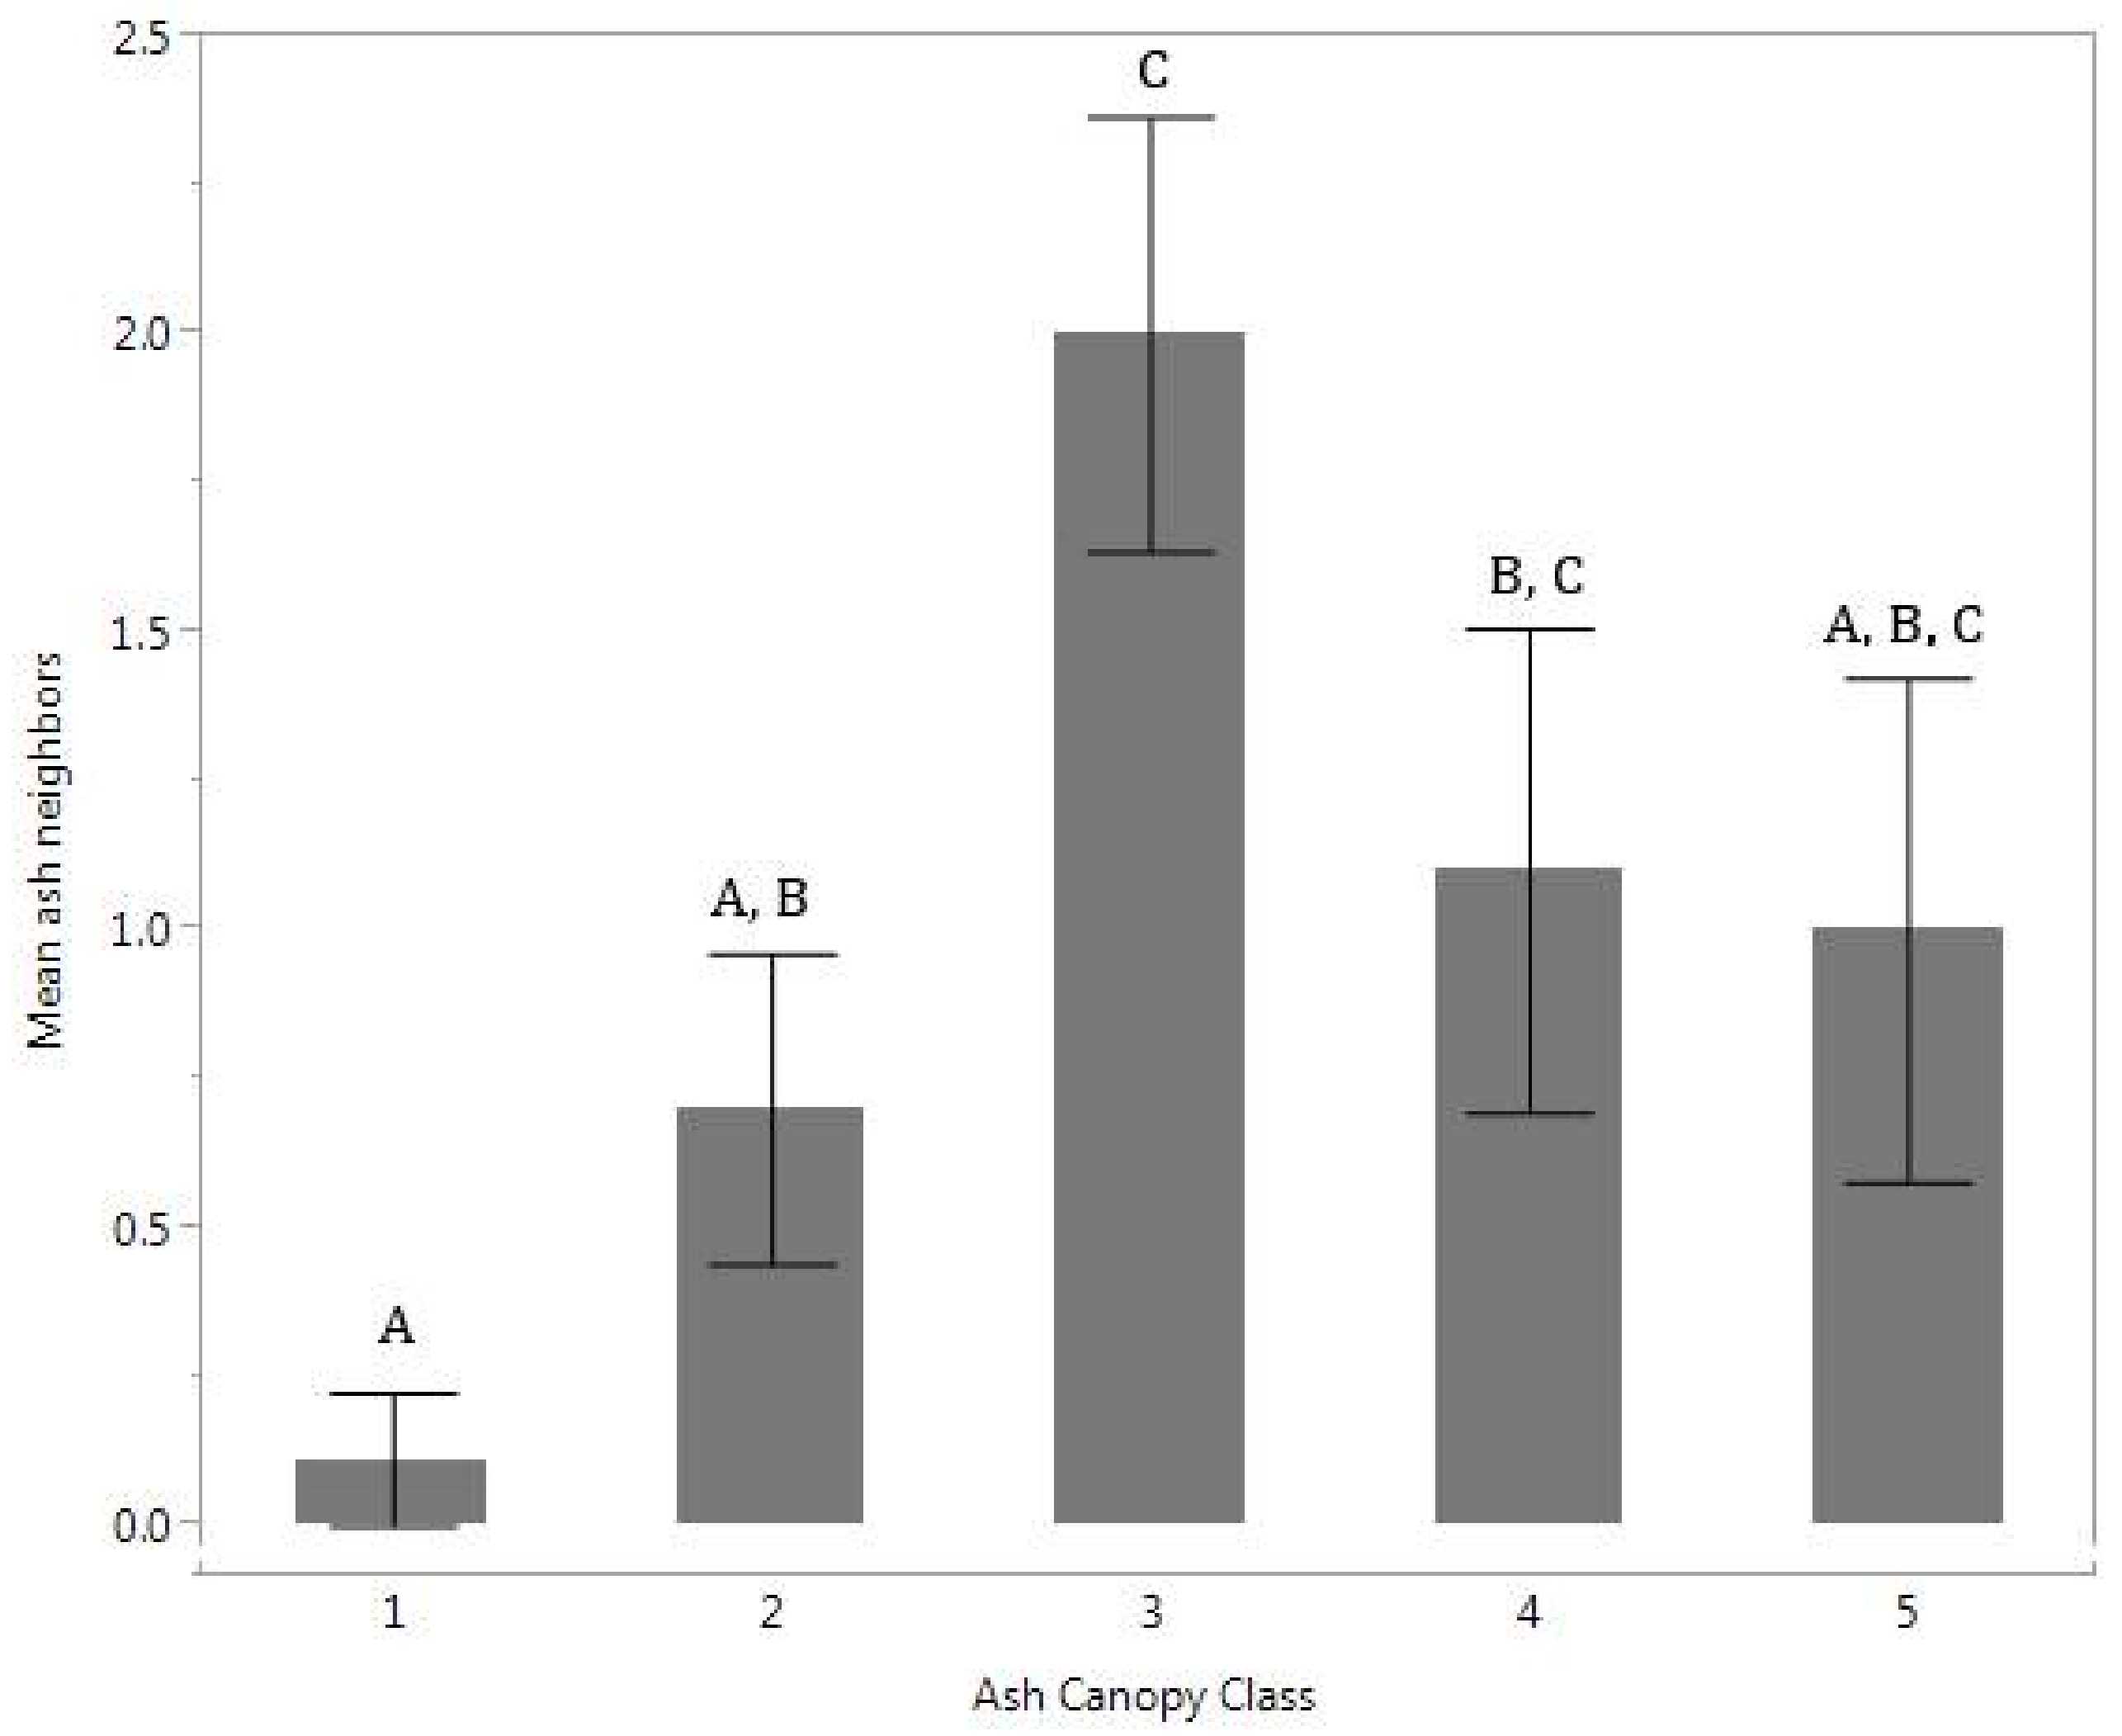
The distribution of total living ash tree neighbors differed significantly among the ash canopy health classes (
p = 0.02) (
Figure 1). Ash with healthier canopies was usually found with no ash neighbors within a 6-m radius, while other ash health classes had on average one or two neighbors. No difference was found when comparing total number of neighboring trees in each ash canopy health class. Total number of neighbors was positively correlated with number of ash neighbors (
ñ = 0.78,
p < 0.001).
Focal ash trees were typically 15–25 cm DBH (
Table 2), much larger than the minimum susceptible size of 2 cm for EAB attack. The number of EAB holes and woodpecker holes generally increased with canopy health classes. Many of the healthy trees exhibited a very large crown ratio averaging 81% for the trees with a canopy health class rating of 1, typical of trees growing in open conditions. Presence of basal sprouts, epicormic sprouts and splitting increased with canopy health classes, although sprouts decreased from category 4 to 5 with the death of the trees.
While the Oak Openings site contains sloan loam, udorthents loam, granby loam, Oakville fine sand, Ottokee fine sand, Dixboro fine sand, Tedrow fine sand, the floodplain soil was made up of saturated loam (So) for all the sampled ash trees. No significant differences were found in available soil nutrients among the ash canopy health classes. No significant correlations were found between EAB symptoms and soil nutrients or neighboring tree abundance. The soil samples had relatively neutral pH and only sulfur and phosphorus varied in abundance between treeless sites and ash samples (
Table 3).
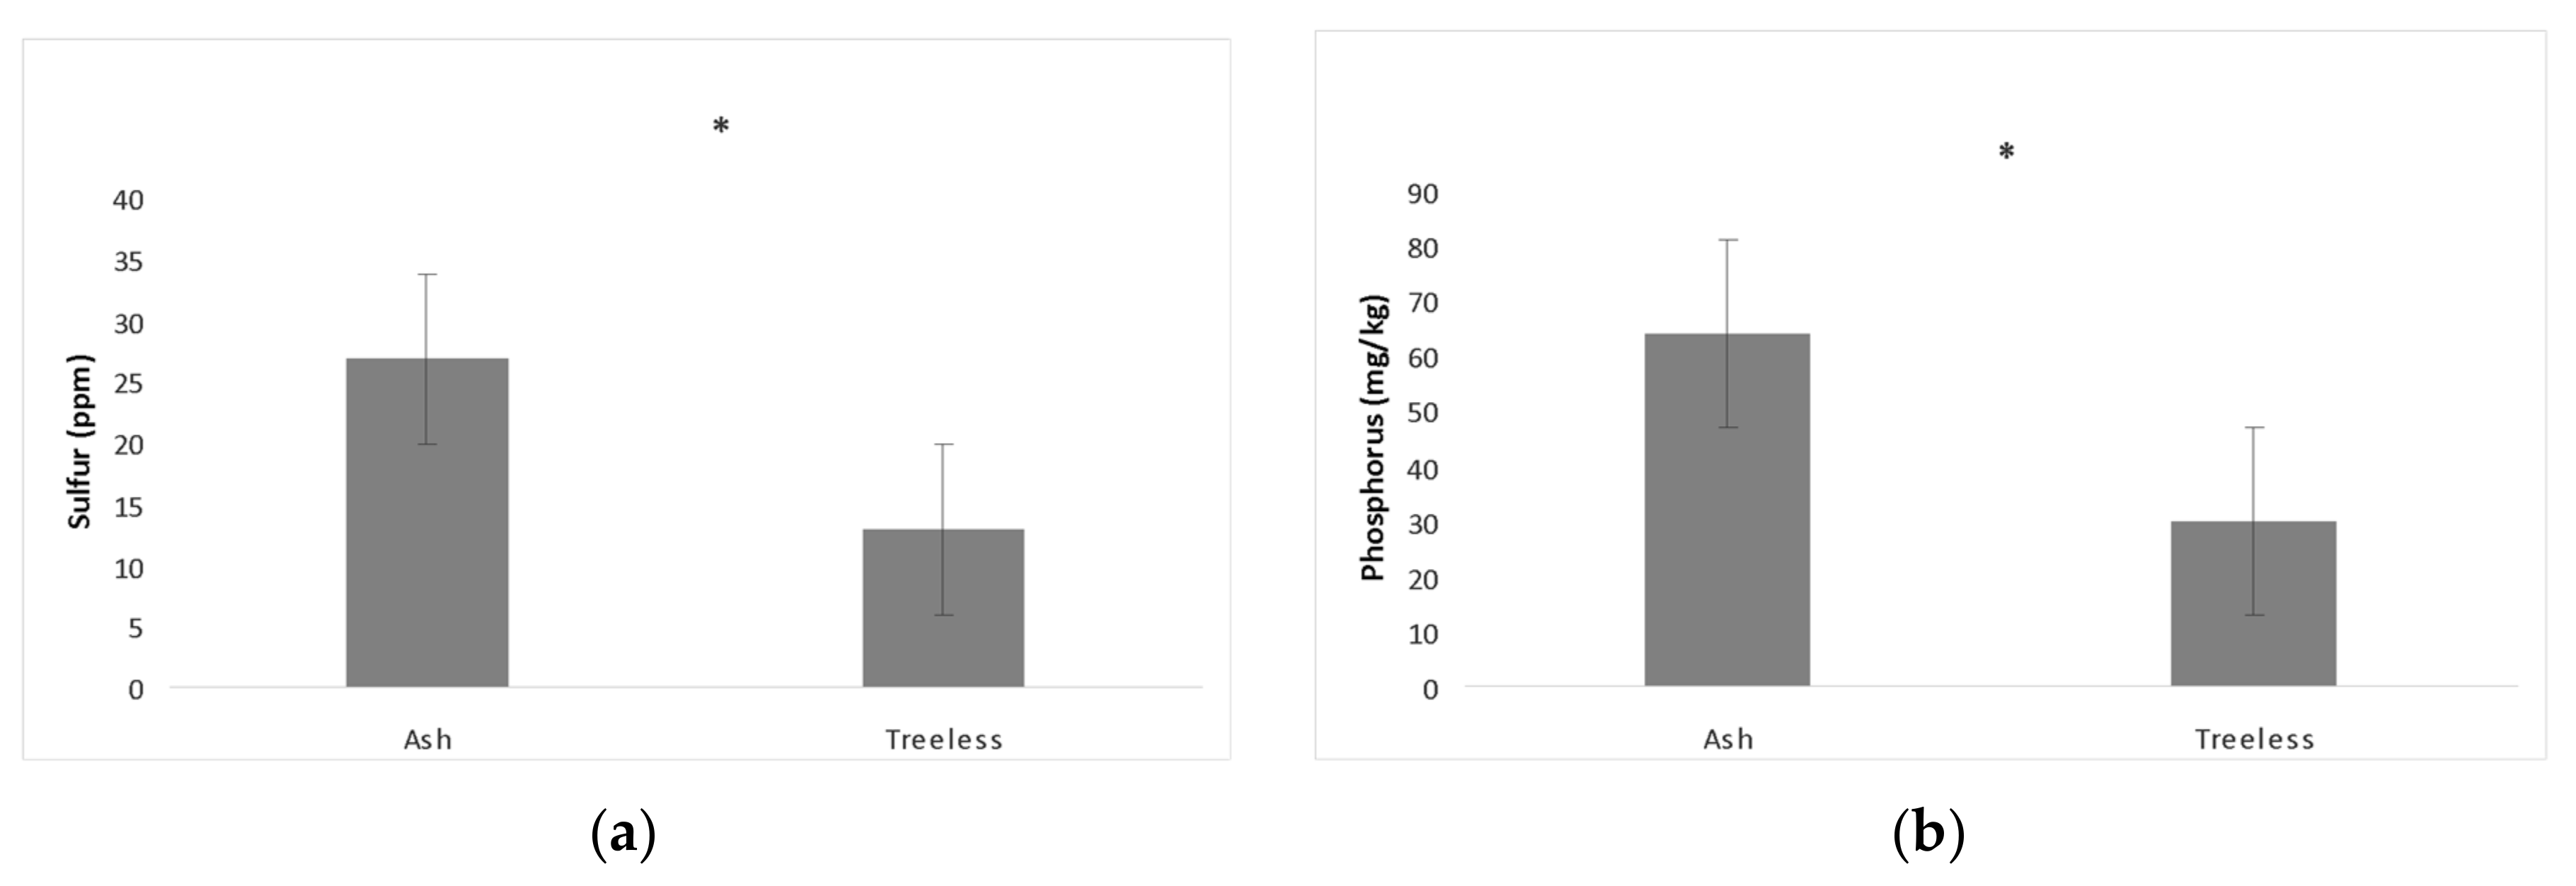
Sulfur (
p < 0.0001) and phosphorus (mg/kg) (
p < 0.0001) were found to be higher in soil sampled near ash trees compared to treeless sites (
Figure 2).
We also found two general trends in correlations between ash tree soil nutrients and tree neighbor variables. There was a positive correlation between Bray II phosphorus and total number of all neighbors (ñ = 0.38, p = 0.03), and a negative correlation between copper and number of ash neighbors (ñ = −0.42, p = 0.01).
4. Discussion
This study tested the relationship between neighboring tree composition, soil nutrients and canopy health class of ash after peak EAB infestation. We expected that healthier ash would be in locations with fewer tree competitors and more available nutrients important for growth, such as phosphorus. We found that the healthiest ash trees, in ash canopy health class 1, had few or no neighboring ash trees within a 6-m radius (
Figure 1). Nutrient composition in the floodplain did not differ between ash canopy health classes but differed between ash tree and treeless sites in the amount of phosphorus and sulfur (
Figure 2). General trends were found between copper and fewer ash neighbors, as well as phosphorus and an increase in all neighbor species. These results suggest that specific tree neighborhood composition in an EAB aftermath forest may drive ash tree susceptibility to pests.
There may be multiple reasons for the difference in phosphorus and sulfur in the soil between ash and treeless sites. Treeless sites could have anoxic conditions for a portion of the year from flooding inundation; these sites were only partially dry when samples were taken. Partial drying of previously inundated sediments will result in increased sediment affinity for phosphorus and may have resulted in the observed reduction in phosphorus at treeless sites [
27]. In addition, 50% of phosphorus in areas where it is limited can be immobilized by microbes, further limiting availability to plants [
28]. The amount of sulfate adsorption in the soil also increases with the amount of clay, and sites with higher clay content are more susceptible to flood due to poor drainage, like our treeless sites [
29]. Organic sulfur has been shown to be highly soluble in adjacent stream slopes, leaving on average <5% unabsorbed after 24 h in a mobilization experiment [
30]. Trees may not be able to establish at these soil sites as a result of nutrient adsorption to soil particles. Ash trees with fewer ash neighbors had slightly more copper in their samples, which is an important micronutrient for photosynthesis, metabolism, and potentially nitrogen fixation [
31]. Ash trees with fewer neighbors were shown to have a healthier canopy, but the correlation with copper may not be the driver as variation in copper was small. The differences we found in nutrients (
Table 3) may be driven by a number of factors. With no difference in soil nutrients between the ash canopy health classes, we suspect the differences found may simply be related to whether trees were present or not, and site heterogeneity.
Despite increased likelihood of EAB attacks due to ash neighbor proximity, the impact of these attacks and the degree of tolerance to them could have varied depending on various environmental factors and the specific genotype of each separate lingering ash tree, which would also contribute to variation in the number of trunk exit holes. There were exit holes in all canopy classes except class 1 (
Table 2). The small number of exit holes indicated trees across most canopy classes are still being attacked but may also reflect the current low level EAB population. It is possible that the number of EAB exit holes on the lower trunk do not reflect the number in the canopy, which were not counted. For example, one study has shown locations where larvae development increased on stems/branches up to 13 cm in diameter and occurred at certain bark thickness (1.5–5 mm) [
32]. Another study revealed that two mid-canopy branches (sampling two 25 cm sections each) were 18 times more likely to allow detection of low density EAB larvae than a trunk window (25 cm wide by 25% circumference of trunk bark removal above 1.3 m) [
33]. The number of exit holes may not be representative of the amount of EAB feeding damage within the tree because in lingering ash trees, host defenses may have prevented larvae from becoming adults. Even if a higher proportion of larvae was killed, larval feeding prior to death still caused damage, impacting canopy development.
We found that the number of neighboring ash trees was related to ash canopy health (
Figure 1). One potential explanation for this finding includes intraspecific competition: this floodplain was dominated by ash, leaving less chance for other tree species interactions. Local conspecifics can also have effects on pests or pathogens, with EAB the most likely culprit. According to the resource concentration theory, live ash near each other are more likely to encounter EAB [
2]. In our case, this theory works in that ash with few or no neighbors are healthier. However, low density ash tree stands, which presumably would have had fewer ash neighbors, died from EAB faster than ash in high density stands, supporting the resource dilution theory [
4]. There are two possible explanations for this discrepancy, which may be interconnected: that the relationship between ash neighbors and ash health is: (1) scale-dependent, with resource concentration theory operating at neighborhood scales and resource dilution theory operating at stand scales or (2) invasion phase dependent, with resource dilution theory operating during the initial invasion of EAB and resource concentration theory operating during the aftermath phase.
There are examples of scale-dependence in tree density and pest density. Observing the neighborhood composition at a small scale surrounding individual ash has revealed a specific distance at which ash experience conspecific interactions. Female and male Asian ash trees (
F. manshurica) have been shown to have negative effects on same sex ash trees at distances under 10 m, suggesting intrasexual competition in ash at a small spatial scale [
25]. In insect studies, a honeylocust tree (
Gleditsia tricanthos) study showed pest susceptibility varied at different scales; density of honeylocust had effects on three pest species (honeylocust plant bug, honeylocust spider mite, mimosa webworm) abundances at the largest scale (100 m), whereas only one pest (non-native mimosa webworm) had a slightly reduced abundance from increased honeylocust density at the smallest scale (10 m) [
34]. Scale of response to forest cover by native long horn beetle species had a wide range that varied by species, indicating beetle spatial response should not be assumed based on similar species [
35]. EAB scale of dispersal from host trees has been shown to be mostly within 100 m, and up to 200 m, dependent on ash phloem abundance [
13]. These studies show how both tree density and pest density have scale-dependent interactions. Additional studies in multiple spatial scales would be needed to fully understand the scale-dependence of EAB-ash interactions in an aftermath forest.
It is also possible that different processes operate during different phases: the initial phase is characterized by high EAB populations, highly susceptible ash populations, and rapid ash mortality. Although female EAB are efficient at locating healthy green ash, they prefer stressed, but not dying trees [
36]. During the initial invasion of EAB, the majority of ash trees were stressed. The aftermath phase is characterized by low EAB populations, small ash seedlings and saplings, and lingering ash populations that may exhibit various defense mechanisms and levels of resistance to EAB infestation. In an aftermath forest, a major selection event has occurred where susceptible trees have been killed by EAB, and the remaining trees are likely to possess genetic variations that may favor their survival of EAB. Research has shown that some lingering ash genotypes (~5% of the initial ones tested) had some type of measurable defense response including killing a high proportion of larvae and reduced feeding preference by adult EAB [
18]. At the time this study was initiated, the lingering ash trees had survived 3 years longer than when the Koch et al. studies were performed [
18]. During these additional years, some of the ash trees continued to decline and die, so additional selection for trees with defenses against EAB occurred, making it likely that a higher percentage of the surviving trees included in our study have some level of defense against EAB. Therefore, the surviving ash trees in our study may lack cues that attract females to them, thus the mechanism by which EAB females choose to feed and lay eggs may now be more dependent on proximity to ash neighbor trees that have such cues. This also appears to be playing a role in the extended survival reported in blue ash [
36]. Feeding bioassays have shown blue ash is less preferred by adult beetles than green and white ash [
37]. Recent egg bioassay experiments conducted on mature blue and green ash trees growing in natural forests found that when eggs were placed directly onto the trees, larvae developed equally well in both species, leading the authors to conclude that extended survival of blue ash was due to adult beetle preference (feeding, oviposition or both) [
38]. Taken together, these results provide support for the hypothesis that the discrepancy between the results in our current study (that support the resource concentration theory) and the results reported by Knight et al. [
4], which support the resource dilution theory, may be due to an EAB invasion phase dependent relationship between ash health and ash neighbors. Additional studies conducted during these different phases are necessary to further evaluate and confirm this relationship.


