Seasonal Changes in Photosynthetic Energy Utilization in a Desert Shrub (Artemisia ordosica Krasch.) during Its Different Phenophases

 ,
, 
Abstract
1. Introduction
2. Materials and Methods
2.1. Site Characteristics
2.2. Environmental Measurements
2.3. ChlF Measurements, Data Treatment, and Analysis
3. Results
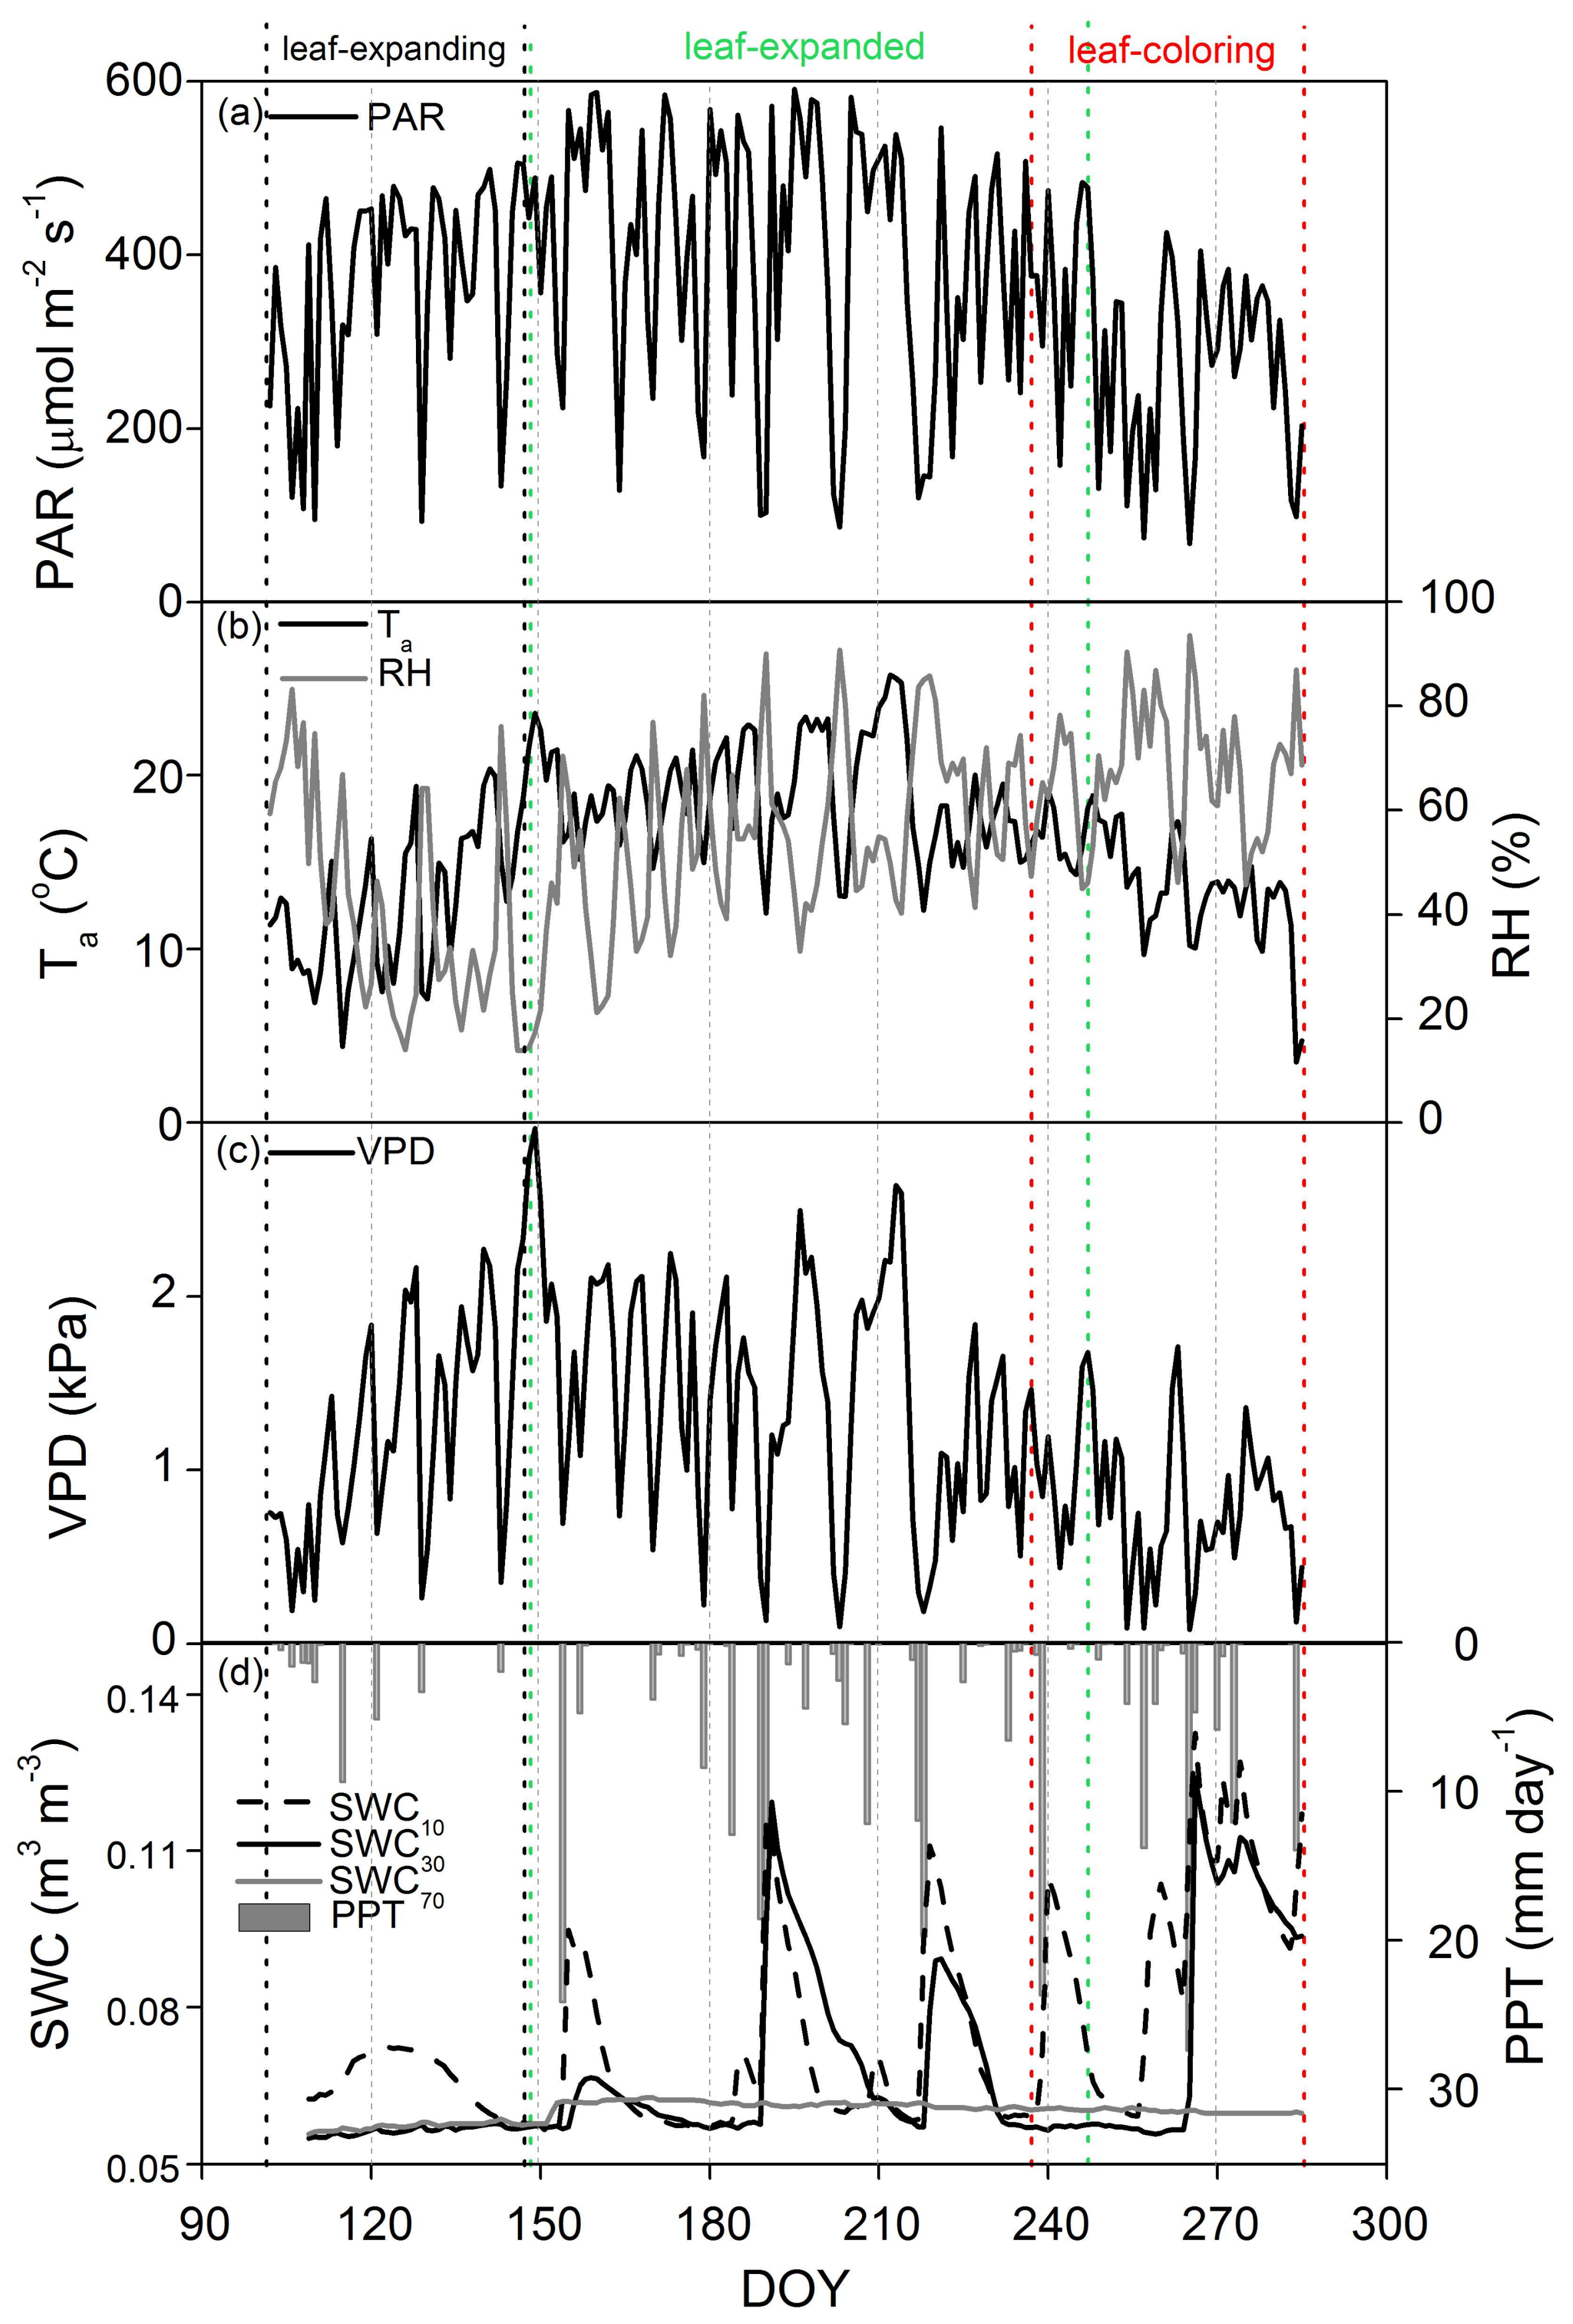
3.1. Phenological Dynamics in Biophysical Factors
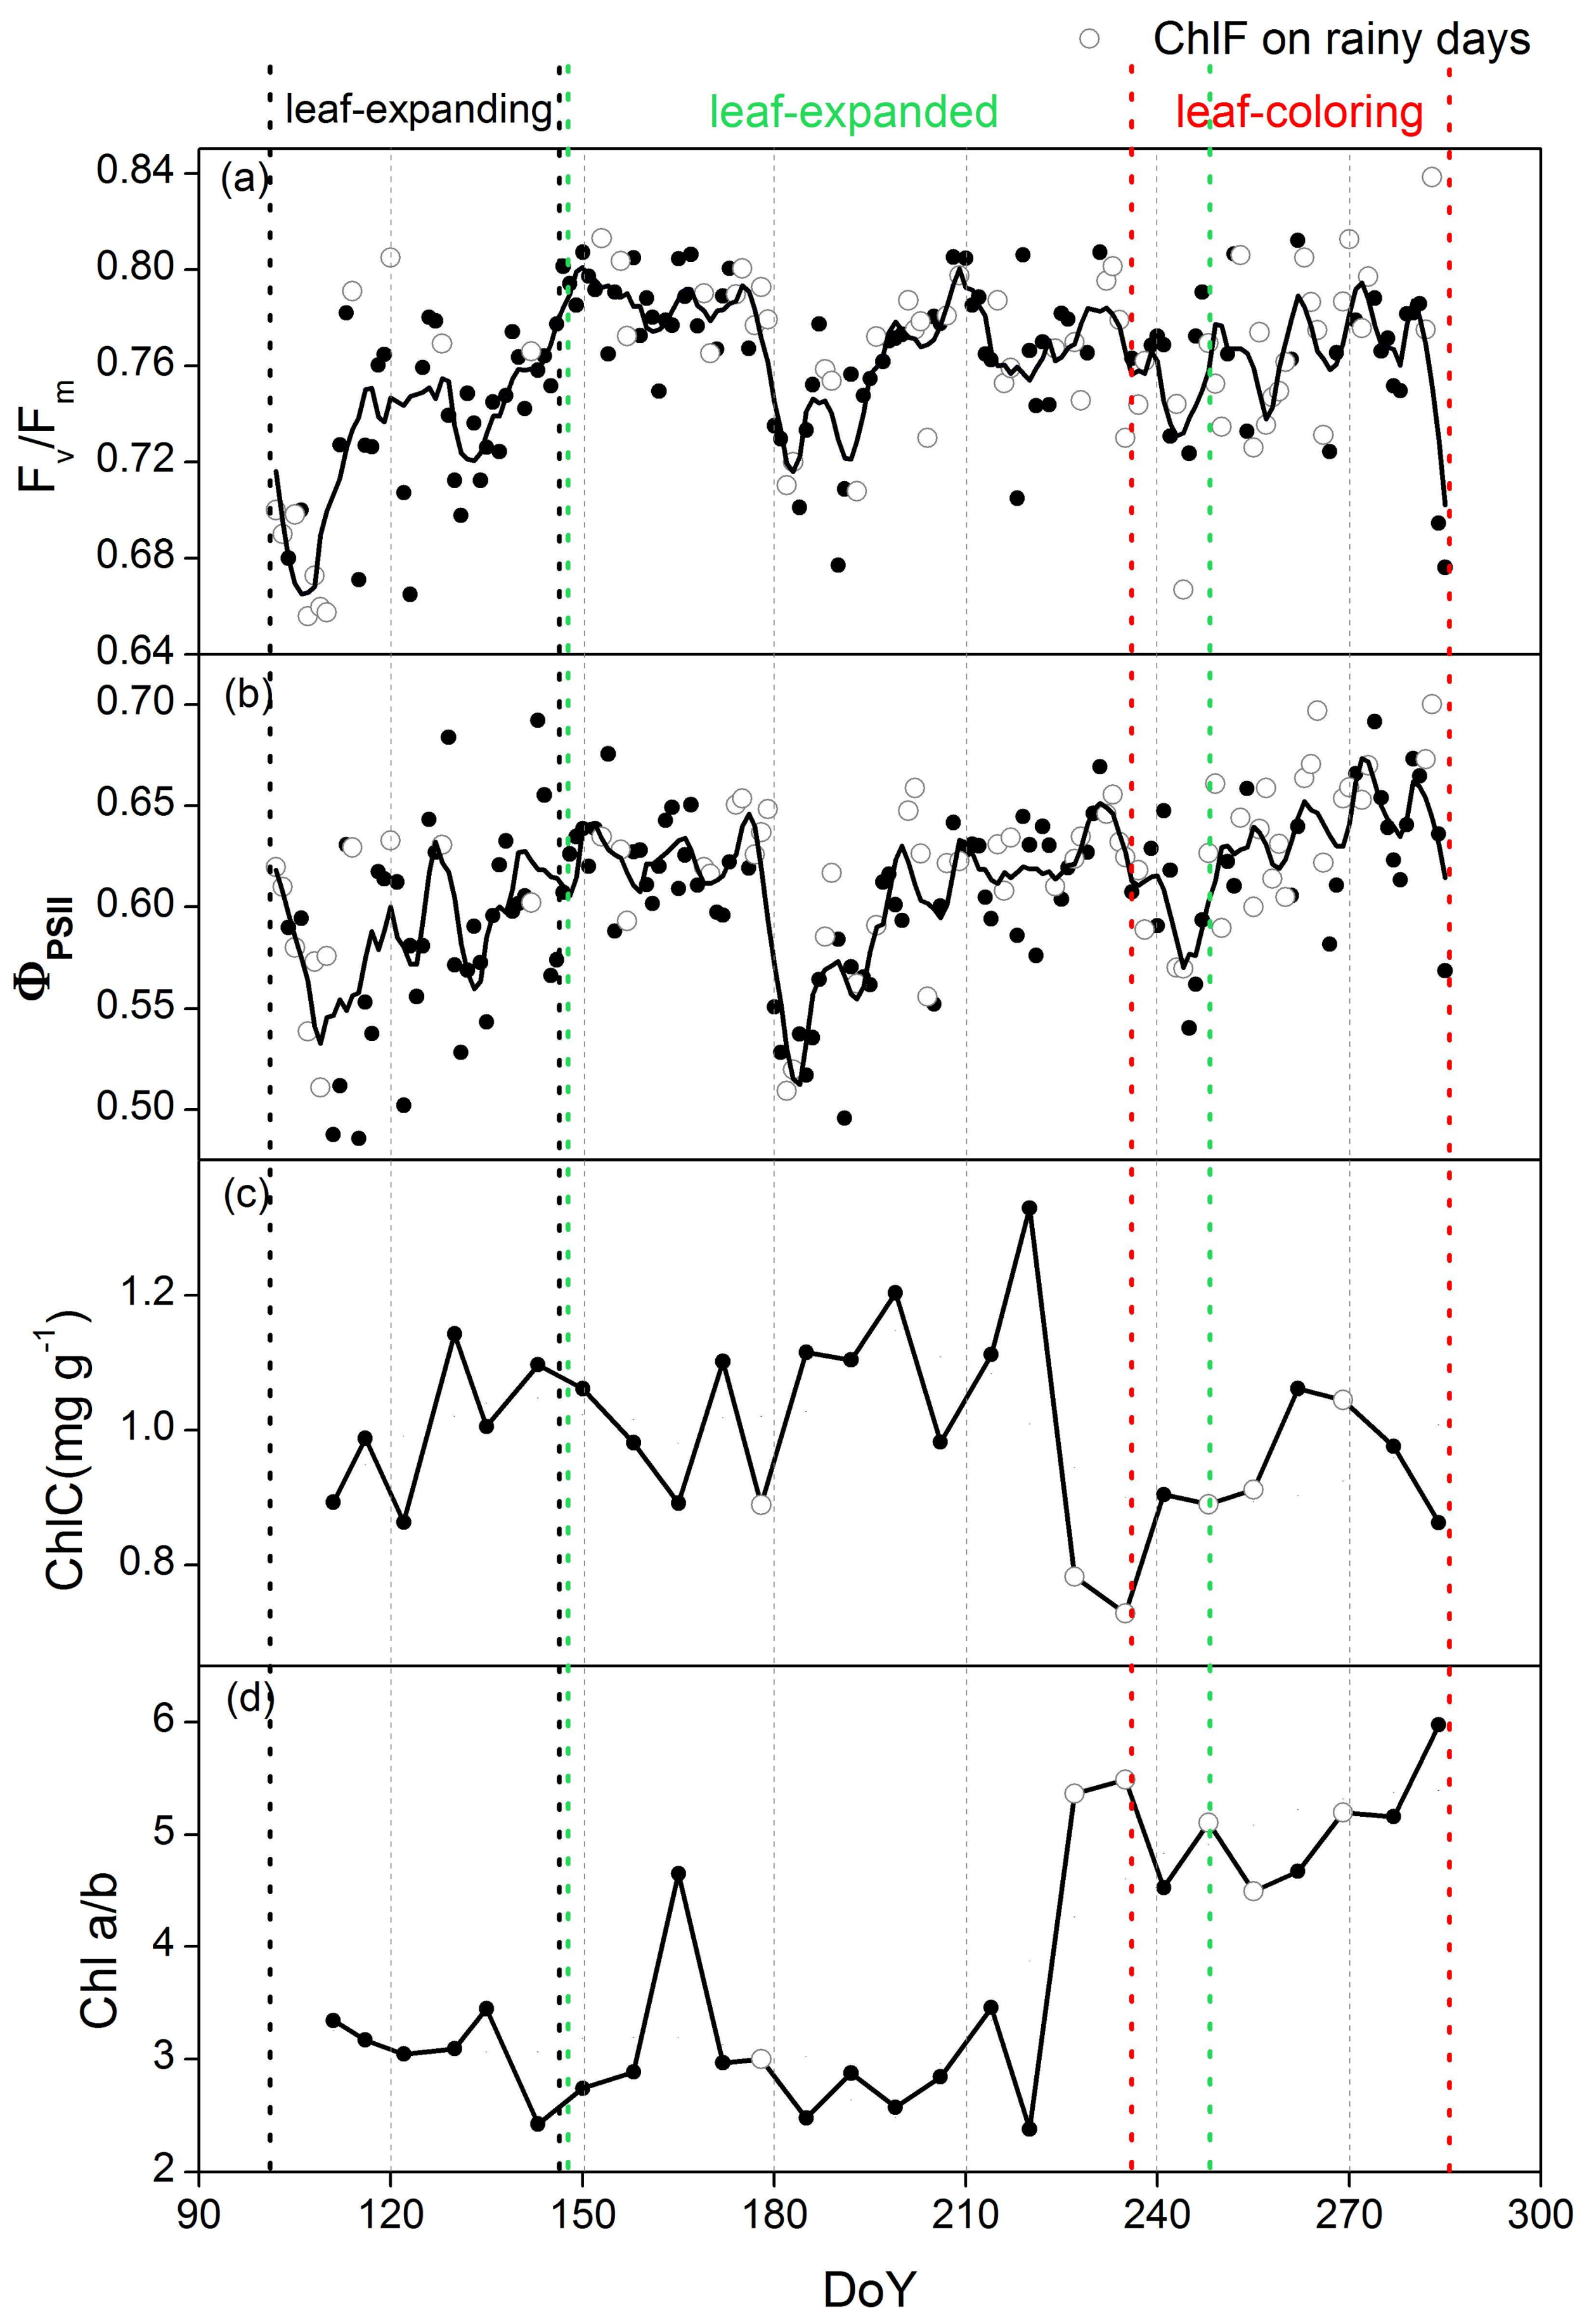
3.2. Phenological Variations in ChlF Parameters
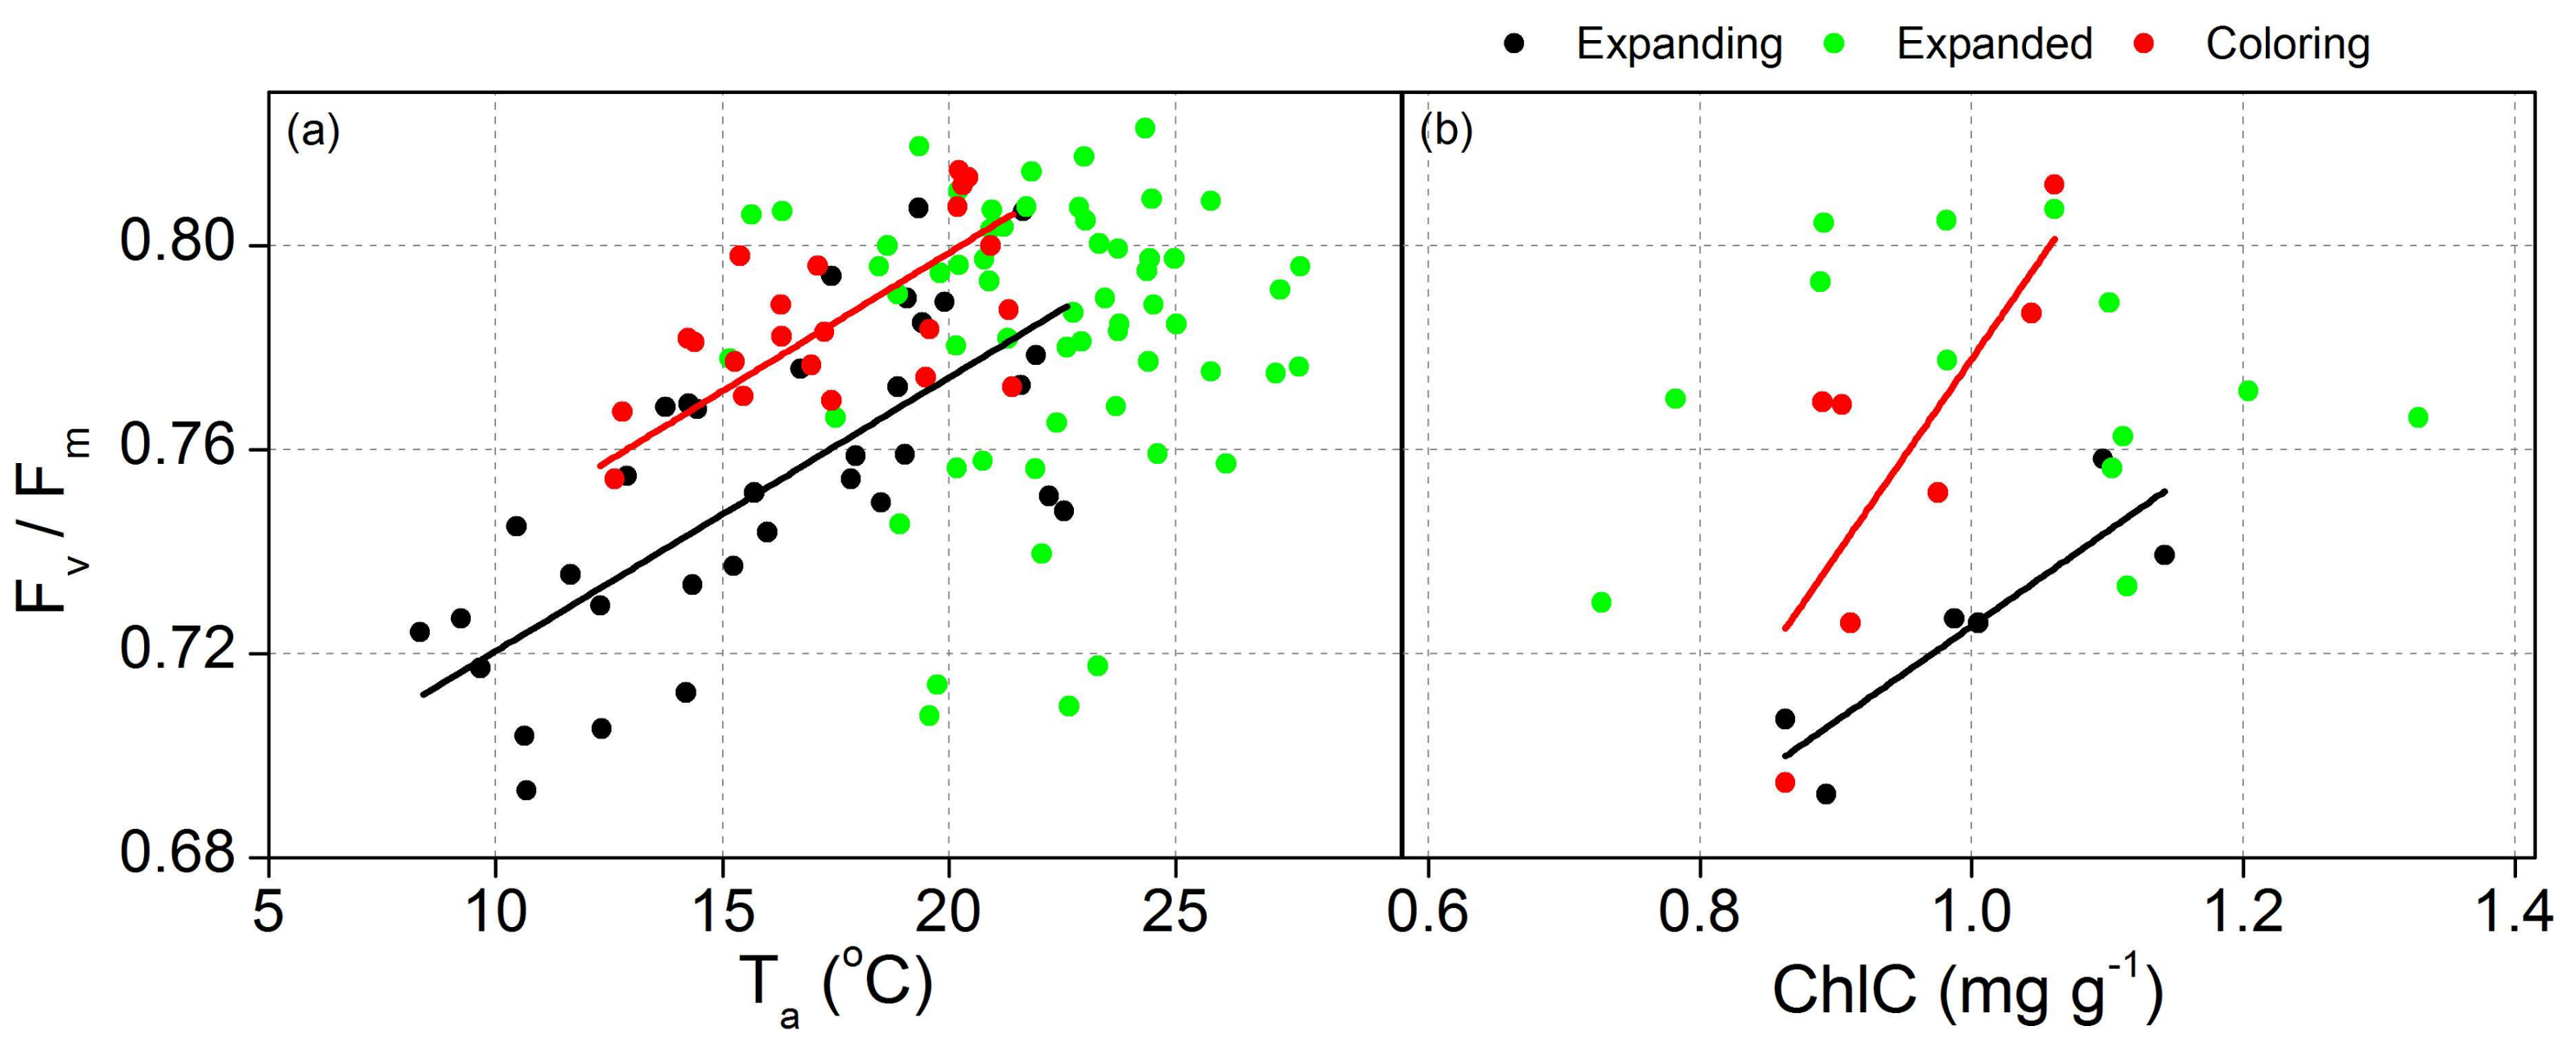
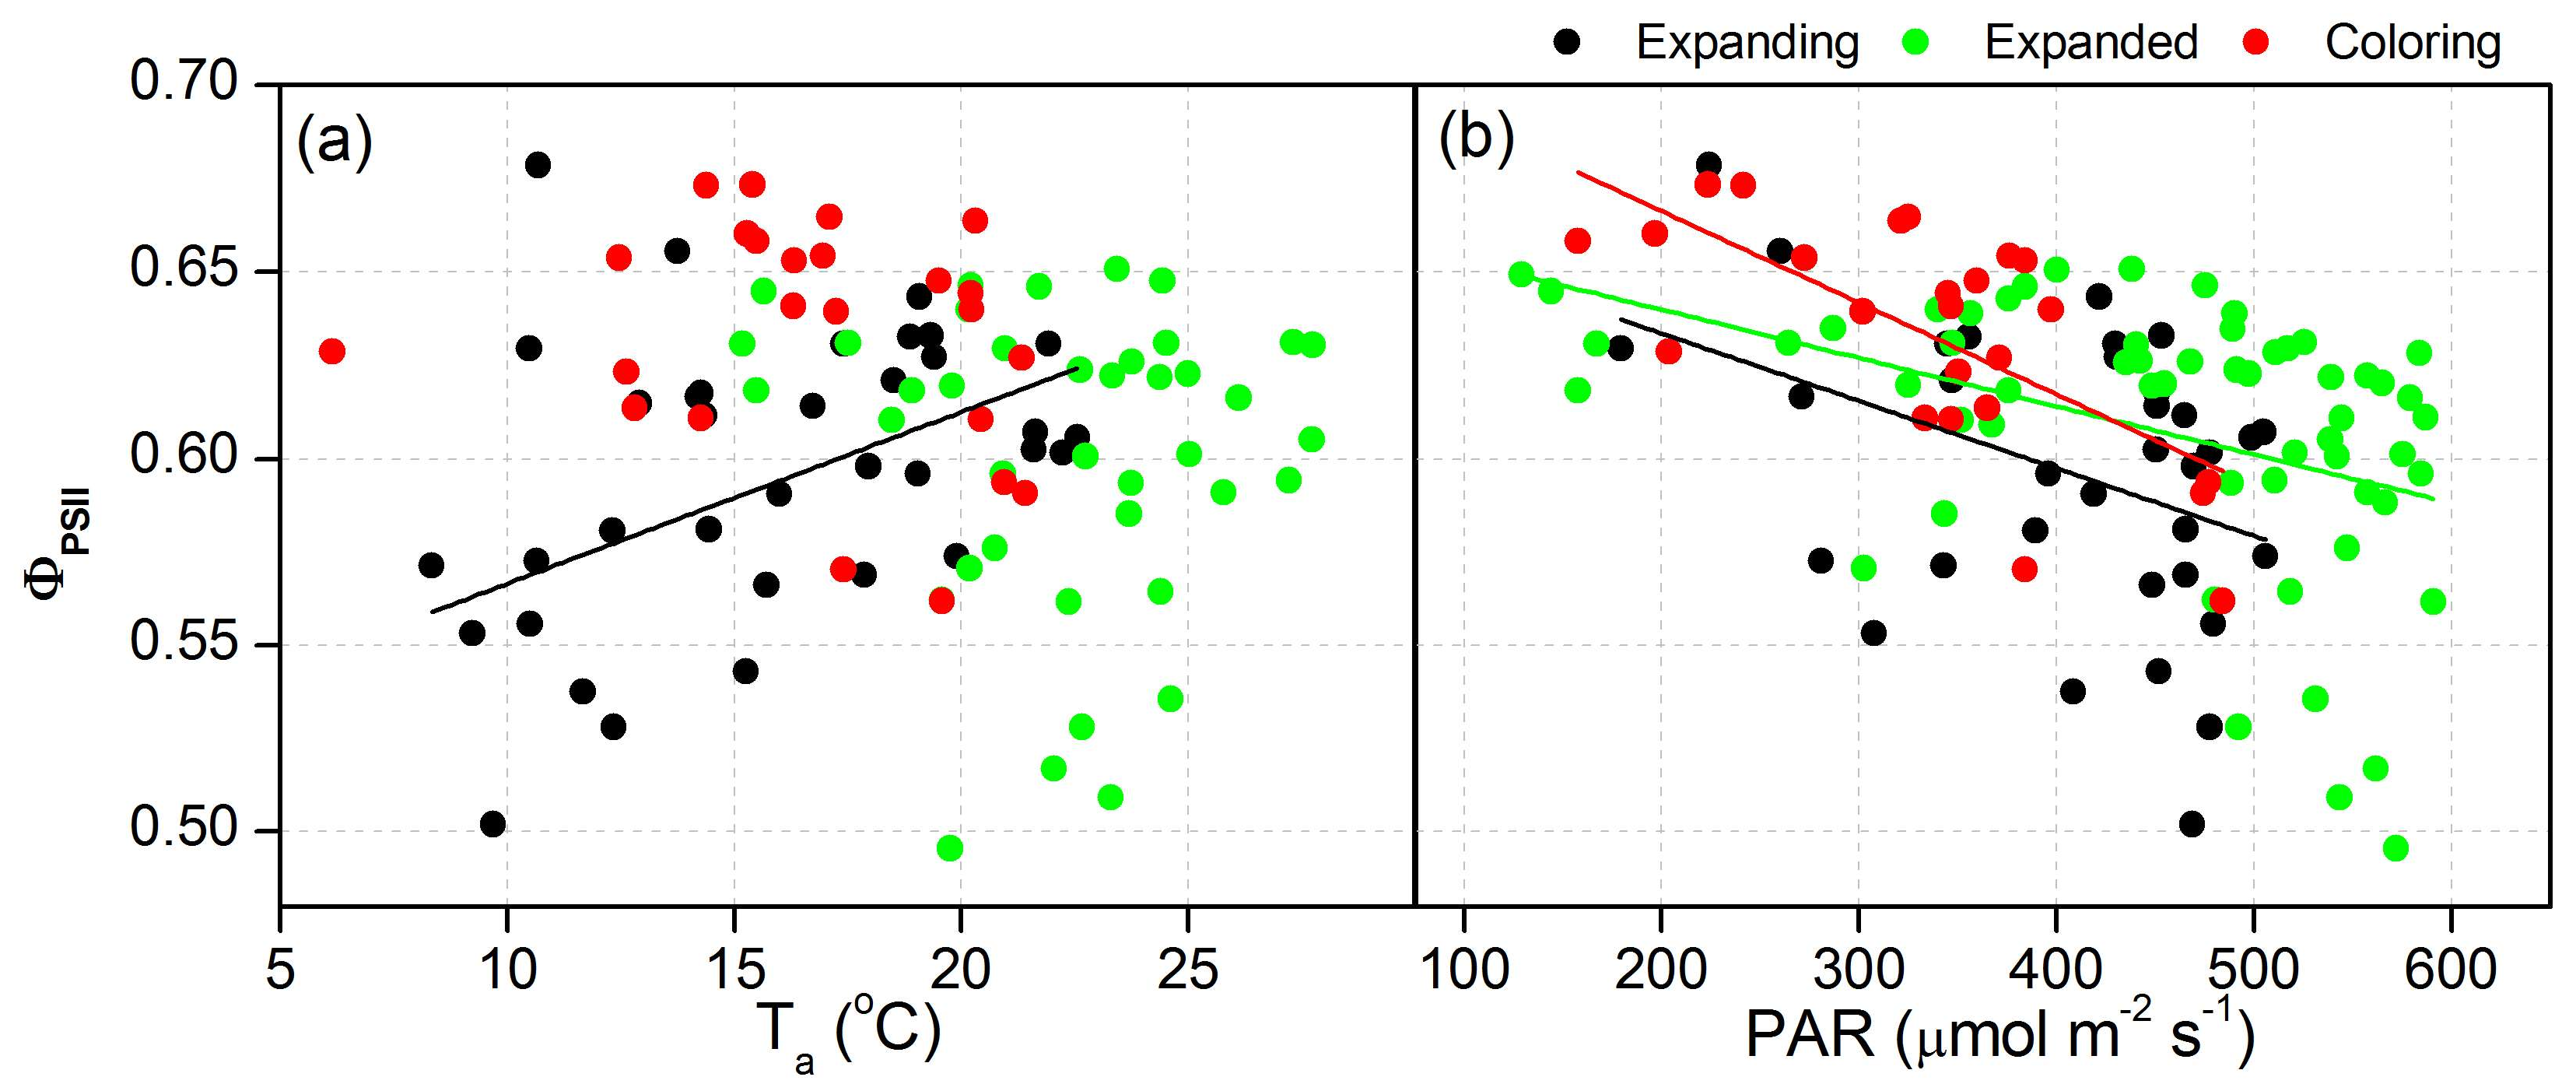
3.3. Proportion of Energy Partitioning and Response of ChlF to Abiotic Factors
4. Discussion
4.1. Effect of Environmental Stresses on Fv/Fm, ΦPSII, and NPQ
4.2. Acclimation of Energy Partitioning to Environmental Stresses
5. Conclusions
Acknowledgments
Author Contributions
Conflicts of Interest
References
- Ensminger, I.; Busch, F.; Huner, N. Photostasis and cold acclimation: Sensing low temperature through photosynthesis. Physiol. Plant. 2006, 126, 28–44. [Google Scholar] [CrossRef]
- Yakushevska, A.E.; Jensen, P.E.; Keegstra, W.; van Roon, H.; Scheller, H.V.; Boekema, E.J.; Dekker, J.P. Supermolecular organization of photosystem II and its associated light-harvesting antenna in Arabidopsis thaliana. FEBS. J. 2001, 268, 6020–6028. [Google Scholar] [CrossRef]
- Demmig-Adams, B.; Cohu, C.M.; Muller, O.; Adams, W.W. Modulation of photosynthetic energy conversion efficiency in nature: From seconds to seasons. Photosynth. Res. 2012, 1–14. [Google Scholar] [CrossRef] [PubMed]
- Ware, M.A.; Belgio, E.; Ruban, A.V. Photoprotective capacity of non-photochemical quenching in plants acclimated to different light intensities. Photosynth. Res. 2015, 126, 261–274. [Google Scholar] [CrossRef] [PubMed]
- Zhou, Y.; Lam, H.M.; Zhang, J. Inhibition of photosynthesis and energy dissipation induced by water and high light stresses in rice. J. Exp. Bot. 2007, 58, 1207–1217. [Google Scholar] [CrossRef] [PubMed]
- Müller, P.; Li, X.P.; Niyogi, K.K. Non-photochemical quenching. A response to excess light energy. Plant Physiol. 2001, 125, 1558–1566. [Google Scholar] [CrossRef] [PubMed]
- Savitch, L.V.; Ivanov, A.G.; Gudynaite-Savitch, L.; Huner, N.P.; Simmonds, J. Effects of low temperature stress on excitation energy partitioning and photoprotection in Zea mays. Funct. Plant Biol. 2009, 36, 37–49. [Google Scholar] [CrossRef]
- Porcar-castell, A.; Pfündel, E.; Korhonen, J.F.; Juurola, E. A new monitoring pam fluorometer (moni-pam) to study the short- and long-term acclimation of photosystem II in field conditions. Photosynth. Res. 2008, 96, 173–179. [Google Scholar] [CrossRef] [PubMed]
- Durako, M.J. Using PAM fluorometry for landscape-level assessment of Thalassia testudinum: Can diurnal variation in photochemical efficiency be used as an ecoindicator of seagrass health? Ecol. Indic. 2012, 18, 243–251. [Google Scholar] [CrossRef]
- Lazár, D. The polyphasic chlorophyll a fluorescence rise measured under high intensity of exciting light. Funct. Plant Biol. 2006, 33, 9–30. [Google Scholar] [CrossRef]
- Harel, Y.; Ohad, I.; Kaplan, A. Activation of photosynthesis and resistance to photoinhibition in cyanobacteria within biological desert crust. Plant Physiol. 2004, 136, 3070–3079. [Google Scholar] [CrossRef] [PubMed]
- Demmig-Adams, B.; Garab, G.; Adams, W., III; Govindjee. Non-Photochemical Quenching and Energy Dissipation in Plants, Algae and Cyanobacteria; Springer: Dordrecht, The Netherlands, 2014. [Google Scholar] [CrossRef]
- Ruban, A.V. Nonphotochemical chlorophyll fluorescence quenching: Mechanism and effectiveness in protecting plants from photodamage. Plant Physiol. 2016, 170, 1903–1916. [Google Scholar] [CrossRef] [PubMed]
- Adams, W.W., III; Muller, O.; Cohu, C.M.; Demmig-Adams, B. May photoinhibition be a consequence, rather than a cause, of limited plant productivity? Photosynth. Res. 2013, 117, 31–44. [Google Scholar] [CrossRef] [PubMed]
- Haque, M.S.; Kjaer, K.H.; Rosenqvist, E.; Sharma, D.K.; Ottosen, C.O. Heat stress and recovery of photosystem II efficiency in wheat (Triticum aestivum L.) cultivars acclimated to different growth temperatures. Environ. Exp. Bot. 2014, 99, 1–8. [Google Scholar] [CrossRef]
- Kalaji, H.M.; Jajoo, A.; Oukarroum, A.; Brestic, M.; Zivcak, M.; Samborska, I.A.; Cetner, M.D.; Łukasik, I.; Goltsev, V.; Ladle, R.J. Chlorophyll a fluorescence as a tool to monitor physiological status of plants under abiotic stress conditions. Acta Physiol. Plant 2016, 38, 102. [Google Scholar] [CrossRef]
- Marias, D.E.; Meinzer, F.C.; Woodruff, D.R.; McCulloh, K.A. Thermo tolerance and heat stress responses of Douglas-fir and ponderosa pine seedling populations from contrasting climates. Tree Physiol. 2016, 37, 301–315. [Google Scholar] [CrossRef]
- Öquist, G.; Huner, N.P. Photosynthesis of overwintering evergreen plants. Annu. Rev. Plant Biol. 2003, 54, 329–355. [Google Scholar] [CrossRef] [PubMed]
- Liang, Y.; Chen, H.; Tang, M.J.; Yang, P.F.; Shen, S.H. Responses of Jatropha curcas seedlings to cold stress: Photosynthesis-related proteins and chlorophyll fluorescence characteristics. Physiol. Plant. 2007, 131, 508–517. [Google Scholar] [CrossRef] [PubMed]
- Chaves, M.M.; Pereira, J.S.; Maroco, J.; Rodrigues, M.L.; Ricardo, C.P.P.; Osório, M.L.; Carvalho, I.; Faria, T.; Pinheiro, C. How plants cope with water stress in the field? Photosynthesis and growth. Ann. Bot. 2002, 89, 907–916. [Google Scholar] [CrossRef] [PubMed]
- Ditmarová, Ľ.; Kurjak, D.; Palmroth, S.; Kmeť, J.; Střelcová, K. Physiological responses of Norway spruce (Picea abies) seedlings to drought stress. Tree Physiol. 2009, 30, 205–213. [Google Scholar] [CrossRef] [PubMed]
- Suzuki, N.; Rivero, R.M.; Shulaev, V.; Blumwald, E.; Mittler, R. Abiotic and biotic stress combinations. New Phytol. 2014, 203, 32–43. [Google Scholar] [CrossRef] [PubMed]
- Lazár, D.; Ilík, P.; Nauš, J. An appearance of K-peak in fluorescence induction depends on the acclimation of barley leaves to higher temperatures. J. Lumin. 1997, 72, 595–596. [Google Scholar] [CrossRef]
- Niinemets, Ü. Responses of forest trees to single and multiple environmental stresses from seedlings to mature plants: Past stress history, stress interactions, tolerance and acclimation. For. Ecol. Manag. 2010, 260, 1623–1639. [Google Scholar] [CrossRef]
- Gerganova, M.; Popova, A.V.; Stanoeva, D.; Velitchkova, M. Tomato plants acclimate better to elevated temperature and high light than to treatment with each factor separately. Plant Physiol. Biochem. 2016, 104, 234–241. [Google Scholar] [CrossRef] [PubMed]
- Geist, H.J.; Lambin, E.F. Dynamic causal patterns of desertification. AIBS Bull. 2004, 54, 817–829. [Google Scholar] [CrossRef]
- Ezcurra, E. Global Deserts Outlook; Scanprint: Aarhus, Denmark, 2006; ISBN 92-807-2722-2. [Google Scholar]
- Lioubimtseva, E.; Henebry, G.M. Climate and environmental change in arid Central Asia: Impacts, vulnerability, and adaptations. J. Arid. Environ. 2009, 73, 963–977. [Google Scholar] [CrossRef]
- Reynolds, J.F.; Smith, D.M.S.; Lambin, E.F.; Turner, B.L.; Mortimore, M.; Batterbury, S.P.; Huber-Sannwald, E. Global desertification: Building a science for dryland development. Science 2007, 316, 847–851. [Google Scholar] [CrossRef] [PubMed]
- Chambers, J.C.; Bradley, B.A.; Brown, C.S.; D’Antonio, C.; Germino, M.J.; Grace, J.B.; Hardegree, S.P.; Miller, R.F.; Pyke, D.A. Resilience to stress and disturbance, and resistance to Bromus tectorum L. invasion in cold desert shrublands of western North America. Ecosystems 2014, 17, 360–375. [Google Scholar] [CrossRef]
- Barker, D.H.; Adams, W.W.; Demmig-Adams, B.; Logan, B.A.; Verhoeven, A.S.; Smith, S.D. Nocturnally retained zeaxanthin does not remain engaged in a state primed for energy dissipation during the summer in two Yucca species growing in the Mojave Desert. Plant Cell Environ. 2002, 25, 95–103. [Google Scholar] [CrossRef]
- Ogaya, R.; Penuelas, J.; Asensio, D.; Llusià, J. Chlorophyll fluorescence responses to temperature and water availability in two co-dominant Mediterranean shrub and tree species in a long-term field experiment simulating climate change. Environ. Exp. Bot. 2011, 73, 89–93. [Google Scholar] [CrossRef]
- Xie, J.; Zha, T.; Jia, X.; Qian, D.; Wu, B.; Zhang, Y.; Bourque, C.P.-A.; Chen, J.; Sun, G.; Peltola, H. Irregular precipitation events in control of seasonal variations in CO2 exchange in a cold desert-shrub ecosystem in northwest China. J. Arid Environ. 2015, 120, 33–41. [Google Scholar] [CrossRef]
- Jia, X.; Zha, T.S.; Gong, J.N.; Wu, B.; Zhang, Y.Q.; Qin, S.G.; Chen, G.P.; Feng, W.; Kellomäki, S.; Peltola, H. Energy partitioning over a semi-arid shrubland in northern China. Hydrol. Processes 2016, 30, 972–985. [Google Scholar] [CrossRef]
- Jiang, G.M.; Zhu, G.J. Different patterns of gas exchange and photochemical efficiency in three desert shrub species under two natural temperatures and irradiances in Mu Us Sandy Area of China. Photosynthetica 2001, 39, 257–262. [Google Scholar] [CrossRef]
- Deng, W.H. Allelopathy of Artemisia ordosica Community in the Process of Plant Succession. Ph.D. Thesis. Beijing Forestry University, Beijing, China, 2016. [Google Scholar]
- Porcar-Castell, A.; Juurola, E.; Ensminger, I.; Berninger, F.; Hari, P.; Nikinmaa, E. Seasonal acclimation of photosystem II in Pinus sylvestris. II. Using the rate constants of sustained thermal energy dissipation and photochemistry to study the effect of the light environment. Tree. Physiol. 2008, 28, 1483–1491. [Google Scholar] [CrossRef] [PubMed]
- Repo, T.; Leinonen, I.; Ryyppö, A.; Finér, L. The effect of soil temperature on the bud phenology, chlorophyll fluorescence, carbohydrate content and cold hardiness of Norway spruce seedlings. Physiol. Plant. 2004, 121, 93–100. [Google Scholar] [CrossRef] [PubMed]
- Qian, D.; Zha, T.S.; Wu, B.; Jia, X.; Qin, S.G. Spatio-temporal distribution characteristics of reference crop evapotranspiration in the Mu Us desert. Acta Ecol. Sin. 2017, 37, 1966–1974. [Google Scholar] [CrossRef][Green Version]
- Wilhelm, E.; Battino, R.; Wilcock, R.J. Low-pressure solubility of gases in liquid water. Chem. Rev. 1977, 77, 219–262. [Google Scholar] [CrossRef]
- Chen, Z.H.; Zha, T.; Jia, X.; Wu, Y.; Wu, B.; Zhang, Y.; Guo, J.B.; Qin, S.G.; Chen, G.P.; Peltola, H. Leaf nitrogen is closely coupled to phenophases in a desert shrub ecosystem in China. J. Arid. Environ. 2015, 122, 124–131. [Google Scholar] [CrossRef]
- Arnon, D.I. Copper enzymes in isolated chloroplasts. Polyphenoloxidase in Beta vulgaris. Plant Physiol. 1949, 24, 1. [Google Scholar] [PubMed]
- Su, Z.S.; Zhang, X.Z. Comparision of determined methods of chlorophyll content. Plant Physiol. J. 1989, 77–78. [Google Scholar] [CrossRef]
- Schreiber, U.; Schliwa, U.; Bilger, W. Continuous recording of photochemical and non-photochemical chlorophyll fluorescence quenching with a new type of modulation fluorometer. Photosynth. Res. 1986, 10, 51–62. [Google Scholar] [CrossRef] [PubMed]
- Roháček, K. Chlorophyll fluorescence parameters: The definitions, photosynthetic meaning, and mutual relationships. Photosynthetica 2002, 40, 13–29. [Google Scholar] [CrossRef]
- Zha, T.S.; Wu, Y.J.; Jia, X.; Zhang, M.Y.; Bai, Y.J.; Liu, P.; Ma, J.Y.; Bourque, C.-P. A.; Peltola, H. Diurnal response of effective quantum yield of PSII photochemistry to irradiance as an indicator of photosynthetic acclimation to stressed environments revealed in a xerophytic species. Ecol. Indic. 2017, 74, 191–197. [Google Scholar] [CrossRef]
- Porcar-Castell, A. A high-resolution portrait of the annual dynamics of photochemical and non-photochemical quenching in needles of Pinus sylvestris. Physiol. Plant. 2011, 143, 139–153. [Google Scholar] [CrossRef] [PubMed]
- Genty, B.; Harbinson, J. Regulation of light utilization for photosynthetic electron transport. In Photosynthesis and the Environment; Springer: Dordrecht, The Netherlands, 1996; Volume 5, pp. 67–99. [Google Scholar]
- Cailly, A.L.; Rizzal, F.; Genty, B.; Harbinson, J. Fate of excitation at PSII in leaves, the nonphotochemical side. Plant Physiol. Biochem. 1996, 86, 28. [Google Scholar]
- Kramer, D.M.; Johnson, G.; Kiirats, O.; Edwards, G.E. New fluorescence parameters for the determination of QA redox state and excitation energy fluxes. Photosynth. Res. 2004, 79, 209–218. [Google Scholar] [CrossRef] [PubMed]
- Hendrickson, L.; Furbank, R.T.; Chow, W.S. A simple alternative approach to assessing the fate of absorbed light energy using chlorophyll fluorescence. Photosynth. Res. 2004, 82, 73. [Google Scholar] [CrossRef] [PubMed]
- Lazár, D. Parameters of photosynthetic energy partitioning. J. Plant Physiol. 2015, 175, 131–147. [Google Scholar] [CrossRef] [PubMed]
- Lazár, D. Chlorophyll a fluorescence induction. BBA-Bioenerg. 1999, 1412, 1–28. [Google Scholar] [CrossRef]
- Oxborough, K.; Baker, N.R. Resolving chlorophyll a fluorescence images of photosynthetic efficiency into photochemical and non-photochemical components–calculation of qP and Fv-/Fm without measuring Fo. Photosynth. Res. 1997, 54, 135–142. [Google Scholar] [CrossRef]
- Maxwell, K.; Johnson, G.N. Chlorophyll fluorescence—A practical guide. J. Exp. Bot. 2000, 51, 659–668. [Google Scholar] [CrossRef] [PubMed]
- Björkman, O.; Demmig, B. Photon yield of O2 evolution and chlorophyll fluorescence characteristics at 77 K among vascular plants of diverse origins. Planta 1987, 170, 489–504. [Google Scholar] [CrossRef] [PubMed]
- Lambers, H.; Chapin, F.S., III; Pons, T.L. Plant Physiological Ecology, 2nd ed.; Springer: Dordrecht, The Netherlands, 2008; pp. 39–40. [Google Scholar] [CrossRef]
- Murchie, E.H.; Lawson, T. Chlorophyll fluorescence analysis: A guide to good practice and understanding some new applications. J. Exp. Bot. 2013, 64, 3983–3998. [Google Scholar] [CrossRef] [PubMed]
- Kuk, Y.I.; Shin, J.S.; Burgos, N.R.; Hwang, T.E.; Han, O.; Cho, B.H.; Jung, S.; Guh, J.O. Antioxidative enzymes offer protection from chilling damage in rice plants. Crop. Sci. 2003, 43, 2109–2117. [Google Scholar] [CrossRef]
- Pietrini, F.; Chaudhuri, D.; Thapliyal, A.P.; Massacci, A. Analysis of chlorophyll fluorescence transients in mandarin leaves during a photo-oxidative cold shock and recovery. Agric. Ecosyst. Environ. 2005, 106, 189–198. [Google Scholar] [CrossRef]
- Baron, K.N.; Schroeder, D.F.; Stasolla, C. Transcriptional response of abscisic acid (ABA) metabolism and transport to cold and heat stress applied at the reproductive stage of development in Arabidopsis thaliana. Plant Sci. 2012, 188–189, 48–59. [Google Scholar] [CrossRef] [PubMed]
- Ač, A.; Malenovský, Z.; Olejníčková, J.; Gallé, A.; Rascher, U.; Mohammed, G. Meta-analysis assessing potential of steady-state chlorophyll fluorescence for remote sensing detection of plant water, temperature and nitrogen stress. Remote Sens. Environ. 2015, 168, 420–436. [Google Scholar] [CrossRef]
- Faik, A.; Popova, A.V.; Velitchkova, M. Effects of long-term action of high temperature and high light on the activity and energy interaction of both photosystems in tomato plants. Photosynthetica 2016, 54, 611–619. [Google Scholar] [CrossRef]
- Wilhelm, C.; Selmar, D. Energy dissipation is an essential mechanism to sustain the viability of plants: The physiological limits of improved photosynthesis. J. Plant Physiol. 2011, 168, 79–87. [Google Scholar] [CrossRef] [PubMed]
- Niyogi, K.K.; Truong, T.B. Evolution of flexible non-photochemical quenching mechanisms that regulate light harvesting in oxygenic photosynthesis. Curr. Opin. Plant Biol. 2013, 16, 307–314. [Google Scholar] [CrossRef] [PubMed]
- Campos, H.; Trejo, C.; Peña-Valdivia, C.B.; García-Nava, R.; Conde-Martínez, F.V.; Cruz-Ortega, M.R. Photosynthetic acclimation to drought stress in Agave salmiana Otto ex Salm-Dyck seedlings is largely dependent on thermal dissipation and enhanced electron flux to photosystem I. Photosynth. Res. 2014, 122, 23–39. [Google Scholar] [CrossRef] [PubMed]
- Bajkán, S.; Várkonyi, Z.; Lehoczki, E. Comparative study on energy partitioning in photosystem II of two Arabidopsis thaliana mutants with reduced non-photochemical quenching capacity. Acta Physiol. Plant 2012, 34, 1027–1034. [Google Scholar] [CrossRef]
- Sperdouli, I.; Moustakas, M. Spatio-temporal heterogeneity in Arabidopsis thaliana, leaves under drought stress. Plant Biol. 2012, 14, 118–128. [Google Scholar] [CrossRef] [PubMed]
- Osório, M.L.; Osório, J.; Romano, A. Photosynthesis, energy partitioning, and metabolic adjustments of the endangered Cistaceae species Tuberaria major under high temperature and drought. Photosynthetica 2013, 51, 75–84. [Google Scholar] [CrossRef]
- Song, L.; Chow, W.S.; Sun, L.; Li, C.; Peng, C. Acclimation of photosystem II to high temperature in two Wedelia species from different geographical origins: Implications for biological invasions upon global warming. J. Exp. Bot. 2010, 61, 4087. [Google Scholar] [CrossRef] [PubMed]
- Klughammer, C.; Schreiber, U. Complementary PSII quantum yields calculated from simple fluorescence parameters measured by PAM fluorometry and the saturation pulse method. PAM Appl. Notes 2008, 1, 27–35. [Google Scholar]
- Flexas, J.; Bota, J.; Escalona, J.M.; Sampol, B.; Medrano, H. Effects of drought on photosynthesis in grapevines under field conditions: An evaluation of stomatal and mesophyll limitations. Funct. Plant Biol. 2002, 29, 461–471. [Google Scholar] [CrossRef]
- Horton, P.; Johnson, M.P.; Perez-Bueno, M.L.; Kiss, A.Z.; Ruban, A.V. Photosynthetic acclimation: Does the dynamic structure and macro-organisation of photosystem II in higher plant grana membranes regulate light harvesting states? FEBS. J. 2008, 275, 1069–1079. [Google Scholar] [CrossRef] [PubMed]
- Sacharz, J.; Giovagnetti, V.; Ungerer, P.; Mastroianni, G.; Ruban, A.V. The xanthophyll cycle affects reversible interactions between PsbS and light-harvesting complex II to control non-photochemical quenching. Nat. Plants 2017, 3, 16225. [Google Scholar] [CrossRef] [PubMed]
- Terashima, I.; Hanba, Y.T.; Tazoe, Y.; Vyas, P.; Yano, S. Irradiance and phenotype: Comparative eco-development of sun and shade leaves in relation to photosynthetic CO2 diffusion. J. Exp. Bot. 2005, 57, 343–354. [Google Scholar] [CrossRef] [PubMed]
- Oguchi, R.; Hikosaka, K.; Hiura, T.; Hirose, T. Costs and benefits of photosynthetic light acclimation by tree seedlings in response to gap formation. Oecologia 2008, 155, 665. [Google Scholar] [CrossRef] [PubMed]
- Donat, M.G.; Lowry, A.L.; Alexander, L.V.; O’Gorman, P.A.; Maher, N. More extreme precipitation in the world’s dry and wet regions. Nat. Clim. Chang. 2016, 6, 508–513. [Google Scholar] [CrossRef]


| Factors | Phase | Equation | r2 | p | |
|---|---|---|---|---|---|
| Fv/Fm | Ta | Expanding | y = 0.67 + 53.7 × 10⁻⁴x | 0.51 | <0.05 |
| Coloring | y = 0.69 + 54.3 × 10⁻⁴x | 0.50 | 0.01 | ||
| ChlC | Expanding | y = 0.54 + 0.19x | 0.71 | 0.02 | |
| Coloring | y = 0.39 + 0.38x | 0.52 | 0.04 | ||
| ΦPSII | Ta | Expanding | y = 0.52 + 45.9 × 10⁻⁴x | 0.25 | 0.02 |
| PAR | Expanding | y = 0.67 − 1.81 × 10⁻⁴x | 0.14 | 0.02 | |
| Expanded | y = 0.67 − 1.29 × 10⁻⁴x | 0.17 | <0.05 | ||
| Coloring | y = 0.72 − 2.45 × 10⁻⁴x | 0.44 | <0.05 | ||
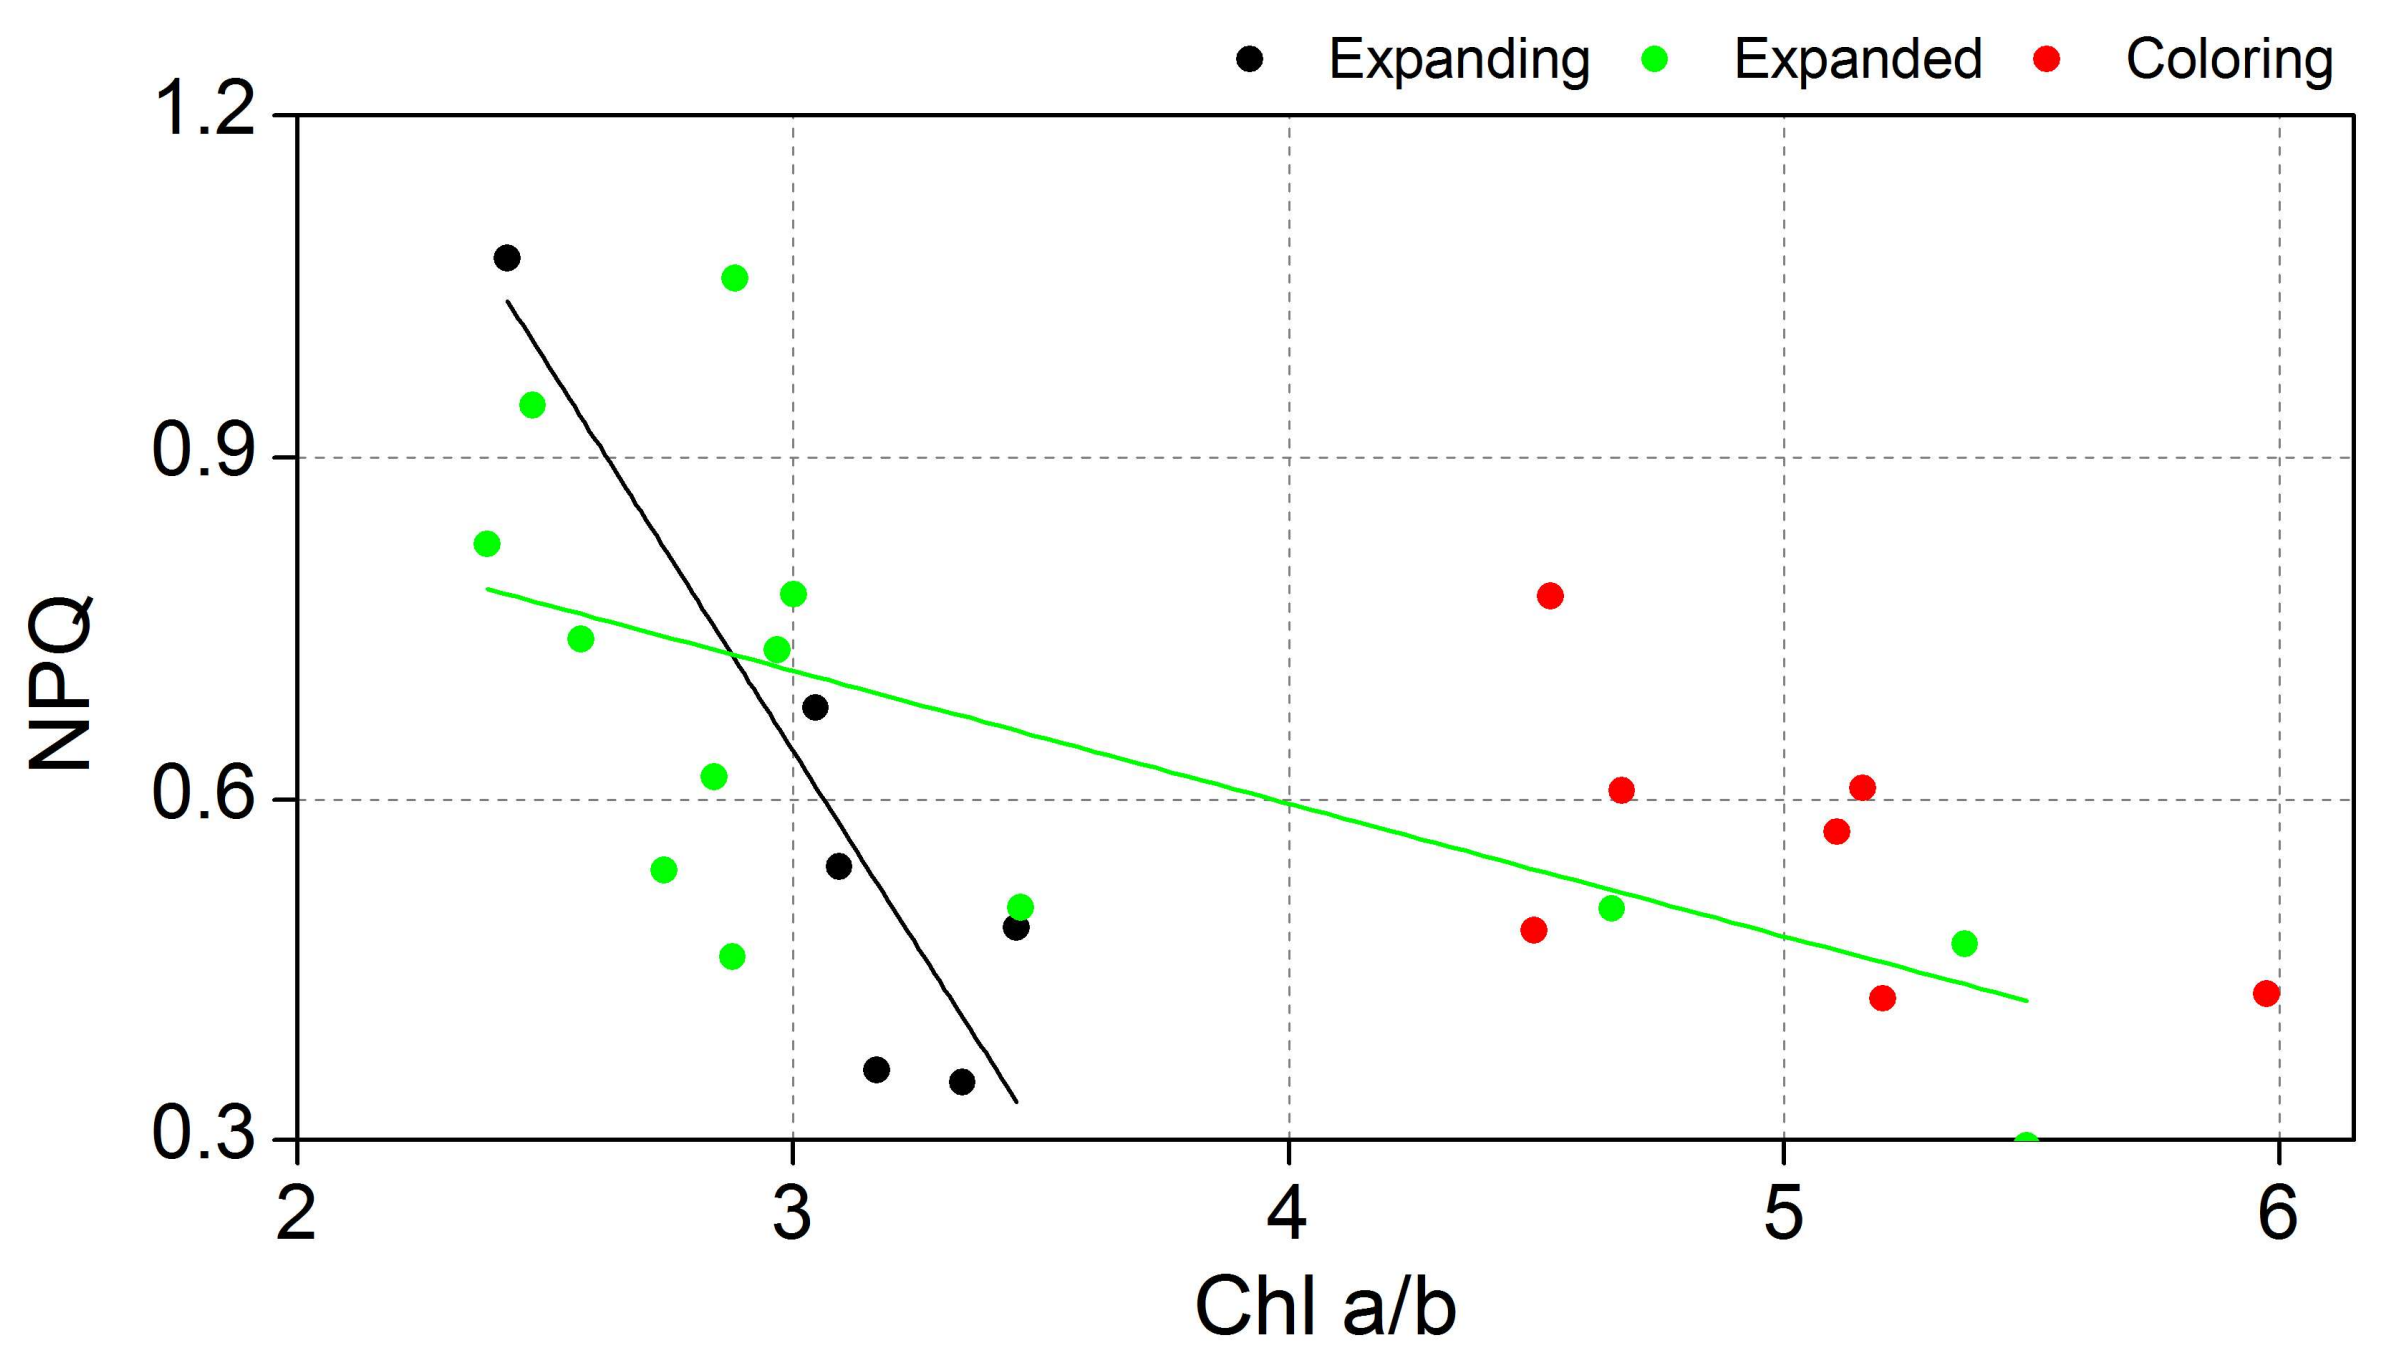
| NPQ | Chl a/b | Expanding | y = 2.70 − 0.68x | 0.78 | 0.01 |
| Expanded | y = 1.06 − 0.12x | 0.30 | 0.02 | ||
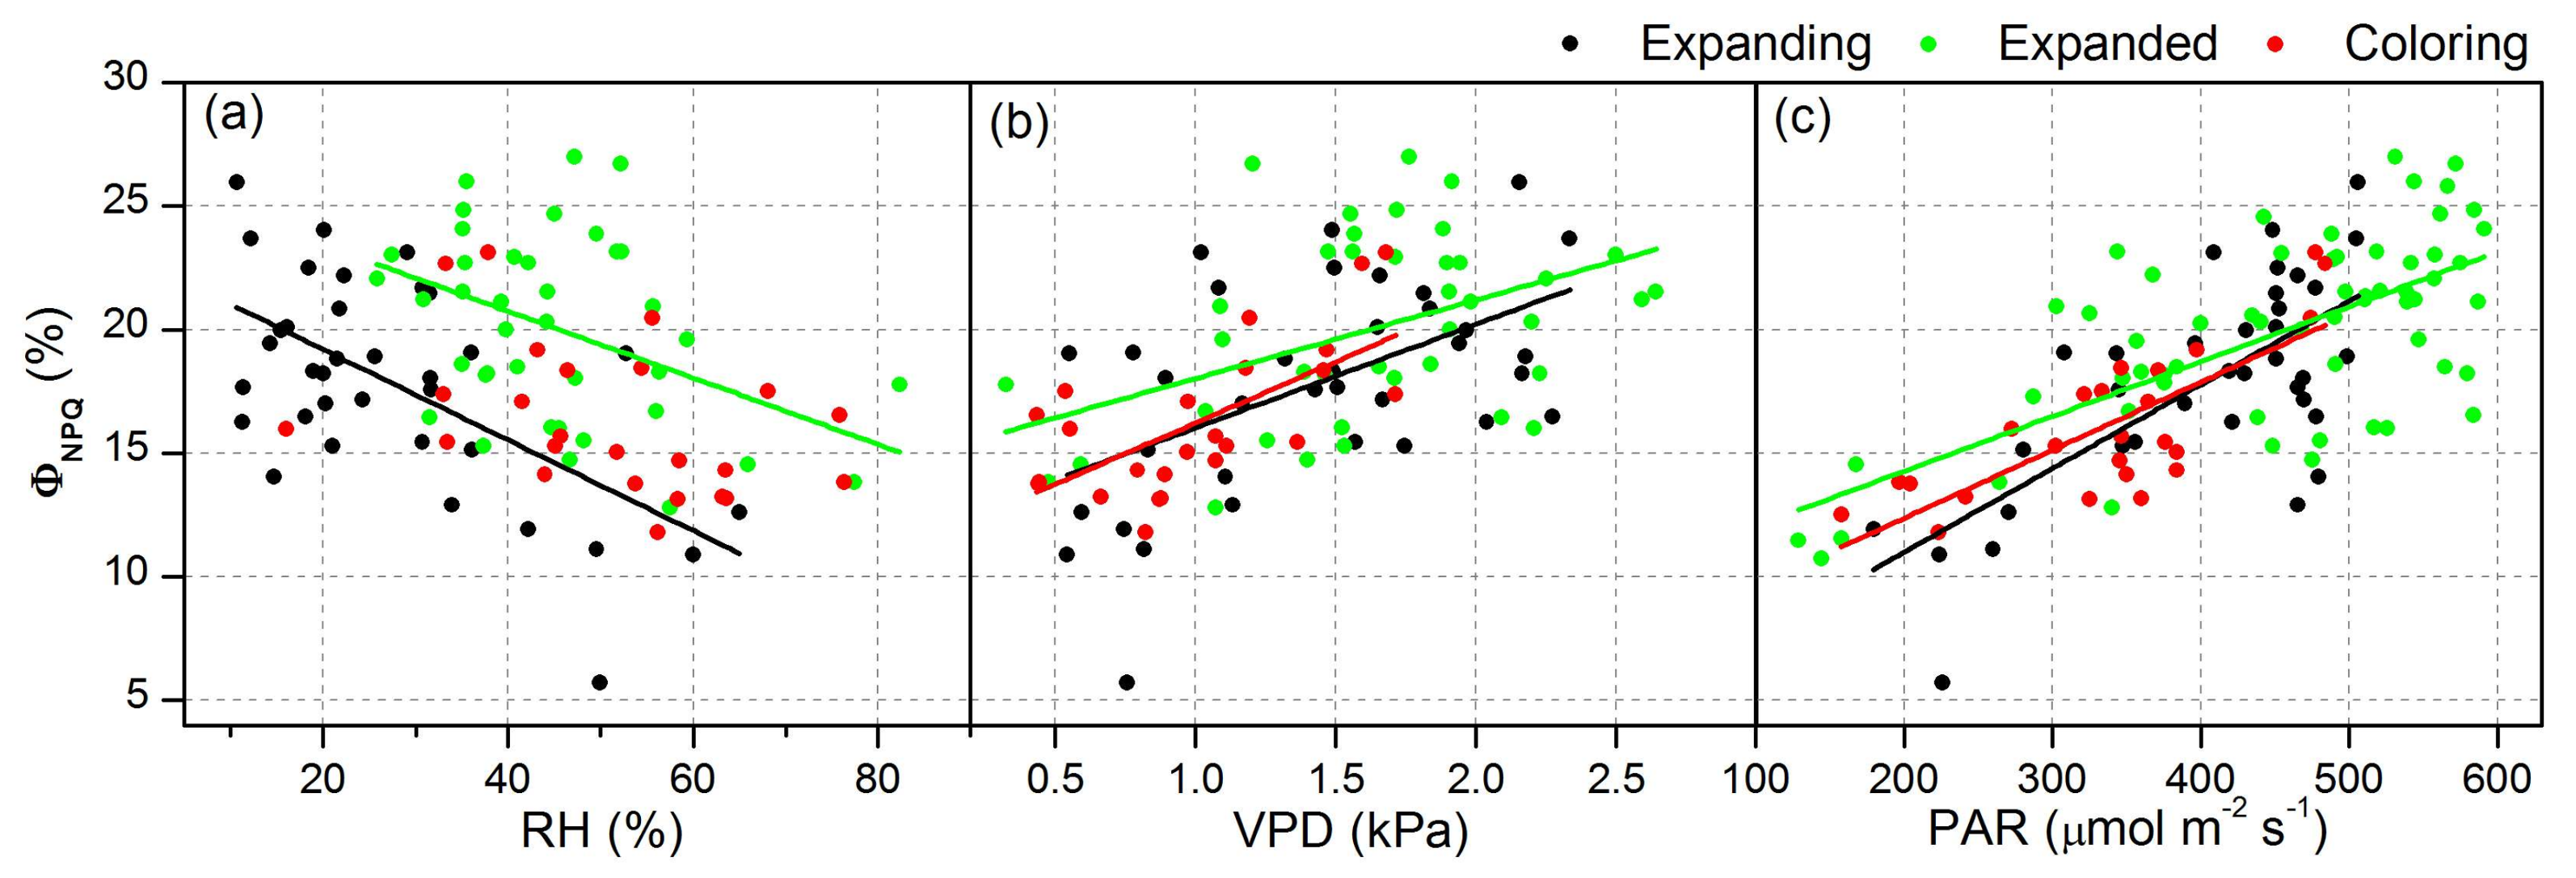
| ΦNPQ | RH | Expanding | y = 22.85 − 0.18x | 0.34 | <0.05 |
| Expanded | y = 23.73 − 0.09x | 0.14 | <0.05 | ||
| VPD | Expanding | y = 11.82 + 4.20x | 0.25 | <0.05 | |
| Expanded | y = 15.99 + 2.44x | 0.15 | <0.05 | ||
| Coloring | y = 11.26 + 4.96x | 0.41 | <0.05 | ||
| PAR | Expanding | y = 4.23 + 0.03x | 0.48 | <0.05 | |
| Expanded | y = 9.84 + 0.02x | 0.42 | <0.05 | ||
| Coloring | y = 6.87 + 0.03x | 0.58 | <0.05 |
| Factors | Phase | Equation | r2 | p | |
|---|---|---|---|---|---|
| Fv/Fm | Ta | Expanding | y = 56.77 × 10⁻⁴x + 0.66 | 0.45 | <0.01 |
| Expanded | - | - | |||
| Coloring | y = 30.14 × 10⁻⁴x + 0.73 | 0.26 | 0.01 | ||
| ΦPSII | PAR (x1), Ta (x2) | Expanding | y = −3.54 × 10−4x1 + 78.34 × 10−4x2 + 0.61 | 0.67 | <0.01 |
| VPD(x3) | (−0.70x1 + 0.85x2 in standardized form) | ||||
| Expanded | y = −2.22 × 10−4x1 + 314.6 × 10−4x3 + 0.66 | 0.31 | <0.01 | ||
| (−0.70x1 + 0.49x3 in standardized form) | |||||
| Coloring | - | - | |||
| ΦNPQ | PAR | Expanding | y = 0.026x + 7.73 | 0.32 | <0.01 |
| Expanded | y = 0.016x + 13.02 | 0.28 | <0.01 | ||
| Coloring | y = 0.023x + 8.44 | 0.46 | <0.01 |
© 2018 by the authors. Licensee MDPI, Basel, Switzerland. This article is an open access article distributed under the terms and conditions of the Creative Commons Attribution (CC BY) license (http://creativecommons.org/licenses/by/4.0/).
Share and Cite
Ren, C.; Wu, Y.; Zha, T.; Jia, X.; Tian, Y.; Bai, Y.; Bourque, C.P.-A.; Ma, J.; Feng, W. Seasonal Changes in Photosynthetic Energy Utilization in a Desert Shrub (Artemisia ordosica Krasch.) during Its Different Phenophases. Forests 2018, 9, 176. https://doi.org/10.3390/f9040176
Ren C, Wu Y, Zha T, Jia X, Tian Y, Bai Y, Bourque CP-A, Ma J, Feng W. Seasonal Changes in Photosynthetic Energy Utilization in a Desert Shrub (Artemisia ordosica Krasch.) during Its Different Phenophases. Forests. 2018; 9(4):176. https://doi.org/10.3390/f9040176
Chicago/Turabian StyleRen, Cai, Yajuan Wu, Tianshan Zha, Xin Jia, Yun Tian, Yujie Bai, Charles P.-A. Bourque, Jingyong Ma, and Wei Feng. 2018. "Seasonal Changes in Photosynthetic Energy Utilization in a Desert Shrub (Artemisia ordosica Krasch.) during Its Different Phenophases" Forests 9, no. 4: 176. https://doi.org/10.3390/f9040176
APA StyleRen, C., Wu, Y., Zha, T., Jia, X., Tian, Y., Bai, Y., Bourque, C. P.-A., Ma, J., & Feng, W. (2018). Seasonal Changes in Photosynthetic Energy Utilization in a Desert Shrub (Artemisia ordosica Krasch.) during Its Different Phenophases. Forests, 9(4), 176. https://doi.org/10.3390/f9040176