Predictors of Microhabitat Frequency and Diversity in Mixed Mountain Forests in South-Western Germany


Abstract
1. Introduction
2. Materials and Methods
2.1. Study Site
2.2. Inventory and Definition of Tree Microhabitats
2.3. Data Analysis and Statistics
3. Results
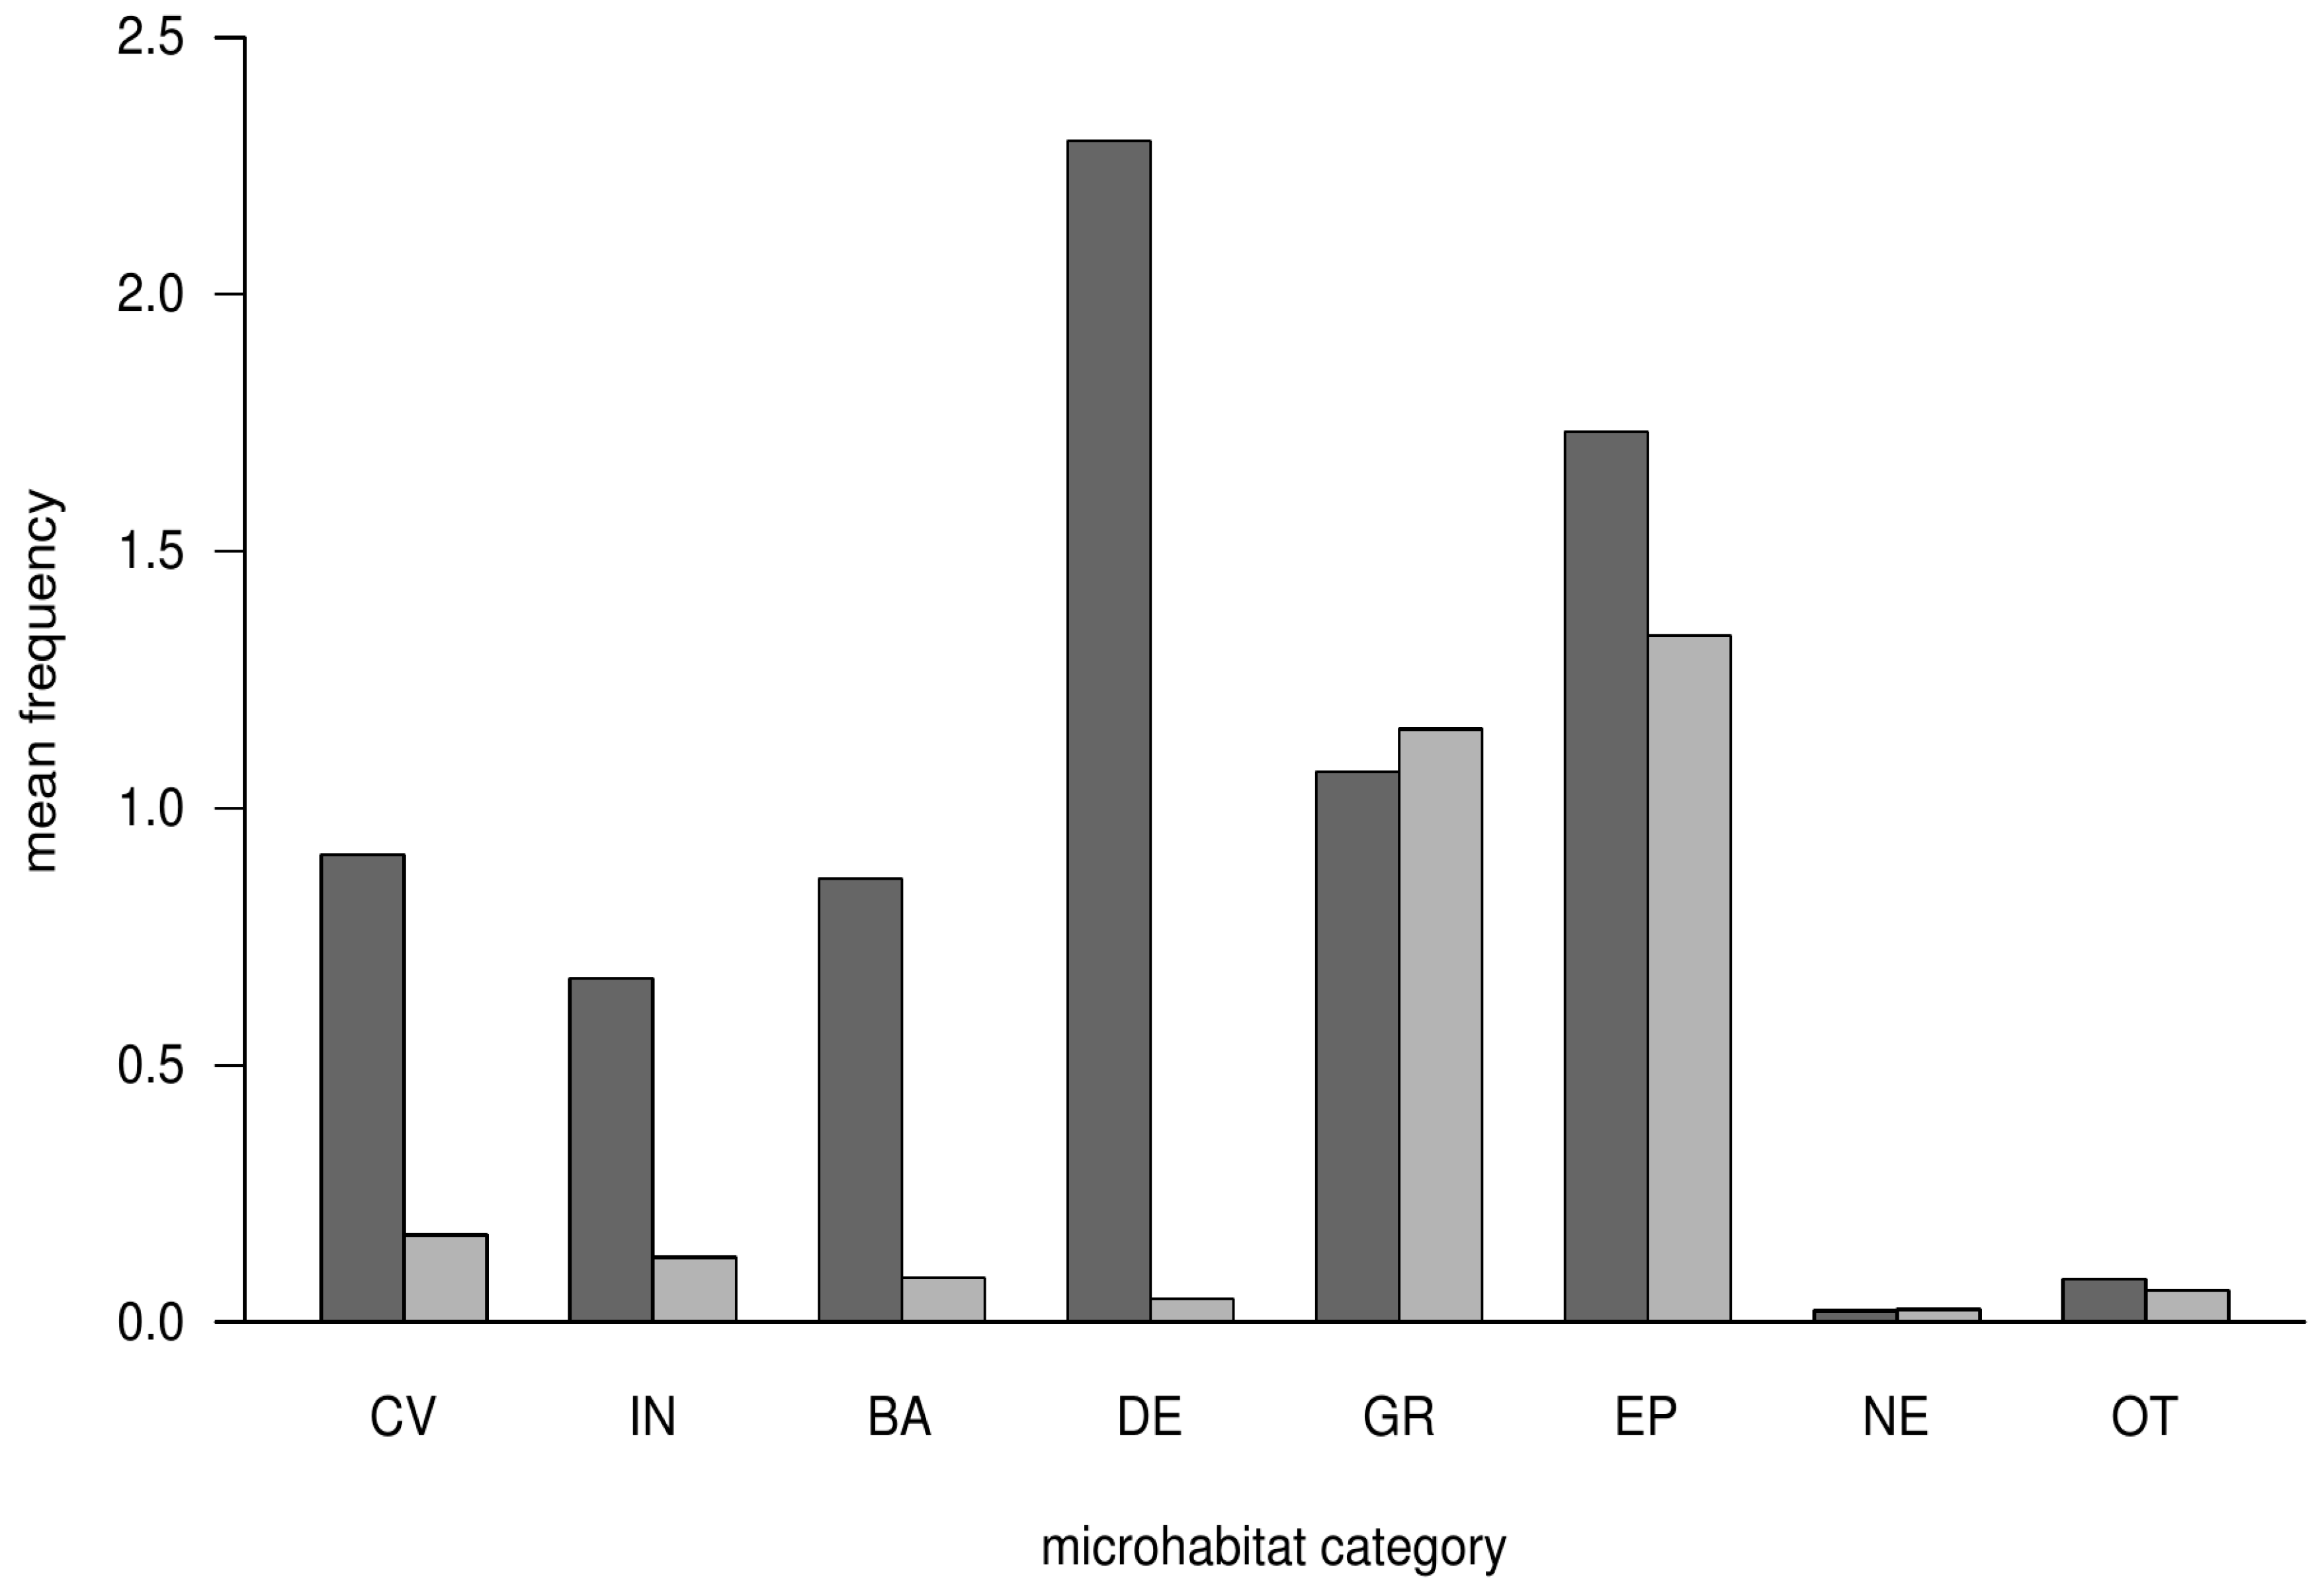
3.1. Occurrence of Microhabitat Categories
3.2. Modeling of Microhabitats
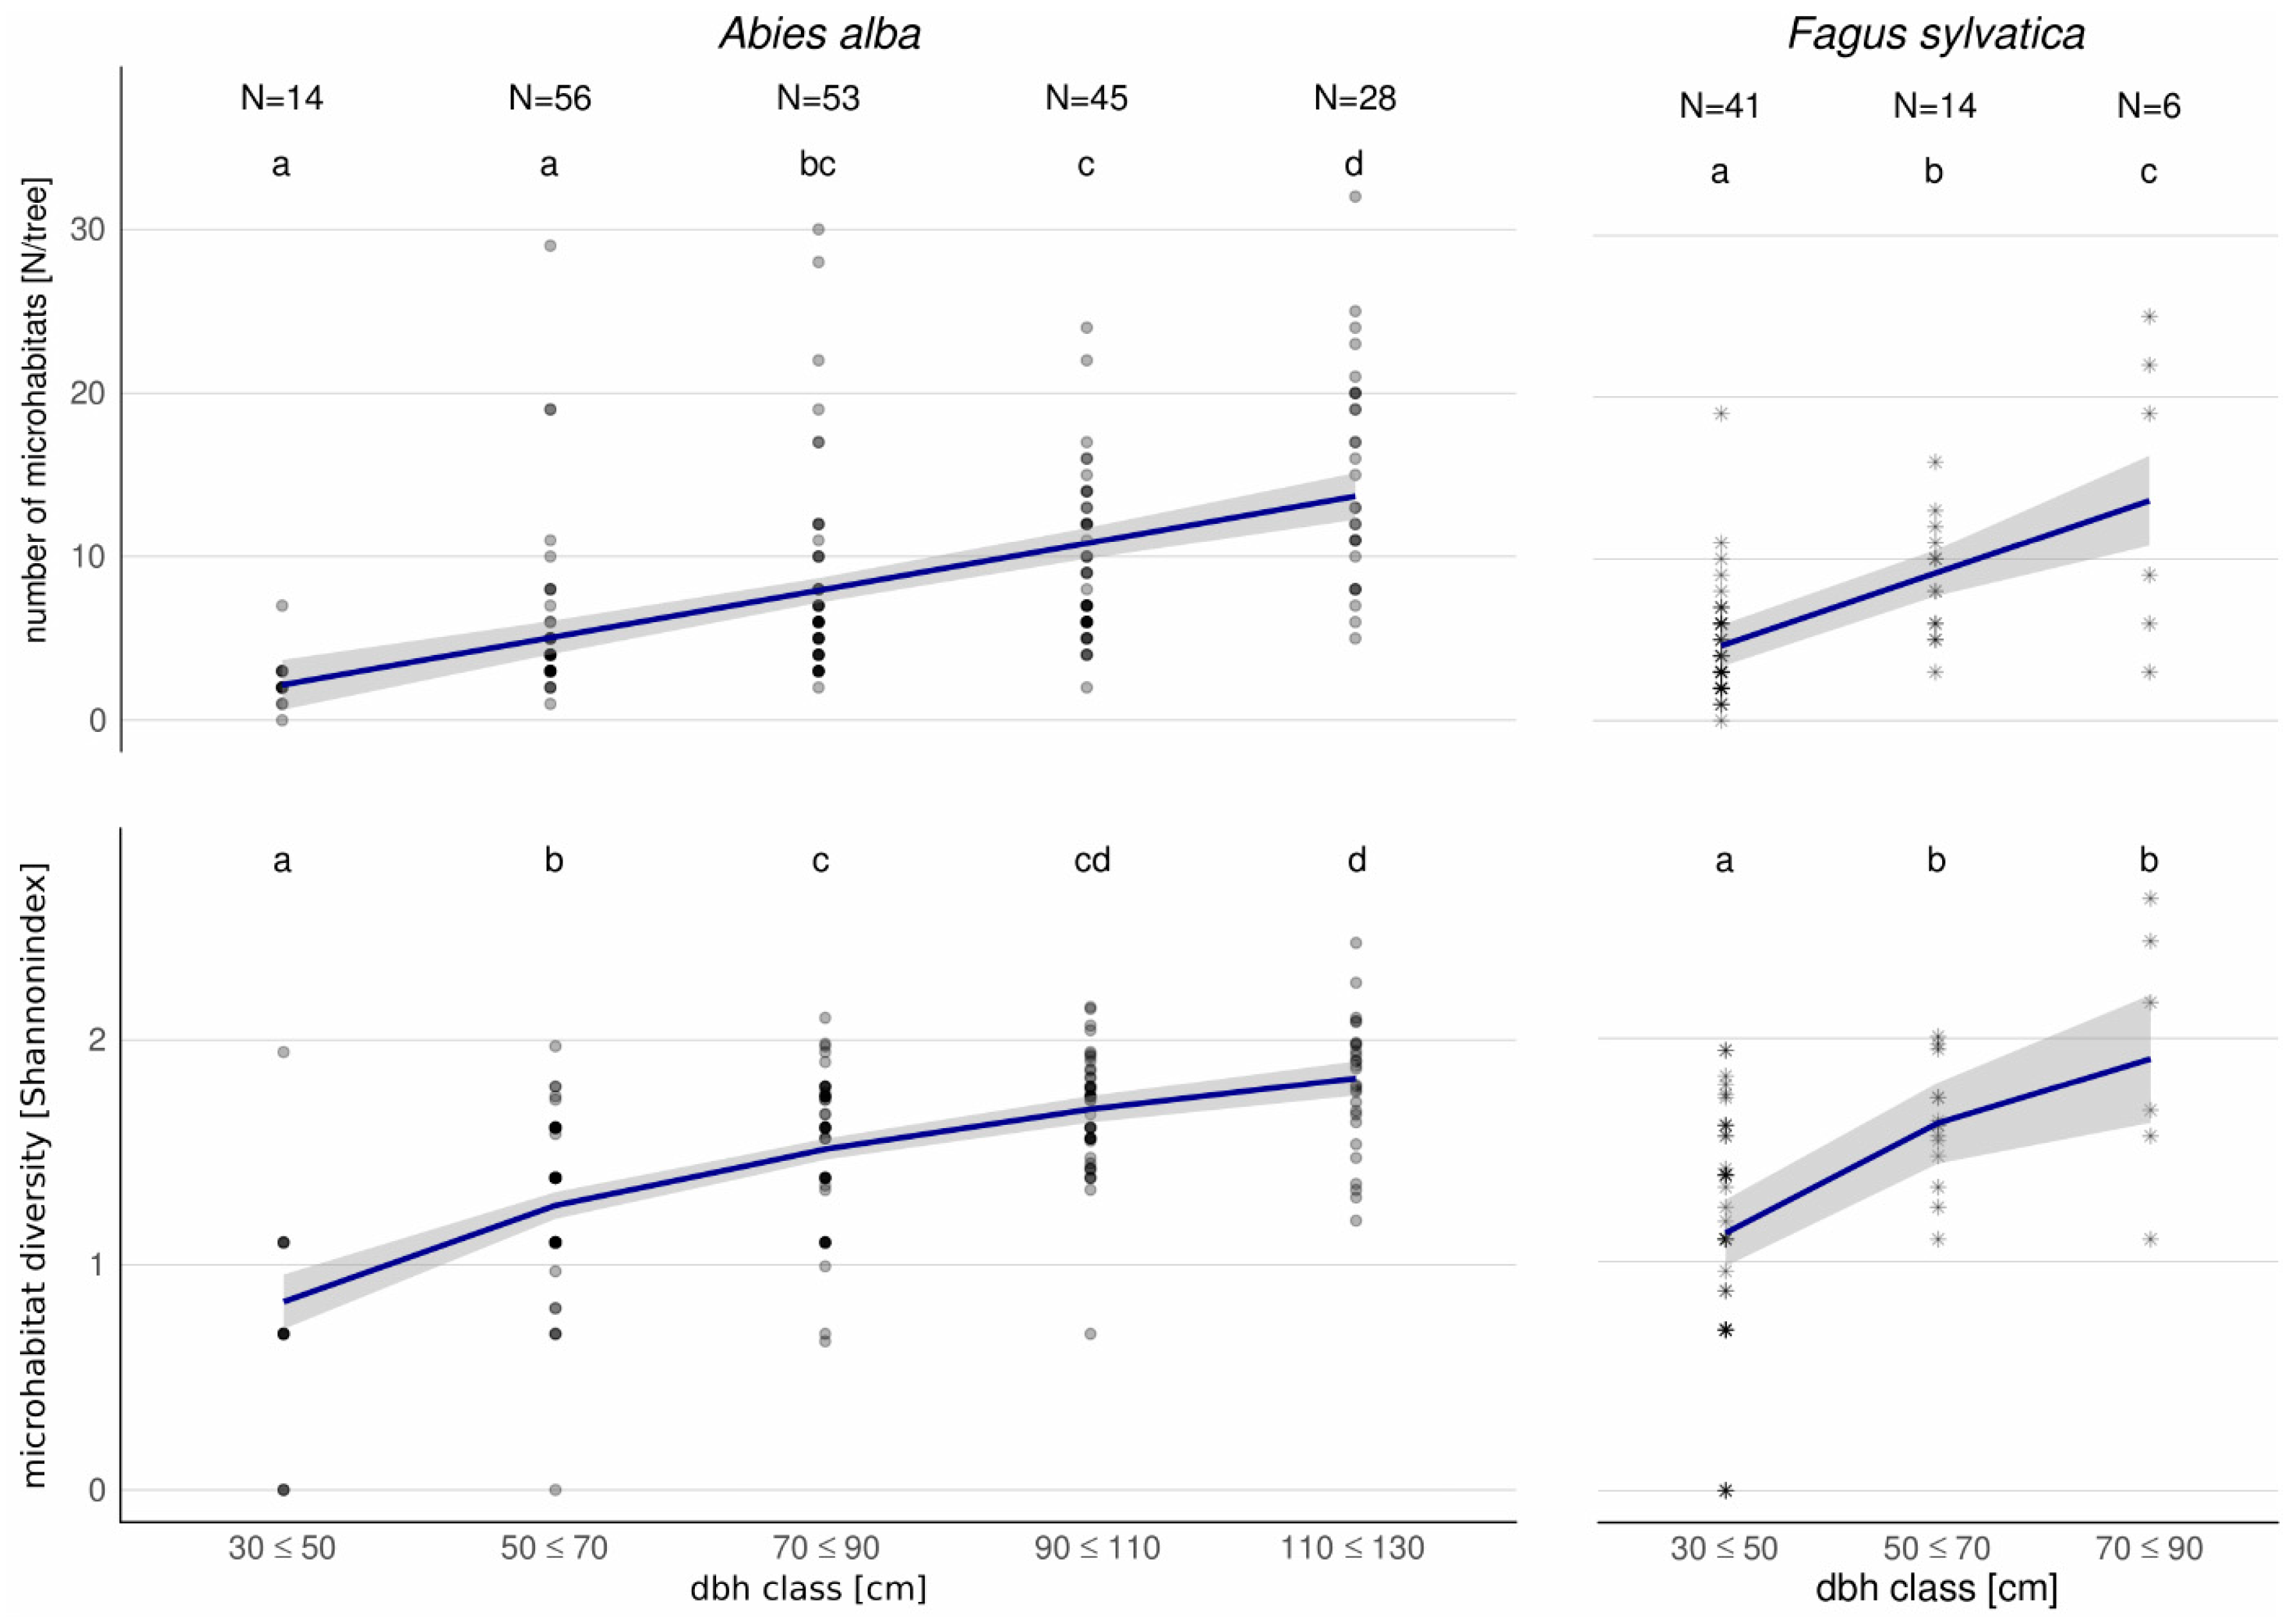
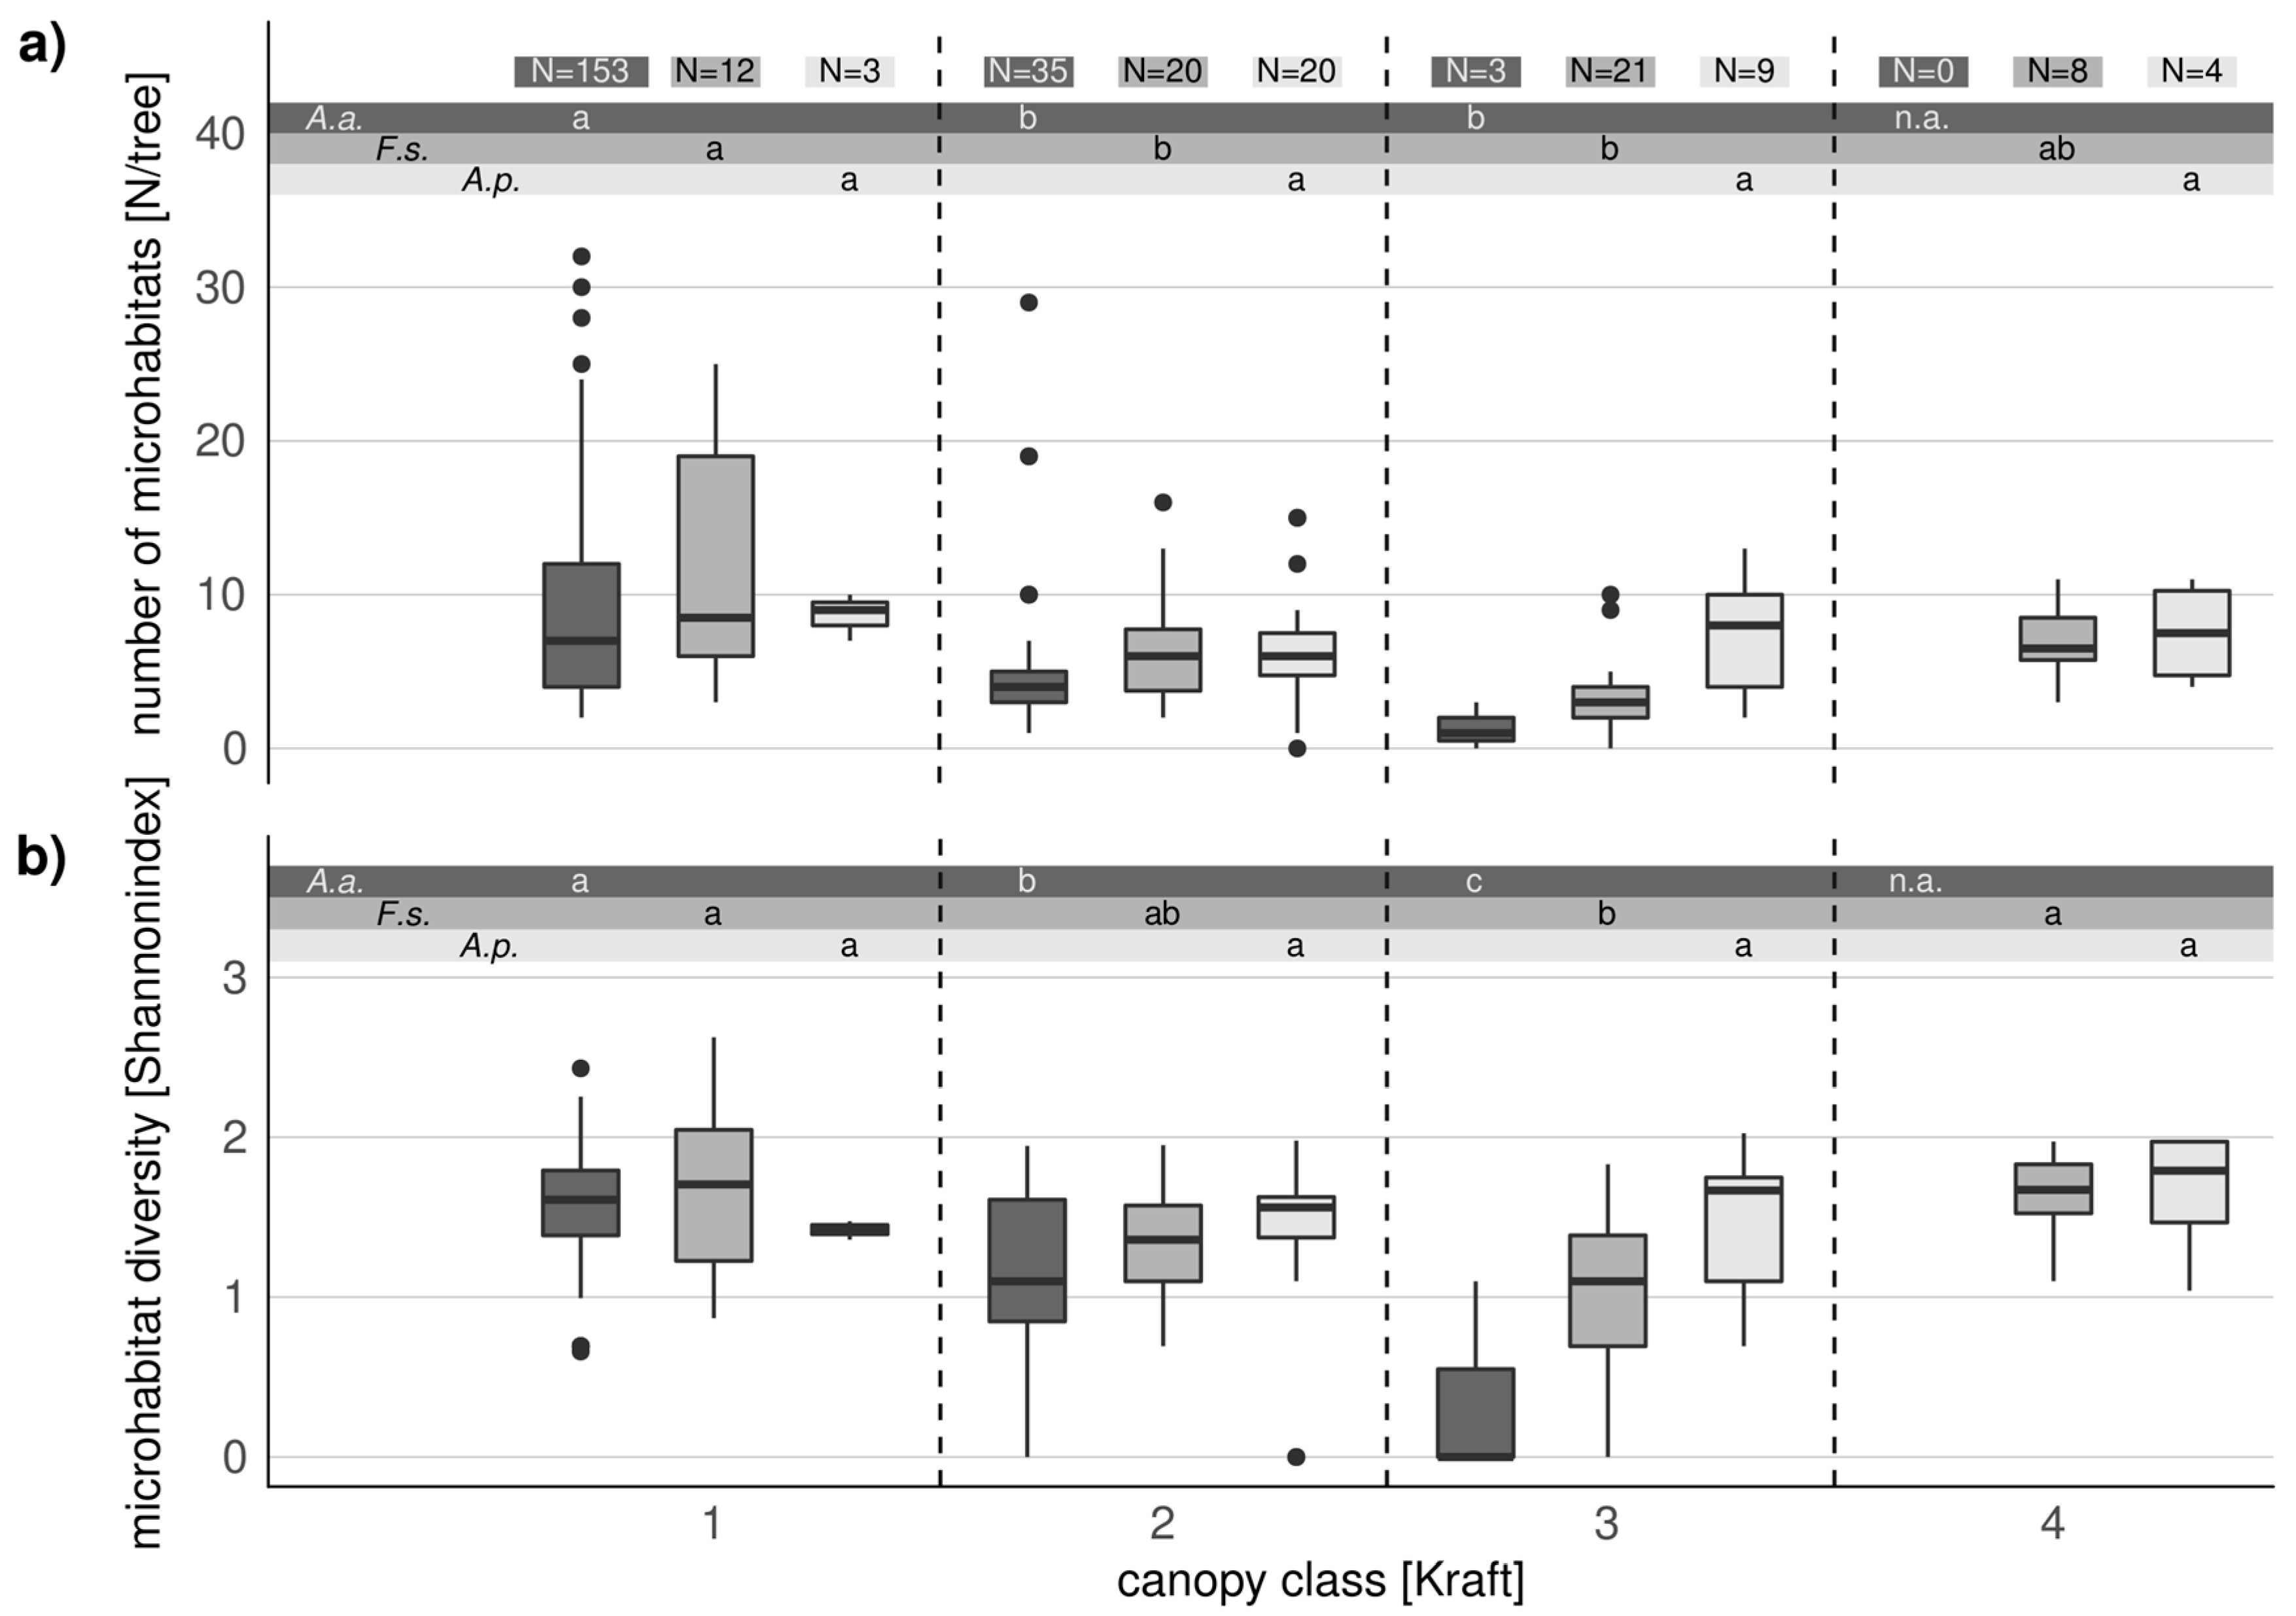
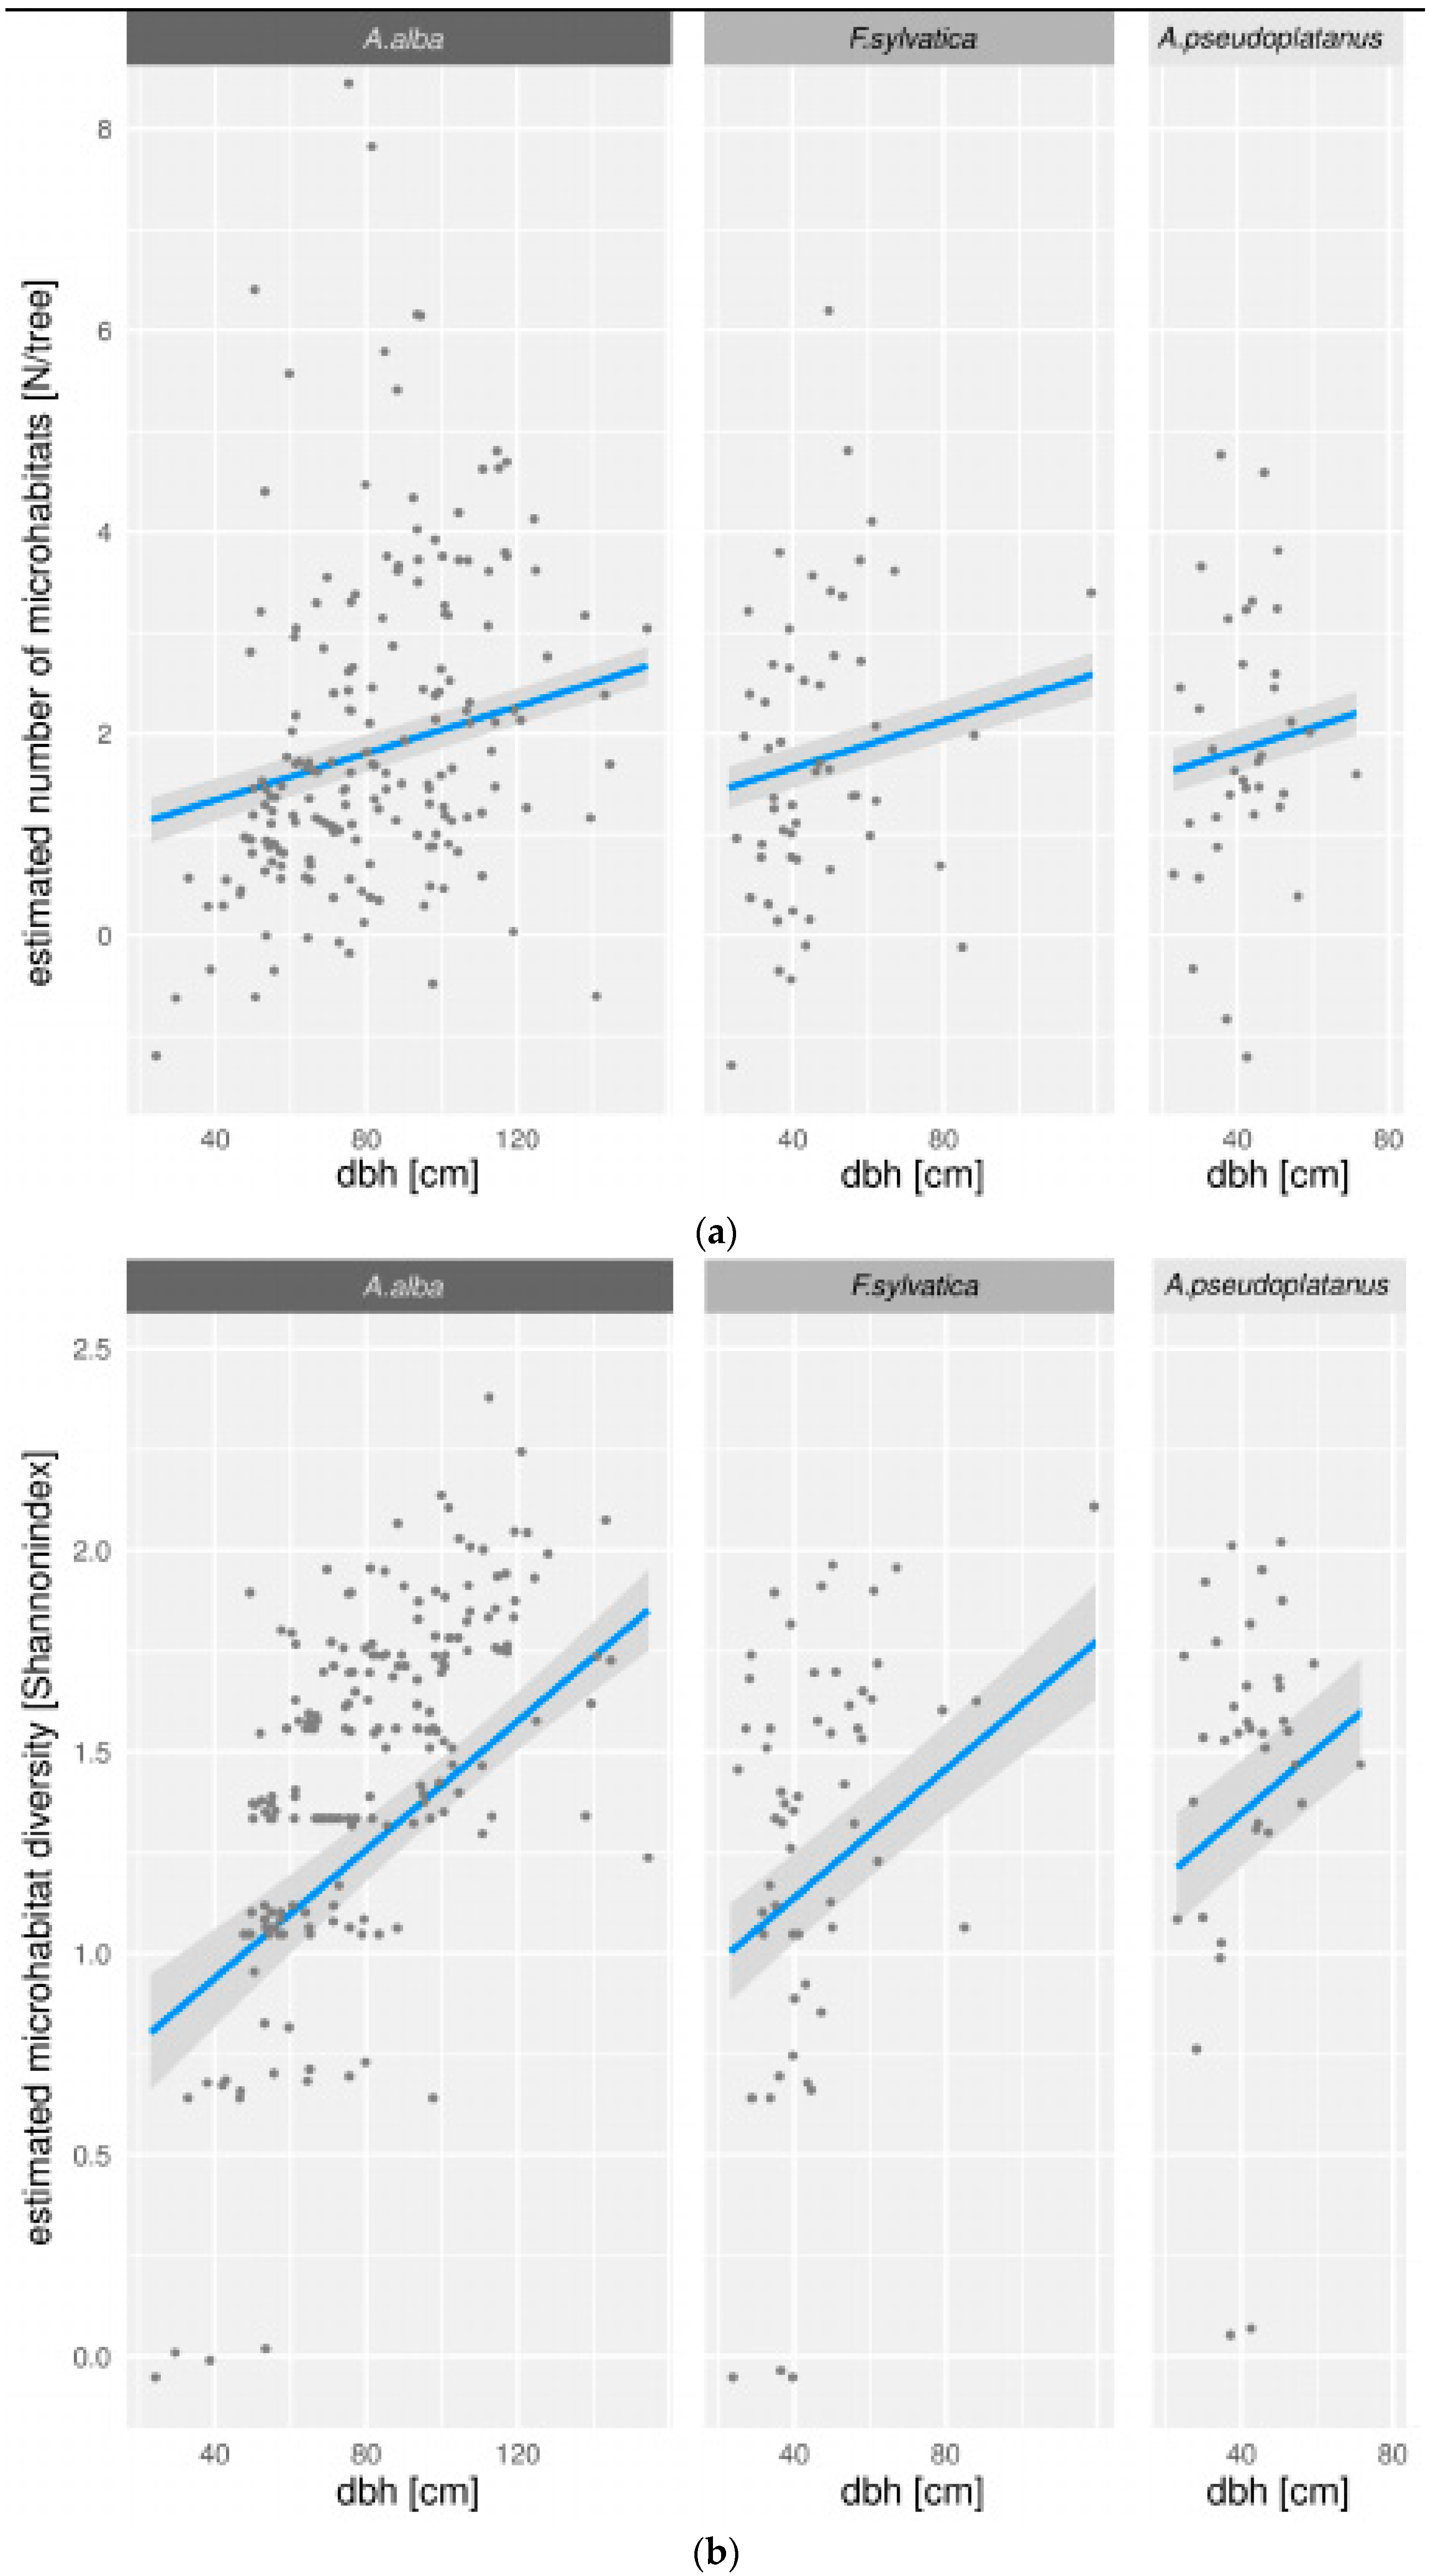
3.3. Microhabitat Number and Diversity
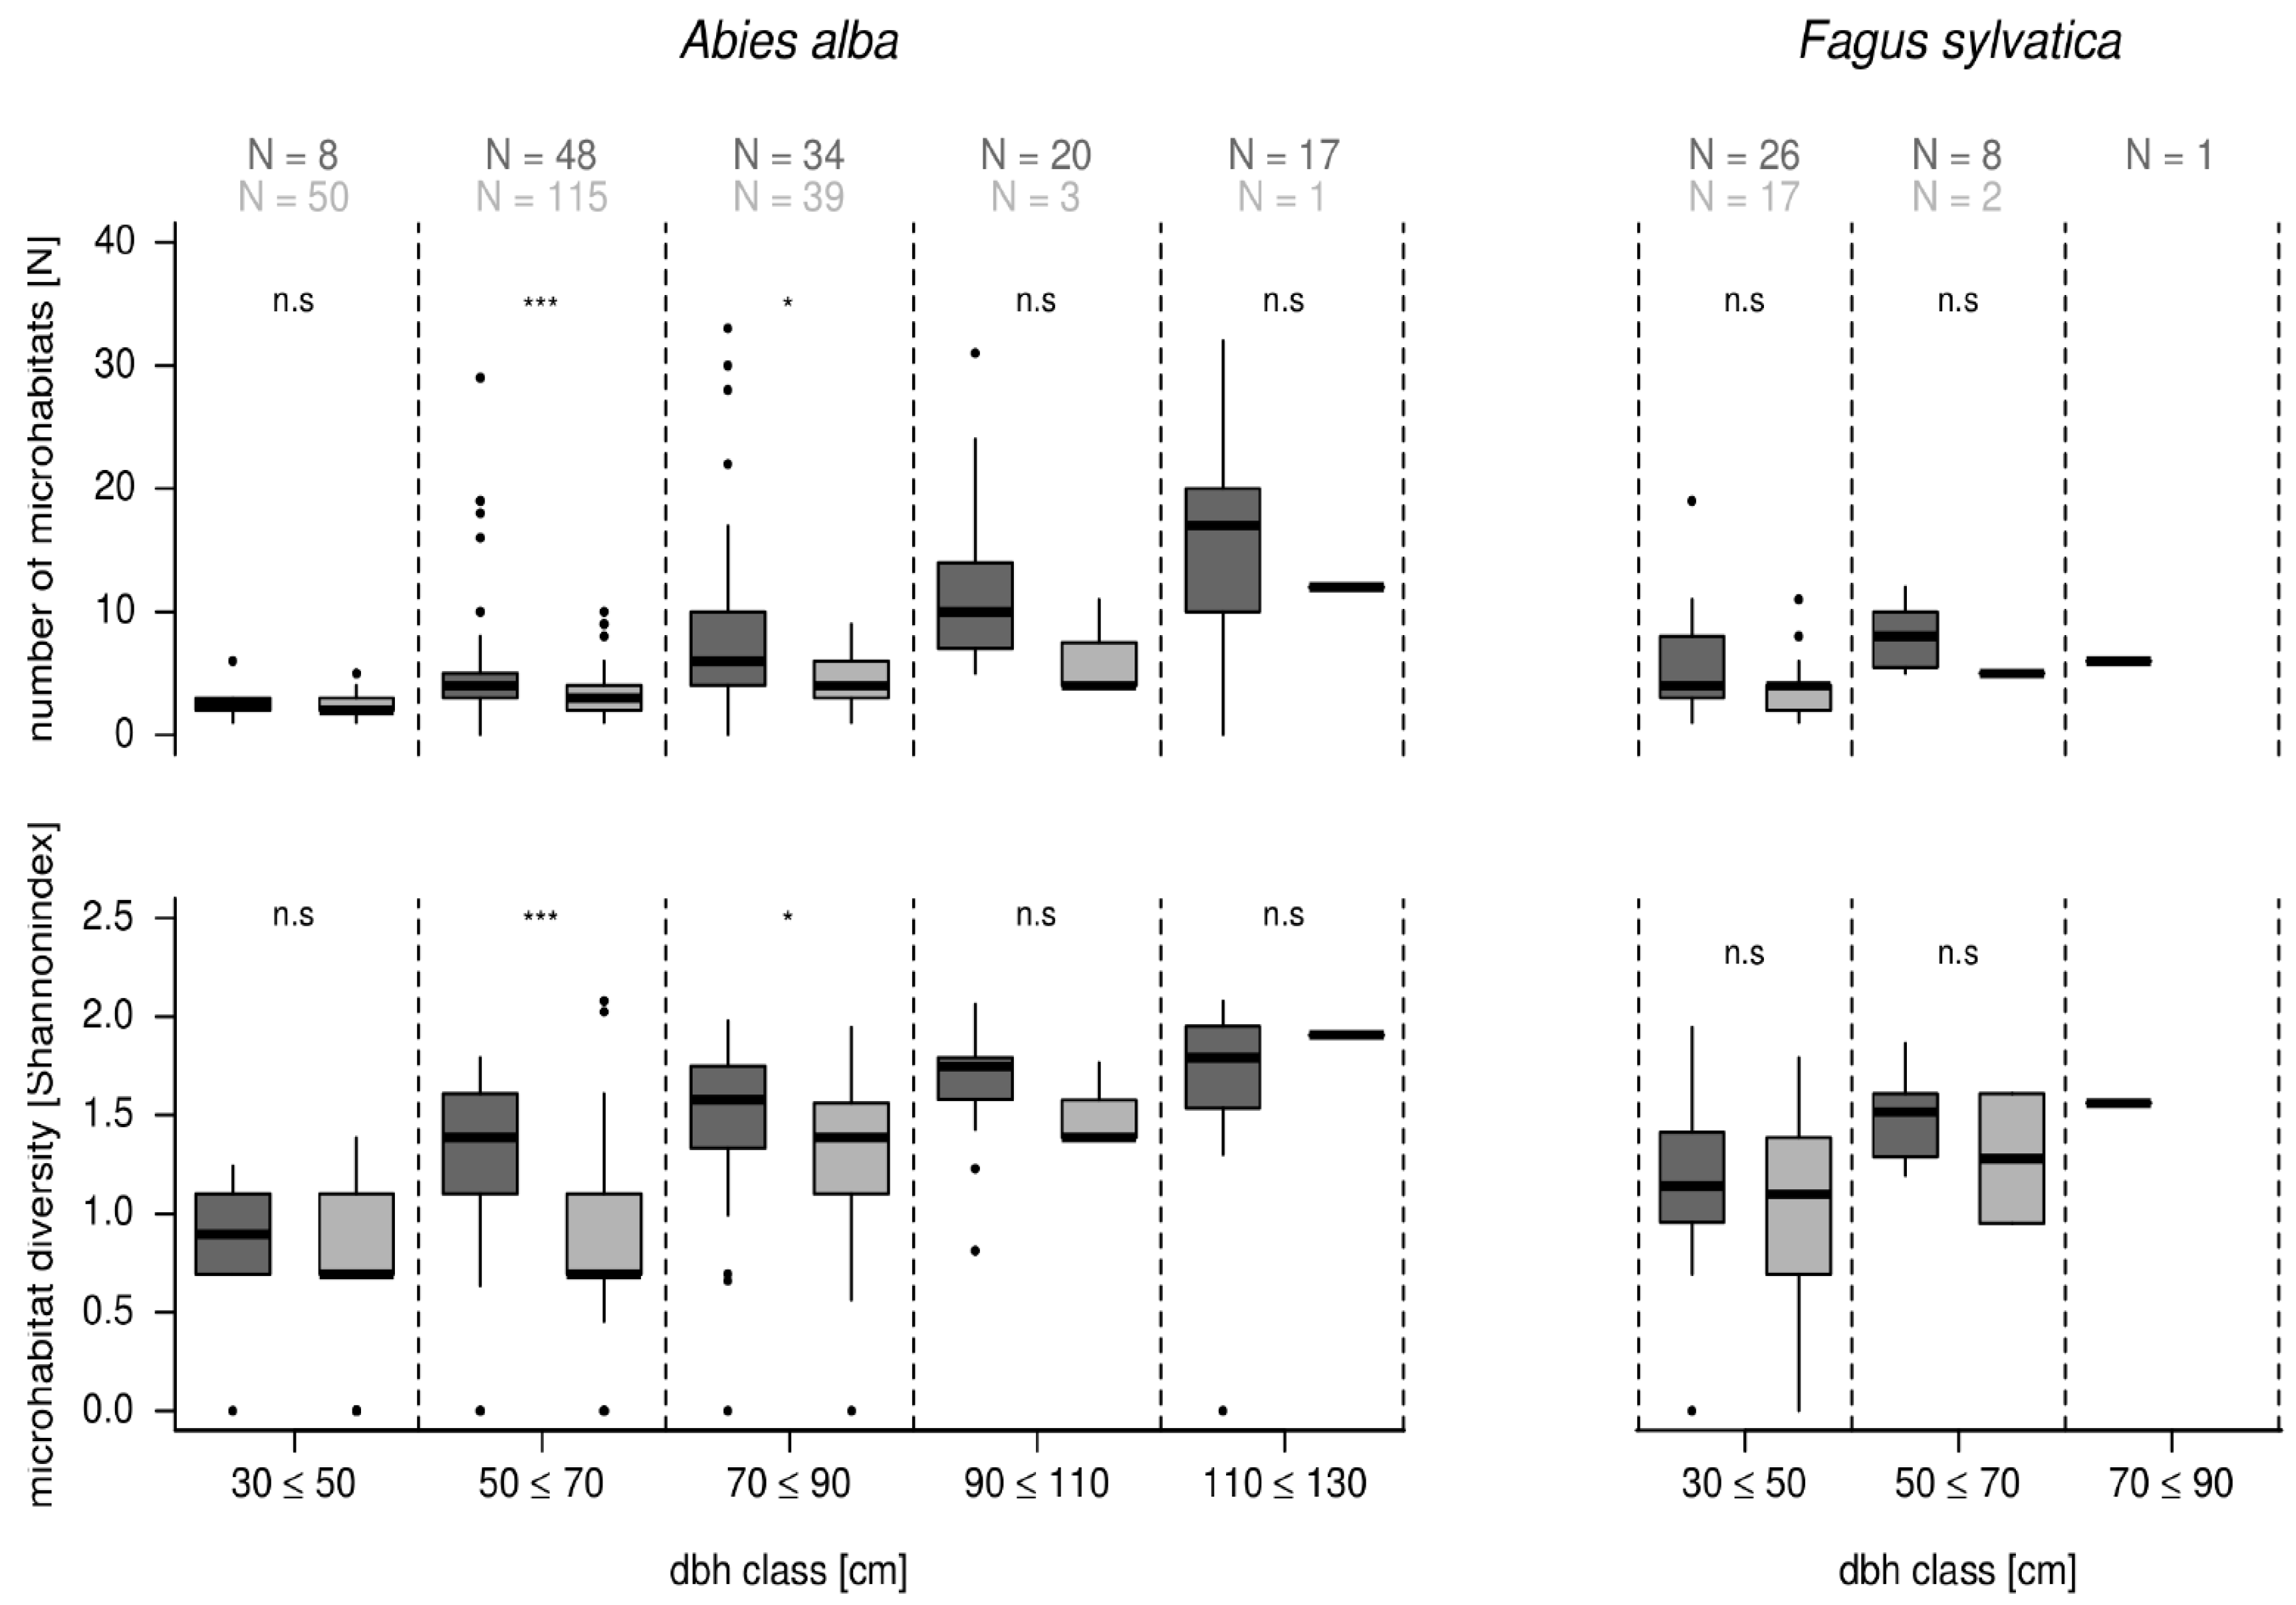
3.4. Comparison of Microhabitats in Habitat Trees and Crop Trees
4. Discussion
4.1. What Are the Benefits of the Qualitative Perspective on Microhabitats?
4.2. Are Tree Characteristics Suitable for Microhabitat Assessment?
5. Conclusions and Recommendations for Forest Managers
Acknowledgments
Author Contributions
Conflicts of Interest
Appendix A

| Microhabitat Group | Code | Type | |
|---|---|---|---|
| Cavities | Woodpecker cavities | CV11 | Ø = 4 cm |
| CV12 | Ø = 5–6 cm | ||
| CV13 | Ø > 10 cm | ||
| CV14 | Ø ≥ 10 cm (feeding hole) | ||
| CV15 | Woodpecker “flute“/cavity string | ||
| Trunk and mould cavities | CV21 | Ø ≥ 10 cm (ground contact) | |
| CV22 | Ø ≥ 30 cm (ground contact) | ||
| CV23 | Ø ≥ 10 | ||
| CV24 | Ø ≥ 30 | ||
| CV25 | Ø ≥ 30 cm/semi-open | ||
| CV26 | Ø ≥ 30 cm/open top | ||
| Branch holes | CV31 | Ø ≥ 5 cm | |
| CV32 | Ø ≥ 10 cm | ||
| CV33 | Hollow branch, Ø ≥ 10 cm | ||
| Dendrotelms and water-filled holes | CV41 | Ø ≥ 3 cm/trunk base | |
| CV42 | Ø ≥ 15 cm/trunk base | ||
| CV43 | Ø ≥ 5 cm/crown | ||
| CV44 | Ø ≥ 15 cm/crown | ||
| Insect galleries and bore holes | CV51 | Gallery with single small bore holes | |
| CV52 | Large bore hole, Ø ≥ 2cm | ||
| Injuries and wounds | Bark loss/exposed sapwood | IN11 | Bark loss 25–600 cm², decay stage < 3 |
| IN12 | Bark loss > 600 cm², decay stage < 3 | ||
| IN13 | Bark loss 25–600 cm², decay stage = 3 | ||
| IN14 | Bark loss > 600 cm², decay stage = 3 | ||
| Exposed heartwood/trunk and crown breakage | IN21 | Broken trunk, Ø ≥ 20 cm at the broken end | |
| IN22 | Broken tree crown/fork, exposed wood ≥ 300 cm² | ||
| IN23 | Broken limb, Ø ≥ 20 cm at the broken end | ||
| IN24 | Splintered stem, Ø ≥ 20 cm at the broken end | ||
| Cracks and scars | IN31 | Length ≥ 30 cm, width > 1 cm, depth > 10 cm | |
| IN32 | Length ≥ 100 cm, width > 1 cm, depth > 10 cm | ||
| IN33 | Lightning scar | ||
| IN34 | Fire scar, ≥ 600 cm² | ||
| Bark | Bark | BA11 | Bark shelter, width > 1 cm, depth > 10 cm, height > 10 cm |
| BA12 | Bark pocket, width > 1 cm, depth > 10 cm, height > 10 cm | ||
| BA21 | Coarse bark | ||
| Dead wood | Dead branches and limbs/crown deadwood | DE11 | Ø 10–20 cm, ≥ 50 cm, sun exposed |
| DE12 | Ø > 20 cm, ≥ 50 cm, sun exposed | ||
| DE13 | Ø 10–20 cm, ≥ 50 cm, not sun exposed | ||
| DE14 | Ø > 20 cm, ≥ 50 cm, not sun exposed | ||
| DE15 | Dead top, Ø ≥ 10 cm | ||
| Deformation/growth form | Root buttress cavities | GR11 | Ø ≥ 5 cm |
| GR12 | Ø ≥ 10 cm | ||
| GR13 | Trunk cleavage, length ≥ 30 cm | ||
| Witches broom | GR21 | Witches broom, Ø > 50 cm | |
| GR22 | Water sprout | ||
| Cancers and burrs | GR31 | Cancerous growth, Ø > 20 cm | |
| GR32 | Decayed canker, Ø > 20 cm | ||
| Epiphytes | Fruiting bodies fungi | EP11 | Annual polypores, Ø > 5 cm |
| EP12 | Perennial polypores, Ø > 10 cm | ||
| EP13 | Pulpy agaric, Ø > 5 cm | ||
| EP14 | Large ascomycetes, Ø > 5 cm | ||
| Myxomycetes | EP21 | Myxomycetes, Ø > 5 cm | |
| Epiphytic crypto- and phanerogams | EP31 | Epiphytic bryophytes, coverage > 25% | |
| EP32 | Epiphytic foliose and fruticose lichens, coverage > 25% | ||
| EP33 | Lianas, coverage > 25% | ||
| EP34 | Epiphytic ferns, >5 fronds | ||
| EP35 | Mistletoe | ||
| Nests | Nests | NE11 | Large vertebrate nest, Ø > 80 cm |
| NE12 | Small vertebrate nest, Ø > 10 cm | ||
| NE21 | Invertebrate nest | ||
| Other | Sap and resin run | OT11 | Sap flow, >50 cm |
| OT12 | Resin flow and pockets, >50 cm | ||
| Microsoil | OT21 | Crown microsoil | |
| OT22 | Bark microsoil | ||
| Microhabitat | Frequency | |
|---|---|---|
| Crop Trees | Habitat Trees | |
| CV11 | 0 | 0.016 |
| CV12 | 0 | 0.012 |
| CV13 | 0 | 0 |
| CV14 | 0 | 0.097 |
| CV15 | 0 | 0 |
| CV21 | 0 | 0.103 |
| CV22 | 0 | 0.009 |
| CV23 | 0.003 | 0.009 |
| CV24 | 0 | 0 |
| CV25 | 0 | 0.003 |
| Cv26 | 0 | 0 |
| CV31 | 0.077 | 0.231 |
| CV32 | 0.009 | 0.04 |
| CV33 | 0 | 0.003 |
| CV41 | 0.003 | 0.012 |
| CV42 | 0 | 0 |
| CV43 | 0.006 | 0.037 |
| CV44 | 0 | 0.012 |
| CV51 | 0.071 | 0.318 |
| CV52 | 0 | 0.006 |
| IN11 | 0.08 | 0.274 |
| IN12 | 0.009 | 0.022 |
| IN13 | 0.015 | 0.006 |
| IN14 | 0.003 | 0.003 |
| IN21 | 0.003 | 0.047 |
| IN22 | 0.003 | 0.025 |
| IN23 | 0.009 | 0.274 |
| IN24 | 0 | 0 |
| IN31 | 0 | 0.003 |
| IN32 | 0.003 | 0.012 |
| IN33 | 0 | 0.003 |
| IN34 | 0 | 0 |
| BA11 | 0.003 | 0.199 |
| BA12 | 0 | 0 |
| BA21 | 0.083 | 0.664 |
| DE11 | 0.022 | 1.056 |
| DE12 | 0.003 | 0.234 |
| DE13 | 0.019 | 0.788 |
| DE14 | 0 | 0.181 |
| DE15 | 0.003 | 0.04 |
| GR11 | 0.574 | 0.221 |
| GR12 | 0.204 | 0.087 |
| GR13 | 0.003 | 0.012 |
| GR21 | 0.293 | 0.181 |
| GR22 | 0.025 | 0.445 |
| GR31 | 0.003 | 0.022 |
| GR32 | 0.052 | 0.103 |
| EP11 | 0.003 | 0.009 |
| EP12 | 0 | 0.009 |
| EP13 | 0 | 0.003 |
| EP14 | 0 | 0.003 |
| EP21 | 0 | 0.003 |
| EP31 | 0.543 | 0.85 |
| EP32 | 0.784 | 0.819 |
| EP33 | 0 | 0 |
| EP34 | 0.003 | 0.034 |
| EP35 | 0.003 | 0 |
| NE11 | 0 | 0.016 |
| NE12 | 0.025 | 0.006 |
| NE21 | 0 | 0 |
| OT11 | 0.009 | 0.009 |
| OT12 | 0.031 | 0.037 |
| OT21 | 0.003 | 0.016 |
| OT22 | 0.019 | 0.022 |
| Micro-Habitat | Abies alba | Fagus sylvatica | ||||||||||||||||
|---|---|---|---|---|---|---|---|---|---|---|---|---|---|---|---|---|---|---|
| Canopy Class | dbh Class [cm] | Canopy Class | dbh Class [cm] | |||||||||||||||
| 1 | 2 | 3 | 4 | 30–50 | 50–70 | 70–90 | 90–110 | 110–130 | 1 | 2 | 3 | 4 | 30–50 | 50–70 | 70–90 | 90–110 | 110–130 | |
| CV11 | 0.013 | 0.029 | 0 | 0 | 0 | 0.031 | 0 | 0 | 0.015 | 0 | 0 | 0 | 0 | 0 | 0 | 0 | 0 | 0 |
| CV12 | 0.013 | 0 | 0 | 0 | 0 | 0 | 0.031 | 0 | 0 | 0 | 0 | 0 | 0 | 0 | 0 | 0 | 0 | 0 |
| CV13 | 0 | 0 | 0 | 0 | 0 | 0 | 0 | 0 | 0 | 0 | 0 | 0 | 0 | 0 | 0 | 0 | 0 | 0 |
| CV14 | 0.032 | 0.029 | 0 | 0 | 0 | 0.031 | 0.062 | 0 | 0 | 0 | 0.2 | 0 | 0 | 0.062 | 0 | 0 | 0 | 0 |
| CV15 | 0 | 0 | 0 | 0 | 0 | 0 | 0 | 0 | 0 | 0 | 0 | 0 | 0 | 0 | 0 | 0 | 0 | 0 |
| CV21 | 0.152 | 0 | 0 | 0 | 0 | 0.015 | 0.108 | 0.138 | 0.108 | 0.083 | 0.1 | 0.048 | 0.182 | 0.077 | 0 | 0 | 0.015 | 0 |
| CV22 | 0.006 | 0 | 0 | 0 | 0 | 0 | 0 | 0.015 | 0 | 0 | 0 | 0.048 | 0 | 0.015 | 0 | 0 | 0 | 0 |
| CV23 | 0.006 | 0 | 0 | 0 | 0 | 0 | 0 | 0 | 0.015 | 0 | 0 | 0 | 0.091 | 0 | 0.015 | 0 | 0 | 0 |
| CV24 | 0 | 0 | 0 | 0 | 0 | 0 | 0 | 0 | 0 | 0 | 0 | 0 | 0 | 0 | 0 | 0 | 0 | 0 |
| CV25 | 0.006 | 0 | 0 | 0 | 0 | 0 | 0 | 0 | 0.015 | 0 | 0 | 0 | 0 | 0 | 0 | 0 | 0 | 0 |
| CV26 | 0 | 0 | 0 | 0 | 0 | 0 | 0 | 0 | 0 | 0 | 0 | 0 | 0 | 0 | 0 | 0 | 0 | 0 |
| CV31 | 0.013 | 0 | 0 | 0 | 0 | 0 | 0.031 | 0 | 0 | 0.5 | 1.2 | 0.19 | 0.909 | 0.323 | 0.277 | 0.031 | 0.015 | 0.031 |
| CV32 | 0.013 | 0.029 | 0 | 0 | 0 | 0.015 | 0 | 0.015 | 0.015 | 0.333 | 0.1 | 0 | 0.182 | 0.031 | 0.062 | 0 | 0.015 | 0.015 |
| CV33 | 0 | 0 | 0 | 0 | 0 | 0 | 0 | 0 | 0 | 0 | 0 | 0 | 0 | 0 | 0 | 0 | 0 | 0 |
| CV41 | 0 | 0.029 | 0 | 0 | 0 | 0.015 | 0 | 0 | 0 | 0 | 0.05 | 0.048 | 0 | 0.031 | 0 | 0 | 0 | 0 |
| CV42 | 0 | 0 | 0 | 0 | 0 | 0 | 0 | 0 | 0 | 0 | 0 | 0 | 0 | 0 | 0 | 0 | 0 | 0 |
| CV43 | 0 | 0 | 0 | 0 | 0 | 0 | 0 | 0 | 0 | 0.583 | 0.15 | 0 | 0.091 | 0.031 | 0.046 | 0 | 0.062 | 0.031 |
| CV44 | 0 | 0 | 0 | 0 | 0 | 0 | 0 | 0 | 0 | 0.083 | 0.05 | 0 | 0.091 | 0.015 | 0.015 | 0 | 0 | 0.015 |
| CV51 | 0.494 | 0.343 | 0 | 0 | 0.015 | 0.231 | 0.354 | 0.446 | 0.338 | 0 | 0.15 | 0.048 | 0.091 | 0.046 | 0.015 | 0.015 | 0 | 0 |
| CV52 | 0.013 | 0 | 0 | 0 | 0 | 0 | 0.031 | 0 | 0 | 0 | 0 | 0 | 0 | 0 | 0 | 0 | 0 | 0 |
| IN11 | 0.19 | 0.171 | 0 | 0 | 0.015 | 0.169 | 0.108 | 0.2 | 0.062 | 0.917 | 0.2 | 0.143 | 0.455 | 0.123 | 0.092 | 0.046 | 0.077 | 0.015 |
| IN12 | 0.013 | 0 | 0 | 0 | 0 | 0 | 0.015 | 0 | 0.015 | 0.083 | 0.1 | 0 | 0.091 | 0.015 | 0.031 | 0 | 0.015 | 0 |
| IN13 | 0 | 0 | 0 | 0 | 0 | 0 | 0 | 0 | 0 | 0 | 0.05 | 0 | 0 | 0 | 0.015 | 0 | 0 | 0 |
| IN14 | 0 | 0 | 0 | 0 | 0 | 0 | 0 | 0 | 0 | 0.083 | 0 | 0 | 0 | 0 | 0 | 0 | 0.015 | 0 |
| IN21 | 0.057 | 0.057 | 0 | 0 | 0.015 | 0.015 | 0.046 | 0.062 | 0.031 | 0 | 0.05 | 0 | 0.091 | 0.015 | 0.015 | 0 | 0 | 0 |
| IN22 | 0 | 0 | 0 | 0 | 0 | 0 | 0 | 0 | 0 | 0.083 | 0.05 | 0.095 | 0.182 | 0.077 | 0 | 0 | 0.015 | 0 |
| IN23 | 0.076 | 0 | 0 | 0 | 0 | 0 | 0.031 | 0.046 | 0.108 | 2.083 | 0.6 | 0.381 | 0.636 | 0.354 | 0.246 | 0.046 | 0.092 | 0.062 |
| IN24 | 0 | 0 | 0 | 0 | 0 | 0 | 0 | 0 | 0 | 0 | 0 | 0 | 0 | 0 | 0 | 0 | 0 | 0 |
| IN31 | 0 | 0 | 0 | 0 | 0 | 0 | 0 | 0 | 0 | 0 | 0 | 0 | 0 | 0 | 0 | 0 | 0 | 0 |
| IN32 | 0.006 | 0 | 0 | 0 | 0 | 0 | 0.015 | 0 | 0 | 0 | 0 | 0 | 0.091 | 0.015 | 0 | 0 | 0 | 0 |
| IN33 | 0.006 | 0 | 0 | 0 | 0 | 0 | 0.015 | 0 | 0 | 0 | 0 | 0 | 0 | 0 | 0 | 0 | 0 | 0 |
| IN34 | 0 | 0 | 0 | 0 | 0 | 0 | 0 | 0 | 0 | 0 | 0 | 0 | 0 | 0 | 0 | 0 | 0 | 0 |
| BA11 | 0.133 | 0.057 | 0 | 0 | 0 | 0.062 | 0.215 | 0.077 | 0 | 0.167 | 0.15 | 0.048 | 0.091 | 0.031 | 0.046 | 0 | 0.031 | 0 |
| BA12 | 0 | 0 | 0 | 0 | 0 | 0 | 0 | 0 | 0 | 0 | 0 | 0 | 0 | 0 | 0 | 0 | 0 | 0 |
| BA21 | 0.93 | 0.629 | 0.333 | 0 | 0.077 | 0.738 | 0.723 | 0.662 | 0.415 | 0 | 0 | 0 | 0 | 0 | 0 | 0 | 0 | 0 |
| DE11 | 1.563 | 0.886 | 0 | 0 | 0 | 0.4 | 1.446 | 1.154 | 1.277 | 1.5 | 0.5 | 0.476 | 0.455 | 0.338 | 0.215 | 0.031 | 0.031 | 0.046 |
| DE12 | 0.184 | 0.971 | 0 | 0 | 0 | 0.231 | 0.431 | 0.015 | 0.292 | 0.417 | 0 | 0 | 0 | 0.046 | 0 | 0 | 0.031 | 0 |
| DE13 | 1.089 | 0.914 | 0 | 0 | 0 | 0.415 | 0.846 | 0.769 | 1.108 | 1.167 | 0.5 | 0.048 | 0 | 0.123 | 0.169 | 0.031 | 0.062 | 0 |
| DE14 | 0.266 | 0.229 | 0 | 0 | 0 | 0 | 0.323 | 0.031 | 0.415 | 0.167 | 0 | 0.048 | 0 | 0.015 | 0 | 0 | 0.031 | 0 |
| DE15 | 0.044 | 0 | 0 | 0 | 0 | 0 | 0 | 0.031 | 0.077 | 0 | 0.05 | 0.048 | 0 | 0.015 | 0.015 | 0 | 0 | 0 |
| GR11 | 0.222 | 0.143 | 0 | 0 | 0 | 0.077 | 0.185 | 0.215 | 0.138 | 0.917 | 0.35 | 0.143 | 0.273 | 0.154 | 0.108 | 0 | 0.062 | 0.046 |
| GR12 | 0.108 | 0.029 | 0 | 0 | 0 | 0.031 | 0.077 | 0.092 | 0.077 | 0.25 | 0.05 | 0 | 0 | 0.015 | 0.015 | 0 | 0.031 | 0 |
| GR13 | 0.013 | 0 | 0 | 0 | 0 | 0 | 0.015 | 0 | 0.015 | 0.167 | 0 | 0 | 0 | 0 | 0.031 | 0 | 0 | 0 |
| GR21 | 0.354 | 0.057 | 0 | 0 | 0 | 0 | 0.077 | 0.246 | 0.569 | 0 | 0 | 0 | 0 | 0 | 0 | 0 | 0 | 0 |
| GR22 | 0.899 | 0.029 | 0 | 0 | 0.015 | 0.169 | 0.662 | 0.908 | 0.446 | 0 | 0 | 0 | 0 | 0 | 0 | 0 | 0 | 0 |
| GR31 | 0.025 | 0 | 0 | 0 | 0 | 0 | 0 | 0 | 0.062 | 0 | 0.05 | 0 | 0.091 | 0.015 | 0.015 | 0 | 0 | 0 |
| GR32 | 0.177 | 0.114 | 0 | 0 | 0 | 0.169 | 0.123 | 0.123 | 0.077 | 0 | 0 | 0 | 0.091 | 0.015 | 0 | 0 | 0 | 0 |
| EP11 | 0.013 | 0 | 0 | 0 | 0 | 0.031 | 0 | 0 | 0 | 0 | 0 | 0.048 | 0 | 0.015 | 0 | 0 | 0 | 0 |
| EP12 | 0 | 0 | 0 | 0 | 0 | 0 | 0 | 0 | 0 | 0.25 | 0 | 0 | 0 | 0.046 | 0 | 0 | 0 | 0 |
| EP13 | 0 | 0 | 0 | 0 | 0 | 0 | 0 | 0 | 0 | 0 | 0 | 0 | 0 | 0 | 0 | 0 | 0 | 0 |
| EP14 | 0.006 | 0 | 0 | 0 | 0 | 0 | 0 | 0 | 0.015 | 0 | 0 | 0 | 0 | 0 | 0 | 0 | 0 | 0 |
| EP21 | 0 | 0 | 0 | 0 | 0 | 0 | 0 | 0 | 0 | 0 | 0 | 0 | 0 | 0 | 0 | 0 | 0 | 0 |
| EP31 | 0.911 | 0.914 | 0.667 | 0 | 0.2 | 0.815 | 0.785 | 0.585 | 0.354 | 0.833 | 1 | 0.857 | 0.818 | 0.585 | 0.215 | 0.031 | 0.031 | 0.015 |
| EP32 | 0.949 | 0.943 | 0.333 | 1 | 0.185 | 0.831 | 0.769 | 0.677 | 0.385 | 0.75 | 0.7 | 0.524 | 0.545 | 0.369 | 0.154 | 0.046 | 0.031 | 0.015 |
| EP33 | 0 | 0 | 0 | 0 | 0 | 0 | 0 | 0 | 0 | 0 | 0 | 0 | 0 | 0 | 0 | 0 | 0 | 0 |
| EP34 | 0.019 | 0.029 | 0 | 0 | 0 | 0 | 0.031 | 0.015 | 0.015 | 0.25 | 0.05 | 0 | 0.182 | 0.015 | 0.031 | 0 | 0.046 | 0 |
| EP35 | 0 | 0 | 0 | 0 | 0 | 0 | 0 | 0 | 0 | 0 | 0 | 0 | 0 | 0 | 0 | 0 | 0 | 0 |
| NE11 | 0.032 | 0 | 0 | 0 | 0 | 0 | 0.046 | 0.015 | 0.015 | 0 | 0 | 0 | 0 | 0 | 0 | 0 | 0 | 0 |
| NE12 | 0.013 | 0 | 0 | 0 | 0 | 0.015 | 0 | 0 | 0.015 | 0 | 0 | 0 | 0 | 0 | 0 | 0 | 0 | 0 |
| NE21 | 0 | 0 | 0 | 0 | 0 | 0 | 0 | 0 | 0 | 0 | 0 | 0 | 0 | 0 | 0 | 0 | 0 | 0 |
| OT11 | 0.006 | 0 | 0 | 0 | 0 | 0 | 0.015 | 0 | 0 | 0.167 | 0 | 0 | 0 | 0 | 0.031 | 0 | 0 | 0 |
| OT12 | 0.006 | 0.029 | 0 | 0 | 0 | 0.015 | 0 | 0.015 | 0 | 0 | 0 | 0 | 0 | 0 | 0 | 0 | 0 | 0 |
| OT21 | 0.006 | 0.029 | 0 | 0 | 0 | 0 | 0.015 | 0 | 0.015 | 0.083 | 0 | 0 | 0 | 0 | 0 | 0 | 0.015 | 0 |
| OT22 | 0.006 | 0 | 0 | 0 | 0 | 0.015 | 0 | 0 | 0 | 0 | 0.05 | 0.095 | 0.182 | 0.062 | 0.015 | 0 | 0 | 0 |
| Microhabitat | Tree Status | |
|---|---|---|
| Alive | Dead | |
| CV1 * | 0.056 | 0.500 |
| CV2 * | 0.137 | 0.100 |
| CV3 * | 0.025 | 0 |
| CV4 * | 0.005 | 0 |
| CV5 * | 0.467 | 0.700 |
| IN1 * | 0.193 | 0.500 |
| IN2 * | 0.117 | 0.100 |
| IN3 * | 0.010 | 0 |
| BA1 * | 0.117 | 6.900 |
| BA21 | 0.863 | 0.200 |
| DE11, 12 | 1.731 | n.a. |
| DE13, 14 | 1.289 | n.a. |
| DE15 | 0.036 | n.a. |
| GR1 * | 0.305 | 0.100 |
| GR2 * | 1.020 | 0 |
| GR3 * | 0.183 | 0.100 |
| EP1 * | 0.015 | 0.300 |
| EP21 | 0 | 0 |
| EP31 | 0.904 | 0 |
| EP32 | 0.939 | 0.100 |
| EP3 * | 0.020 | 0 |
| NE11 | 0 | 0 |
| NE12 | 0.036 | 0 |
| NE21 | 0 | 0 |
| OT11 | 0.005 | 0 |
| OT12 | 0.010 | 0 |

References
- Bengtsson, J.; Nilsson, S.G.; Franc, A.; Menozzi, P. Biodiversity, disturbances, ecosystem function and management of European forests. For. Ecol. Manag. 2000, 132, 39–50. [Google Scholar] [CrossRef]
- Vandekerkhove, K.; De Keersmaeker, L.; Menke, N.; Meyer, P.; Verschelde, P. When nature takes over from man: Dead wood accumulation in previously managed oak and beech woodlands in North-Western and Central Europe. For. Ecol. Manag. 2009, 258, 425–435. [Google Scholar] [CrossRef]
- Scherzinger, W. Naturschutz im Wald: Qualitätsziele einer Dynamischen Waldentwicklung; 36 Tabellen; Ulmer: Stuttgart, Germany, 1996; ISBN 978-3-8001-3356-7. [Google Scholar]
- Paillet, Y.; BergèS, L.; HjäLtéN, J.; óDor, P.; Avon, C.; Bernhardt-RöMermann, M.; Bijlsma, R.-J.; De Bruyn, L.; Fuhr, M.; Grandin, U.; et al. Biodiversity Differences between Managed and Unmanaged Forests: Meta-Analysis of Species Richness in Europe. Conserv. Biol. 2010, 24, 101–112. [Google Scholar] [CrossRef] [PubMed]
- Purahong, W.; Hoppe, B.; Kahl, T.; Schloter, M.; Schulze, E.-D.; Bauhus, J.; Buscot, F.; Krüger, D. Changes within a single land-use category alter microbial diversity and community structure: Molecular evidence from wood-inhabiting fungi in forest ecosystems. J. Environ. Manag. 2014, 139, 109–119. [Google Scholar] [CrossRef] [PubMed]
- Keren, S.; Diaci, J. Comparing the Quantity and Structure of Deadwood in Selection Managed and Old-Growth Forests in South-East Europe. Forests 2018, 9, 76. [Google Scholar] [CrossRef]
- Winter, S.; Brambach, F. Determination of a common forest life cycle assessment method for biodiversity evaluation. For. Ecol. Manag. 2011, 262, 2120–2132. [Google Scholar] [CrossRef]
- Bollmann, K.; Bergamini, A.; Senn-Irlet, B.; Nobis, M.; Duelli, P.; Scheidegger, C. Konzepte, Instrumente und Herausforderungen bei der Förderung der Biodiversität im Wald | Concepts, instruments and challenges for the conservation of biodiversity in the forest. Schweiz. Z. Forstwes. 2009, 160, 53–67. [Google Scholar] [CrossRef][Green Version]
- Kraus, D.; Krumm, F. Integrative Approaches as an Opportunity for the Conservation of Forest Biodiversity; European Forest Institute: Joensuu, Finland, 2013; ISBN 978-952-5980-07-3. [Google Scholar]
- Bauhus, J.; Puettmann, K.; Messier, C. Silviculture for old-growth attributes. For. Ecol. Manag. 2009, 258, 525–537. [Google Scholar] [CrossRef]
- Ranius, T.; Caruso, A.; Jonsell, M.; Juutinen, A.; Thor, G.; Rudolphi, J. Dead wood creation to compensate for habitat loss from intensive forestry. Biol. Conserv. 2014, 169, 277–284. [Google Scholar] [CrossRef]
- Rosenvald, R.; Lõhmus, A. For what, when, and where is green-tree retention better than clear-cutting? A review of the biodiversity aspects. For. Ecol. Manag. 2008, 255, 1–15. [Google Scholar] [CrossRef]
- Bütler, R.; Lachat, T.; Larrieu, L.; Paillet, Y. Habitat trees: Key elements for forest biodiversity. In Integrative Approaches as an Opportunity for the Conservation of Forest Biodiversity; European Forest Institute: Joensuu, Finland, 2013; p. 284. ISBN 978-952-5980-07-3. [Google Scholar]
- Kraft, G. Beiträge zur Lehre von den Durchforstungen, Schlagstellungen und Lichtungshieben; Klindworth: Hannover, Germany, 1884. [Google Scholar]
- Lonsdale, D. Ancient and Other Veteran Trees: Further Guidance on Management; Tree Council: London, UK, 2013; ISBN 978-0-904853-09-4. [Google Scholar]
- Horák, J. Insect ecology and veteran trees. J. Insect Conserv. 2017, 21, 1–5. [Google Scholar] [CrossRef]
- Winter, S.; Möller, G.C. Microhabitats in lowland beech forests as monitoring tool for nature conservation. For. Ecol. Manag. 2008, 255, 1251–1261. [Google Scholar] [CrossRef]
- Vuidot, A.; Paillet, Y.; Archaux, F.; Gosselin, F. Influence of tree characteristics and forest management on tree microhabitats. Biol. Conserv. 2011, 144, 441–450. [Google Scholar] [CrossRef]
- Larrieu, L.; Cabanettes, A. Species, live status, and diameter are important tree features for diversity and abundance of tree microhabitats in subnatural montane beech–fir forests1This article is one of a selection of papers from the International Symposium on Dynamics and Ecological Services of Deadwood in Forest Ecosystems. Can. J. For. Res. 2012, 42, 1433–1445. [Google Scholar] [CrossRef]
- Regnery, B.; Paillet, Y.; Couvet, D.; Kerbiriou, C. Which factors influence the occurrence and density of tree microhabitats in Mediterranean oak forests? For. Ecol. Manag. 2013, 295, 118–125. [Google Scholar] [CrossRef]
- Ouin, A.; Cabanettes, A.; Andrieu, E.; Deconchat, M.; Roume, A.; Vigan, M.; Larrieu, L. Comparison of tree microhabitat abundance and diversity in the edges and interior of small temperate woodlands. For. Ecol. Manag. 2015, 340, 31–39. [Google Scholar] [CrossRef]
- Ranius, T. Influence of stand size and quality of tree hollows on saproxylic beetles in Sweden. Biol. Conserv. 2002, 103, 85–91. [Google Scholar] [CrossRef]
- Bernicchia, A. Polyporaceae s.l; Fungi Europaei; Edizioni Candusso: Alassio, Italy, 2005; ISBN 978-88-901057-5-3. [Google Scholar]
- Fritz, Ö.; Heilmann-Clausen, J. Rot holes create key microhabitats for epiphytic lichens and bryophytes on beech (Fagus sylvatica). Biol. Conserv. 2010, 143, 1008–1016. [Google Scholar] [CrossRef]
- Regnery, B.; Couvet, D.; Kubarek, L.; Julien, J.-F.; Kerbiriou, C. Tree microhabitats as indicators of bird and bat communities in Mediterranean forests. Ecol. Indic. 2013, 34, 221–230. [Google Scholar] [CrossRef]
- Bouget, C.; Larrieu, L.; Brin, A. Key features for saproxylic beetle diversity derived from rapid habitat assessment in temperate forests. Ecol. Indic. 2014, 36, 656–664. [Google Scholar] [CrossRef]
- Parisi, F.; Lombardi, F.; Sciarretta, A.; Tognetti, R.; Campanaro, A.; Marchetti, M.; Trematerra, P. Spatial patterns of saproxylic beetles in a relic silver fir forest (Central Italy), relationships with forest structure and biodiversity indicators. For. Ecol. Manag. 2016, 381, 217–234. [Google Scholar] [CrossRef]
- Winter, S.; Höfler, J.; Michel, A.K.; Böck, A.; Ankerst, D.P. Association of tree and plot characteristics with microhabitat formation in European beech and Douglas-fir forests. Eur. J. For. Res. 2014, 134, 335–347. [Google Scholar] [CrossRef]
- Johann, F.; Schaich, H. Land ownership affects diversity and abundance of tree microhabitats in deciduous temperate forests. For. Ecol. Manag. 2016, 380, 70–81. [Google Scholar] [CrossRef]
- Paillet, Y.; Archaux, F.; Boulanger, V.; Debaive, N.; Fuhr, M.; Gilg, O.; Gosselin, F.; Guilbert, E. Snags and large trees drive higher tree microhabitat densities in strict forest reserves. For. Ecol. Manag. 2017, 389, 176–186. [Google Scholar] [CrossRef]
- Larrieu, L.; Cabanettes, A.; Brin, A.; Bouget, C.; Deconchat, M. Tree microhabitats at the stand scale in montane beech–fir forests: Practical information for taxa conservation in forestry. Eur. J. For. Res. 2014, 133, 355–367. [Google Scholar] [CrossRef]
- Kiehne, J. Das Marteloskop Rosskopf als Grundlage zur Beurteilung von Betriebswirtschaftlichen und Naturschutzfachlichen Aspekten im Bergmischwald. Master’s Thesis, Albert-Ludwigs-Universität, Freiburg im Breisgau, Germany, 2015. [Google Scholar]
- Larrieu, L.; Cabanettes, A.; Delarue, A. Impact of silviculture on dead wood and on the distribution and frequency of tree microhabitats in montane beech-fir forests of the Pyrenees. Eur. J. For. Res. 2012, 131, 773–786. [Google Scholar] [CrossRef]
- Winter, S. Ermittlung von Struktur-Indikatoren zur Abschätzung des Einflusses Forstlicher Bewirtschaftung auf die Biozönosen von Tiefland-Buchenwäldern. Ph.D. Thesis, Technische Universität Dresden, Dresden, Germany, 2005. [Google Scholar]
- Larrieu, L.; Cabanettes, A.; Gouix, N.; Burnel, L.; Bouget, C.; Deconchat, M. Development over time of the tree-related microhabitat profile: The case of lowland beech–oak coppice-with-standards set-aside stands in France. Eur. J. For. Res. 2016. [Google Scholar] [CrossRef]
- Schürg, R. Das Marteloskop Mooswald als Grundlage zur Beurteilung von Betriebswirtschaftlichen und Naturschutzfachlichen Aspekten in Ehemaligen Eichen-Mittelwäldern. Master’s Thesis, Albert-Ludwigs-Universität, Freiburg im Breisgau, Germany, 2015. [Google Scholar]
- Michel, A.K.; Winter, S.; Linde, A. The effect of tree dimension on the diversity of bark microhabitat structures and bark use in Douglas-fir (Pseudotsuga menziesii var. menziesii). Can. J. For. Res. 2011, 41, 300–308. [Google Scholar] [CrossRef]
- Köppler, D. Landschaften und Vegetation des Oberen Hotzenwalds. Mittelungen Badischen Landesver. Für Naturkunde Naturschutz EV 2002, 18, 45–65. [Google Scholar]
- Schuhwerk, F. Naturnahe Vegetation im Hotzenwald (Südöstlicher Schwarzwald). Ph.D. Thesis, University Regensburg, Regensburg, Germany, 1988. [Google Scholar]
- Schreiner, A.; Gschopf, R. Zur Geologie und Morphologie des Hotzenwaldes. Mittelungen Badischen Landesver. Für Naturkunde Naturschutz EV 2002, 18, 29–44. [Google Scholar]
- VFS—Verein für Forstliche Standortskunde und Forstpflanzenzüchtung—Regionale Gliederung. Available online: http://www.vfs-freiburg.de/html/seiten/text.phtml?nav=121&lang=de (accessed on 18 January 2018).
- Jürgen Bauhus, P.P. Managed Forests. In Routledge Handbook of Forest Ecology; Routledge: Abingdon, UK, 2015. [Google Scholar]
- Körner, H.; Reichelt, G. Der Hotzenwald: Beiträge zur Natur und Kultur einer Landschaft im Südschwarzwald; Mitteilungen des Badischen Landesvereins für Naturkunde und Naturschutz; Lavori: Freiburg im Breisgau, Germany, 2003; ISBN 978-3-935737-44-9. [Google Scholar]
- Tribukait, F.; Matt-Willmatt, H.; Baumhof-Pregitzer, M.; Suchant, R.; von Sengbusch, P. Full of LIFE—Results from the Oberer Hotzenwald LIFE Nature Project; State Administration for Nature Conservation Baden-Württemberg: Freiburg, Germany, 2011.
- Tribukait, F. EU-LIFE-Projekt Oberer Hotzenwald; State Administration for Nature Conservation Baden-Württemberg: Freiburg, Germany, 2011; p. 74.
- Kraus, D.; Bütler, R.; Krumm, F.; Lachat, T.; Larrieu, L.; Mergner, U.; Paillet, Y.; Rydkvist, T.; Schuck, A.; Winter, S. Catalogue of Tree Microhabitats—Reference Field List; European Forest Institute—Regional Office EFICENT: Freiburg, Germany, 2016. [Google Scholar]
- Paillet, Y.; Coutadeur, P.; Vuidot, A.; Archaux, F.; Gosselin, F. Strong observer effect on tree microhabitats inventories: A case study in a French lowland forest. Ecol. Indic. 2015, 49, 14–23. [Google Scholar] [CrossRef]
- Shannon, C.E. A Mathematical Theory of Communication. Bell Syst. Tech. J. 1948, 27, 623–656. [Google Scholar] [CrossRef]
- Spellerberg, I.F.; Fedor, P.J. A tribute to Claude Shannon (1916–2001) and a plea for more rigorous use of species richness, species diversity and the ‘Shannon-Wiener’ Index: On species richness and diversity. Glob. Ecol. Biogeogr. 2003, 12, 177–179. [Google Scholar] [CrossRef]
- R Core Team. R: A Language and Environment for Statistical Computing; R Foundation for Statistical Computing: Vienna, Austria, 2016. [Google Scholar]
- Bolker, B.M.; Brooks, M.E.; Clark, C.J.; Geange, S.W.; Poulsen, J.R.; Stevens, M.H.H.; White, J.-S.S. Generalized linear mixed models: A practical guide for ecology and evolution. Trends Ecol. Evol. 2009, 24, 127–135. [Google Scholar] [CrossRef] [PubMed]
- Bates, D.; Mächler, M.; Bolker, B.; Walker, S. Fitting Linear Mixed-Effects Models Using lme4. J. Stat. Softw. 2015, 67, 1–48. [Google Scholar] [CrossRef]
- Bjornstad, O.N. ncf: Spatial Nonparametric Covariance Functions, R Package Version 1.1-7; Available online: https://CRAN.R-project.org/package=ncf (accessed on 12 October 2017).
- Hothorn, T.; Bretz, F.; Westfall, P. Simultaneous Inference in General Parametric Models. Biom. J. 2008, 50, 346–363. [Google Scholar] [CrossRef] [PubMed]
- Breheny, P.; Burchett, W. visreg: Visualization of Regression Models. 2016. Available online: https://cran.r-project.org/web/packages/visreg/visreg.pdf (accessed on 12 April 2017).
- Bayrische Staatsforsten. AöR Naturschutzkonzept der Bayrischen Staatsforsten; Bayrische Staatsforsten: Regensburg, Germany, 2009. [Google Scholar]
- Landesbetrieb Forst Baden-Württemberg. Alt- und Totholzkonzept Baden-Württemberg. 2010. Available online: http://www.naturschutz.landbw.de/servlet/is/67652/Alt-_und_Totholzkonzept.pdf?command=downloadContent&filename=Alt-_und_Totholzkonzept.pdf (accessed on 12 October 2017).
- Lutz, J.A.; Larson, A.J.; Freund, J.A.; Swanson, M.E.; Bible, K.J. The Importance of Large-Diameter Trees to Forest Structural Heterogeneity. PLoS ONE 2013, 8, e82784. [Google Scholar] [CrossRef] [PubMed]
- Lindenmayer, D.B.; Laurance, W.F. The ecology, distribution, conservation and management of large old trees: Ecology and management of large old trees. Biol. Rev. 2017, 92, 1434–1458. [Google Scholar] [CrossRef] [PubMed]
- Ministerium für Ernährung, Landwirtschaft, Forsten und Fischerei. Richtlinie zur Sicherung von Alt- und Totholzanteilen im Wirtschaftswald mit Erläuternder Einführung; Ministerium für Ernährung, Landwirtschaft, Forsten und Fischerei: Schwerin, Germany, 2002.
- Schmidt, O.; Czeschlik, D. Wood and Tree Fungi: Biology, Damage, Protection, and Use; Springer: Berlin, Germany, 2006; ISBN 978-3-540-32138-5. [Google Scholar]
- Lindenmayer, D.; Franklin, J.F. Conserving forest Biodiversity: A Comprehensive Multiscaled Approach; Island Press: Washington, DC, USA, 2002; ISBN 978-1-55963-934-7. [Google Scholar]
- Ranius, T.; Niklasson, M.; Berg, N. Development of tree hollows in pedunculate oak (Quercus robur). For. Ecol. Manag. 2009, 257, 303–310. [Google Scholar] [CrossRef]


| Forest Type 1 | Factors Influencing Amount of Microhabitats | Source | |||||||||||||
|---|---|---|---|---|---|---|---|---|---|---|---|---|---|---|---|
| Forest Management | Tree Age | dbh | Increasing Vitality 2 | Stem Density | Branchiness | Epicormic Branches | Height to Green Crown Basis | Elevation | Exposure | Basal Area | Site | Tree Species | Land Ownership | ||
| lowland and mountain | 0 | + | – | y | y | [18] | |||||||||
| mountain | + | – | y | [32] | |||||||||||
| lowland and mountain mixed forests | – | + | – | [30] | |||||||||||
| temperate | 0 | + | + | y | [21] | ||||||||||
| deciduous temperate | + | – | 0 | 0 | + | y | [29] | ||||||||
| beech-fir | + | – | y | [19] | |||||||||||
| beech-fir | 0 | + | y | [33] | |||||||||||
| beech-fir (montane) | – | + | y | [31] | |||||||||||
| beech | – | + | – | + | [28] | ||||||||||
| lowland-beech | – | + | [34] | ||||||||||||
| lowland beech | – | + | [17] | ||||||||||||
| lowland-beech oak coppice with standards | – | y | [35] | ||||||||||||
| oak | + | – | y | [36] | |||||||||||
| mediterranean-oak | – | + | – | – | y | [25] | |||||||||
| Douglas fir | – | + | 0 | – | – | [28] | |||||||||
| Douglas fir | + | [37] | |||||||||||||
| dbh | Canopy Class | Tree Species | Tree Species:dbh | Tree Species:canopy Class | Soil Type (RE) | AIC | |
|---|---|---|---|---|---|---|---|
| (a) | x | x | x | 289.2 | |||
| x | x | x | x | 295.6 | |||
| x | x | 305.5 | |||||
| x | x | 341.1 | |||||
| x | x | x | x | 342.5 | |||
| x | x | x | 342.8 | ||||
| x | x | 379.3 | |||||
| (b) | x | x | x | 1711.2 | |||
| x | x | x | x | 1714.6 | |||
| x | x | 1744.9 | |||||
| x | x | x | 1851.0 | ||||
| x | x | x | 1863.2 | ||||
| x | x | x | 1865.5 | ||||
| x | x | 1941.9 |
| Species | N | Number of Microhabitats [N/Tree] | Microhabitat Diversity [Shannonindex H’] | ||||
|---|---|---|---|---|---|---|---|
| Total | Mean | Max. | Mean | Max. | |||
| habitat trees | Abies alba | 197 | 1674 | 8.5 | 32 | 1.48 | 2.43 |
| Abies alba (dead) | 10 | 97 | 9.7 | 41 | 0.64 | 1.53 | |
| Acer pseudoplatanus | 37 | 254 | 7.0 | 15 | 1.45 | 2.03 | |
| Fagus sylvatica | 65 | 427 | 6.6 | 25 | 1.32 | 2.63 | |
| total (living) | 299 | 2355 | 7.9 | 32 | 1.44 | 2.63 | |
| crop trees | Abies alba | 208 | 675 | 3.3 | 12 | 0.93 | 2.08 |
| Acer pseudoplatanus | 1 | 2 | - | 2 | - | 0.69 | |
| Fagus sylvatica | 19 | 77 | 4.1 | 11 | 1.06 | 1.79 | |
| total | 228 | 754 | 3.3 | 12 | 0.94 | 2.08 | |
© 2018 by the authors. Licensee MDPI, Basel, Switzerland. This article is an open access article distributed under the terms and conditions of the Creative Commons Attribution (CC BY) license (http://creativecommons.org/licenses/by/4.0/).
Share and Cite
Großmann, J.; Schultze, J.; Bauhus, J.; Pyttel, P. Predictors of Microhabitat Frequency and Diversity in Mixed Mountain Forests in South-Western Germany. Forests 2018, 9, 104. https://doi.org/10.3390/f9030104
Großmann J, Schultze J, Bauhus J, Pyttel P. Predictors of Microhabitat Frequency and Diversity in Mixed Mountain Forests in South-Western Germany. Forests. 2018; 9(3):104. https://doi.org/10.3390/f9030104
Chicago/Turabian StyleGroßmann, Josef, Juliane Schultze, Jürgen Bauhus, and Patrick Pyttel. 2018. "Predictors of Microhabitat Frequency and Diversity in Mixed Mountain Forests in South-Western Germany" Forests 9, no. 3: 104. https://doi.org/10.3390/f9030104
APA StyleGroßmann, J., Schultze, J., Bauhus, J., & Pyttel, P. (2018). Predictors of Microhabitat Frequency and Diversity in Mixed Mountain Forests in South-Western Germany. Forests, 9(3), 104. https://doi.org/10.3390/f9030104