Article

Renewable Energy from Forest Residues—How Greenhouse Gas Emission Offsets Can Make Fossil Fuel Substitution More Attractive

1
Natural Resources Canada, Canadian Forest Service, Great Lakes Forestry Centre 1219 Queen Street East, Sault Ste. Marie, ON P6A 2E5, Canada
2
Natural Resources Canada, Canadian Forest Service, Climate Change Policy, 606-55 St. Clair Ave. East, Toronto, ON M4T 1M2, Canada
*
Author to whom correspondence should be addressed.
Forests 2018, 9(2), 79; https://doi.org/10.3390/f9020079
Submission received: 19 December 2017 / Revised: 23 January 2018 / Accepted: 7 February 2018 / Published: 8 February 2018
(This article belongs to the Section Forest Ecology and Management)

Abstract

:
Burning forest biomass from renewable sources has been suggested as a viable strategy to help offset greenhouse gas (GHG) emissions in the energy generation sector. Energy facilities can, in principle, be retrofitted to produce a portion of their energy from biomass. However, supply uncertainties affect costs, and are an important impediment to widespread and sustained adoption of this strategy. In this paper, we describe a general approach to assess the cost of offsetting GHG emissions at co-generation facilities by replacing two common fossil fuels, coal and natural gas, with forest harvest residue biomass for heat and electricity production. We apply the approach to a Canadian case study that identifies the price of GHG offsets that could make the use of forest residue biomass feedstock attractive. Biomass supply costs were based on a geographical assessment of industrial harvest operations in Canadian forests, biomass extraction and transportation costs, and included representation of basic ecological sustainability and technical accessibility constraints. Sensitivity analyses suggest that biomass extraction costs have the largest impact on the costs of GHG emission offsets, followed by fossil fuel prices. In the context of other evaluations of mitigation strategies in the energy generation sector, such as afforestation or industrial carbon capture, this analysis suggests that the substitution of fossil fuels by forest residue biomass could be a viable and reasonably substantive short-term alternative under appropriate GHG emission pricing schemes.

1. Introduction

The use of renewable forest biomass at energy generation facilities has been suggested as a viable strategy to incorporate biomass into existing energy generation cycles [1,2,3,4,5,6,7]. It could also be an economically appealing method of reducing greenhouse gas (GHG) emissions from the energy generation sector [7,8,9,10,11,12]. Currently, wood-fired electricity occupies a marginal share of the global energy market [12,13,14,15,16]. Cost and supply uncertainties related to the supply of biomass appear to be major impediments to wider sustained adoption [14,15].
The uncertainties pertaining to forest biomass use in the energy sector are not unique to a single country or region, it is a global phenomenon. Multiple governments and organizations have identified significant barriers to achieving their bioenergy generation targets. For example, while the European Union (EU) has recognized forest biomass as a favorable fuel source for achieving emission reduction goals, any combustion that does occur is typically driven by a combination of government policies, incentives, and subsidies [12]. A reliance on subsidies requires ongoing political support [2]. EU member countries such as Germany and Portugal have noted cost-related impediments to forest biomass use [2,17].
Comparable issues also plague North American initiatives for bioenergy generation from forest biomass. Government incentive programs for biomass use exist in the United States, however, identified barriers to further forest biomass use include a lack of infrastructure, limited markets [18], accessibility concerns, and competitiveness with fossil fuels [1]. In Canada, despite vast forest resources, biomass-based feedstock represented only 2% of the nation’s energy generating capacity in 2012 [16]. Regulatory issues [19], large transportation distances, and low fossil fuel prices are some of the factors inhibiting wider scale use of forest biomass for energy in Canada.
Economic attractiveness of forest biomass could be improved if other benefits are valued. For example, additional utility can be extracted from the capacity of forest biomass to offset GHG emissions when used to replace fossil fuel combustion for energy generation [20,21,22,23]. The combustion of residues can potentially achieve GHG emissions neutrality in a very short period [24,25]. A number of studies have demonstrated the use of various types of residual biomass for heat and electricity production [14,26,27,28] and have found that residue biomass is only economically viable without government support when the avoided GHG emissions are given a market value. Indeed, various pricing mechanisms that set up markets for GHG emissions offsets for biomass-based projects are already in operation [29,30]. One common approach to assess the feasibility of biomass-based projects is to estimate the amount of GHG emissions that may be offset by fossil fuel substitution when emissions are given a market price. Knowledge of the GHG emissions offset price that makes biomass substitution projects feasible provides important insights about the potential role GHG offset markets play in promoting the use of renewable energy.
In this paper, we describe a methodology of assessing the price of GHG emission offsets at Canadian co-generation facilities that would make the replacement of coal and natural gas with forest residue biomass economically attractive. We generate residue biomass supply curves that illustrate how changes in GHG emissions offset prices would influence the quantity of biomass used by co-generation facilities, and hence the supply of GHG emission offsets created via fuel substitution.
We begin by applying a geographic model that estimates the volume of post-harvest forest residue biomass available from industrial forest management using established biomass accumulation models [31]. Next, we estimate the costs of supplying residue biomass to co-generation facilities across Canada and assess the price these facilities would have to be willing to pay for biomass fuel, based on thermal energy conversions with coal and natural gas. Finally, we estimate the amount of GHG emission offsets supplied via fuel substitution. This is derived as a function of assumed alternative market prices for GHG emission offsets. While the case study is specific to Canada, our approach is generic for jurisdictions interested in better understanding the potential of forest biomass to both provide energy and help sequester atmospheric carbon in an allocatively efficient manner.

2. Methods

In Canada, vast forest resources (covering 397 million ha [32]) and significant volumes of harvested wood (e.g., 146.7 M m3 in 2011 [33]) suggest residue biomass could be an abundant source of fuel for near- and medium-term bioenergy projects. Substituting a portion of fossil fuels burned at established energy generation facilities with forest residues is logistically straightforward, and in some cases, better at offsetting GHG emissions than other methods like industrial carbon capture or afforestation [34,35,36]. Harvest operations typically remove only the commercially viable (merchantable) portion of wood from harvest sites. The remaining biomass is left to decay on the harvest or landing site and may be burned to reduce the risk of forest fires (up to 55% of the total amount [21]).
Co-generation facilities (combined heat and power producing facilities) in Canada typically combust large quantities of coal and natural gas for heat and electricity production. These facilities employ well-established combustion technologies which provide opportunities for the partial substitution of fossil fuels by forest residue biomass, assuming residues could be used by co-generation facilities at a reasonable cost, with few capital upgrades required. Conceptually, GHG emissions that are offset from the partial substitution of fossil fuels with residue biomass can be estimated as the difference between the emissions from fossil fuel in current conditions and the emissions in the substitution scenario that use an equivalent amount (in net energy units) of renewable fuel.
The analysis begins by estimating the broad-scale geographic distribution of forest residual biomass and the amounts that are available from Canadian forests. Our analysis is restricted to areas of industrial forest management where biological productivity is sufficient to produce commercial grade merchantable timber within viable distances to mills (as depicted in [37]). The residue assessment methodology is described in Supplementary S1 (further details can be found in [38]). Results provide annual amounts and delivery costs of post-harvest residues that could be supplied to 89 co-generation facilities in Canada that currently use fossil fuels. The total amount of post-harvest residues available for extraction is limited by the extent of harvest operations in Canadian forests.
We assumed that the removal of residues from the harvest site would occur within the year, thus avoiding residue decay. We do not quantify the impact of the temporal delays in CO2 emissions from decaying forest residues left on a forest site versus the CO2 emissions that occur immediately if residues are instead supplied to a co-generation facility for fuel substitution. As a result, our cost assessment does not consider the temporal profiles of GHG emissions or periods of carbon debt repayment (such as presented in [39] and [25]), which can be quite short in the case of forest residues substituting for fossil fuels [20,21]. While a gradual decay of forest residues over several years does translate into delayed CO2 emissions, our focus here is the development of indicative national cost curves. It is beyond the scope of this analysis to establish assumptions for the rates of organic residue decay on post-harvest landing sites across the country. A common practice of burning piles of non-merchantable wood and residues left on a landing site to reduce the risk of forest fires [21] complicates the problem of establishing the GHG emissions over time associated with residues remaining at landing sites across the country.
The evaluation of GHG emissions from the fossil fuel substitution considered here only examines the emissions offset from avoided fossil fuel combustion [22]. We do not consider the differences in GHG emissions associated with the extraction and transportation of forest residues or the emissions stemming from the extraction and transportation of fossil fuels to co-generation facilities. Examining this issue is outside the scope of this analysis, as it would require a detailed life cycle assessment (LCA) of the long-term GHG emissions of coal mining and natural gas extraction.
Before determining total supply costs, we compared the total annual amount of forest residues available with the amount of fossil fuel required for energy and heat production in co-generation facilities throughout Canada. The comparison suggests the capacities of the existing facilities are sufficient to process the residues produced on an annual basis. Indeed, National Energy Board coal and natural gas demand data [40,41] and recent estimates of residue feedstock [38] suggest that postharvest residue biomass would only account for 4% to 6% of the total energy supplied by coal and natural gas. We assumed that the biomass substitution would follow the least-cost path and be applied only when costly replacements or retrofits of combustion facilities are not required.
We assumed the substitution of fossil fuel by biomass would occur under business-as-usual conditions and that energy generating facilities would be willing to purchase any energy fuel at the facility gate, as long as the cost per thermal energy unit was no greater than the unit cost of the current fuel being used. The price paid at the gate is assumed to include all costs associated with transportation and any pre-processing required for each fuel type. We converted the costs of delivered residue biomass to a thermal energy unit equivalent (i.e., costs per of gigajoule (GJ) based on the lower heating value and assuming energy extraction via combustion), enabling a comparison of the costs of biomass supply with the equivalent costs of fossil fuels.
The price of coal delivered to energy generation facilities varies significantly based on coal type. In this analysis, we have assumed bituminous coal, and a delivered price of $51.34 tonne−1 [42,43]. The thermal energy content of bituminous coal ranges between 26 and 34 GJ t−1 [44,45], with an average value 26.12 GJ t−1 resulting in a unit cost of $1.97 GJ−1 before factoring in the efficiency of the co-generation facility. The price of natural gas delivered to co-generation facilities is approximately $0.17 m−3 [43,46], and has a heating value of 0.037 GJ m−3 [47]. Given these price and thermal conversion estimates, energy from natural gas costs approximately $4.42 GJ−1 prior to factoring in the efficiency of co-generation plants.
For coal substitution, we assumed the combustion of coal carbon to CO2 to be stoichiometrically similar to the combustion of biomass carbon to CO2. Burning the same calorific content of natural gas releases 57% less GHG emissions than burning coal or biomass [48,49,50], hence we applied the 0.57 stoichiometric coefficient when estimating the corresponding amount of GHG offsets from substituting natural gas with residue biomass. We assumed co-generation efficiency ranges based on literature reports for large biomass and fossil fuel powered co-generation facilities. Facilities co-firing coal and biomass can achieve efficiencies as high as 83% [51], and facilities co-firing natural gas and biomass achieve levels as high as 88% [52,53]. Conversion efficiency was factored into the calculation of calorific content of natural gas and biomass combustion. Biomass extraction costs include chipping, and we assume the delivery of biomass to co-generation facilities to occur directly from forest sites, with a moisture content of 50%, typical for biomass in field conditions. This level of moisture corresponds to a lower heating value (LHV) of 9.21 GJ ODT−1 (oven dry tonne) [51,54]. We then calculated the cost curves that depict the costs of annual GHG emission offsets as a function of the total amount of biomass used to substitute the equivalent net calorific amount of fossil fuel. The curves show how offsets become increasingly costly as the offset volume increases.

2.1. Case Study Scenarios

We estimate the supply of GHG emission offsets for eight different scenarios (Table 1). The scenarios vary based on fossil fuel type, harvest level, and residue extraction constraints [55]. Scenarios 1 through 4 assume the substitution of coal, while scenarios 5 through 8 assume the substitution of natural gas. Within these two main groups, the other factors are varied in a symmetric manner (Table 1).
Harvest scenarios are varied to account for near-term adjustments in harvest activities and corresponding changes in the availability of forest residues. The first scenario is set at the 2010 harvest level, when a particularly low volume of timber was extracted from the forest, and the second corresponds to a 20-year average harvest volume, which is approximately 25% greater than the harvest levels in 2010. Since the extraction of forest residues is a localized operation, with the costs mostly dependent on local site conditions and transportation distances, we assumed that a higher nationwide harvest projection would not affect per unit cost of residue extraction.
Residue extraction constraints are based on Canadian provincial natural resource ministry guidelines that regulate the extraction of forest residues [56] to protect forest ecosystems [57] and preserve nutrient balance in forest soils [58]. The guidelines restrict the amount of biomass removed from the harvest site to retain a portion of the organic matter produced on site for natural decay [59] and prescribe that the portion of harvest residues that must remain on site should be equivalent to the amount of residual biomass typically present in forest under normal growth conditions [57]. To estimate the amount of residual biomass which should be retained at a harvested site under the ecological constraint, we performed two parallel assessments of residue biomass amounts. First, we estimated the amount of dead organic matter in the forests under normal growing conditions. Then, we calculated the quantity of residues after clear-cut harvest. For each forest site, the amount of residue available without harvest was subtracted from the amount of residue estimated in the harvest scenario to determine the amount of residues that could be extracted for energy. Notably, this important accounting step has been omitted in some analyses of residue supply for bioenergy (e.g., [22,60]).
An additional constraint accounts for technical limitations of residue extraction [55,58,61,62]. These technical constraints limit the quantity of residue available for extraction and increase supply costs. We assumed that the total amount of harvest residues that could be technically extracted from a harvest site is 30% of the pre-harvest merchantable portion of the stand, on top of the residue extraction limitations imposed by the ecological constraint. The 30% estimate was based on averaging the operational recovery rates reported in the literature (Table S2).

2.2. Sensitivity Analysis

We explored the sensitivity of the supply of GHG emission offsets at different price levels to changes in key economic and technical assumptions, including adjustments to the price of fossil fuel, the moisture content of delivered forest residues, and biomass extraction costs. We then calculated elasticity values that describe the percentage change in the amount of GHG emission offsets at a given offset price point in response to the change in the parameter value of interest, i.e.,
E = | ( μ μ 0 ) / μ 0 |   /   | ( ξ ξ 0 ) / ξ 0 |
where μ0 and μ are the original and altered model output values (the amounts of GHG emission offsets at a given price threshold) and ξ0 and ξ are the original and altered model parameter values.
As noted, we calculated the sensitivity analyses for five changes in three important model parameters. First, we adjusted fossil fuel prices by ±35% to reflect the variability associated with fossil fuel prices, and to account for possible future scenarios in which the GHG emissions associated with fossil fuels are valued (e.g., a carbon tax). The moisture content of residue biomass was decreased by 35%, assuming improved biomass extraction technologies. The assumed field moisture content of 50%, reduced by 35%, resulted in a new moisture content of 33% that corresponded to a calorific value of 12.6 GJ ODT−1 [54]. Finally, extraction costs were also varied by ±35%. Variation in these costs may be driven by changes in fiber demand, natural disturbance, fossil fuel prices, expanded transportation distances, and potential taxes on GHG emissions. Since all parameters were altered by the same percentage value, the elasticity values can be compared and the most influential parameters identified at different offset price levels. We estimated elasticity values at GHG offset price thresholds of $20, $30, $40, and $50 t−1 CO2e. These prices reflect a broad price range for possible future GHG emission offset credits. Current estimates for GHG emissions prices start from $15 t−1 CO2e [27,63], with an upper price limit of GHG emissions estimated around $50 t−1 CO2e [63].

3. Results

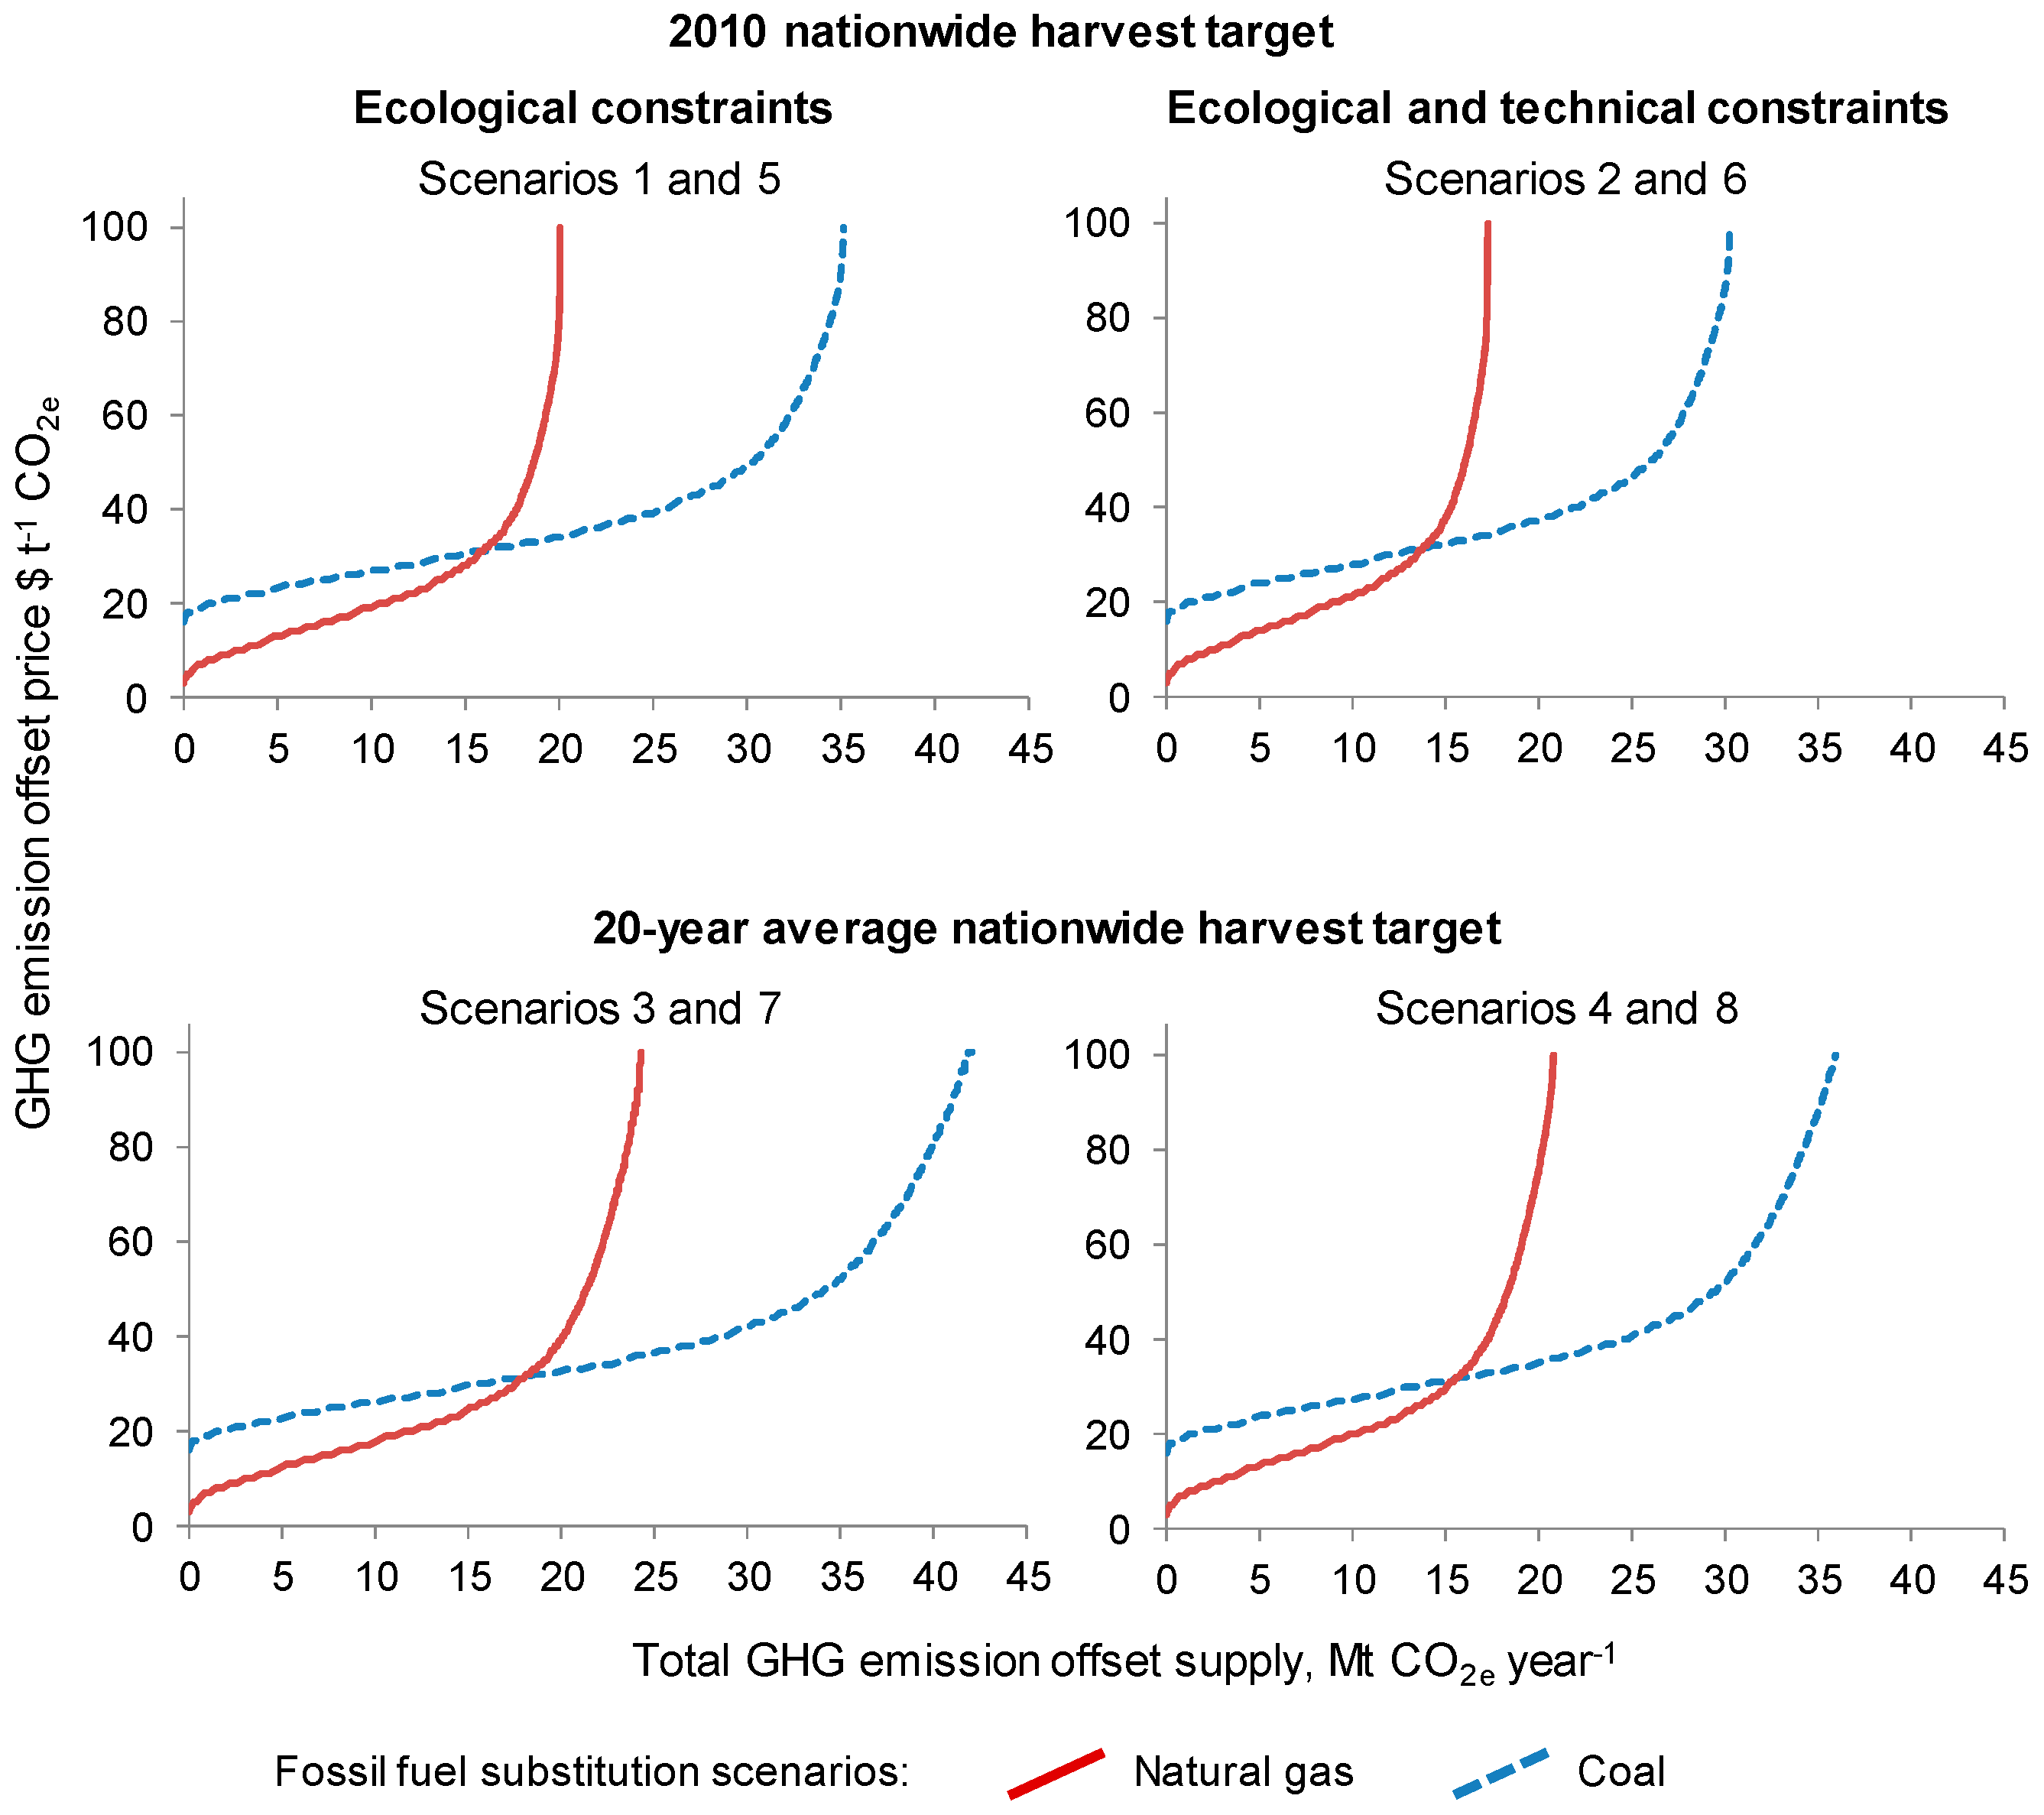
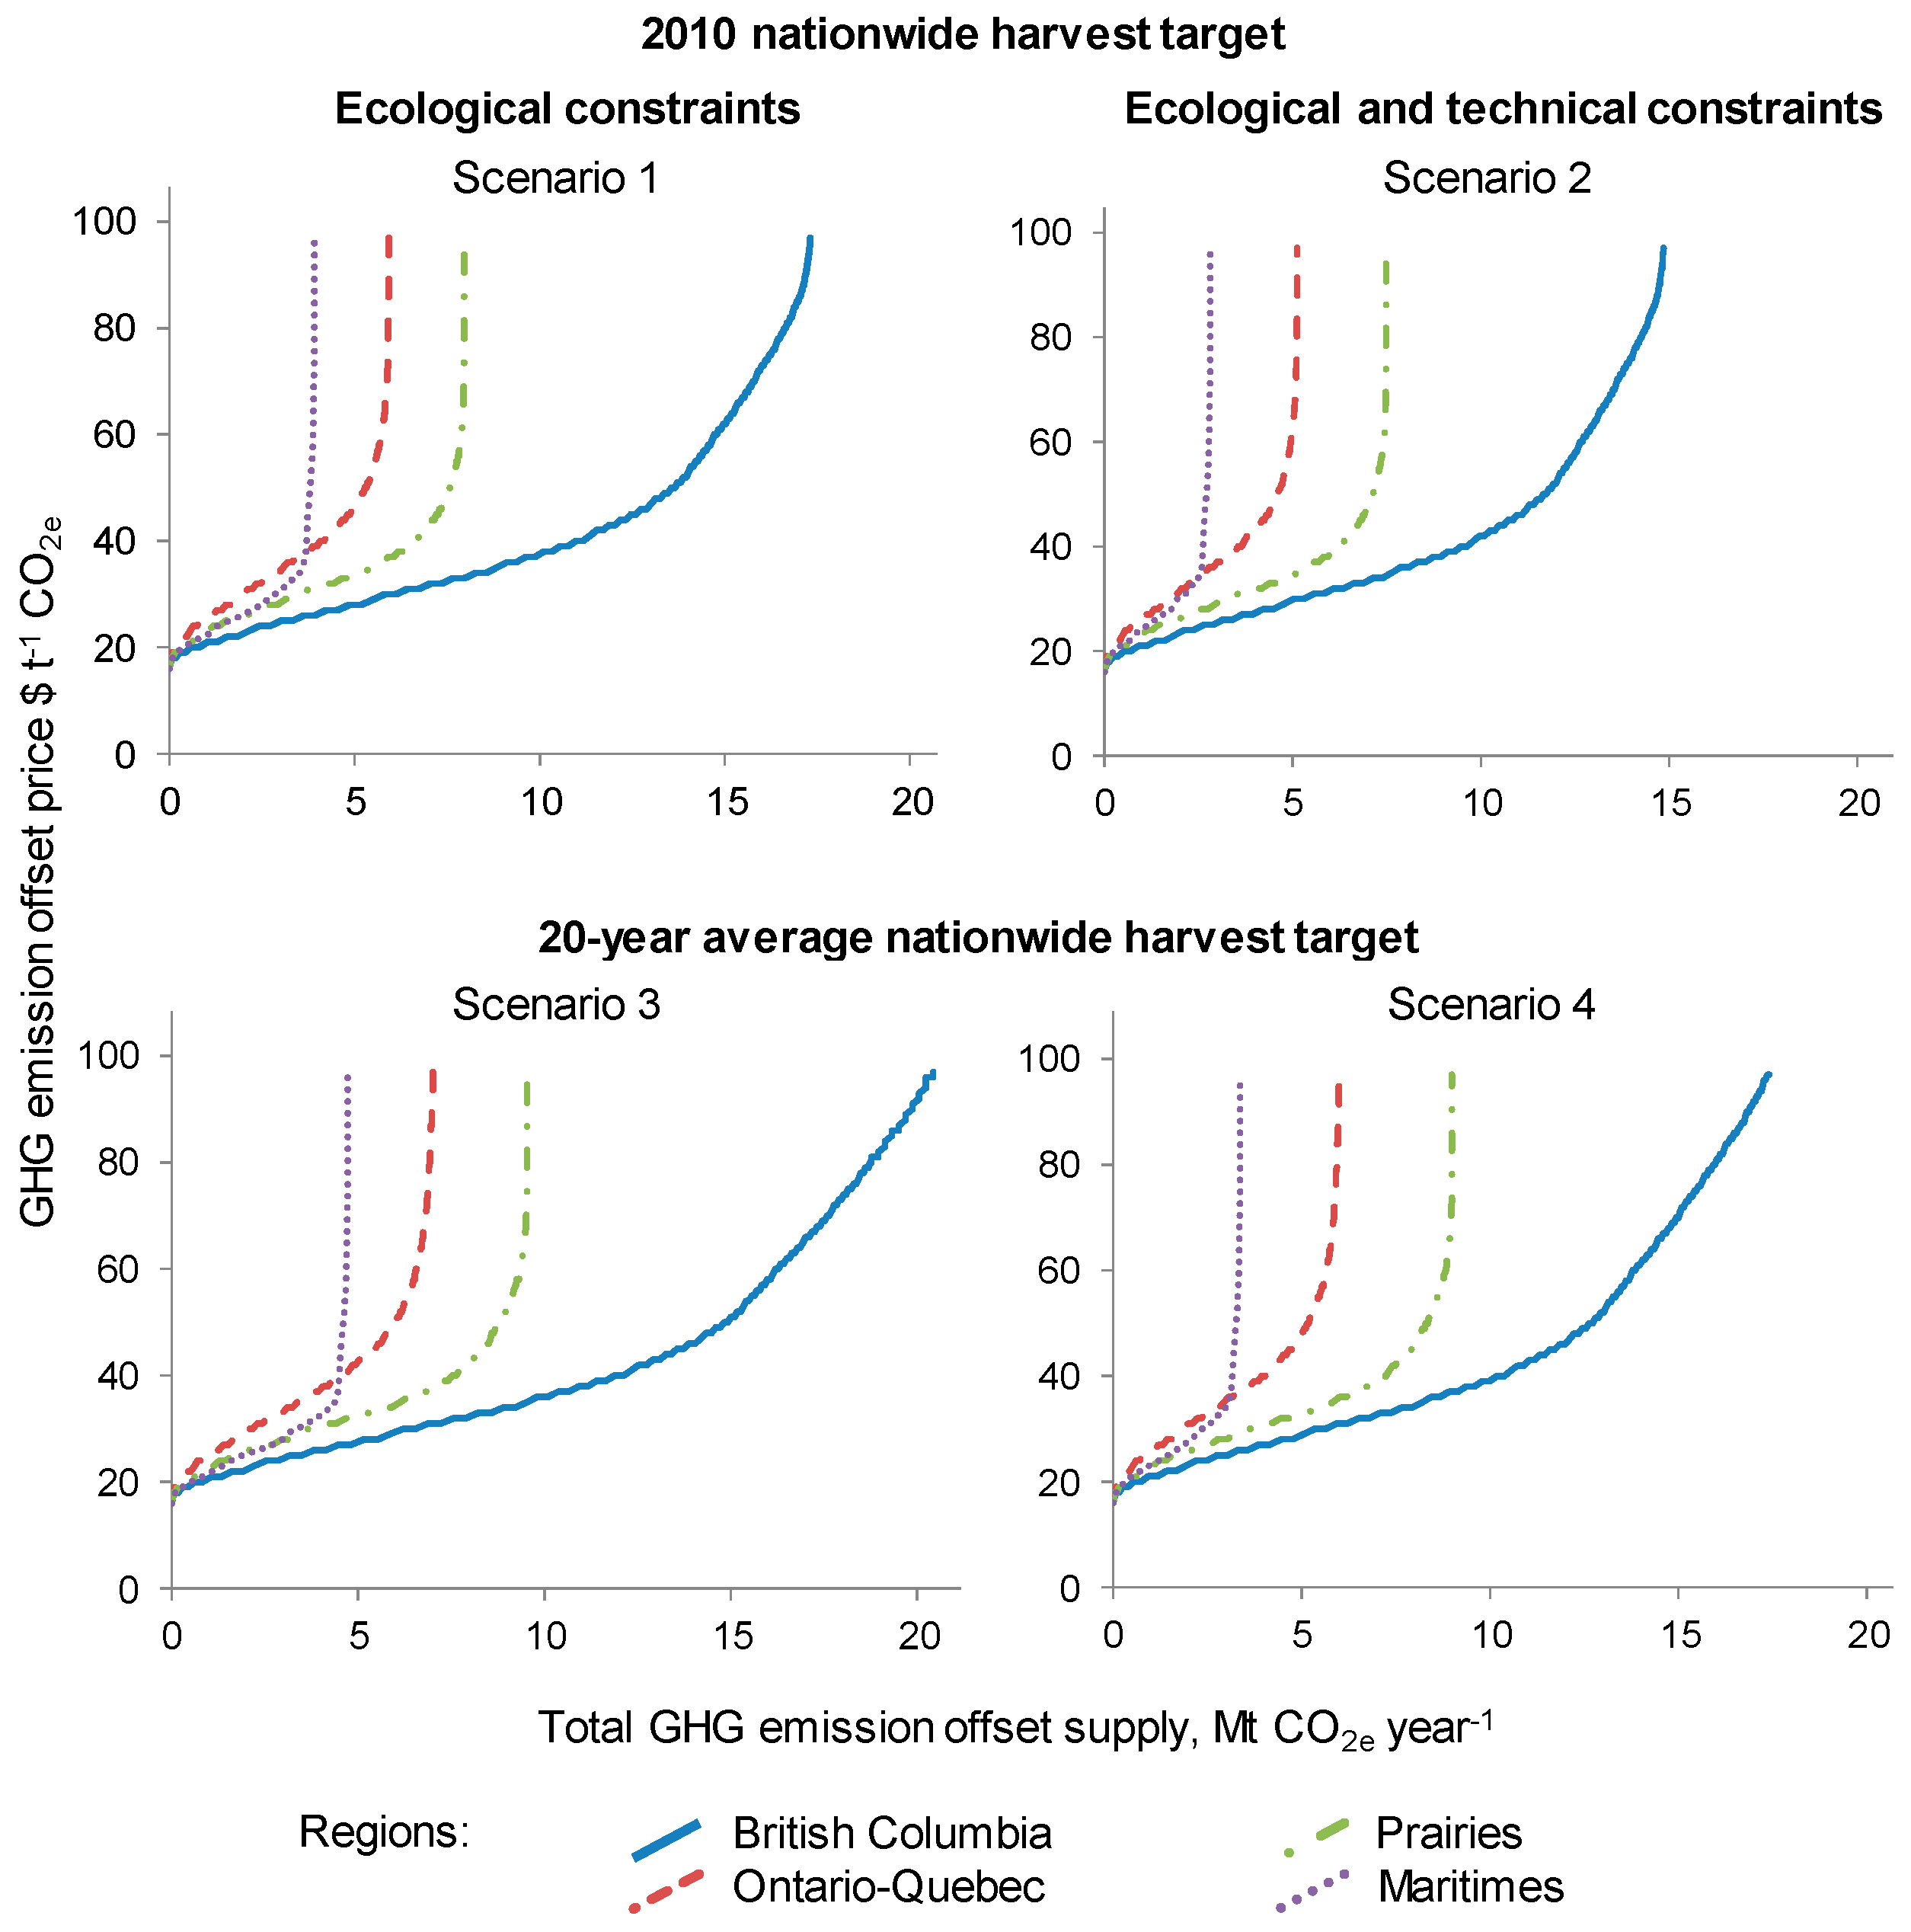
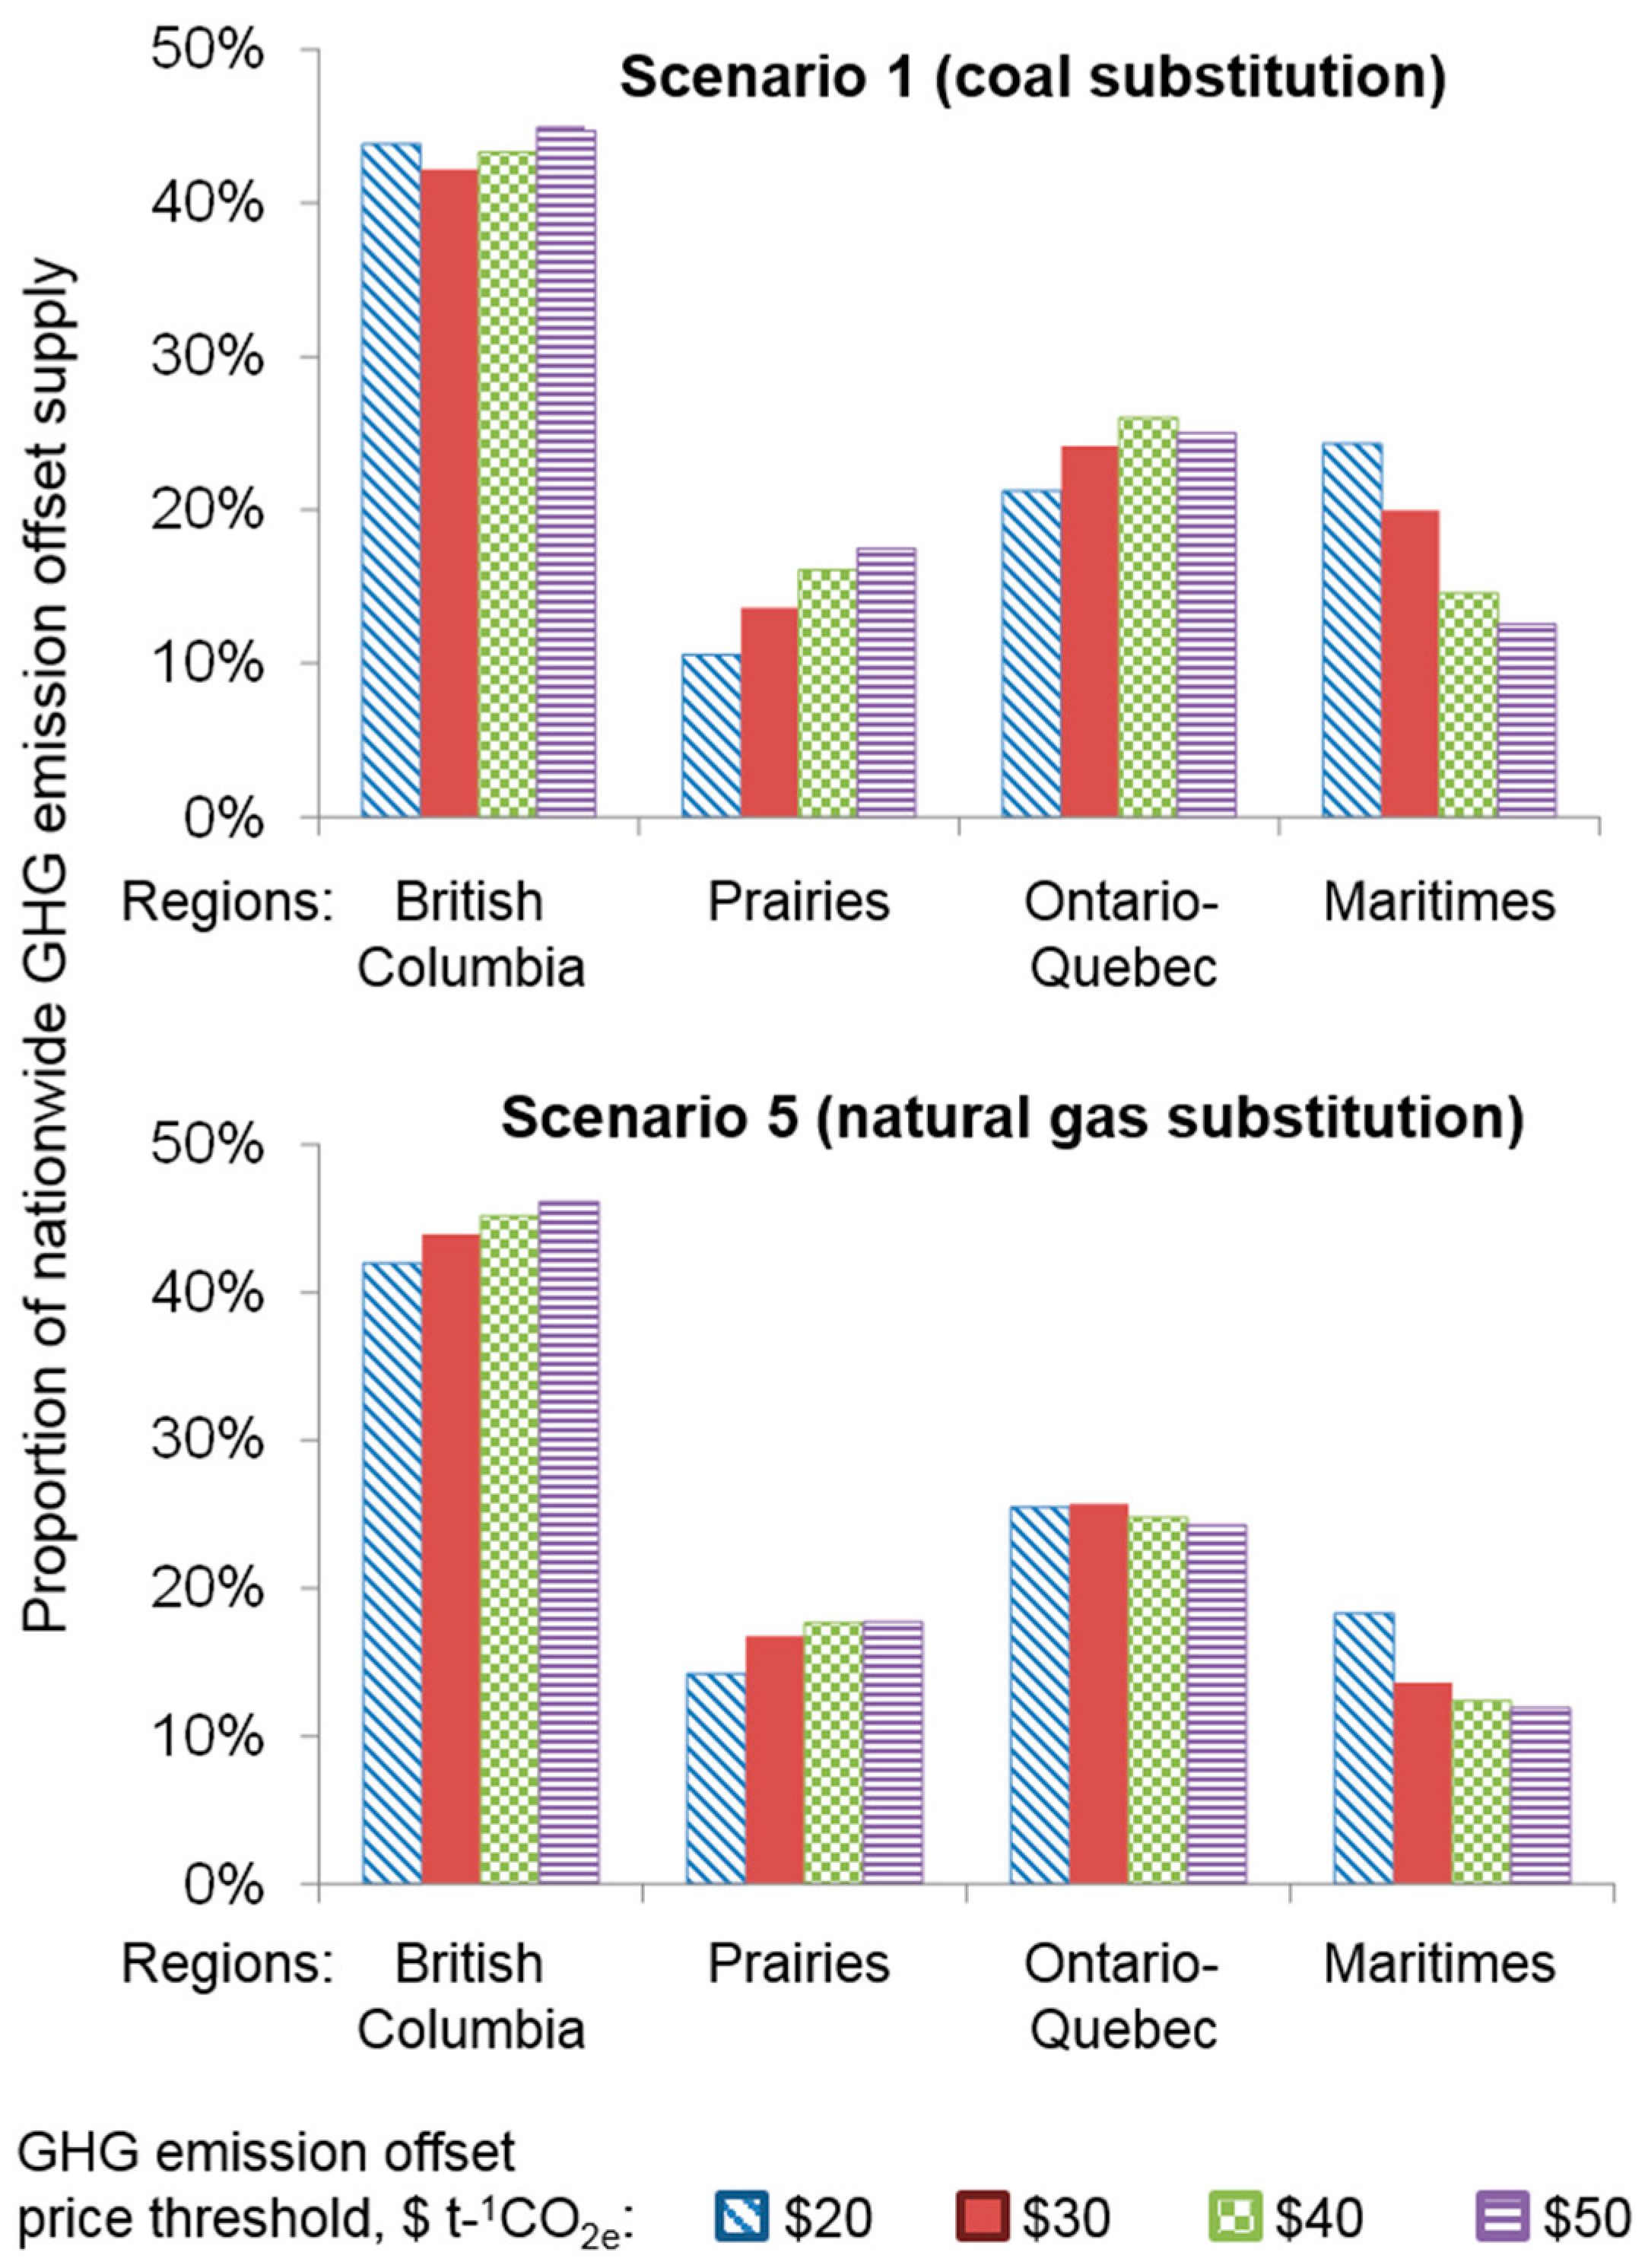
3.1. Quantity and Cost Estimates of GHG Offsets for Biomass Substitution Scenarios

The potential annual nationwide supply of GHG emission offsets, assuming the substitution of coal at co-generation facilities by forest residues, was estimated to be between 30.3 and 42.8 Mt CO2e·year−1 (Table 2). The natural gas substitution scenarios revealed lower amounts of GHG offsets as a result of the lower emissions levels associated with this fuel. Between 17.3 and 24.4 Mt CO2e·year−1 could be offset through the substitution of natural gas with forest residues. Nationwide GHG emission offset supply curves that depict the total amount of carbon emission offsets at different price levels are shown in Figure 1 for all scenarios.
Regional supply curves for broad geographical regions in Canada (British Columbia, the Prairie provinces, Ontario-Quebec, and the Maritime provinces) for coal substitution scenarios 1–4 are shown in Figure 2. In all scenarios, the nationwide supply curves for offsetting coal and natural gas cross each other, indicating a noticeable cost trade-off between the fuel sources (Figure 1). At lower supply amounts, below the range of 10.2–11.7 Mt CO2e·year-1 in the scenarios with ecological and technical constraints, the substitution of natural gas by forest residues is a more cost-effective strategy than the substitution of coal. At higher GHG emission offset supply levels, coal substitution scenarios become more financially attractive.
Estimates of the GHG emission offset potential follows residue biomass supply potential (Figure 2). Between 49.2% and 50.3% of the national GHG offset supply would be located in British Columbia, 22.3–24.7% in the Ontario-Quebec region, 16.4–16.9% in the Prairie provinces and between 9.2% and 11.1% in the Maritime provinces. Differences in the potential supply of GHG emission offsets in each region are reflected in the shapes of the regional offset supply curves (Figure 2). In the Maritime region, a relatively small area of managed forests and allocated harvest volumes limits the residual biomass supply, resulting in a relatively steep offset curve. British Columbia has the highest harvest levels and hence supply of forest residue and GHG emission offsets. The supply curve for British Columbia is initially relatively flat, suggesting low costs and high offset quantity potentials. The relatively flat portion of the supply curve is a result of the large supply of residual biomass being relatively easily available on post-harvest sites. The steeper portion of the curve is due to increasing transportation costs, as suppliers must go farther afield to collect forest residues. The remaining curves in Figure 2 suggest that the Ontario-Quebec region and the Prairie provinces are somewhere between the British Columbia and Maritime estimates. These regions are characterized by large areas of industrial forest management, but with smaller residue supply pools than British Columbia.
Under the assumption of possible GHG offset price levels, we have estimated the amount of GHG emission offset at four carbon price thresholds between $20 t−1 CO2e and $50 t−1 CO2e (Table 2). In scenarios 1 through 4 (coal substitution), at $20 t−1 CO2e, a very small offset capacity is available nationwide under the baseline assumptions (1.1–1.3 Mt CO2e·year−1 in scenarios based on the 2010 harvest level and 1.2–1.5 Mt CO2e·year−1 in the scenarios using the 20-year average harvest level). The amounts of GHG emission offsets available under the natural gas substitution scenarios are considerably higher: 8.9–10.4 Mt CO2e·year−1 in scenarios based on the 2010 harvest target and 9.8–11.6 Mt CO2e·year−1 in the scenarios using the 20-year average harvest level. Major increases in the amount of GHG emission offsets occur between $20 and $40 t−1 CO2e. The differences between the coal and natural gas substitution scenarios are attributed to differences in fossil fuel prices and the fact that substituting residues for natural gas has less of an emission reduction effect than it does for coal. Natural gas is more expensive than coal, and as a result the substitution by biomass yields larger amounts of GHG emission offsets at the same residue supply price point.
Figure 3 presents the proportional allocations of GHG emission offsets for these price thresholds among the four regions examined. The figure depicts the baseline scenarios 1 and 5 for coal and natural gas substitution; other scenarios revealed similar patterns and are not presented. The geographic allocation of GHG emission offsets depends on the offset price (Figure 3). In coal substitution scenarios, an increase in the offset price from $20 to $50 t−1 CO2e would lead to an increase in the share of the national offset supplied by Ontario-Quebec and the Prairie regions, but a sharp decrease in the relative share from the Maritime provinces (Figure 3). The share from British Columbia is not greatly affected by price increases.
In natural gas substitution scenarios, an increase in the offset price would cause less noticeable changes in regional supply shares. British Columbia and the Prairies show moderate increases, the Maritime region shows a noticeable decline in supply and the Ontario-Quebec region is relatively stable. The shift in the supply from the Maritimes to regions in western Canada at higher carbon prices also indicates the important role of transportation costs (which typically increase in regions with very large areas of managed forests where harvest could occur in remote places with more difficult and costly access).

3.2. Sensitivity Analysis

The results of the sensitivity analysis indicate that changing the price of fossil fuel shifts the GHG offset supply up or down, depending on the direction of change (Table 2). Higher fossil fuel prices reduce the cost of GHG emission offsets and increase the amount of carbon offsets available at a given price point until the residual biomass supply limit is reached. Modifications in biomass extraction technology, which could decrease the moisture content of delivered forest residues and increase the biomass calorific value, could potentially decrease the price of GHG emission offsets. The impact of reducing biomass moisture content was similar to that caused by an increase in fossil fuel price; the offset cost curves in Figure 1 would shift down along the Y axis, reducing costs and increasing supplied quantity. Increasing the residue extraction cost decreases the amount of residue biomass available and subsequently increases the cost of GHG emission offsets and decreases the supply of offset CO2e.
Our scenarios show the sensitivity of the GHG emission offset supply to our assumptions about nationwide harvest levels. Increasing nationwide harvest volumes by 25% from 2010 levels to a 20-year average level increases the total GHG offset amounts by 21.6% and 21.0%, respectively, in the scenarios with ecological and technical constraints (Table 2). This yielded absolute elasticity values of 0.86 and 0.84 (which defines the ratio between the relative change of the output metric and the change in the parameter of interest).
In the coal substitution scenarios, variations in residue extraction costs have the greatest impact on the quantity of GHG offsets (Table 3). At a low price point of $20 t−1 CO2e, reducing extraction costs resulted in extreme elasticity values around 27, indicating the existence of carbon offset supply thresholds in that price range. A decrease in the biomass moisture content and a 35% increase in the coal price were also influential on GHG emission offset supplies. The elasticity values for these two parameters are several times larger than the elasticity values for other parameters (a 35% decrease in coal price, and a 35% increase in extraction costs) and approach a range of 10.4–10.5. Changes in extraction costs have the most influence on the model outcome, especially at higher GHG offset prices (Table 3). However, absolute elasticity values decrease drastically when carbon offset prices exceeded $40 t−1 CO2e. For example, at the offset price $50 t−1 CO2e the elasticity values for all model parameters stay within a 0.1–0.48 range.
Elasticity values in the natural gas substitution scenarios were substantially lower. At a price point of $20 t−1 CO2e, the extraction cost parameter was again the most influential, with elasticity values between 1.38 and 2.12. The elasticities for other parameters varied between 1.28 and 1.9. Notably, natural gas substitution scenarios display no extreme elasticity values above 3.0 at any offset price point. This indicates a more gradual response of the availability of GHG offsets from natural gas substitution to changes in model parameters. Similar to coal substitution scenarios, the relative impact of changing the parameter values on the amounts of GHG offsets decreases as the price of GHG offsets increases. At the offset price $50 t−1 CO2e, elasticity values varied between 0.08 and 0.17. Overall, the elasticity values in coal substitution scenarios were 3.7 times higher on average in comparison with the natural gas substitution scenarios (Table 3). Table 3 also indicates that changes in nationwide harvest rates (which define the total amount of forest residues available for extraction) do not have a large impact on elasticity values at offset prices $50 t−1 CO2e and below. This is not surprising, as harvest rates influence the total amount of residues that could be extracted from a forested region at any price (including very high prices) but do not have a large impact on the availability of residues at low offset price points (which cover only a small fraction of the total GHG offset supply).

4. Discussion

Forestry activities provide significant amounts of residue biomass that could potentially be used for renewable energy purposes, offsetting the use of fossil fuels. The use of biomass also serves as the economic base for rural and forestry-based communities, in addition to other forestry-related activities [64]. It appears that the use of biomass feedstocks for energy purposes under the current economic circumstances may be unprofitable unless subsidies or other co-benefits from biomass use are valued. Subsidy policies, however, are subject to numerous political and economic considerations and do not always provide long-term support for biomass projects. In an ideal world with fully functioning carbon markets, GHG emissions offsets would be a practical pricing mechanism to promote the use of biomass in the energy sector. In this study, we estimated the price point of carbon offsets that would make biomass substitution for fossil fuels attractive for co-generation facilities. Our GHG supply curves also provide an indication of the size of carbon markets and carbon offset prices that need to be achieved to make the substitution of fossil fuels by forest residues economically attractive. The methodology is data-driven and can be applied to other geographical regions as long as current costs of fossil fuel supply and data on biomass delivery costs and feedstock capacity are available.
Our calculations of available GHG offset quantities and prices from fossil fuel substitution by residue biomass for bioenergy purposes generally agree with other estimates [14] and are comparable to the costs of other carbon offset options, such as carbon sequestration through forest conservation, tree planting, and agroforestry activities [65,66]. Note that our estimates of the amounts of GHG offsets from forest residues are conservative when compared with the literature due to the substitution-specific scope of this analysis. In general, despite recent decreases, fossil fuel prices are expected to rise in the future; the use of coal for heat and electricity production in Canada may decline in the long run as efforts to reduce coal-fired electricity generation increase and the use of natural gas in power generation is expected to increase [16]. Since the supply of GHG offsets was estimated from the difference between the delivered prices of fossil fuels and residue biomass, the trade-offs between the costs of residues and the current (and future) coal and natural gas prices define the future GHG emission offset capacities created from substitution of fossil fuels by residue biomass. When fossil fuel prices decrease, the net cost of offsetting GHG emissions increases (as biomass, in relative price difference terms, becomes less valuable). This shifts the GHG emission offset supply curve upwards.
We did not consider the impact of heat and electricity demand on the cost of biomass residuals and fuel price. Proper accounting of this effect would require developing a stand-alone pricing model that considers both demand and multiple suppliers of electricity connected to local grids. This aspect was considered beyond the scope this study. We also did not consider a replacement cost of existing conversion facilities with newer technologies. It is possible that state-of-the-art biomass combustion technologies could help reduce the cost of biomass-to-heat conversion, however, the uncertainties related to the actual costs of the new technology adoption and fossil fuel price fluctuations make such an assessment problematic at this time.
Residue biomass substitution projects may be viable alternatives to industrial CO2e offset options because they do not need as large up-front investments and are characterized by relatively simple accounting. Compared to afforestation or avoided deforestation carbon offsetting options, the substitution of fossil fuel combustion by harvest residues does not require an expensive and complex accounting process to address the non-permanence of carbon sinks [34,67].
Our results also indicate that the future state of the Canadian forest sector will be an important factor when determining the amount of GHG emission offsets available from residue use. Nationwide harvest levels, however, appear to have little impact on the quantity of GHG emission offsets supplied by co-generation facilities at attractive offset price points below $40t−1 CO2e. This implies that the price co-generation facilities will be willing to pay for carbon emissions offsetting biomass feedstock will largely depend on the state of energy markets and future fossil fuel prices.
The costs of extracting biomass and changes in fossil fuel prices appear to be the most important factors that determine the cost of GHG emission offsets in fossil fuel substitution projects. The attractiveness of residue biomass feedstock may be restricted by the high costs of residue supply. Joint projects that employ integrated forest harvesting systems for both timber and forest residue extraction could result in lower costs [68,69] and could potentially reduce the residue extraction costs by as much as 35% [70]. This cost reduction could significantly reduce the costs of GHG offsets in fossil fuel substitution projects and increase the amount of GHG emission offsets available at low price points ($30 t−1 CO2e and below).

5. Conclusions

Our results suggest that under certain GHG emission offset price schemes, forest residue biomass could become a viable short-term alternative under appropriate GHG emission pricing schemes. Compared to other industrial carbon offsetting options, substitution of fossil fuel combustion by forest residues would not necessarily require an expensive and complex accounting process to address the non-permanence of carbon sinks. Future efforts focused on assessing the practical use of forest residues at coal and natural gas co-generation facilities and testing practical carbon offset protocols (such as proposed by [71]) are required to better understand the economic attractiveness of harvest residue feedstock for generating renewable energy.

Supplementary Materials

The following are available online at https://www.mdpi.com/1999-4907/9/2/79/s1, Supplementary S1: Estimating the broad-scale geographic distribution of forest residue biomass and the biomass amounts potentially available for a fossil fuel substitution, Supplementary S2 (Table S2): Common recovery rates of residue biomass on harvest sites.

Acknowledgments

The participation of Denys Yemshanov, Daniel W. McKenney and Emily Hope was funded by Natural Resources Canada OERD Eco-EII Initiative project BIOI-020 “Mapping, cost assessment and comparison of residual forest biomass feedstocks in Canada”.

Author Contributions

D.Y. and D.W.M. conceived and designed the experiments; D.Y. and E.H. performed the experiments; D.Y. and T.L. analyzed the data and helped edit the manuscript; D.Y., D.W.M., and E.H. wrote the paper.

Conflicts of Interest

The authors declare no conflict of interest. The founding sponsors had no role in the design of the study; in the collection, analyses, or interpretation of data; in the writing of the manuscript, and in the decision to publish the results.

References

  1. Goerndt, M.; Aguilar, F.X.; Skog, A. Drivers of biomass co-firing in U.S. coal-fired power plants. Biomass Bioenergy 2013, 58, 158–167. [Google Scholar] [CrossRef]
  2. Luschen, A.; Madlener, R. Economic viability of biomass cofiring in new hard-coal power plants in Germany. Biomass Bioenergy 2013, 57, 33–47. [Google Scholar] [CrossRef]
  3. Akhtari, S.; Sowlati, T.; Day, K. Economic feasibility of utilizing forest biomass in district energy systems—A review. Renew. Sustain. Energy Rev. 2014, 33, 117–127. [Google Scholar] [CrossRef]
  4. Berndes, G.; Hoowijk, M.; van den Broek, R. The contribution of biomass in the future global energy supply: A review of 17 studies. Biomass Bioenergy 2003, 25, 1–28. [Google Scholar] [CrossRef]
  5. Intergovernmental Panel on Climate Change (IPCC). Climate Change 2007: Mitigation of Climate Change. Contribution of Working Group III to the Fourth Assessment Report of the Intergovernmental Panel on Climate Change. 2007, p. 863. Available online: http://www.ipcc.ch/publications_and_data/publications_ipcc_fourth_assessment_report_wg3_report_mitigation_of_climate_change.htm (accessed on 2 May 2013).
  6. Guest, G.; Cherubini, F.; Strømman, A.H. Climate impact potential of utilizing forest residues for bioenergy in Norway. Mitig. Adapt. Strateg. Glob. Chang. 2012, 18, 1089–1108. [Google Scholar] [CrossRef]
  7. Loeffler, D.; Anderson, N. Emissions tradeoffs associated with cofiring forest biomass with coal: A case study in Colorado, USA. Appl. Energy 2014, 113, 67–77. [Google Scholar] [CrossRef]
  8. Cannell, M.G.R. Carbon sequestration and biomass energy offset: Theoretical, potential and achievable capacities globally, in Europe and the UK. Biomass Bioenergy 2003, 24, 97–116. [Google Scholar] [CrossRef]
  9. Baxter, L. Biomass-coal co-combustion: Opportunity for affordable renewable energy. Fuel 2005, 84, 1295–1302. [Google Scholar] [CrossRef]
  10. Bauen, A.; Berndes, G.; Junginger, M.; Londo, M.; Vuille, F.; Ball, R.; Bole, T.; Chudziak, C.; Faaij, A.; Mozaffarian, H. Bioenergy—A Sustainable and Reliable Energy Source: A Review of Status and Prospects; IEA Bioenergy: Paris, France, 2009; p. 108. Available online: http://www.ieabioenergy.com/publications/main-report-bioenergy-a-sustainable-and-reliable-energy-source-a-review-of-status-and-prospects/ (accessed on 9 March 2013).
  11. Agbor, A.; Oyedun, A.O.; Zhang, X.; Kumar, A. Integrated techno-economic and environmental assessments of sixty scenarios for co-firing biomass with coal and natural gas. Appl. Energy 2016, 169, 433–449. [Google Scholar] [CrossRef]
  12. Moiseyev, A.; Solberg, B.; Kallio, A.M.I. The impact of subsidies and carbon pricing on the wood biomass use for energy in the EU. Energy 2014, 76, 1–7. [Google Scholar] [CrossRef]
  13. United States Energy Information Administration (U.S. EIA). International Energy Statistics. 2016. Available online: https://www.eia.gov/cfapps/ipdbproject/iedindex3.cfm?tid=2&pid=alltypes&aid=12&cid=regions&syid=2008&eyid=2012&unit=BKWH (accessed on 18 July 2016).
  14. Basu, P.; Butler, J.; Leon, M.A. Biomass co-firing options on the emission reduction and electricity generation costs in coal-fired power plants. Renew. Energy 2011, 36, 282–288. [Google Scholar] [CrossRef]
  15. Shabani, N.; Sowlati, T. A mixed integer non-linear programming model for tactical value chain optimization of a wood biomass power plant. Appl. Energy 2013, 104, 353–361. [Google Scholar] [CrossRef]
  16. National Energy Board. Canada’s Energy Future 2013: Energy Supply and Demand Projections to 2035; Government of Canada: Ottawa, ON, Canada, 2013; p. 101. Available online: https://www.neb-one.gc.ca/nrg/ntgrtd/ftr/2013/index-eng.html (accessed on 20 April 2013).
  17. Nunes, L.J.R.; Matias, J.C.O.; Catalao, J.P.S. Biomass waste co-firing with coal applied to the Sines Thermal power plant in Portugal. Fuel 2014, 132, 153–157. [Google Scholar] [CrossRef]
  18. Sundstrom, S.; Nielsen-Pincus, M.; Moseley, C.; McCaffery, S. Woody biomass use trends, barriers, and strategies: Perspectives of the US Forest Service Managers. J. For. 2012, 110, 16–24. [Google Scholar] [CrossRef]
  19. McCallum, B. Addressing Barriers Restricting Bioenergy System Applications in Canada; The Canadian Bioenergy Association: Ottawa, ON, Canada, 2008; p. 18. [Google Scholar]
  20. McKechnie, J.; Colombo, S.; Chen, J.; Mabee, W.; MacLean, H.L. Forest bioenergy or forest carbon? Assessing trade-offs in greenhouse gas mitigation with wood-based fuels. Environ. Sci. Technol. 2011, 45, 789–795. [Google Scholar] [CrossRef] [PubMed]
  21. Ter-Mikaelian, M.T.; Colombo, S.J.; Lovekin, D.; McKechnie, J.; Reynolds, R.; Titus, B.; Laurin, E.; Chapman, A.M.; Chen, J.; MacLean, H.L. Carbon debt repayment or carbon sequestration parity? Lessons from a forest bioenergy case study in Ontario, Canada. GCB Bioenergy 2015, 7, 704–716. [Google Scholar] [CrossRef]
  22. Gustavsson, L.; Eriksson, L.; Sathre, R. Costs and CO2 benefits of recovering, refining and transporting logging residues for fossil fuel replacement. Appl. Energy 2011, 88, 192–197. [Google Scholar] [CrossRef]
  23. Gustavsson, L.; Haus, S.; Ortiz, C.A.; Sathre, R.; Le Truong, N. Climate effects of bioenergy from forest residues in comparison to fossil energy. Appl. Energy 2015, 138, 36–50. [Google Scholar] [CrossRef]
  24. Repo, A.; Känkänen, R.; Tuovinen, J.-P.; Antikainen, R.; Tuomi, M.; Vanhala, P.; Liski, J. Forest bioenergy climate impact can be improved by allocating forest residue removal. GCB Bioenergy 2012, 4, 202–212. [Google Scholar] [CrossRef]
  25. Jonker, J.G.G.; Junginger, M.; Faaij, A. Carbon payback period and carbon offset parity point of wood pellet production in the South-eastern United States. GCB Bioenergy 2014, 6, 371–389. [Google Scholar] [CrossRef]
  26. Paré, D.; Bernier, P.; Thiffault, E.; Titus, B. The Potential of Forest Biomass as an Energy Supply for Canada. For. Chron. 2011, 87, 71–77. [Google Scholar] [CrossRef]
  27. Maung, T.A.; McCarl, B.A. Economic factors influencing potential use of cellulosic crop residues for electricity generation. Energy 2013, 56, 81–91. [Google Scholar] [CrossRef]
  28. Lamers, P.; Junginger, M.; Dymond, C.C.; Faaij, A. Damaged forests provide an opportunity to mitigate climate change. GCB Bioenergy 2014, 6, 44–60. [Google Scholar] [CrossRef]
  29. Jotzo, F. Australia’s carbon price. Nat. Clim. Chang. 2012, 2, 475–476. [Google Scholar] [CrossRef]
  30. Radu, A.M. Alberta’s CO2 Reduction Strategy—Assessing the Environmental Integrity of Emissions Trading Schemes. Canadian Institute of Resources Law, 2014; p. 50. Available online: https://dspace.ucalgary.ca/bitstream/1880/50352/1/EmissionsOP45w.pdf (accessed on 12 July 2013).
  31. Sultana, A.; Kumar, A. Development of tortuosity factor for assessment of lignocellulosic biomass delivery cost to a biorefinery. Appl. Energy 2014, 119, 288–295. [Google Scholar] [CrossRef]
  32. Natural Resources Canada. Key Facts about Canada’s Forests. 2017. Available online: http://www.nrcan.gc.ca/forests/measuring-reporting/key-forest-facts/17643 (accessed on 6 February 2018).
  33. Environment Canada. Data for Sustainability of Timber Harvest; Wood Supply, Harvest of Industrial Roundwood, Percent of Wood Supply Harvested, and Total Harvest, Canada, 1990 to 2011. 2014. Available online: https://www.ec.gc.ca/indicateurs-indicators/default.asp?lang=En&n=6647C128-1 (accessed on 23 May 2014).
  34. Chomitz, K. Evaluating Carbon Offsets from Forestry and Energy Projects: How Do They Compare? 2000. Available online: http://dx.doi.org/10.1596/1813-9450-2357 (accessed on 10 May 2013).
  35. Marland, G.; Fruit, K.; Sedjo, R. Accounting for sequestered carbon: The question of permanence. Environ. Sci. Policy 2001, 4, 259–269. [Google Scholar] [CrossRef]
  36. Kalt, G.; Kranzl, L. Assessing the economic efficiency of bioenergy technologies in climate mitigation and fossil fuel replacement in Austria using a techno-economic approach. Appl. Energy 2011, 88, 3665–3684. [Google Scholar] [CrossRef]
  37. Natural Resources Canada. Inventory and Land-Use Change. 2013. Available online: http://www.nrcan.gc.ca/forests/climate-change/13111 (accessed on 9 January 2014).
  38. Yemshanov, D.; McKenney, D.W.; Fraleigh, S.; McConkey, B.; Huffman, T.; Smith, S. Cost estimates of post harvest forest biomass supply for Canada. Biomass Bioenergy 2014, 69, 80–94. [Google Scholar] [CrossRef]
  39. Holtsmark, B. Harvesting in boreal forests and the biofuel carbon debt. Clim. Chang. 2011, 112, 415–428. [Google Scholar] [CrossRef]
  40. NRCan (Natural Resources Canada). Coal Facts. 2018. Available online: http://www.nrcan.gc.ca/energy/facts/coal/20071 (accessed on 10 January 2018).
  41. NRCan (Natural Resources Canada). Natural Gas Facts. 2018. Available online: http://www.nrcan.gc.ca/energy/facts/natural-gas/20067 (accessed on 10 January 2018).
  42. United States Energy Information Administration (U.S. EIA). Coal Shipments to the Electric Power Sector. Price by Plant State, Annual; 2013. Available online: http://www.eia.gov/beta/coal/data/browser/#/topic/45?agg=1,0&geo=vvvvvvvvvvvvo&rank=g&linechart=COAL.SHIP_PLANT_PRICE.US-TOT.A&columnchart=COAL.SHIP_PLANT_PRICE.US-TOT.A&map=COAL.SHIP_PLANT_PRICE.US-TOT.A&freq=A&start=2012&end=2013&ctype=linechart&ltype=pin&rtype=s&maptype=0&rse=0&pin= (accessed on 18 September 2014).
  43. Bank of Canada (BoC). Financial Markets Department Monthly Average of Exchange Rates. Ottawa, August 2014, Average of 20 Days. 2013. Available online: http://www.bankofcanada.ca/rates/exchange/exchange-rates-in-pdf/ (accessed on 11 August 2014).
  44. McKendry, P. Energy production from biomass (part 1): Overview of biomass. Bioresour. Technol. 2001, 83, 37–46. [Google Scholar] [CrossRef]
  45. The Greenhouse Gases, Regulated Emissions, and Energy Use in Transportation Model (GREET). Lower and Higher Heating Values of Gas, Liquid and Solid Fuels. 2010. Available online: http://greet.es.anl.gov/ (accessed on 20 January 2014).
  46. United States Energy Information Administration (U.S. EIA). U.S. Natural Gas Electric Power Price. 2014. Available online: http://www.eia.gov/dnav/ng/hist/n3045us3A.htm (accessed on 25 September 2014).
  47. Natural Resources Canada (NRCan). Natural Gas: A Primer. 2014. Available online: http://www.nrcan.gc.ca/energy/natural-gas/5641 (accessed on 11 June 2014).
  48. United States Energy Information Administration (U.S. EIA). Voluntary Reporting of Greenhouse Gases Program; Fuel Emission Coefficients. 2011. Available online: http://www.eia.gov/oiaf/1605/coefficients.html (accessed on 9 September 2014).
  49. United States Energy Information Administration (U.S. EIA). How Much Carbon Dioxide Is Produced When Different Fuels Are Burned? 2014. Available online: http://www.eia.gov/tools/faqs/faq.cfm?id=73&t=11 (accessed on 1 October 2014).
  50. Hayhoe, K.; Kheshgi, H.; Jain, A.; Wuebbles, D. Substitution of natural gas for coal: Climatic effects of utility sector emissions. Clim. Chang. 2002, 54, 107–139. [Google Scholar] [CrossRef]
  51. Bouchard, S.; Landry, M.; Gagnon, Y. Methodology for the large scale assessment of the technical power potential of forest biomass: Application to the province of New Brunswick, Canada. Biomass Bioenergy 2013, 54, 1–17. [Google Scholar] [CrossRef]
  52. Marbe, Â.; Harvey, S.; Berntsson, T. Technical, environmental and economic analysis of co-firing of gasified biofuel in a natural gas combined cycle (NGCC) combined heat and power (CHP) plant. Energy 2006, 31, 1614–1631. [Google Scholar] [CrossRef]
  53. United States Environmental Protection Agency (U.S. EPA). Combined Heat and Power Partnership. Economic Benefits; 2013. Available online: http://www.epa.gov/chp/basic/economics.html (accessed on 5 August 2014).
  54. Biomass Energy Centre. Calorific Value as a Function of Moisture Content Spreadsheet. 2011. Available online: http://www.biomassenergycentre.org.uk/portal/page?_pageid=75,177178&_dad=portal&_schema=PORTAL (accessed on 22 August 2014).
  55. Dymond, C.C.; Titus, B.D.; Stinson, G.; Kurz, W.A. Future quantities and spatial distribution of harvesting residue and dead wood from natural disturbances in Canada. For. Ecol. Manag. 2010, 260, 181–192. [Google Scholar] [CrossRef]
  56. Puddister, D.; Dominy, S.W.J.; Baker, J.A.; Morris, D.M.; Maure, J.; Rice, J.A.; Jones, T.A.; Majumdar, I.; Hazlett, P.W.; Titus, B.D.; et al. Opportunities and challenges for Ontario’s forest bioeconomy. For. Chron. 2011, 87, 468–477. [Google Scholar] [CrossRef]
  57. Waito, B.; Johnson, L. A National Scan of Regulations and Practices Relevant to Biomass Harvesting; World Wildlife Fund-Canada: Toronto, ON, Canada; The Forest Products Association of Canada: Ottawa, ON, Canada, 2010; Available online: http://www.wwf.ca/newsroom/reports/freshwater/nationalscan.cfm (accessed on 23 June 2013).
  58. Thiffault, E.; Paré, D.; Bélanger, N.; Munson, A.; Marquis, F. Harvesting intensity at clear-felling in the boreal forest: Impact on soil and foliar nutrient status. Soil Sci. Soc. Am. J. 2006, 70, 691–701. [Google Scholar] [CrossRef]
  59. Ralevic, P.; Ryans, M.; Cormier, D. Assessing Forest Biomass for Bioenergy: Operational Challenges and Cost Considerations. For. Chron. 2010, 86, 43–50. [Google Scholar] [CrossRef]
  60. Froese, R.E.; Shonnard, D.R.; Miller, C.A.; Koers, K.P.; Johnson, D.M. An evaluation of greenhouse gas mitigation options for coal-fired power plants in the US Great Lakes States. Biomass Bioenergy 2010, 34, 251–262. [Google Scholar] [CrossRef]
  61. MacDonald, A.J. Producing Energy Chips from Roadside Residue Using a Dynamic Cone-Head 580 Chipper; FP Innovations: Pointe-Claire, QC, Canada, 2009. [Google Scholar]
  62. Biomass Research and Development Board (BRDB). Increasing Feedstock Production for Biofuels: Economic Drivers, Environmental Implications and the Role of Research. 2008. Available online: www.esd.ornl.gov/eess/8_Increasing_Biofuels_Feedstock_Production.pdf (accessed on 6 May 2013).
  63. Buongiorno, J.; Zhu, S. Consequences of carbon offset payments for the global forest sector. J. For. Econ. 2013, 19, 384–401. [Google Scholar] [CrossRef]
  64. Mayfield, C.A.; Foster, C.D.; Smith, C.T.; Gan, J.; Fox, S. Opportunities, barriers and strategies for forest bioenergy and bio-based product development in the Southern United States. Biomass Bioenergy 2007, 31, 631–637. [Google Scholar] [CrossRef]
  65. Van Kooten, G.C.; Eagle, A.J.; Manley, J.; Smolak, T. How costly are carbon offsets? A meta-analysis of carbon forest sinks. Environ. Sci. Policy 2004, 7, 239–251. [Google Scholar] [CrossRef]
  66. Van Kooten, G.C.; Laaksonen-Craig, S.; Wang, Y. A meta-regression analysis of forest carbon offset costs. Can. J. For. Res. 2009, 39, 2153–2167. [Google Scholar] [CrossRef]
  67. Costa, P.M.; Wilson, C. An equivalence factor between CO2 avoided emissions and sequestration-description and applications in forestry. Mitig. Adapt. Strateg. Glob. Chang. 1999, 5, 51–60. [Google Scholar] [CrossRef]
  68. Kim, M.-K.; McCarl, B.A.; Murray, B.C. Permanence discounting for land-based carbon sequestration. Ecol. Econ. 2008, 64, 763–769. [Google Scholar] [CrossRef]
  69. Subak, S. Replacing carbon lost from forests: An assessment of insurance, reserves, and expiring credits. Clim. Policy 2003, 3, 107–122. [Google Scholar] [CrossRef]
  70. Hudson, J.B. Integrated harvesting systems. Biomass Bioenergy 1995, 9, 141–151. [Google Scholar] [CrossRef]
  71. Volpe, S.; Desrochers, L. Integration of Biomass Recovery with Cut-to-Length Harvesting Operations; FP Innovations: Pointe-Claire, QC, Canada, 2011. [Google Scholar]
Figure 1. Nationwide greenhouse gas (GHG) emission offset supply curves for the baseline scenarios. Solid lines delineate the natural gas substitution scenarios and dashed lines show the coal substitution scenarios. See Table 1 for scenario descriptions.
Forests 09 00079 g001
Figure 2. Regional greenhouse gas (GHG) emission offset supply curves. Coal substitution scenarios 1–4 are shown only. Prairies: Alberta, Saskatchewan, Manitoba, Maritimes: New Brunswick, Nova Scotia, Newfoundland.
Forests 09 00079 g002
Figure 3. Relative proportions of nationwide greenhouse gas (GHG) offset supply by geographic regions (%) at different GHG emission offset price thresholds; Prairies: Alberta, Saskatchewan, Manitoba, Maritimes: New Brunswick, Nova Scotia, Newfoundland. Scenario 1 for coal and Scenario 5 for natural gas substitution are shown. (Both scenarios use baseline cost assumptions, ecological sustainability constraints, and the 2010 nationwide harvest levels).
Forests 09 00079 g003
Table 1. Summary of coal and natural gas substitution scenarios.
Fossil Fuel Substitution ScenarioNationwide Harvest LevelResidue Extraction Constraints
CoalNatural Gas201020-Year AverageEcological Only *Ecological and Technical +
Scenario 1x ** x x
Scenario 2x x x
Scenario 3x xx
Scenario 4x x x
Scenario 5 xx x
Scenario 6 xx x
Scenario 7 x xx
Scenario 8 x x x
* Retains the same amount of dead organic matter at harvest sites as would be found in forest stands of similar age under normal growing conditions without harvest; retains standing dead trees on a harvest site. + Ecological scenario constraints plus limiting the total amount of harvested residues to 30% of the maximum total biomass in the merchantable portion of the stand. All scenarios assume biomass residue extraction cost of $52 ODT−1 (oven dry metric tonne), delivered fossil fuel price 4.42 GJ−1 for natural gas and $1.97 GJ−1 for coal and biomass moisture content of 50%. ** x: denotes the selected scenario options.
Table 2. Nationwide estimates of greenhouse gas (GHG) emission offsets at different offset price levels by scenario *, using baseline parameter values and altered parameters for sensitivity analysis.
CO2e price $ t−1 CO2eGHG Emission Offsets, Mt CO2e·year−1
Ecological Constraints ScenariosEcological and Technical Constraints Scenarios
Baseline Fossil Fuel PriceBiomass Moisture ContentBiomass Extraction CostsBaseline Fossil Fuel PriceBiomass Moisture ContentBiomass Extraction Costs
+35%−35%−35%+35%−35% +35%−35%−35%+35%−35%
Substitution of Coal by Residue Biomass
Scenario 1Scenario 2
201.36.3-6.3-13.81.15.3-5.3-11.7
3013.819.78.519.71.325.011.716.87.216.81.121.5
4025.427.721.527.914.530.221.823.918.524.112.426.0
5030.231.328.531.325.432.226.027.024.627.021.827.8
No cap35.2 30.3
Scenario 3Scenario 4
201.56.8-6.8-15.21.25.8-5.8-12.9
3015.221.99.221.91.528.012.918.77.818.71.224.0
4028.431.124.131.516.034.124.426.820.627.013.629.3
5034.135.532.135.528.436.829.330.527.630.524.431.6
No cap42.8 36.7
Substitution of Natural Gas by Residue Biomass
Scenario 5Scenario 6
2010.415.13.615.32.815.48.913.03.013.22.313.3
3015.617.511.617.610.817.713.515.19.915.29.315.3
4017.718.515.918.615.618.615.316.013.716.013.516.1
5018.619.217.819.217.719.216.116.515.416.615.316.6
No cap20.1 17.3
Scenario 7Scenario 8
2011.616.93.917.13.017.39.814.53.314.72.514.9
3017.619.912.920.012.020.115.117.111.017.210.217.2
4020.121.217.921.317.621.317.218.215.418.215.118.3
5021.322.120.222.220.122.218.319.017.419.017.219.1
No cap24.4 20.9
* See Table 1 for scenario descriptions.
Table 3. Elasticity of emissions offsets (percent change in offsets due to a change in fossil fuel price, moisture content, or residue extraction costs) by scenario * and offset price level.
ScenarioParameter ChangeModel Parameters
GHG Emission Offset Price $20t−1 CO2eGHG Emission Offset Price $30t−1 CO2eGHG Emission Offset Price $40t−1 CO2eGHG Emission Offset Price $50t−1 CO2e
Fossil Fuel PriceMoist. ContentExtr. CostsFossil Fuel PriceMoist. ContentExtr. CostsFossil Fuel PriceMoist. ContentExtr. CostsFossil Fuel PriceMoist. ContentExtr. Costs
Substitution of Coal by Residue Biomass
Scenario 1+35%10.50 2.861.22 2.580.26 1.220.10 0.46
−35%2.8610.5026.551.101.222.320.430.290.550.160.100.19
Scenario 2+35%10.44 2.861.24 2.580.26 1.240.10 0.46
−35%2.8610.4426.541.111.242.370.440.300.550.160.100.19
Scenario 3+35%10.41 2.861.27 2.580.27 1.250.11 0.48
−35%2.8610.4126.741.121.272.410.440.300.570.170.110.22
Scenario 4+35%10.42 2.861.28 2.580.28 1.260.11 0.48
−35%2.8610.4226.861.131.282.470.450.310.580.170.110.22
Substitution of Natural Gas by Residue Biomass
Scenario 5+35%1.28 2.100.36 0.880.14 0.340.09 0.14
−35%1.881.331.380.740.370.380.280.140.150.120.090.10
Scenario 6+35%1.31 2.110.36 0.890.14 0.340.08 0.14
−35%1.891.371.420.750.370.380.290.140.150.120.090.09
Scenario 7+35%1.33 2.120.38 0.900.16 0.360.11 0.17
−35%1.901.381.430.750.390.410.300.170.180.140.120.12
Scenario 8+35%1.37 2.120.38 0.920.16 0.360.10 0.17
−35%1.901.421.470.770.400.410.300.170.180.150.110.11
* See Table 1 for scenario descriptions and Section 2.1 for basic cost assumptions. Baseline parameter values: Delivered fossil fuel price—$1.97 GJ−1 for coal and 4.42 GJ−1 for natural gas; biomass moisture content—50%; biomass extraction cost—$52 ODT−1.

