Article

Sustainable Management of Metasequoia glyptostroboides Plantation Forests in Shanghai

1
School of Agriculture and Biology, Shanghai Jiao Tong University, Shanghai 200240, China
2
Shanghai Urban Forest Ecosystem Research Station, State Forestry Administration, Shanghai 200240, China
3
Department of Ciencias del Medio Natural, Universidad Pública de Navarra, Pamplona 31006, Spain
4
Earth, Environmental and Geographic Sciences, University of British Columbia (Okanagan Campus), Kelowna, BC V1V 1V7, Canada
*
Author to whom correspondence should be addressed.
Forests 2018, 9(2), 64; https://doi.org/10.3390/f9020064
Submission received: 26 September 2017 / Revised: 21 January 2018 / Accepted: 24 January 2018 / Published: 26 January 2018

Abstract

:
Urban forestry is increasingly used as a tool for climate change mitigation and for providing environmental services to inhabitants of urban areas. However, tree species used in urban forestry are usually different from the ones used in commercial forestry. As a consequence, available data on growth and yield under alternative management scenarios are usually scarce. As forest models can be used to explore potential forest futures, they are of special interest as decision-support tools in urban forestry. In this research, we used the FORECAST ecosystem-level forest model to define the management prescriptions for Metasequoia glyptostroboides plantations in Shanghai that reach the highest net primary productivity (NPP). In a first step, a battery of different stand densities (from 500 to 4000 stems ha−1) was used to identify those with the highest NPP at stand level. Then, different thinning regimes (with intensities ranging from 15% to 40% of trees removed and applied at stand age 5 to 20 years) were simulated on those initial densities with the highest NPP (3000 and 4000 stems ha−1). Planting 4000 stems ha−1 and not applying thinning achieved the highest annual NPP (14.39 ± 3.92 Mg ha−1 yr−1) during the first rotation, but it was not significantly different from the NPP achieved with the same initial density but thinning 40% of trees at year 10. NPP was estimated to decrease with consecutive rotations, and for the second rotation thinning was needed to significantly increase NPP (10.11 ± 2.59 Mg ha−1 yr−1 with 4000 stems ha−1 and 25% thinning at year 10) above non-thinning management. For the third rotation, the highest NPP was reached with initial density 3000 stems ha−1 and 25% thinning at year 10. Nitrogen flows were also estimated to decrease with consecutive rotations. These results indicate the potential of managing M. glyptostroboides urban plantations to reach their maximum productivity potential, but also that additional actions would be needed to ensure adequate nutrient levels over consecutive rotations. For a species such as M. glyptostroboides, which was discovered for science less than 70 years ago and for which no plantations over 50 years exist, the ecosystem-level FORECAST model has been shown as a suitable tool to support management decision when growth and yield data are not available.

1. Introduction

Urban forests are a synthesis between organism and abiotic environment, which should achieve a certain scale and coverage with trees comprising the main body, considerably influence the surrounding environment, and provide obvious ecological values and human landscape values [1]. Urban forest ecosystems have clear differences from wild forest ecosystems, and hence the main purposes and management measures in urban forestry are also different from traditional forestry. Among other features, urban ecosystems usually have higher air pollution rates and also higher pressure for providing recreation opportunities than wild ecosystems, particularly in large urban centers. Therefore, it has become an increasingly important part of ecological studies to conduct research on the structure, function, and factors that impact urban ecosystems, including urban forests, greenbelts, and water bodies [2,3].
Urban forests have been situated on “frontiers” during the past decades [4]. Recently, urban forests have gained popularity as climate change adaptation/mitigation measure [5]. Urban forests are expected to provide ecosystem services, including environmental ecosystem services and socio-cultural services. The socio-cultural benefits have been relatively well evaluated [5]. However, there remains a lack of scientific evidence to support some of the environmental ecosystem benefits, especially carbon storage and sequestration [5,6]. In addition, accurate quantification of tree biomass and carbon storage is first required when measuring the urban ecosystem services [7].
The Shanghai municipality presents a typical example of synergetic development between urbanization and urban forestry in China [8]. By 2014, the population density in Shanghai reached 3000 people km−2 and the level of urbanization 88%. Meanwhile, in the last 20 years Shanghai’s urban forest areas rapidly increased with the implementation of key forest projects, such as the “Out-Loop Forest-Belt Project” (1995) and the “Yanzhong Greenspace Project” (2000) in the central commercial area, as well as the “Huangpu River Water-Conservation Forest Project” (2003) in the suburban areas. As a consequence, forest coverage in Shanghai increased from 3.17% in 1999 to 14% in 2014 [9]. In 2014, Shanghaí’s forested area was 89,035 hectares, with the forest being mostly comprised by the following forest types (from the most to the least coverage): Cinnamomum camphora (L.) Presl., Metasequoia glyptostroboides Hu et Cheng, Ligustrum lucidum Aiton, Phyllostachys spp., Populus euramericana Guinier, and Elaeocarpus sylvestris (Lour.) Poir. Particularly, M. glyptostroboides forests accounted for 5.7% of Shanghai’s forest area. Although plantation forests account for a relatively high proportion, the contiguous forest features relatively minor extension, and forest fragmentation is high.
Influenced by the geography, climate, vegetation, and human development history, the urban forest is distinctly characterized [8,10]. For example, the relatively high consistency in factors such as climate and soil in the Shanghai area contributes to create quite homogeneous site conditions. Due to Shanghai`s situation at the mouth of the Yangtze River, the even terrain facilitates a well-developed transportation network, resulting in high accessibility. Therefore, the urban forests are embedded in the urban architecture, roads, and farmland, providing ecological services and products which are important for the local inhabitants.
However, the opportunities for Shanghai’s citizens to engage in outdoor recreation are reduced, and the level of the ecological services and products from urban forests enjoyed by the citizens is relatively low—a common situation in large- and medium-sized cities across China. Under such conditions, building a more livable China as part of a more ecological-friendly society has become a basic state policy, with the development of urban forests playing an important role [11,12]. Therefore, it has become an important social demand to improve the socio-ecological benefits from urban forests. To do so, improving and strengthening the research and knowledge on sustainable management of Shanghai’s urban forests is paramount [12].
Although an important development has been achieved in Shanghai’s urban forestry in terms of area extension, the corresponding tending of planted forests lags behind. Particularly, due to the high densities used in the original forestation plans, the current canopy density is too high, competition among trees is high, and growth potential is weak, with growth stagnation becoming increasingly likely [13]. As a consequence, socio-ecological benefits of the urban forests are not provided at their full potential [9,10].
Research done so far on the management of these forests emphasizes their commercial use, putting less emphasis on the management of the provision of sustainable ecological services such as CO2 sequestration or recreational opportunities [11]. Research and evaluation on different management strategies and their effects on ecological services are required in order to carry out science-based forest management in order to improve the environmental quality and not only the area extension of Shanghai’s forests [12,14]. However, carrying out long-term management experiments in urban forests is considered more difficult and time-consuming because of constraints of typical urban planning. As a consequence, most of the management approaches for urban forests follow the strategies used for traditional commercial forests [15]. Traditional forestry is based on the assumption that future forest growth will follow the same trend as previously observed [16]. Therefore, traditional forestry is a knowledge source with little capacity to adapt to changing conditions, unless other tools can be used. Such tools could be ecologically-based ecosystem-level forest models that can simulate large time or spatial scales by creating “virtual experiments” depicting the most likely future paths that stand development can follow under future changing conditions. There is a wealth of forest models scientifically designed and tested to simulate the interactions between trees, soils, and the environment and the use of one or another depends mostly on the model user’s objectives (see the reviews by Lo et al., 2011; Lo et al., 2015; Blanco et al., 2015, and references cited therein) [17,18,19].
The ongoing transition to an ecosystem-based urban forest management system has increased the level of complexity for management operations, as it requires the development of decision-support tools such as ecological models that allow for greater flexibility in representing management and environmental conditions, with a scientifically sound representation of ecosystem processes [20,21]. However, it is becoming clear that modeling forest ecosystems under changing conditions (e.g., new management practices, forest decline, climate change, invasive species, etc.) has to be done with models able to simulate changes in site quality. Traditional statistical growth and yield models, purely based on empirical observations alone, are unlikely of fulfill these requirements [22,23,24]. For models to be adequate decision-support tools, they have to be as simple as possible but as complex as necessary to explain the observed phenomena. Predicting changes in soils, trees, and lesser vegetation at scales meaningful for forest management involves greater complexity than is included in empirical non-process based models [17,18,25].
Many species used in urban forestry are hardly ever found forming natural forests, or even monospecific commercial stands, and therefore there are no growth and yield tables available. Maybe the most striking example of this situation can be observed in the plantations of M. glyptostroboides, a species considered extinct and only present in fossil records until its discovery for the scientific world in 1948 [26]. Since then, M. glyptostroboides plantations have been quickly expanded through the world, given its quick growth [27]. Its relative resistance to pollution [28] has made M. glyptostroboides an obvious choice of urban foresters when developing afforestation plans in the new urban centers in subtropical areas such as Shanghai [29]. However, all M. glyptostroboides plantations around the world are 50 years old or younger, and only a few isolated individuals of in its natural distribution surpass 100 years in its natural distribution [30]. As a consequence, there is no information available about how M. glyptostroboides stands could develop under different management techniques, and using ecosystem-based forest models is the only option to estimate tree growth and carbon sequestration under alternative management scenarios [23].
Net primary productivity (NPP) is defined as the total amount of carbon fixed in the process of photosynthesis by plants in an ecosystem minus the losses resulting from the autotrophic respiration of the plants. NPP indicates the growing status of vegetation and is a major determinant of carbon sequestration in the terrestrial ecosystems [31]. The changes in NPP will eventually change the carbon sequestration of forests [32]. NPP is one of the most used ecological variables in sustainable management evaluation [33,34]. Similar to the FORECAST model, NPP simulated by the C-Fix model [35] and the 3-PG (Physiological Principles Predicting Growth) model [32] was used to assess the carbon sequestration capacity of forests in the long term.
In China, carbon sequestration by forest plantations is an important component of climate change mitigation plans [33,36,37]. Therefore, our general goal is to provide the best available estimations of productivity of M. glyptostroboides growing under different management conditions to support the development of sustainable management plans for carbon sequestration in general, both in urban and forest contexts. To reach this aim, we combined empirical field data with the ecosystem-level FORECAST to provide some of the first long-term estimates of NPP for this species, which could be used as target goals both in traditional and urban forestry. Based on its reported high growth rates, our hypothesis is that M. glyptostroboides plantation forests in Shanghai should have a notable capability for carbon sequestration under the optimal management prescriptions, similar to some of its other companion species, such as the also fast-growing conifer, Chinese fir (Cunninghamia lanceolata (Lamb.) Hook). However, the ideal combination of planting densities, thinning intensities, and thinning time to reach optimal carbon sequestration is unclear. Therefore, the specific objective of our research is to identify the management prescriptions for M. glyptostroboides plantations that maximize NPP and at the same time are ecologically sustainable in the long term. To achieve this objective, the effects of tree densities and thinning treatments on the NPP of the M. glyptostroboides plantations were explored through simulating different combinations of management strategies with the FORECAST ecosystem-level forest model [23], based upon the monitoring data of permanent sample plots gathered by long-term observation over the urban forest ecological system in Shanghai.

2. Materials and Methods

2.1. Study Sites

The Shanghai Urban Forest Research Network (SUFRN) was established in 2011 to monitor the forest ecosystem service and comprises 95 permanent plots. M. glyptostroboides plantation plots were established at sites of different site quality (See Table S1 and Figure S1 in Supplementary Materials). In our case, we have used conventional site index (SI) values as a surrogate for site quality (SI = top tree height at stand age 20 years). Tree inventories were carried out in all the plots twice at 5-year intervals (2011 and 2016, respectively), and the field work was based on the National Standards of the People’s Republic of China for “Methodology for field long-term observation of forest ecosystem research” [38]. All free-standing woody plants with a stem diameter higher than 5 cm (at 1.3 m above the ground) were mapped, tagged, and measured in diameter (with a precision of 0.1 cm) and in height (using radar distance measurement with a precision of 0.1 m, Vertex IV, Haglöf Sweden AB). See detailed description of these plots in Table S1 (Supplementary Material).
These plantations were pure stands with little understory. Mean annual precipitation ranged from 606 to 1481 mm, with mean annual temperatures ranging from 14.6 to 16.2 °C. The mean annual frost-free period is 229 days, with average annual sunshine time of 2104 h. The average altitude above sea level is about 4 m. Major soil types in the region include paddy soil (or anthrosols based on FAO (Food and Agriculture Organization of the United Nations)/UNESCO (United Nations Educational, Scientific and Cultural Organization) classification), tidal soil (or fluvisols), red soil (or alisols), yellow brown soil (or haplic luvisols), and coastal saline soil (or solonchaks). Paddy soil and tidal soil are mainly distributed in the plain region and red soil and yellow brown soil are mainly distributed in the hilly region [39].

2.2. Model Selection, Calibration, Evaluation, and Sensitivity Analysis

This study focuses on individual forest stands. Model selection mainly followed two criteria. One was that the selected mechanistic models could apply at the stand scale and the model outputs, such as forest productivity and carbon pools, should be available for individual stands. Another important criterion was that the selected models could examine the impacts of different management strategies on long-term site productivity and forest carbon sequestration. Following the two criteria, the candidate models, with detailed input data and mostly species-specific parameters, could be used for estimating sustainable forest management indicators. Among them, the FORECAST model, which was specifically designed to examine the impacts of different management strategies or natural disturbance regimes on long-term site productivity and forest carbon sequestration, stood out. Furthermore, the FORECAST model has been successfully used as a management evaluation tool in tropical and subtropical forests, especially fast-growing conifer Chinese fir [33]. However, as in any other modeling experiments, our simulation has some limitations. The main one is that the present FORECAST model version does not explicitly consider the impact of moisture (Supplementary Material). However, water limitation is not an important issue because of frequent monsoon rains and abundant precipitation in subtropical areas.
SI is commonly used as an indicator of site quality and is a key driver in most growth and yield models. It is also a species-specific measure of potential forest productivity (usually for even-aged stands) [40]. SI in FORECAST is based explicitly on nutritional quality and implicitly on water availability [41]. The FORECAST ecosystem-level hybrid forest model has been described in detail before [23,42], and therefore only a brief description is provided in the Supplementary Material. The FORECAST model calibration procedure requires a variety of field and literature data from sites with different SIs. Data for model calibration of growth and biomass were from the field inventories carried out in the SUFRN in 2011 and 2016 (Table S1). The tree biomass was estimated with these field data using local allometric equations [43]. Data for nutrient concentrations were provided by tissue samples (live bark, dead bark, live branches, young foliage, and old foliage samples collected and analyzed in 2016) and from existing literature [33,43]. Data describing soil processes and nutrient inputs in precipitation and slope seepage, mineral soil cation and anion exchange capacities, humus mass, nutrient concentrations in litterfall, litter decomposition rates, etc. were derived from literature in the region [44,45,46,47,48,49,50].
To establish initial site conditions, we carried out a modified version of the typical spin-up process used to let the model reach a stable state [51,52]. Initial conditions for poor sites (SI = 12 m at stand age 20 years) were created by running 10 cycles of 60 years, ending with stand-replacing windthrow, as typhoons are the most common natural disturbance in this region [53]. Initial conditions for medium and rich sites were created using 15 and 20 cycles, respectively.
It is highly recommended to obtain additional data to support the evaluation of model predictions. If there is enough data available, a dataset can be split into two groups: data for calibration and data for evaluating. In this study, the observed values for evaluation were from both field inventory (also used for calibration) and existing literature (Table S2). To perform model evaluation, we simulated values of several stand-level variables for medium sites (SI = 16 m, initial density 2000 stems ha−1) as predictions. Model evaluation was performed first with measures of a model’s bias and goodness-of-fit indices. A linear regression of predicted vs. observed values was fitted to calculate the coefficient of determination (R2). In addition, two different indexes were calculated. The first was Theil’s inequality coefficient U [54]:
U = i = 1 n D i i = 1 n o b s e r v e d i 2
where Di = observed valueipredicted valuei (the difference between the measured and simulated value i), n = number of data pairs. U can assume values of 0 and greater. If U = 0 then the model produces perfect predictions. If U = 1, the model produces predictions of system behavior that are not better than a no-change prediction. If U > 1, then the predictive power of the model is worse than the no-change prediction. The second index was modelling efficiency (ME), as defined by Vanclay and Skovsgaard (1997) [55] as:
M E = 1 i = 1 n D i 2 i = 1 n ( o b s e r v e d i p r e d i c t e d ¯ )
where Di = observed valueipredicted valuei (the difference between the measured and simulated value i), n = number of data pairs, p r e d i c t e d ¯ = i n p r e d i c t e d i / n .
This statistic provides a simple index of performance on a relative scale, where ME = 1 indicates a perfect fit, ME = 0 reveals that the model is not better than a simple average, while negative values indicate poor model performance.
In a second set of analyses, the accuracy of model predictions was determined using the technique described by Freese (1960) [56] and modified by Reynolds (1984) [57]. The critical error e* can be interpreted as the smallest error level, in absolute terms, which will lead to the acceptance of the null hypothesis (i.e., that the model is within e units of the true value) at the given level. If a user specifies a value of e (difference between real and modelled data) higher than e* then the conclusion will be that the model is adequate. Therefore, these critical errors relate model accuracy to the user’s requirements. With this test, the model is judged to be accurate unless there is strong evidence to the contrary. The critical error test was done at 5% and 20% error levels (α = 0.05 and α = 0.20), corresponding to an exigent and a less demanding model user, respectively.
The sensitivity analysis has been done for several variables for FORECAST. Kimmins et al. (1999) identified a list of parameters for which the model was the most sensitive [42]. Among them, the parameters wood decomposition rate and fine root turnover stand out [21,58]. For more details about the sensitivity analysis done with FORECAST, please see the references [21,42,58].

2.3. Management Simulations

The FORECAST model is flexible to be adapted to local conditions of species and management. In our research, the site quality was set as poor condition (SI = 12 m) in FORECAST, which was similar to the current condition in the plots (See Table S1). Rotation length was kept constant at 60 years (according to GBT18337.3-2001, Non-commercial forest construction-Technical regulation) [59], for three consecutive rotations (180 years were simulated in total), and stem-only harvesting was used. According to the experience of forest tending, reasonable thinning intensities for M. glyptostroboides range from 15% to 50%, and the time of thinning application ranges from the 10th to 20th year. The smaller thinning intensity and the later time of thinning, the smaller the impact on forest stand growth. Current stand densities in the SUFRN forest range from 440 to 3550 stems ha−1. Therefore, the simulated management plans were defined as follows:
Step 1—Initial stand density was set as 500, 1000, 2000, 3000, and 4000 stems ha−1, respectively. Thinning treatments were defined as unthinned and 15%-20y (standing for 15% thinning intensity from above, defined as 15% of trees removed starting with the smaller ones, on the 20th year per rotation). NPP was calculated for each simulation.
Step 2—Those stand densities from the previous step for which NPP was improved by thinning were selected. Thinning intensity was set as 15%, 25%, and 40%, respectively. The time of thinning application was set as the 10th, 15th, and 20th year in each rotation, respectively. NPP was calculated for each simulation
Step 3—Using the results from the Step 2, we selected the most sustainable thinning treatment combination (best management, defined as those scenarios for which productivity losses over rotations are minimized) with different initial densities and calculated NPP under each treatment.

3. Results

3.1. Model Evaluation

The model acceptably reproduced stemwood biomass and main growth trends in height, although predictions of diameter were slightly less accurate (Figure 1). FORECAST predictions were close to the average value of field observations, and were always inside the observed data range. Statistical indexes also indicated acceptable model performance (Table 1). The coefficient of determination (R2) was high for all variables, especially for top height, with the model being able to reproduce 87% of the observed variance. Modelling efficiency values showed that FORECAST was an efficient model for predicting stemwood biomass and height, although its efficiency was lower for dimeter at breast height (DBH). This reduced efficiency was probably caused by the underestimation of DBH after 30 years of simulation (Figure 1). Theil’s U indicated that predictions by FORECAST were always better than a non-change hypothesis. The values of Freese’s critical error e* were similar or higher than the natural variability of observed data for the studied variables as defined by different bias measures, indicating that the model could meet the requirements even of the most exigent user (as defined above, Table 1).

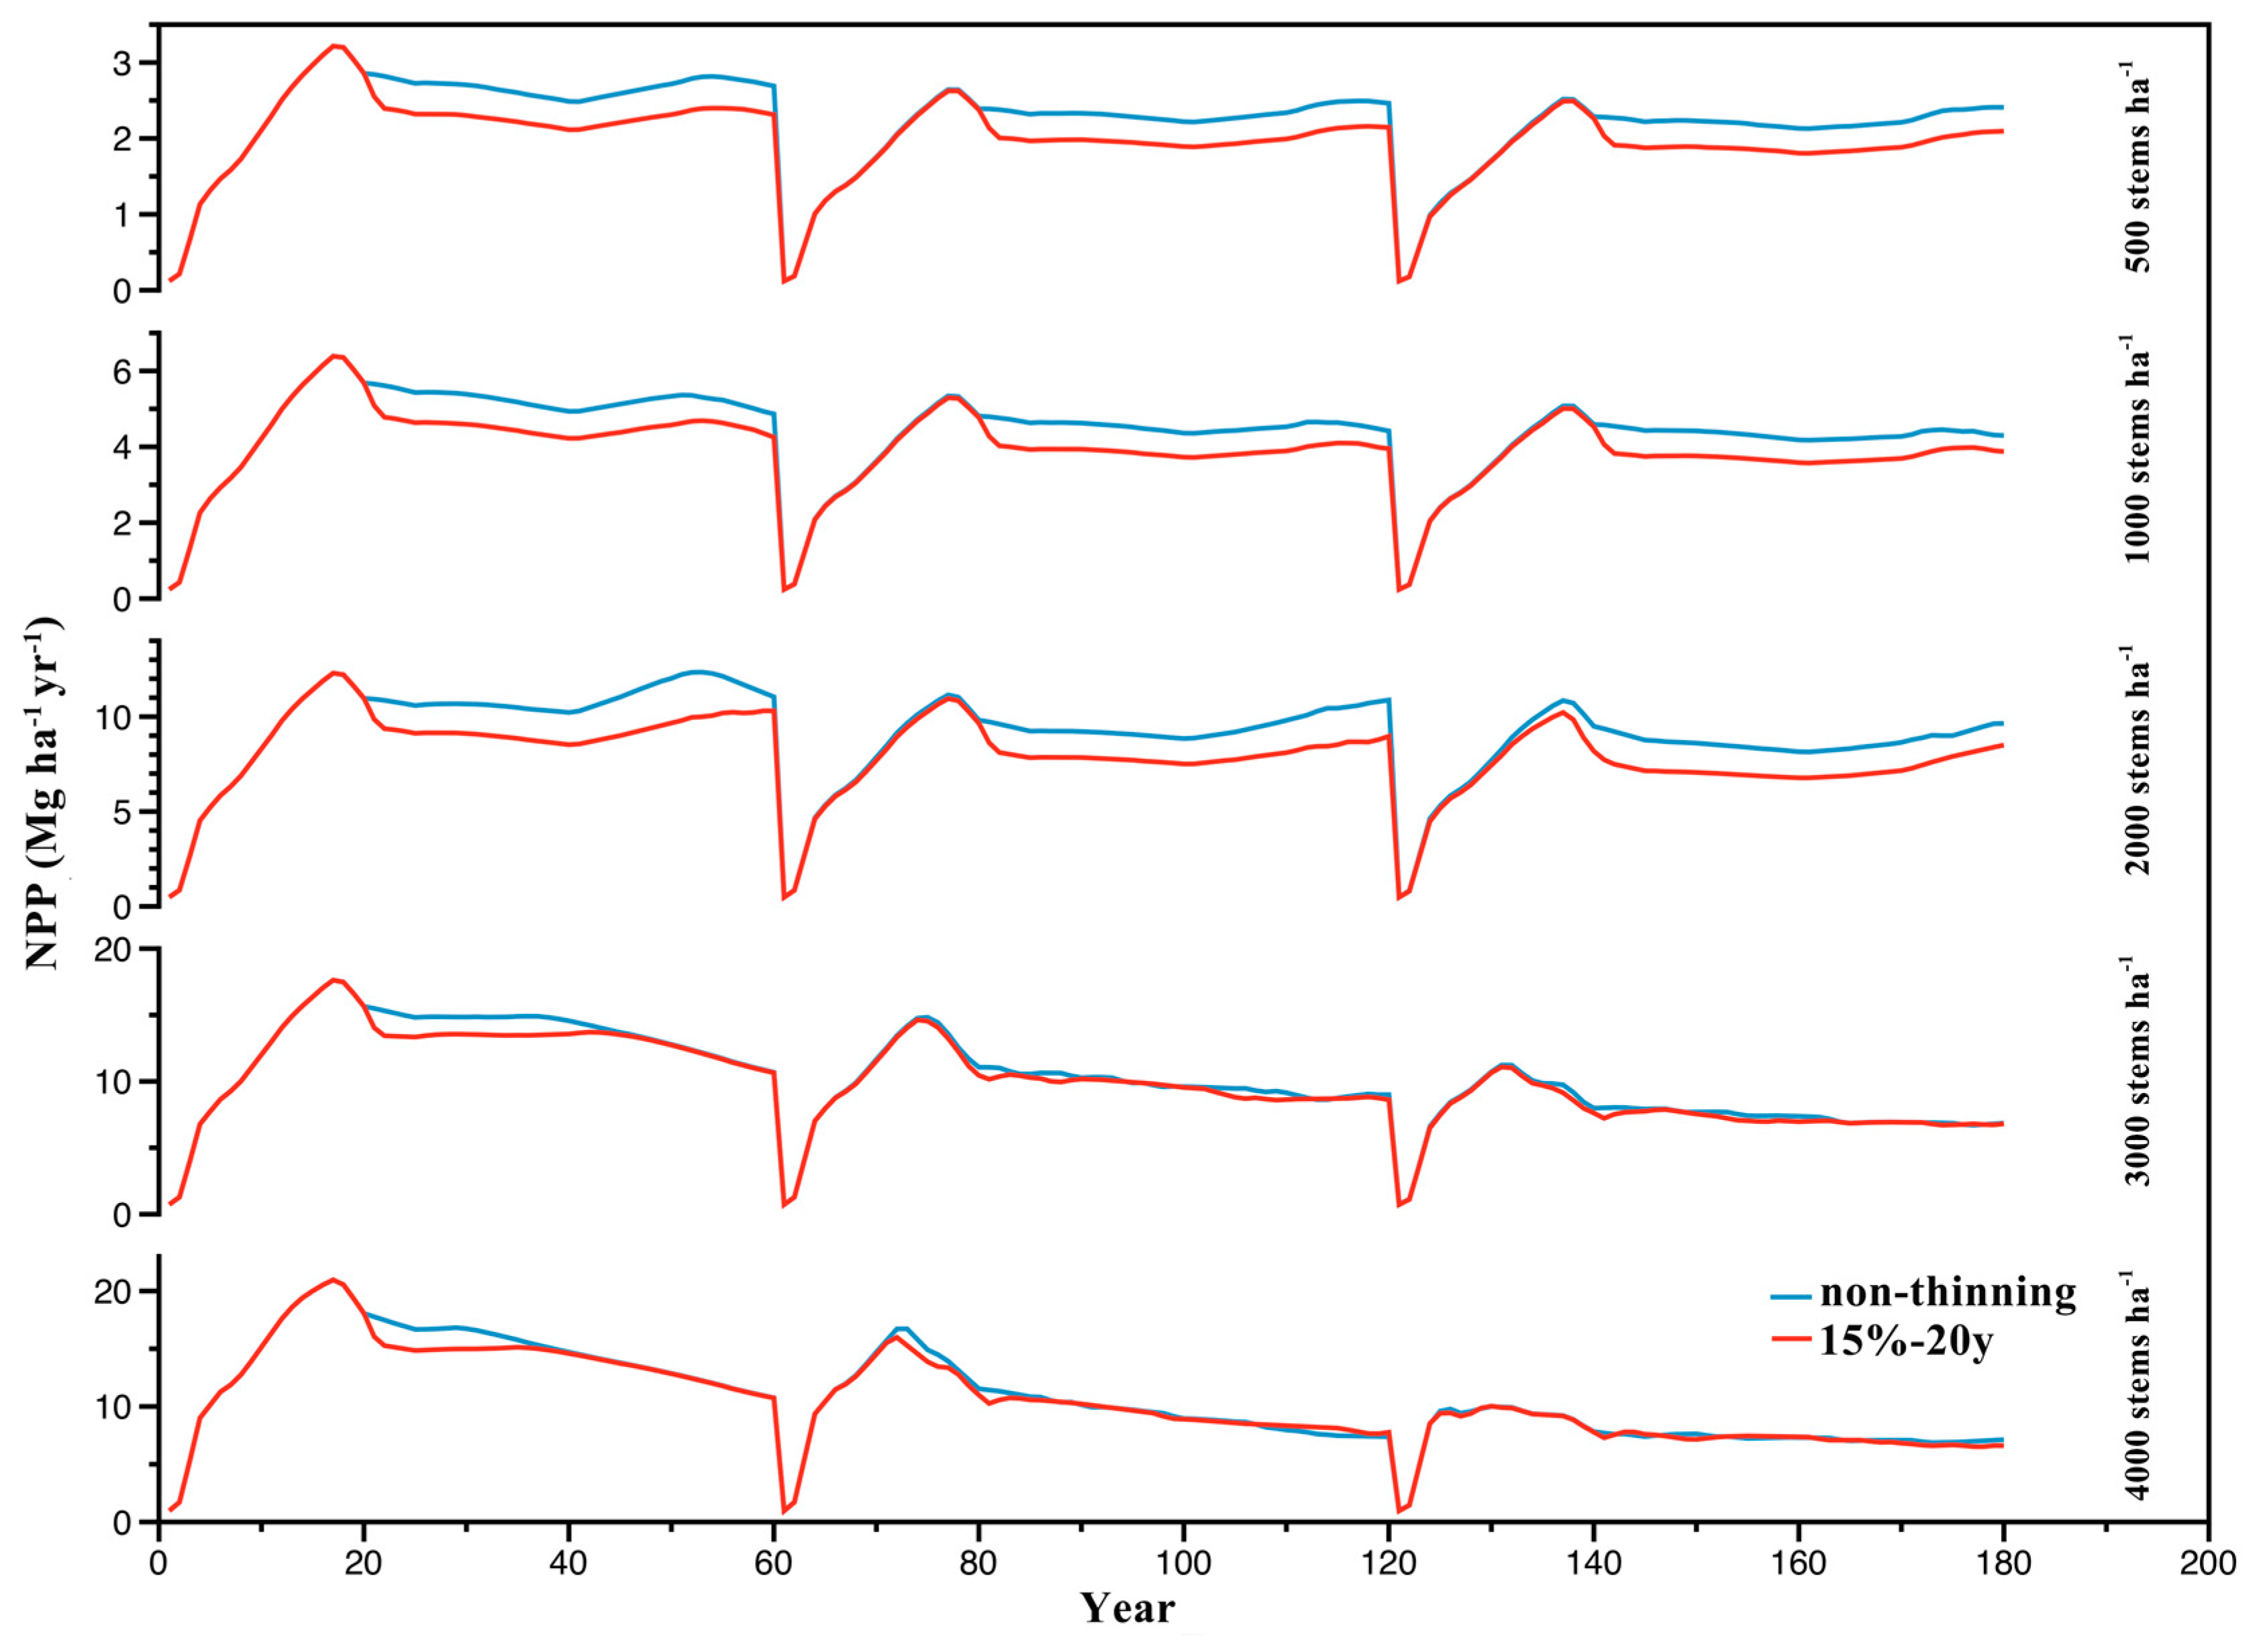
3.2. Effect of Stand Density on NPP

The results of the Step 1 showed that at low initial densities (500, 1000, or 2000 stems ha−1), the maximum NPP appeared at the stand age of 17 years, and thinning had a negative impact on NPP (Figure 2). Similarly, for higher densities (3000 or 4000 stems ha−1) maximum NPP was also reached around 17 years, but thinning had a positive impact on NPP. Comparing stand densities, the NPP in each rotation increased with the increase in stand density. For all stand densities, NPP showed a brief decline after thinning, and then it gradually increased, reaching the same level as the non-thinning scenario as the stand grew older. NPP showed a decreasing trend during the three rotations at different initial densities (Figure 2).
Our results showed that thinning was not necessary (it did not produce significant effects on tree growth) when the stand density was less than 3000 stems ha−1, indicating that such low planting densities could generate understocked stands, whereas interspecific competition had negative effects on NPP if initial density was higher than 3000 stems ha−1. When the initial density was over 3000 stems ha−1, the application of thinning was necessary to maintain and improve NPP. Through thinning, the stand structure was adjusted and the competition of stand decreased, which was helpful for maintaining and improving NPP.

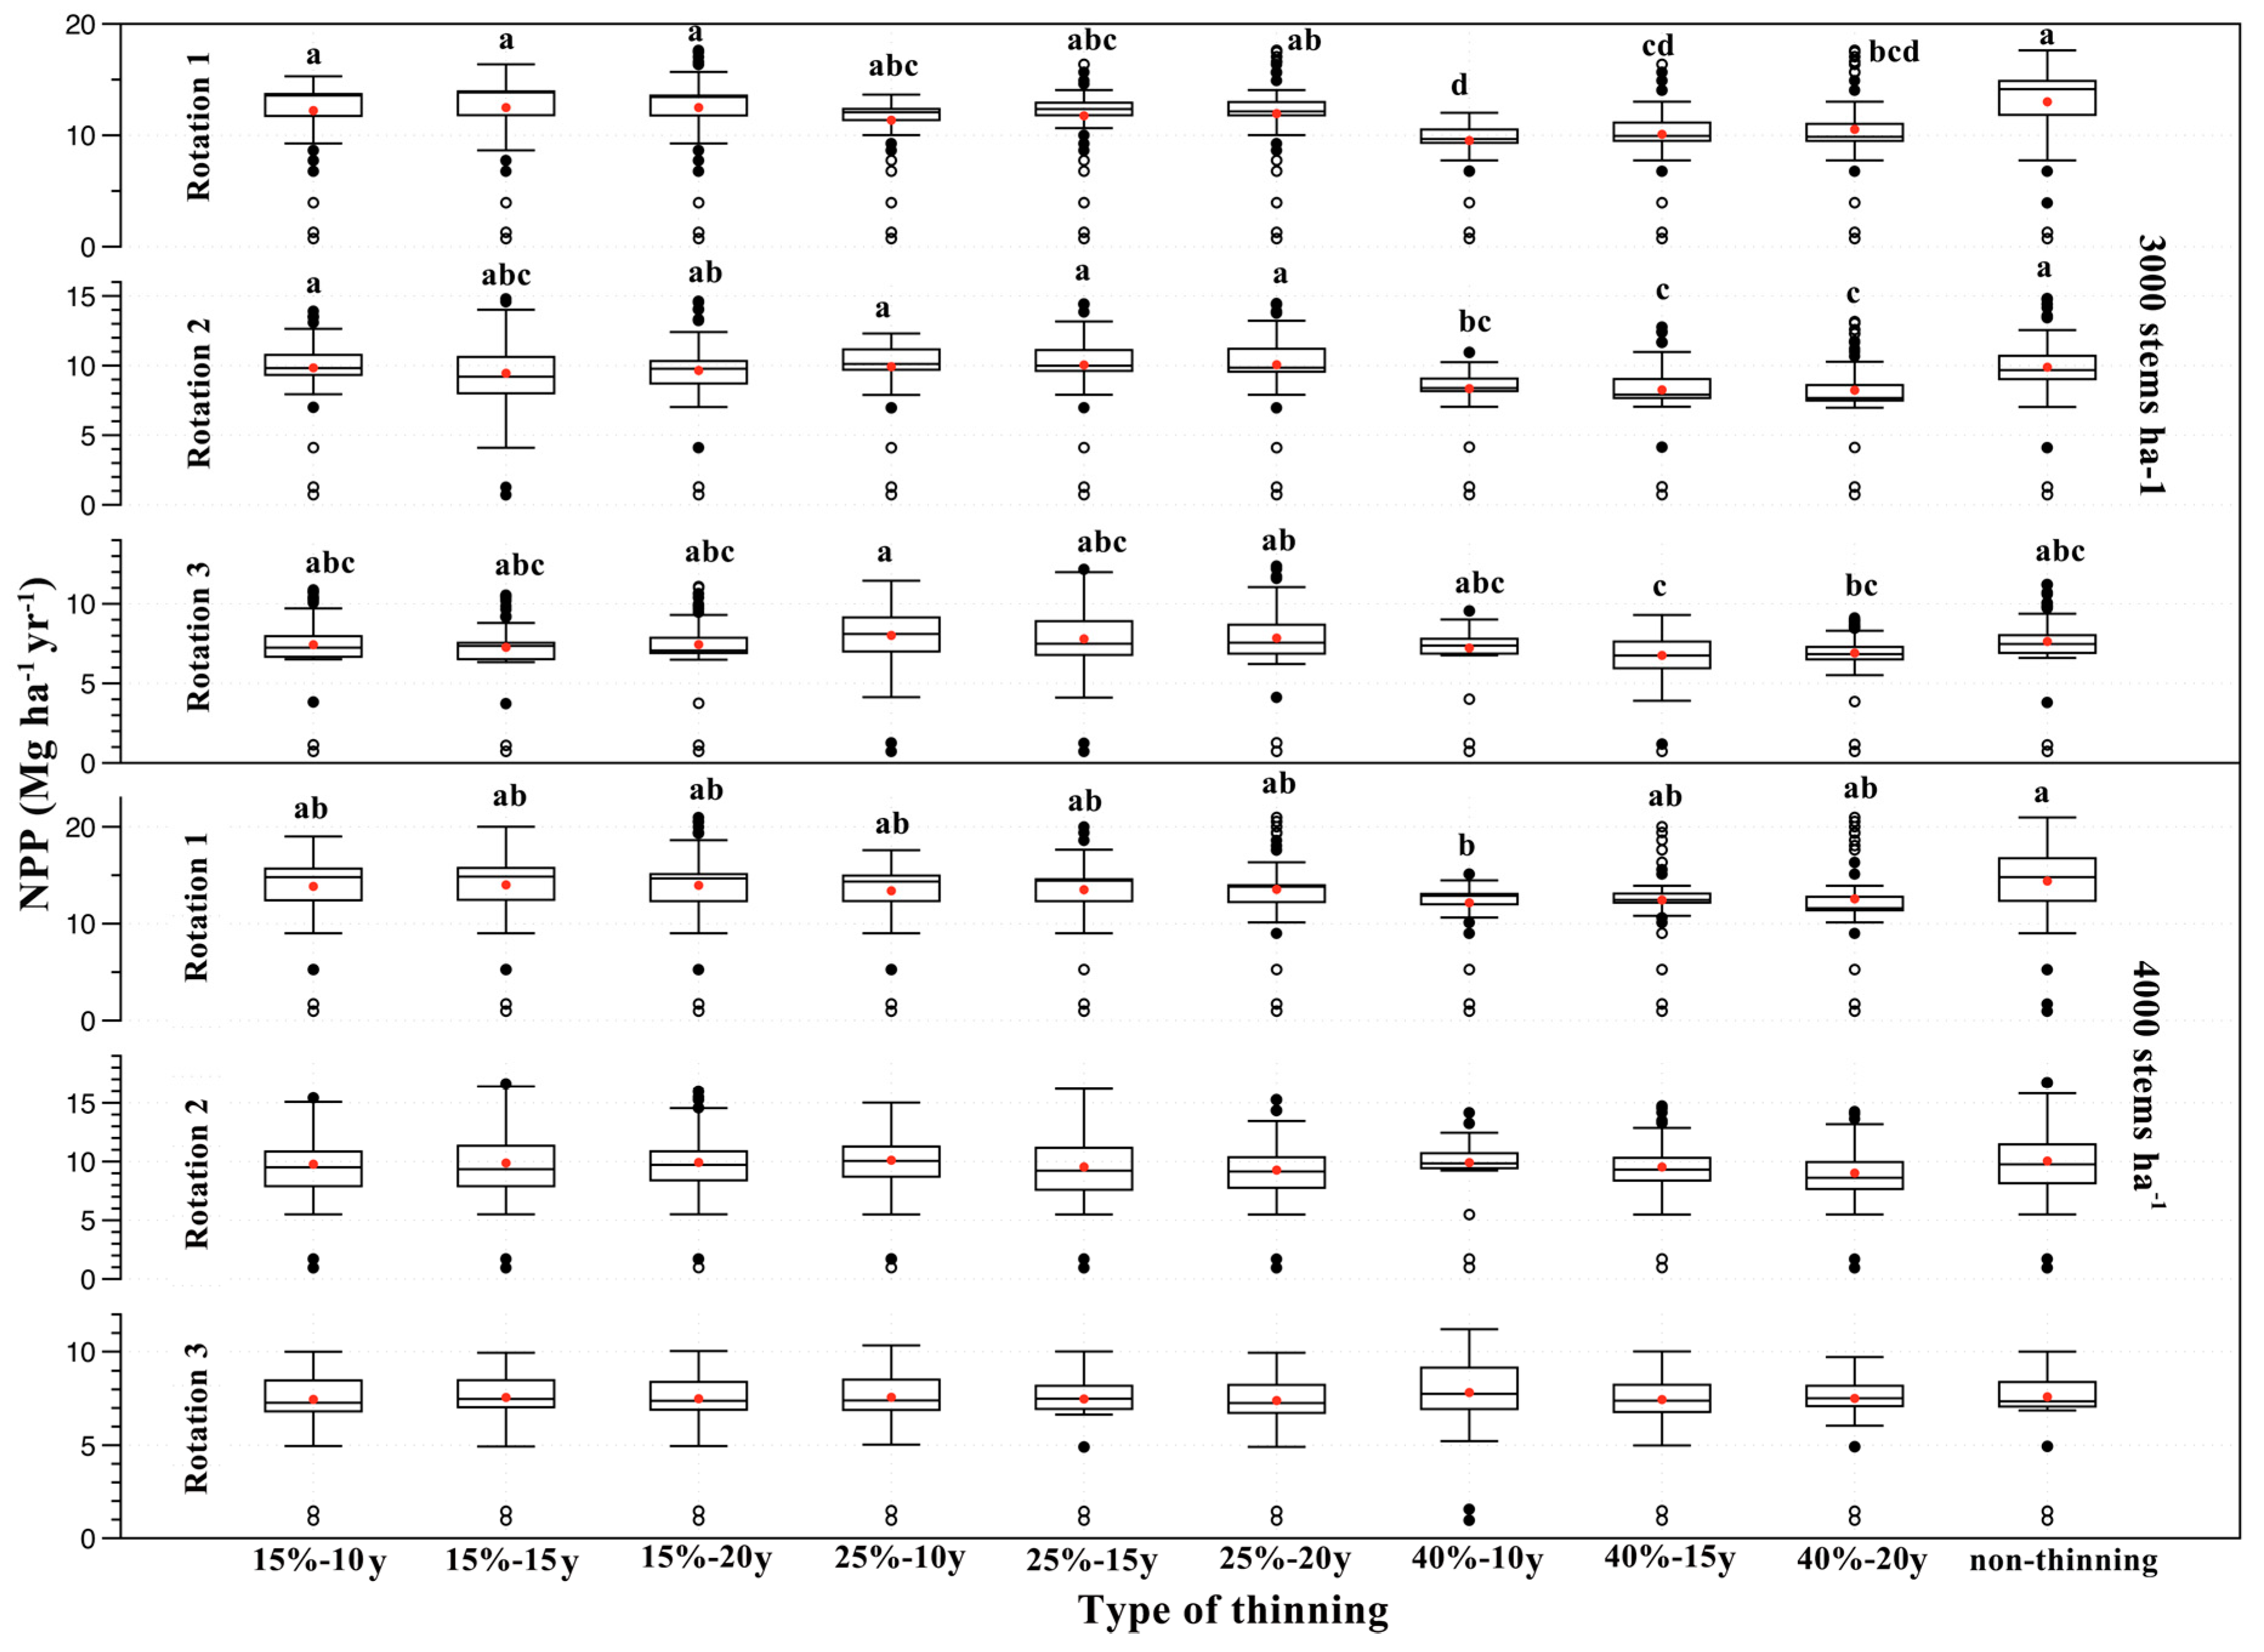
3.3. Effects of Thinning Treatments on NPP

Based on the previous results, in Step 2 we simulated the effects of different thinning regimes on NPP with initial densities of 3000 and 4000 stems ha−1. The results (Figure 3) showed that the average NPP of the unthinned stands was the highest in Rotation 1 (13 ± 3.41 Mg ha−1 yr−1), with an initial density of 3000 stems ha−1, significantly higher than those under 40% intensity with different thinning times. The average NPP of the unthinned stands was also the highest in Rotation 1 (14.39 ± 3.92 Mg ha−1 yr−1), with an initial density of 4000 stems ha−1, but only significantly higher than under the 40%-10y treatment.
In Rotation 2, for the stands with initial density of 3000 stems ha−1 and under 25% thinning intensity, NPP was higher than those under non-treatment and other treatments, and significantly higher than those under 40% intensity treatments. Average stand NPP under the 25%-20y treatment was the highest (10.06 ± 2.37 Mg ha−1 yr−1). For the stands with initial density of 4000 stems ha−1, there was a non-significant trend to reach the highest NPP under the 25%-10y treatment (10.11 ± 2.59 Mg ha−1 yr−1).
In Rotation 3, for the stands with an initial density of 3000 stems ha−1, treatments under 25% thinning intensity reached NPP values higher than the rest (average NPP 8.01 ± 1.97 Mg ha−1 yr−1). For the stands with initial density of 4000 stems ha−1, the 40%-10y treatment reached the highest NPP (7.83 ± 1.88 Mg ha−1 yr−1), but it was not significantly different from the rest.
Our simulation results showed that thinning was not required during the first rotation, regardless of the initial density of 3000 or 4000 stems ha−1 (Table 2). For stands starting with 3000 stems ha−1, the thinning treatments of 25%-20y and 25%-10y were carried out in Rotation 2 and Rotation 3, respectively, and NPP accumulated per rotation increased by 10.49 Mg ha−1 and 22.71 Mg ha−1, respectively. For the stands established with 4000 stems ha−1, the thinning treatments of 25%-10y and 40%-10y were carried out in Rotation 2 and Rotation 3, respectively, and accumulated NPP increased by 4 Mg ha−1 and 13.9 Mg ha−1, respectively.

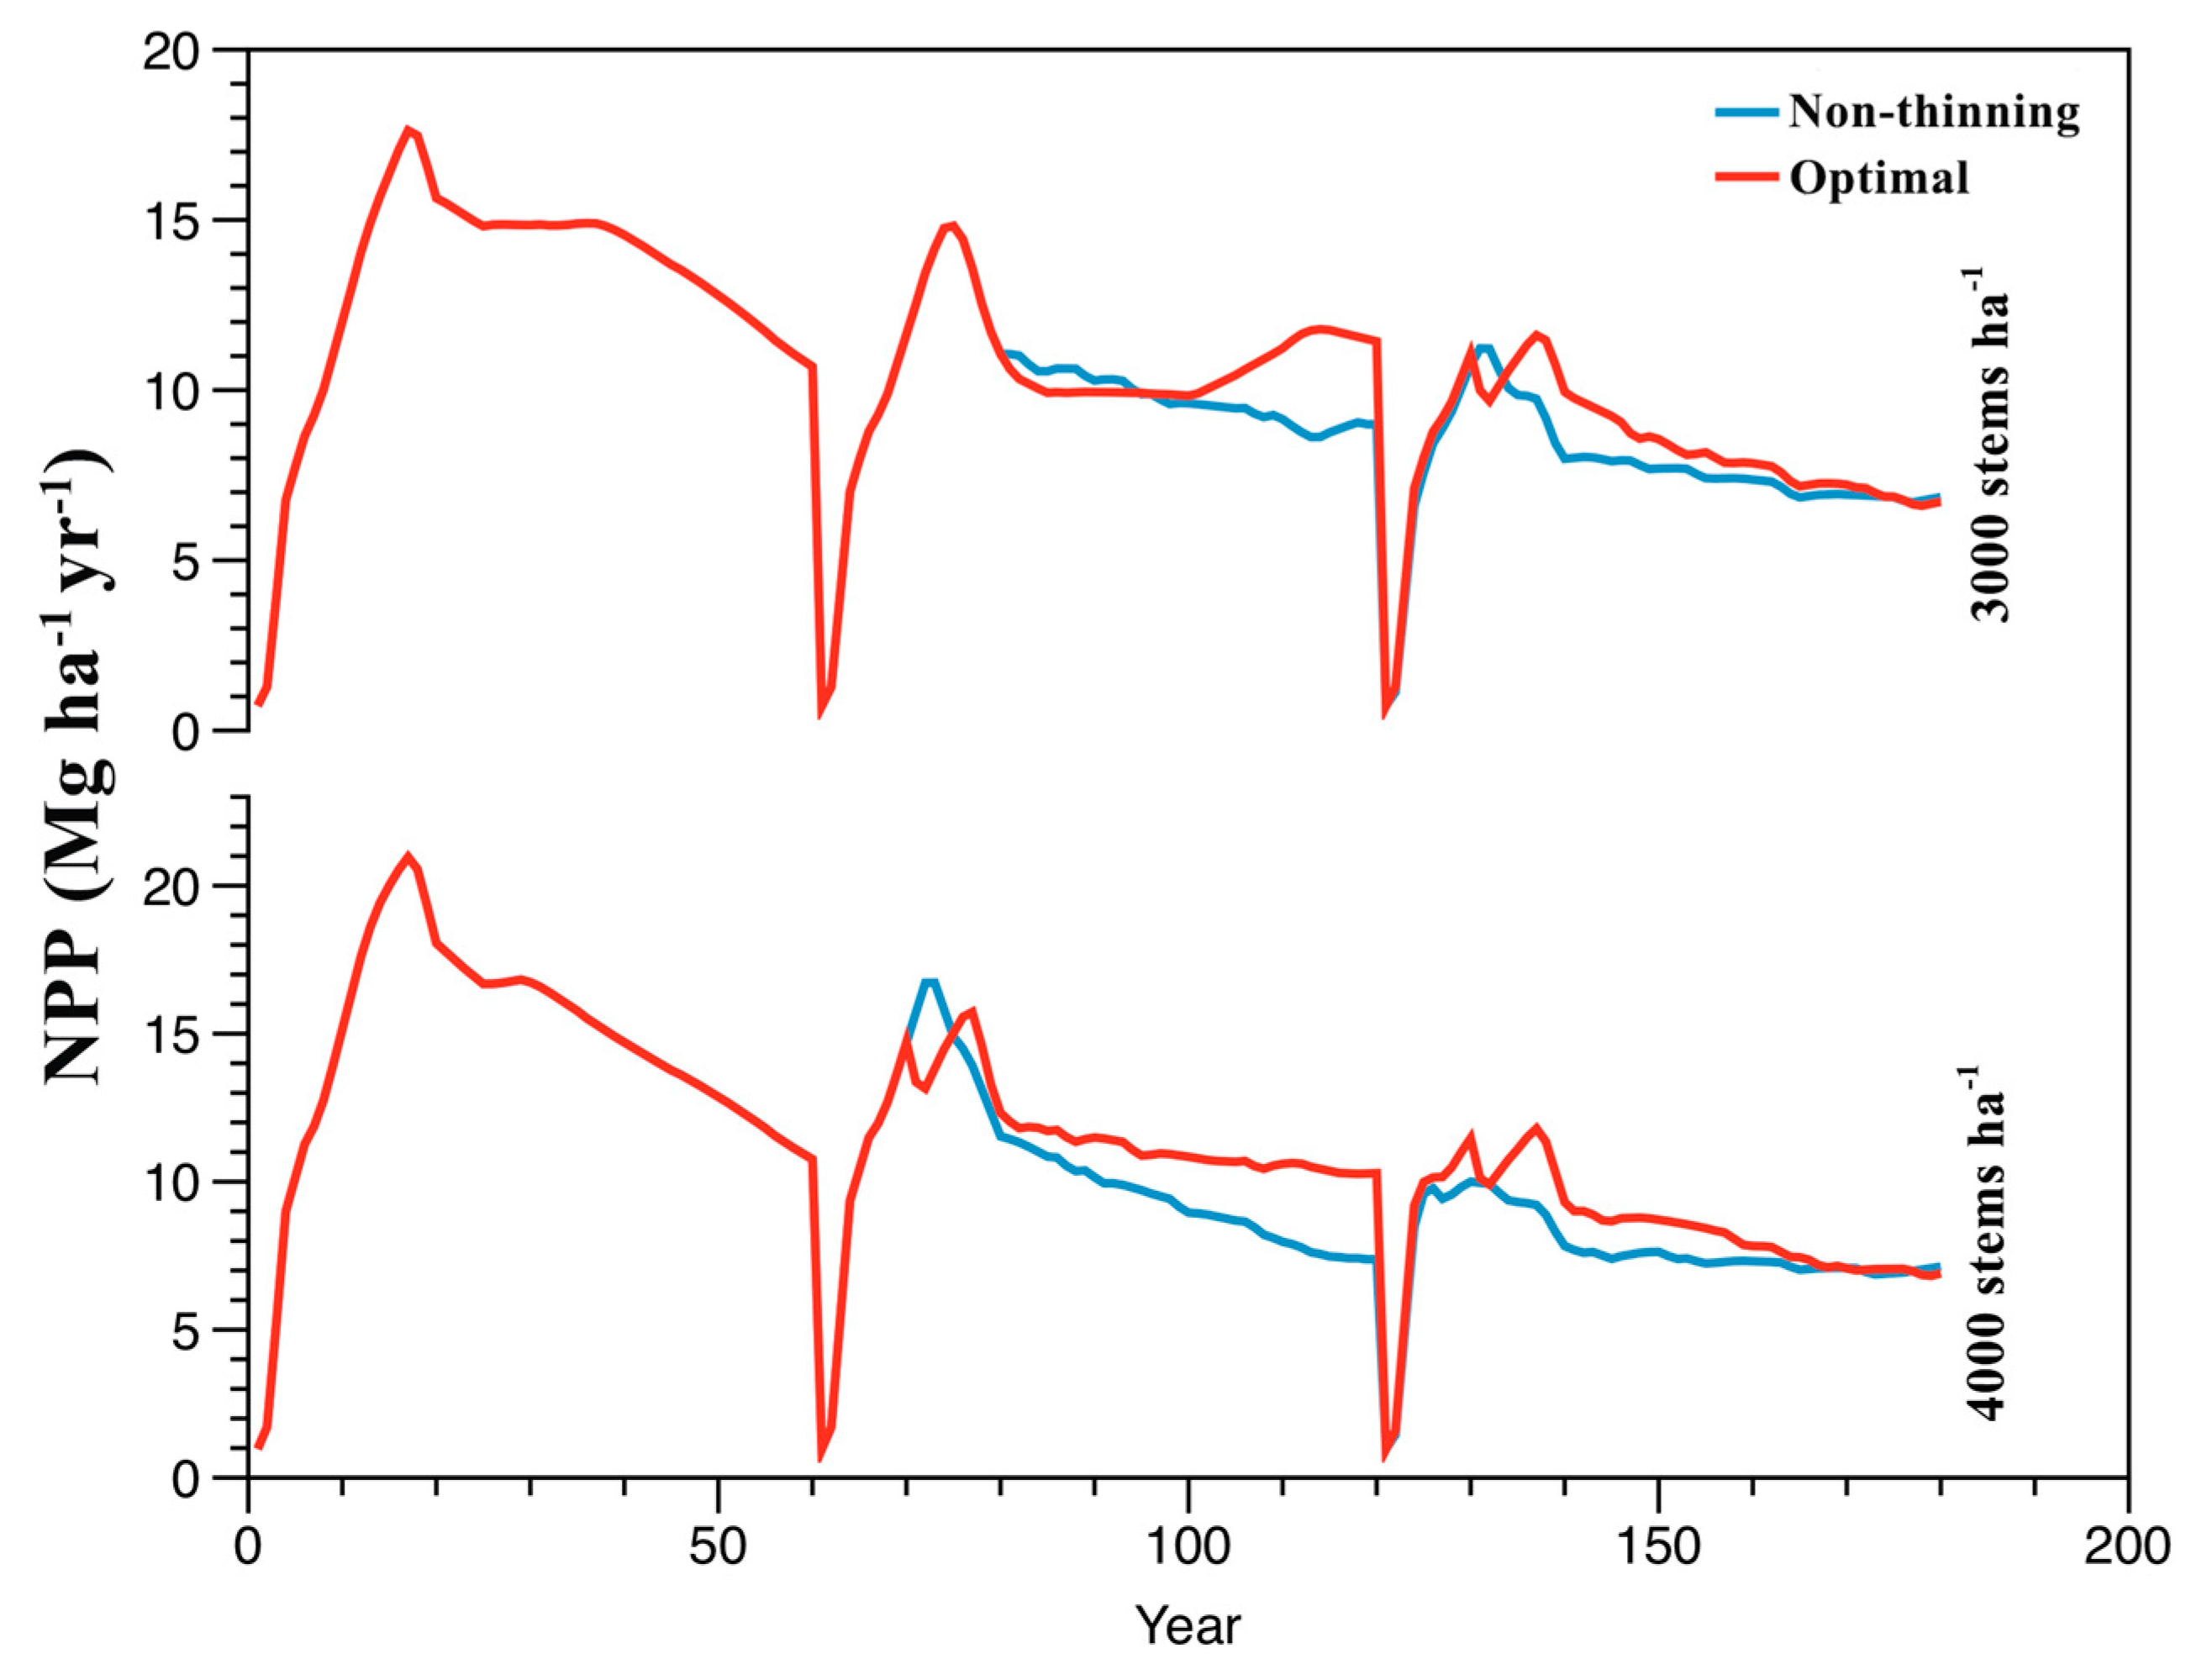
3.4. Optimal Management Prescriptions

Based on the simulation results of different initial densities and different thinning treatments, we set up a new simulation scheme trying to define the best management regiment for maximizing and sustaining NPP. Thinning treatment was not applied in Rotation 1, which started with initial densities of 3000 or 4000 stems ha−1. For the 3000 stems ha−1 stands, the thinning treatments of 25%-20y and 25%-10y were carried out in both Rotation 2 and Rotation 3. Our results showed that the accumulated NPP increased by 32.98 Mg ha−1 in Rotation 2 and by 32.57 Mg ha−1 in Rotation 3 (Table 3).
For stands with initial density of 4000 trees ha−1, the thinning treatments of 25%-10y and 25%-40y were carried out both in Rotation 2 and Rotation 3 (Figure 4). With such management, average NPP in Rotation 2 (11.19 ± 2.48 Mg ha−1 yr−1) and Rotation 3 (8.36 ± 1.97 Mg ha−1 yr−1) were both significantly higher than the average NPP of unthinned stands in the same period. Accumulated NPP increased by 69.01 Mg ha−1 and 45.83 Mg ha−1 in Rotation 2 and Rotation 3, respectively (Table 3). By optimizing the combination of thinning treatments, accumulated stand NPP after 180 years increased by 65.55 Mg ha−1 with initial densities of 3000 stems ha−1, and by 114.84 Mg ha−1 when starting with 4000 stems ha−1. In spite of the improvement of NPP observed in the thinned stands, a drop in productivity over time was estimated for all treatments.
N uptake increased with time, with a small decrease caused by thinning. Available N in soil for both 3000 and 4000 stems ha−1 initial densities was higher under thinning treatments than non-thinning, especially in Rotation 2 (Figure 5). N demand in stands with 4000 stems ha−1 under unthinned treatment in Rotation 2 was greater than available N in soils for 5 years. Differences between N demand and uptake for both stand densities were smaller for thinning than for non-thinning treatments. A reduction of N flows over rotations was estimated (Figure 5).

4. Discussion

4.1. Model Evaluation

All M. glyptostroboides plantations around the world are 50 years old or younger, and only a few isolated individuals of M. glyptostroboides surpass 100 years in its natural distribution [30]. As no data from natural forests exist, and stand densities of current plantations are not related to site index, but to forestry decisions, model performance evaluation was specially challenging. In spite of this, according to all the model performance indicators explored in this work, FORECAST seems to perform acceptably well, at least for operational management accuracy standards. In this analysis, three different measures of the goodness-of-fit were calculated, and, generally, acceptable fits were shown between the observed and the predicted values. The R2 coefficient represents an acceptable consistency between the observed values and the predicted values, as it has been observed for FORECAST when simulating other local companion species [33]. The ME statistic gives a similar insight into the performance of the model, which stated that FORECAST was an effective model with values close to 1. This index has been reported as being superior for model evaluation [60], and particularly for forest models [61]. Results for Theil’s statistic were always lower than one, which indicates that the model is a better predictor than a general mean value. In addition, although the observed data were highly dispersed, the biases were also small and acceptable for regular management plans, which usually deal with degrees of uncertainty higher than the bias produced by the model.
While goodness-of-fit analysis gives us useful insights into the performance of the model, we should also ask whether the model is useful for the user, or, in other words, if for the user’s purposes it is possible to distinguish model predictions from reality. Freese’s critical errors were set as a limit of acceptable accuracy for model users. Our results showed that when FORECAST was calibrated for this type of urban forests, it could meet the requirements of the most demanding users (Table 1). The values set for a strict user (and more so for a relaxed user) were well inside the levels of uncertainty. The acceptable model performance as measured by statistical procedures was also supported by graphical results (Figure 1), which showed model predictions inside the range of observed values of the selected variables and residuals not showing any distinctive pattern. All things considered, our results supported the use of this ecosystem-level model as a decision-support tool in the management of M. glyptostroboides in this region.

4.2. Effects of Thinning Treatments

There are three hypothetical productivity outcomes for thinned stands when compared to unthinned stands: (1) a convergent volume trajectory over time, which implies that thinning can stimulate wood production per hectare; (2) a parallel volume trajectory, implying that thinning only redistributes the growth potential of the site among residual trees; and (3) a divergent volume trajectory that is indicative of underutilized growth potential of the site after thinning [62,63]. Stand volume and biomass are the net result of survivor growth, ingrowth, and mortality [64], but since thinning is applied to young stands, the survivor growth is usually the most important of these three components. Timely thinning can reduce competition among trees, promote accumulation of survivor stocks, and enhance the carbon sequestration capacity of the thinned forests [14].
Our simulation results showed both convergent and divergent trajectories under different thinning treatments, regardless of the initial density (Table 2). Even if parallel trajectories are generally obtained from thinning in conifer stands [62,63], some studies have reported both convergent [65,66] and divergent responses [67]. These conflicting results may be associated with differences in thinning types, application methods, site conditions, or tree species. Our results showed that thinning was not necessary when the initial stand density was less than 3000 stems ha−1 over 180 years, indicating that such low planting densities could generate understocked stands. Any thinning treatment would make forest stands with initial density less than 3000 stems ha−1 divergent responses (Figure 2). These outcomes may be incurred by insufficient planting densities or caused by the presence of large gaps that decrease wood production over time [62,63]. As a consequence, part of the productivity potential of the site would not be used by the target species [13]. This could leave the door open for other competitor species (such as herbs or shrubs) to establish and use those resources, which in turn could result in plantation failure if not controlled [68]. Another potential issue could be the loss of underused nutrients in these areas by leaching [69].
At the stand level, the reduction of competition that is incurred by thinning involves a decrease in leaf area index (LAI) [70]. Since LAI is directly related to light interception and photosynthetic capacity [71], it strongly influences the wood productivity of a stand [72,73], which is thus expected to decrease immediately after thinning. Over the short term, reduction in LAI could be compensated by an increase in growth efficiency [74,75,76]. Over the mid term, the reduction in LAI due to thinning would progressively diminish due to an increase in leaf area of the remaining individual trees, which gradually fill the canopy gaps [77]. This response should contribute to the recovery of initial LAI and wood productivity and, thus, support the hypothesis of parallel volume trajectories between thinned and unthinned stands.
If increases in post-thinning growth efficiency or LAI are not sufficient to restore initial stand growth, divergent volume trajectories may occur [78]. When initial density was higher than 3000 stems ha−1 in Rotation 2 and 3, interspecific competition had negative effects on stand NPP. Thinning would reduce competition among trees for light and crown space, which is more important in even-aged, fast-growing plantations. The existence of competition-related negative effects on growth can be seen, as tree removal clearly maintained and improved survivor growth, and promoted forest stocks accumulation (Figure 2).
Longer rotations provide the ecosystem more time to recover from the human-induced disturbances, and longer rotations are likely more similar to the ecological rotation for natural conifer forests [20,21,79]. According to the current technical specifications for construction of ecological public welfare forests in China, rotation length was kept constant in 60 years for three consecutive rotations (total 180 years). However, in our simulations, it was clear that the available N in forest soil decreased along the three consecutive rotations. The decline in available N could be due to increased N use for tree productivity with stand development and, simultaneously, soil N availability limited by the reduced return of N from litterfall due to relatively low litterfall decomposition [80,81,82].
The reduction in N availability is probably the single most important factor causing the observed reduction in NPP over the rotations. This phenomenon could be neutralized by providing additional N inputs, for example, via fertilization. If more intense management (rotation lengths shorter than 60 years) is adopted for a long time, organic matter at these sites may decrease to levels low enough to affect tree production and site quality [58,79,83]. Decreases in soil organic matter also mean reductions in nutrient release from decomposing organic matter and decreases in the soil capacity to retain nutrients. As a consequence, there are less available nutrients resulting in a decrease in production [20].
In the optimal management regime, thinning treatments were applied in Rotation 2 and 3, which started with initial densities of 3000 or 4000 stems ha−1. Average NPP of the unthinned stands was the highest in Rotation 1 (Figure 3). On the other hand, available N in soil for both the 3000 and 4000 stems ha−1 initial densities in Rotation 1 were higher than uptake and demand N under non-thinning treatment (Figure 5). However, available N in soil for both the 3000 and 4000 stems ha−1 initial densities were higher under thinning treatments than non-thinning in Rotation 2 and 3. Given that organic matter is the main reservoir of nutrients (especially N), besides providing the soil with many physicochemical properties, maintaining acceptable levels of soil organic matter should be a priority when designing forest management plans [42,79,83]. After applying the identified optimal management plan, average NPP in Rotation 2 and Rotation 3 were higher than the average NPP of unthinned stands in the same period. M. glyptostroboides plantation forests have the capability to sequester carbon under the optimal management prescriptions in the long term. It is well known in fundamental ecological concepts that a developing forest ecosystem would aim at maximizing NPP in an attempt to accumulate biomass, whereas mature and stable ecosystems would instead aim at maximizing gross primary production, and maximizing the efficiency of energy utilization in sustaining the accumulated biomass. Although the work presented here was focused on finding out the most productive way to create plantations, in the long term, there would also be the need to manage the plantations to reduce their needs of external energy and fertilization/irrigation to make them truly self-sustainable.
We have to point out that fertilization treatments, widely used in the management of plantations in China, were not set in our management plans. As planted stands develop, the balance between N supply and N requirement for tree growth often changes [82]. We tentatively put forward that there is no critical need to fertilize these plantations at the current level because the N provided by decomposing litterfall and then by humus may be enough to support tree requirements (Figure 5). In addition, the effect of fertilization on the efficiency of forest carbon sequestration was still not clear [84]. However, if fertilization would be used as a way to maintain NPP levels in the second and third rotations, fertilization itself and the production of fertilizer would produce greenhouse gas emissions. As a result, the benefits of fertilization on the carbon sequestration potential of planted forests are still uncertain [14]. In fact, stand response to thinning and fertilization appears to depend on the initial nutrient pool and other soil physical and climatic factors [85].
On the other hand, forests planted in Shanghai’s urban belt could also get additional inputs from N deposition, which has been suggested to be a factor that is able to improve growth in companion species in the same region [58,69]. NPP is generally stimulated under elevated N supply [86,87]. However, forest inventory studies have also found that high N deposition reduced the growth of some species [88,89]. Because long-term data available on both N deposition and M. glyptostroboides growth are scarce, it is difficult to assess whether or not the negative responses of sensitive species to high N deposition are strong enough to affect NPP at regional scales [90].
Finally, when compared with traditional growth and yield tables, the capability to predict soil organic matter evolution, which has been proposed as an important indicator of forest management sustainability in the long term [79], is one of the main benefits of using forest models [23]. However, we should also point out that although being an ecosystem-level model, FORECAST does not currently include simulation of ecosystem features such as hydrology or microclimate (e.g., heat island effect in urban areas), which can affect nutrient cycles and are themselves affected by changing forms of management [20,91]. Therefore, a site-specific assessment of the importance of such ecological factors should be done before applying this model. In our case, we do not consider this to be a limitation, as annual precipitation in the region is high and water is not a limiting factor [68]. Considering the potential impacts of climate change in the future, we are aware of this and we would emphasize that the important part is not the absolute values but the trends and relative differences among scenarios. In other words, climate and other variables not simulated will affect the final absolute growth, but they would do that for all the scenarios, and therefore the relative differences among them will remain similar if not the same. In addition, the FORECAST-climate model, linking with the water-limitation model ForWaDy, has been developed. The FORECAST-climate model will work at daily time steps and use climate data directly for modeling tree growth [91]. This will make the FORECAST-climate sensitive to climate changes and more effective in simulating the process of plantation growth, forest hydrology, coupled carbon-water cycles, and carbon sinks under water-limited conditions [92]. This would be of great significance in the future research of the impacts of environmental change on forest productivity and carbon pools [93].

5. Conclusions

Initial stand density is the most important factor defining further management actions during the rotation. If initial stand density is lower than 3000 stems ha−1, intra-specific competition is low and hence thinning is not necessary. However, applying moderate thinning seems to be a suitable way to maintain or even increase NPP in densely stocked Metasequoia glyptostroboides stands (initial density equal to or above 3000 stems ha−1). In spite of this, some productivity losses over consecutive rotations seem to be inevitable unless fertilization, deposition, or alternation of planted species such as legumes compensate for the reductions in N availability. Finally, the use of an ecosystem-level forest model with field research on permanent plots has been proven to be a suitable way to assess the sustainability of alternative management regimes of a tree species.

Supplementary Materials

The following are available online at https://www.mdpi.com/1999-4907/9/2/64/s1, Figure S1: Study area of M. glyptostroboides plantations in SUFRN in Shanghai, Table S1: Description of M. glyptostroboides plantation plots in SUFRN, Table S2: The observed values for model evaluation.

Acknowledgments

This work is supported by the National Key R&D Program of China (2017YFC0505501), the National Natural Science Foundation of China (Grant No. 31400605), CFERN & BEIJING TECHNO SOLUTIONS Award Funds on excellent academic achievements, Shanghai Landscaping & City Appearance Administrative Bureau (G171206). Juan A. Blanco was funded through a Ramón y Cajal contract (ref. RYC-2011-08082) and a Marie Curie Action (ref CIG-2012-326718-ECOPYREN3).

Author Contributions

Conceived and designed the experiments: J.Z. and C.L. Collected field data: J.Z. and C.L. Calibrated the FORECAST model: J.A.B., J.Z., and X.W. Performed the experiments: J.Z. and J.A.B. Analyzed the data: J.Z. Wrote the paper: J.Z., C.L., and J.A.B.

Conflicts of Interest

The authors declare no conflict of interest.

References

  1. Liu, C.; Li, H.; He, X.; Chen, W.; Xu, W.; Zhao, G.; Ning, Z. Concept discussion and analysis of urban forest. Chin. J. Ecol. 2003, 22, 146–149. [Google Scholar]
  2. Dwyer, J.F.; Mcpherson, E.G.; Schroeder, H.W.; Rowntree, R.A. Assessing the benefits and costs of the urban forest. Transp. Res. Econ. Policy 1992, 18, 751–768. [Google Scholar]
  3. Mcpherson, E.G.; Nowak, D.; Heisler, G.; Grimmond, S.; Souch, C.; Grant, R.; Rowntree, R. Quantifying urban forest structure, function, and value: The Chicago urban forest climate project. Urban Ecosyst. 1997, 1, 49–61. [Google Scholar] [CrossRef]
  4. Mcpherson, E.G. Urban forestry: The final frontier? J. For. 2003, 101, 20–25. [Google Scholar]
  5. Velasco, E.; Roth, M.; Norford, L.; Molina, L.T. Does urban vegetation enhance carbon sequestration? Landsc. Urban Plan. 2016, 148, 99–107. [Google Scholar] [CrossRef]
  6. Boukili, V.K.S.; Bebber, D.P.; Mortimer, T.; Venicx, G.; Lefcourt, D.; Chandler, M.; Eisenberg, C. Assessing the performance of urban forest carbon sequestration models using direct measurements of tree growth. Urban For. Urban Green. 2017, 24, 212–221. [Google Scholar] [CrossRef]
  7. Yoon, T.K.; Park, C.W.; Sun, J.L.; Ko, S.; Kim, K.N.; Son, Y.; Lee, K.H.; Oh, S.; Lee, W.K.; Son, Y. Allometric equations for estimating the aboveground volume of five common urban street tree species in Daegu, Korea. Urban For. Urban Green. 2013, 12, 344–349. [Google Scholar] [CrossRef]
  8. Gao, X.; Dai, Y.; Han, Y.; Liu, Z.; Niu, X.; Liu, C.; Yin, S.; Wang, B. Forest Ecology Continuous Inventory System Layout and Network Construction Research in Shanghai; China Forestry Publishing House: Beijing, China, 2016. [Google Scholar]
  9. Wang, Z.; Cui, X.; Yin, S.; Shen, G.; Han, Y.; Liu, C. Characteristics of carbon storage in Shanghai’s urban forest. Chin. Sci. Bull. 2013, 58, 1130–1138. [Google Scholar] [CrossRef]
  10. Da, L.; Yang, T.; Song, Y. Study on the urban ecological regionalization and forest distribution in Shanghai, China. Sci. Silvae Sin. 2004, 40, 84–88. [Google Scholar]
  11. Wu, Z.; Wang, J. Opportunities and challenges of our urban forestry. J. Chin. Urban For. 2016, 14, 7–9. [Google Scholar]
  12. Zhang, X.W.; Zheng, C.M.; Tang, X.J.; Zhang, W.D. Assessment of comprehensive index for forest eco-function in shanghai municipality. Subtrop. Soil Water Conserv. 2015, 27, 34–37. [Google Scholar]
  13. Oliver, C.D.; Larson, B.C. Forest Stand Dynamics, Update ed.; John Wiley: New York, NY, USA, 1996. [Google Scholar]
  14. Yang, Y.S.; Chen, G.S.; Xie, J.S.; Fan, Y.X.; Guo, J.F.; Yang, Z.J. Strategy for carbon management in China’s forests. J. For. Environ. 2015, 35, 297–303. [Google Scholar]
  15. Dan, R.; Jan, F. Designing the urban forest of tomorrow: Pre-commercial thinning adapted for use in urban areas in Sweden. Arboric. J. 1998, 22, 147–171. [Google Scholar]
  16. Kimmins, J.P.; Blanco, J.A. Issues facing forest management in Canada, and predictive ecosystem management tools for assessing possible futures. In Landscape Ecology in Forest Management and Conservation; Li, C., Lafortezza, R., Chen, J., Eds.; Springer: Berlin/Heidelberg, Germany, 2011; pp. 46–72. [Google Scholar]
  17. Blanco, J.A.; González de Andrés, E.; San Emeterio, L.; Lo, Y.H. Modelling mixed forest stands: Methodological challenges and approaches. In Advanced Modelling Techniques Studying Glob. Changes in Environmental Sciences; Park, Y.S., Lek, S., Baehr, C., Jorgensen, S.E., Eds.; Elsevier: Amsterdam, The Netherlands, 2015; pp. 186–223. [Google Scholar]
  18. Lo, Y.H.; Blanco, J.A.; Kimmins, J.P.; Seely, B.; Welham, C. Linking climate change and forest ecophysiology to project future trends in tree growth: A review of forest models. In Climate Change—Research and Technology for Adaptation and Mitigation; Blanco, J.A., Kheradmand, H., Eds.; InTech: Rijeka, Croatia, 2011; pp. 63–86. [Google Scholar]
  19. Lo, Y.H.; Blanco, J.A.; Welham, C.; Wang, M. Maintaining ecosystem function by restoring forest biodiversity: Reviewing decision-support tools that link biology, hydrology and geochemistry. In Biodiversity in Ecosystems: Linking Structure and Function; Lo, Y.H., Blanco, J.A., Roy, S., Eds.; InTech: Rijeka, Croatia, 2015; pp. 143–167. [Google Scholar]
  20. Blanco, J.A.; Gonzalez, E. Exploring the sustainability of current management prescriptions for Pinus caribaea plantations in Cuba: A modelling approach. J. Trop. For. Sci. 2010, 22, 139–154. [Google Scholar]
  21. Kimmins, J.P. Forest Ecology: A Foundation for Sustainable Forest Management and Environmental Ethics in Forestry, 3rd ed.; Prentice Hall: Upper Saddle River, NJ, USA, 2004. [Google Scholar]
  22. DeAngelis, D.L.; Mooij, W.M. In praise of mechanistically rich models. In Models in Ecosystem Science; Canham, C.D., Cole, J.J., Lauenroth, W.K., Eds.; Princeton University Press: Princeton, NY, USA, 2003; p. 476. [Google Scholar]
  23. Kimmins, J.P.; Blanco, J.A.; Seely, B.; Welham, C.; Scoullar, K. Forecasting Forest Futures: A Hybrid Modelling Approach to the Assessment of Sustainability of Forest Ecosystems and Their Values; Earthscan: London, UK, 2010. [Google Scholar]
  24. Seely, B.; Welham, C.; Blanco, J.A. Towards the application of soil organic matter as an indicator of forest ecosystem productivity: Deriving thresholds, developing monitoring systems, and evaluating practices. Ecol. Indic. 2010, 10, 999–1008. [Google Scholar] [CrossRef]
  25. Kimmins, J.P.; Blanco, J.A.; Seely, B.; Welham, C.; Scoullar, K. Complexity in modelling forest ecosystems: How much is enough? For. Ecol. Manag. 2008, 256, 1646–1658. [Google Scholar] [CrossRef]
  26. Chu, K.-L.; Cooper, W.S. An ecological reconnaissance in the native home of Metasequoia Glyptostroboides. Ecology 1950, 31, 260–278. [Google Scholar] [CrossRef]
  27. Wilczyński, S.; Muter, E.; Wertz, B. The application of the tree-ring chronologies in assessing ecological requirements of Metasequoia glyptostroboides growing in southern Poland. Geochronometria 2014, 41, 129–135. [Google Scholar] [CrossRef]
  28. Zhang, W.; Feng, Z.; Wang, X.; Niu, J. Impacts of elevated ozone on growth and photosynthesis of metasequoia glyptostroboides hu et cheng. Plant Sci. 2014, 226, 182–188. [Google Scholar] [CrossRef] [PubMed]
  29. Kim, H.-J.; Lee, S.-H. Developing the volume models for 5 major species of street trees in gwangju metropolitan city of Korea. Urban For. Urban Green. 2016, 18, 53–58. [Google Scholar] [CrossRef]
  30. Tang, C.Q.; Yang, Y.; Ohsawa, M.; Momohara, A.; Hara, M.; Cheng, S.; Fan, S. Population structure of relict Metasequoia glyptostroboides and its habitat fragmentation and degradation in south-central China. Biol. Conserv. 2011, 144, 279–289. [Google Scholar] [CrossRef]
  31. Field, C.B. Primary production of the biosphere: Integrating terrestrial and oceanic components. Science 1998, 281, 237–240. [Google Scholar] [CrossRef] [PubMed]
  32. Subramanian, N.; Karlsson, P.E.; Bergh, J.; Nilsson, U. Impact of ozone on sequestration of carbon by swedish forests under a changing climate: A modeling study. For. Sci. 2014, 28, 101–110. [Google Scholar] [CrossRef]
  33. Wei, X.; Blanco, J.A. Significant increase in ecosystem c can be achieved with sustainable forest management in subtropical plantation forests. PLoS ONE 2014, 9, e89688. [Google Scholar] [CrossRef] [PubMed]
  34. Wei, X.; Zheng, J.; Liu, G.; Liu, S.; Wang, W.; Liu, Y.; BLANCO. The concept and application of carbon sequestration potentials in plantation forests. Acta Ecol. Sin. 2015, 35, 2–8. [Google Scholar]
  35. Kang, E.; Lu, L.; Xu, Z. Vegetation and carbon sequestration and their relation to water resources in an inland river basin of northwest China. J. Environ. Manag. 2007, 85, 702–710. [Google Scholar] [CrossRef] [PubMed]
  36. Dai, E.; Wu, Z.; Ge, Q.; Xi, W.; Wang, X. Predicting the responses of forest distribution and aboveground biomass to climate change under RCP scenarios in southern China. Glob. Chang. Biol. 2016, 22, 3642–3661. [Google Scholar] [CrossRef] [PubMed]
  37. Fang, J.; Guo, Z.; Hu, H.; Kato, T.; Muraoka, H.; Son, Y. Forest biomass carbon sinks in east Asia, with special reference to the relative contributions of forest expansion and forest growth. Glob. Chang. Biol. 2014, 20, 2019–2030. [Google Scholar] [CrossRef] [PubMed]
  38. Chinese Standard GB/T 33027-2016. In Methodology for Field Long-Term Observation of Forest Ecosystem; Standards Press of China: Beijing, China, 2016.
  39. Xu, N.; Zhang, T.; Wang, X.; Liu, H. Soil organic carbon storage changes in Yangtze delta region, China. Environ. Earth Sci. 2011, 63, 1021–1028. [Google Scholar]
  40. Zhao, D.; Kane, M.; Teskey, R.; Fox, T.R.; Albaugh, T.J.; Allen, H.L.; Rubilar, R. Maximum response of loblolly pine plantations to silvicultural management in the southern united states. For. Ecol. Manag. 2016, 375, 105–111. [Google Scholar] [CrossRef]
  41. Kimmins, J.P. Scientific Foundations for the Simulation of Ecosystem Function and Management in Forcyte-11; Information Report NOR-X-328; Northwest Region, Northern Forestry Centre: Edmonton, AB, Canada, 1993.
  42. Kimmins, J.P.; Mailly, D.; Seely, B. Modelling forest ecosystem net primary production: The hybrid simulation approach used in forecast. Ecol. Model. 1999, 122, 195–224. [Google Scholar] [CrossRef]
  43. Xiao, C.B.; Wang, H.; Fan, K.F.; Xavier, B.; Han, Y.J.; Kang, H.Z.; Liu, C.J. Carbon storage of metasequioa glyptostroboides plantation ecosystems at different age stages in Chongming island, east China. J. Shanghai Jiaotong Univ. (Agric. Sci.) 2010, 28, 30–34. [Google Scholar]
  44. Ding, Y.X.; Chen, J.L. Effect of continuous plantation of Chinese fir on soil fertility. Pedosphere 1995, 5, 57–66. [Google Scholar]
  45. Liao, L.P.; Ma, Y.Q.; Wang, S.L.; Gao, H.; Yu, X.J. Decomposition of leaf litter of Chinese-fir in mixture with major associated broad-leaved plantation species. Acta Phytoecol. Sin. 2000, 24, 27–33. [Google Scholar]
  46. Liu, F.; Luo, R.; Jiang, J. Quantities and effects of various phosphorus compounds in soil under chinese-fir plantation. J. Nanjing For. Univ. 1991, 4, 7–12. [Google Scholar]
  47. Tian, D.L. Study on bio-geochemistry cycling in Chinese-fir ecosystem. In studies on forest ecosystems in China. In Studies on Forest Ecosystems in China; Forestry Ministry of China Publishing House of Northeast Forestry University: Harbin, China, 1994; pp. 136–145. [Google Scholar]
  48. Tian, D.L.; Zhao, K. Studies on the litter in a Chinese-fir plantation ecosystem: (i) amounts, composition and dynamics of litter. J. Cent. South For. Inst. 1989, 9, 38–43. [Google Scholar]
  49. Yang, Y.S.; Chen, G.S.; Huang, B.L. Variation in the soil water and nutrients between different rotation stands of chinese-fir. J. Nanjing For. Univ. 2000, 24, 25–28. [Google Scholar]
  50. Zhou, X.; Luo, R.; Ye, J. Effect of continuous cropping with Chinese-fir upon soil nutrients and its feedback. J. Nanjing For. Univ. 1991, 3, 47–52. [Google Scholar]
  51. Hashimoto, S.; Wattenbach, M.; Smith, P. A new scheme for initializing process-based ecosystem models by scaling soil carbon pools. Ecol. Model. 2011, 222, 3598–3602. [Google Scholar] [CrossRef]
  52. Shi, M.; Yang, Z.-L.; Lawrence, D.M.; Dickinson, R.E.; Subin, Z.M. Spin-up processes in the community land model version 4 with explicit carbon and nitrogen components. Ecol. Model. 2013, 263, 308–325. [Google Scholar] [CrossRef]
  53. Guan, B.T.; Wright, W.E.; Chung, C.-H.; Chang, S.-T. ENSO and PDO strongly influence Taiwan spruce height growth. For. Ecol. Manag. 2012, 267, 50–57. [Google Scholar] [CrossRef]
  54. Theil, H. Applied Econometric Forecasting; North-Holland: Amsterdam, The Netherlands, 1966. [Google Scholar]
  55. Vanclay, J.K.; Skovsgaard, J.P. Evaluating forest growth models. Ecol. Model. 1997, 98, 1–12. [Google Scholar] [CrossRef] [Green Version]
  56. Freese, F. Testing accuracy. For. Sci. 1960, 6, 139–145. [Google Scholar]
  57. Reynolds, M.R. Estimating the error in model predictions. For. Sci. 1984. [Google Scholar]
  58. Blanco, J.A. Forests may need centuries to recover their original productivity after continuous intensive management: An example from douglas-fir stands. Sci. Total Environ. 2012, 437, 91–103. [Google Scholar] [CrossRef] [PubMed]
  59. Chinese Standard GB/T 18337.3-2001. In Non-Commercial Forest Construction-Technical Regulation; Standards Press of China: Beijing, China, 2001.
  60. Power, M. The predictive validation of ecological and environmental models. Ecol. Model. 1993, 68, 33–50. [Google Scholar] [CrossRef]
  61. Blanco, J.A.; Seely, B.; Welham, C.; Kimmins, J.P.H.; Seebacher, T.M. Testing the performance of a forest ecosystem model (FORECAST) against 29 years of field data in a Pseudotsuga menziesii plantation. Can. J. For. Res. 2007, 37, 1808–1820. [Google Scholar] [CrossRef]
  62. Zeide, B. Thinning and growth: A full turnaround. J. For. 2001, 99, 20–25. [Google Scholar]
  63. Pelletier, G.; Pitt, D.G. Silvicultural responses of two spruce plantations to midrotation commercial thinning in New Brunswick. Can. J. For. Res. 2008, 38, 851–867. [Google Scholar] [CrossRef]
  64. Beers, T.W. Components of forest growth. J. For. 1962, 60, 245–248. [Google Scholar]
  65. Marshall, D.D.; Curtis, R.O. Levels-of-Growing-Stock Cooperative Study in Douglas-Fir; Report No. 15—The Hoskins Study; U.S. Department of Agriculture: Washington, DC, USA, 2002; pp. 1963–1998.
  66. Soucy, M.; Lussier, J.-M.; Lavoie, L. Long-term effects of thinning on growth and yield of an upland black spruce stand. Can. J. For. Res. 2012, 42, 1669–1677. [Google Scholar] [CrossRef]
  67. Loftus, J. Economics and Biology of Commercial Thinning in Coastal British Columbia. In Proceedings of the Commercial Thinning Workshop, Whitecourt, AB, Canada, 17–18 October 1996; pp. 24–28. [Google Scholar]
  68. Bi, J.; Blanco, J.A.; Seely, B.; Kimmins, J.P.; Ding, Y.; Welham, C. Yield decline in Chinese-fir plantations: A simulation investigation with implications for model complexity. Can. J. For. Res. 2007, 37, 1615–1630. [Google Scholar] [CrossRef]
  69. Wei, X.; Blanco, J.A.; Jiang, H.; Kimmins, J.P.H. Effects of nitrogen deposition on carbon sequestration in chinese fir forest ecosystems. Sci. Total Environ. 2012, 416, 351–361. [Google Scholar] [CrossRef] [PubMed]
  70. Jack, S.B.; Long, J.N. Linkages between silviculture and ecology: An analysis of density management diagrams. For. Ecol. Manag. 1996, 86, 205–220. [Google Scholar] [CrossRef]
  71. Vose, J.M.; Allen, H.L. Leaf area, stemwood growth, and nutrition relationships in loblolly pine. For. Sci. 1988, 34, 547–563. [Google Scholar]
  72. Binkley, D.; Reid, P. Long-term responses of stem growth and leaf area to thinning and fertilization in a Douglas-fir plantation. Can. J. For. Res. 1984, 14, 656–660. [Google Scholar] [CrossRef]
  73. Perry, D. The competition process in forest stands. In Attributes of Trees as Crop Plants; Cannell, M.G.R., Jackson, J.E., Eds.; Institute of Terrestrial Ecology: Abbotts Ripton, UK, 1985; pp. 481–506. [Google Scholar]
  74. Brix, H. Effects of thinning and nitrogen fertilization on growth of Douglas-fir: Relative contribution of foliage quantity and efficiency. Can. J. For. Res. 1983, 13, 167–175. [Google Scholar] [CrossRef]
  75. Oren, R.; Waring, R.H.; Stafford, S.G.; Barrett, J.W. Twenty-four years of ponderosa pine growth in relation to canopy leaf area and understory competition. For. Sci. 1987, 33, 538–547. [Google Scholar]
  76. Velazquez-Martinez, A.; Perry, D.A.; Bell, T.E. Response of aboveground biomass increment, growth efficiency, and foliar nutrients to thinning, fertilization, and pruning in young Douglas-fir plantations in the central Oregon Cascades. Can. J. For. Res. 1992, 22, 1278–1289. [Google Scholar] [CrossRef]
  77. Pretzsch, H.; Mette, T. Linking stand-level self-thinning allometry to the tree-level leaf biomass allometry. Trees 2008, 22, 611–622. [Google Scholar] [CrossRef]
  78. Boivin-Dompierre, S.; Achim, A.; Pothier, D. Functional response of coniferous trees and stands to commercial thinning in eastern Canada. For. Ecol. Manag. 2017, 384, 6–16. [Google Scholar] [CrossRef]
  79. Morris, D.M.; Hamish Kimmins, J.P.; Duckert, D.R. The use of soil organic matter as a criterion of the relative sustainability of forest management alternatives: A modelling approach using forecast. For. Ecol. Manag. 1997, 94, 61–78. [Google Scholar] [CrossRef]
  80. Farley, K.A.; Kelly, E.F. Effects of afforestation of a páramo grassland on soil nutrient status. For. Ecol. Manag. 2004, 195, 281–290. [Google Scholar] [CrossRef]
  81. Polglase, P.J.; Attiwill, P.M. Nitrogen and phosphorus cycling in relation to stand age of Ecucalyptus regnans F. Muell. Plant Soil 1992, 142, 157–166. [Google Scholar] [CrossRef]
  82. Sun, Z.; Liu, L.; Peng, S.; Peñuelas, J.; Zeng, H.; Piao, S. Age-related modulation of the nitrogen resorption efficiency response to growth requirements and soil nitrogen availability in a temperate pine plantation. Ecosystems 2017, 19, 698–709. [Google Scholar] [CrossRef]
  83. Seely, B.; Welham, C.; Kimmins, H. Carbon sequestration in a boreal forest ecosystem: Results from the ecosystem simulation model, forecast. For. Ecol. Manag. 2002, 169, 123–135. [Google Scholar] [CrossRef]
  84. Parker, J.L.; Fernandez, I.J.; Rustad, L.E.; Norton, S.A. Effects of nitrogen enrichment, wildfire, and harvesting on forest-soil carbon and nitrogen. Soil Sci. Soc. Am. J. 2001, 65, 1248–1255. [Google Scholar] [CrossRef]
  85. Zhang, J.; Webster, J.; Young, D.H.; Fiddler, G.O. Effect of thinning and soil treatments on Pinus ponderosa plantations: 15-year results. For. Ecol. Manag. 2016, 368, 123–132. [Google Scholar] [CrossRef]
  86. LeBauer, D.S.; Treseder, K.K. Nitrogen limitation of net primary productivity in terrestrial ecosystems is globally distributed. Ecology 2008, 89, 371–379. [Google Scholar] [CrossRef] [PubMed]
  87. Lu, M.; Zhou, X.; Luo, Y.; Yang, Y.; Fang, C.; Chen, J.; Li, B. Minor stimulation of soil carbon storage by nitrogen addition: A meta-analysis. Agric. Ecosyst. Environ. 2011, 140, 234–244. [Google Scholar] [CrossRef]
  88. Environmental Protection Agency (EPA). Integrated Science Assessment for Oxides of Nitrogen and Sulfur—Environmental Criteria; National Center for Environmental Assessment, U.S. Environmental Protection Agency: Research Triangle Park, NC, USA, 2008.
  89. Thomas, R.Q.; Canham, C.D.; Weathers, K.C.; Goodale, C.L. Increased tree carbon storage in response to nitrogen deposition in the US. Nat. Geosci. 2010, 3, 229–244. [Google Scholar]
  90. Niu, S.; Classen, A.T.; Dukes, J.S.; Kardol, P.; Liu, L.; Luo, Y.; Rustad, L.; Sun, J.; Tang, J.; Templer, P.H.; et al. Global patterns and substrate-based mechanisms of the terrestrial nitrogen cycle. Ecol. Lett. 2016, 19, 697–709. [Google Scholar] [CrossRef] [PubMed]
  91. Seely, B.; Welham, C.; Scoullar, K. Application of a hybrid forest growth model to evaluate climate change impacts on productivity, nutrient cycling and mortality in a montane forest ecosystem. PLoS ONE 2015, 10, e0135034. [Google Scholar] [CrossRef] [PubMed]
  92. Wang, W.; Wei, X.; Liao, W.; Blanco, J.A.; Liu, Y.; Liu, S.; Liu, G.; Zhang, L.; Guo, X.; Guo, S. Evaluation of the effects of forest management strategies on carbon sequestration in evergreen broad-leaved (Phoebe bournei) plantation forests using forecast ecosystem model. For. Ecol. Manag. 2013, 300, 21–32. [Google Scholar] [CrossRef]
  93. Reyer, C. Forest productivity under environmental change—A review of stand-scale modeling studies. Curr. For. Rep. 2015, 1, 53–68. [Google Scholar] [CrossRef]
Figure 1. FORECAST predictions (solid lines) and field data obtained for Metasequoia glyptostroboides plantations (dots) for stemwood biomass (top panel), average DBH (medium panel), and dominant top height (bottom panel). Residuals for the linear regression of observed vs. predicted data are in the small panel for each variable. DBH = diameter at breast height.
Forests 09 00064 g001
Figure 2. Changes in net primary productivity (NPP) in stands with different initial densities in three rotations. Blue lines represent non-thinning, red lines represent 15% thinning intensity and 20th year of application of thinning in a rotation.
Forests 09 00064 g002
Figure 3. Distribution of simulated NPP in different rotations and stand densities for different thinning types. The red dot indicates the average NPP. Different letters indicate significant differences between thinning types with Tukey HSD (honest significant difference) test at p < 0.05.
Forests 09 00064 g003
Figure 4. NPP in stands with different initial stand densities in three rotations. Blue lines represent non-thinning, red lines represent optimal treatments. For the 3000 stems ha−1 stands, 25% thinning intensity and application of thinning in the 20th year occurred in Rotation 2 and 25% thinning intensity and application of thinning in the 10th year occurred in Rotation 3. For the 4000 stems ha−1 stands, 25% thinning intensity and application of thinning in the 10th year occurred in Rotation 2 and 40% thinning intensity and application of thinning in the 10th year occurred in Rotation 3.
Forests 09 00064 g004
Figure 5. Change in ecological variables in stands with different initial densities in 180 years of simulation under different thinning treatments and non-thinning. Panel A: 3000 stems ha−1, Panel B: 4000 stems ha−1, TD—total demand N; TU—total uptake N; TA—total available N in soil; optimal-TD—total demand N under optimal treatments; optimal-TU—total uptake N under optimal treatments; optimal-TA—total available N under optimal treatments.
Forests 09 00064 g005
Table 1. Indexes of FORECAST performance for simulation of Metasequoia glyptostroboides plantations established on sites of medium quality (SI = 16) in Shanghai, China. MAE = mean absolute error; ME = modelling efficiency; e* = Freese’s (1960) critical error.
IndexStemwood BiomassDBHTop Height
Average bias10.33 Mg ha−11.84 cm3.96 m
MAE14.91 Mg ha−12.61 cm4.39 m
R20.710.700.87
ME0.670.520.83
Theil’s U0.360.170.28
e*α = 0.0540.94 Mg ha−19.20 cm5.89 m
e*α = 0.2028.88 Mg ha−16.51 cm4.14 m
Table 2. Difference in accumulated NPP per rotation between thinning and non-thinning treatments. Positive values mean that the accumulated NPP in a rotation increased due to management compared with the non-thinning treatment. Maximum values in bold.
Stand Density (stems ha−1)RotationDifference in Accumulated NPP between Thinning and Non-Thinning Treatments (Mg ha−1)
15%-10y15%-15y15%-20y25%-10y25%-15y25%-20y40%-10y40%-15y40%-20y
30001−47.20 −31.03−30.90−98.96−75.11−63.54−208.88−175.10−148.63
2−2.88 −26.08−14.192.409.6810.49−92.23−97.57−99.31
3−12.42 −22.11−11.5622.719.6712.69−24.65−52.56−43.77
40001−32.80 −23.51−26.34−60.13−53.29−51.28−133.88−116.82−110.12
2−16.29 −10.21−7.184.00−30.14−46.49−8.04−30.62−61.60
3−8.33 −2.00−6.15−1.52−7.00−12.0113.90−8.91−5.16
Table 3. Difference in accumulated NPP between optimal thinning and non-thinning treatments. Positive values mean accumulated NPP in a rotation increased due to management. * means average NPP under a thinning treatment in a rotation is significantly different from non-thinned (p < 0.05), a means Welch’s Test, b means ANOVA.
Stand Density (stems ha−1)RotationThinning TreatmentDifference in Accumulated NPP (Mg ha−1)
Per RotationIn Three Rotations
3000225%-20y32.9865.55
325%-10y32.57
4000225%-10y69.01 *,a114.84
340%-10y45.83 *,b

