Leaf Nitrogen and Phosphorus Stoichiometry of Cyclocarya paliurus across China


Abstract
1. Introduction
2. Materials and Methods
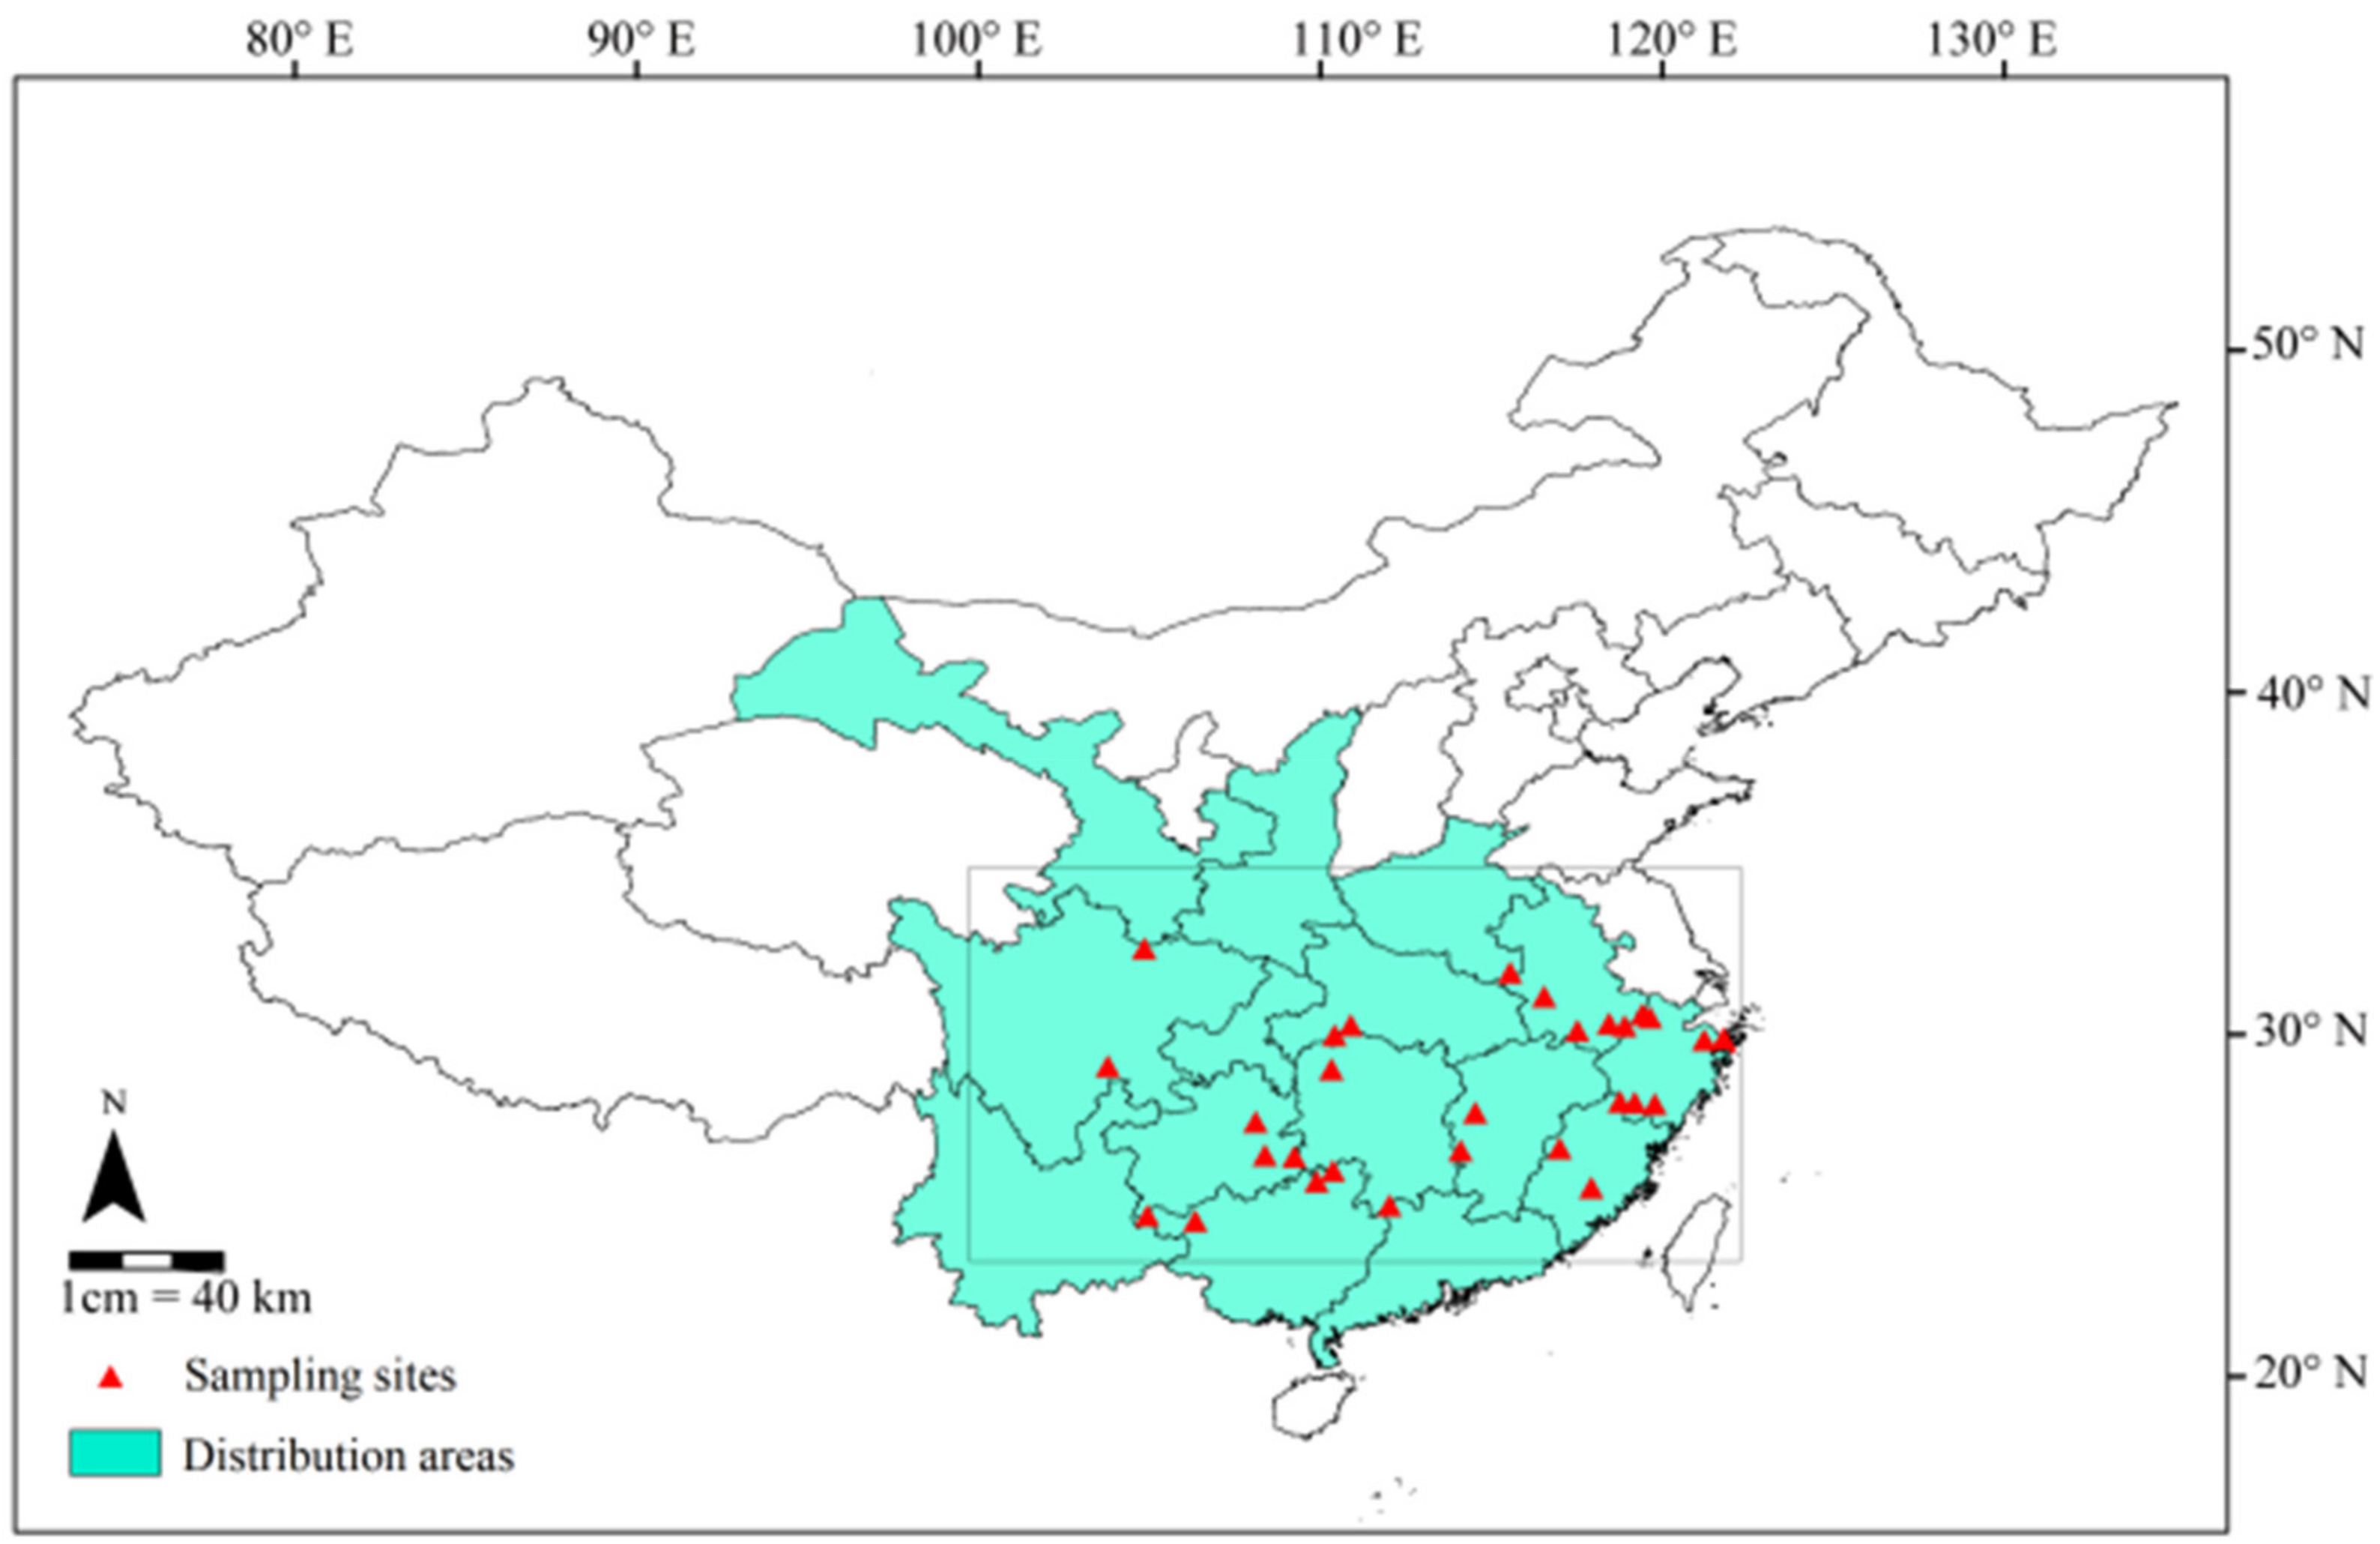
2.1. Study Areas and Materials
2.2. Measurements
2.3. Data Analysis
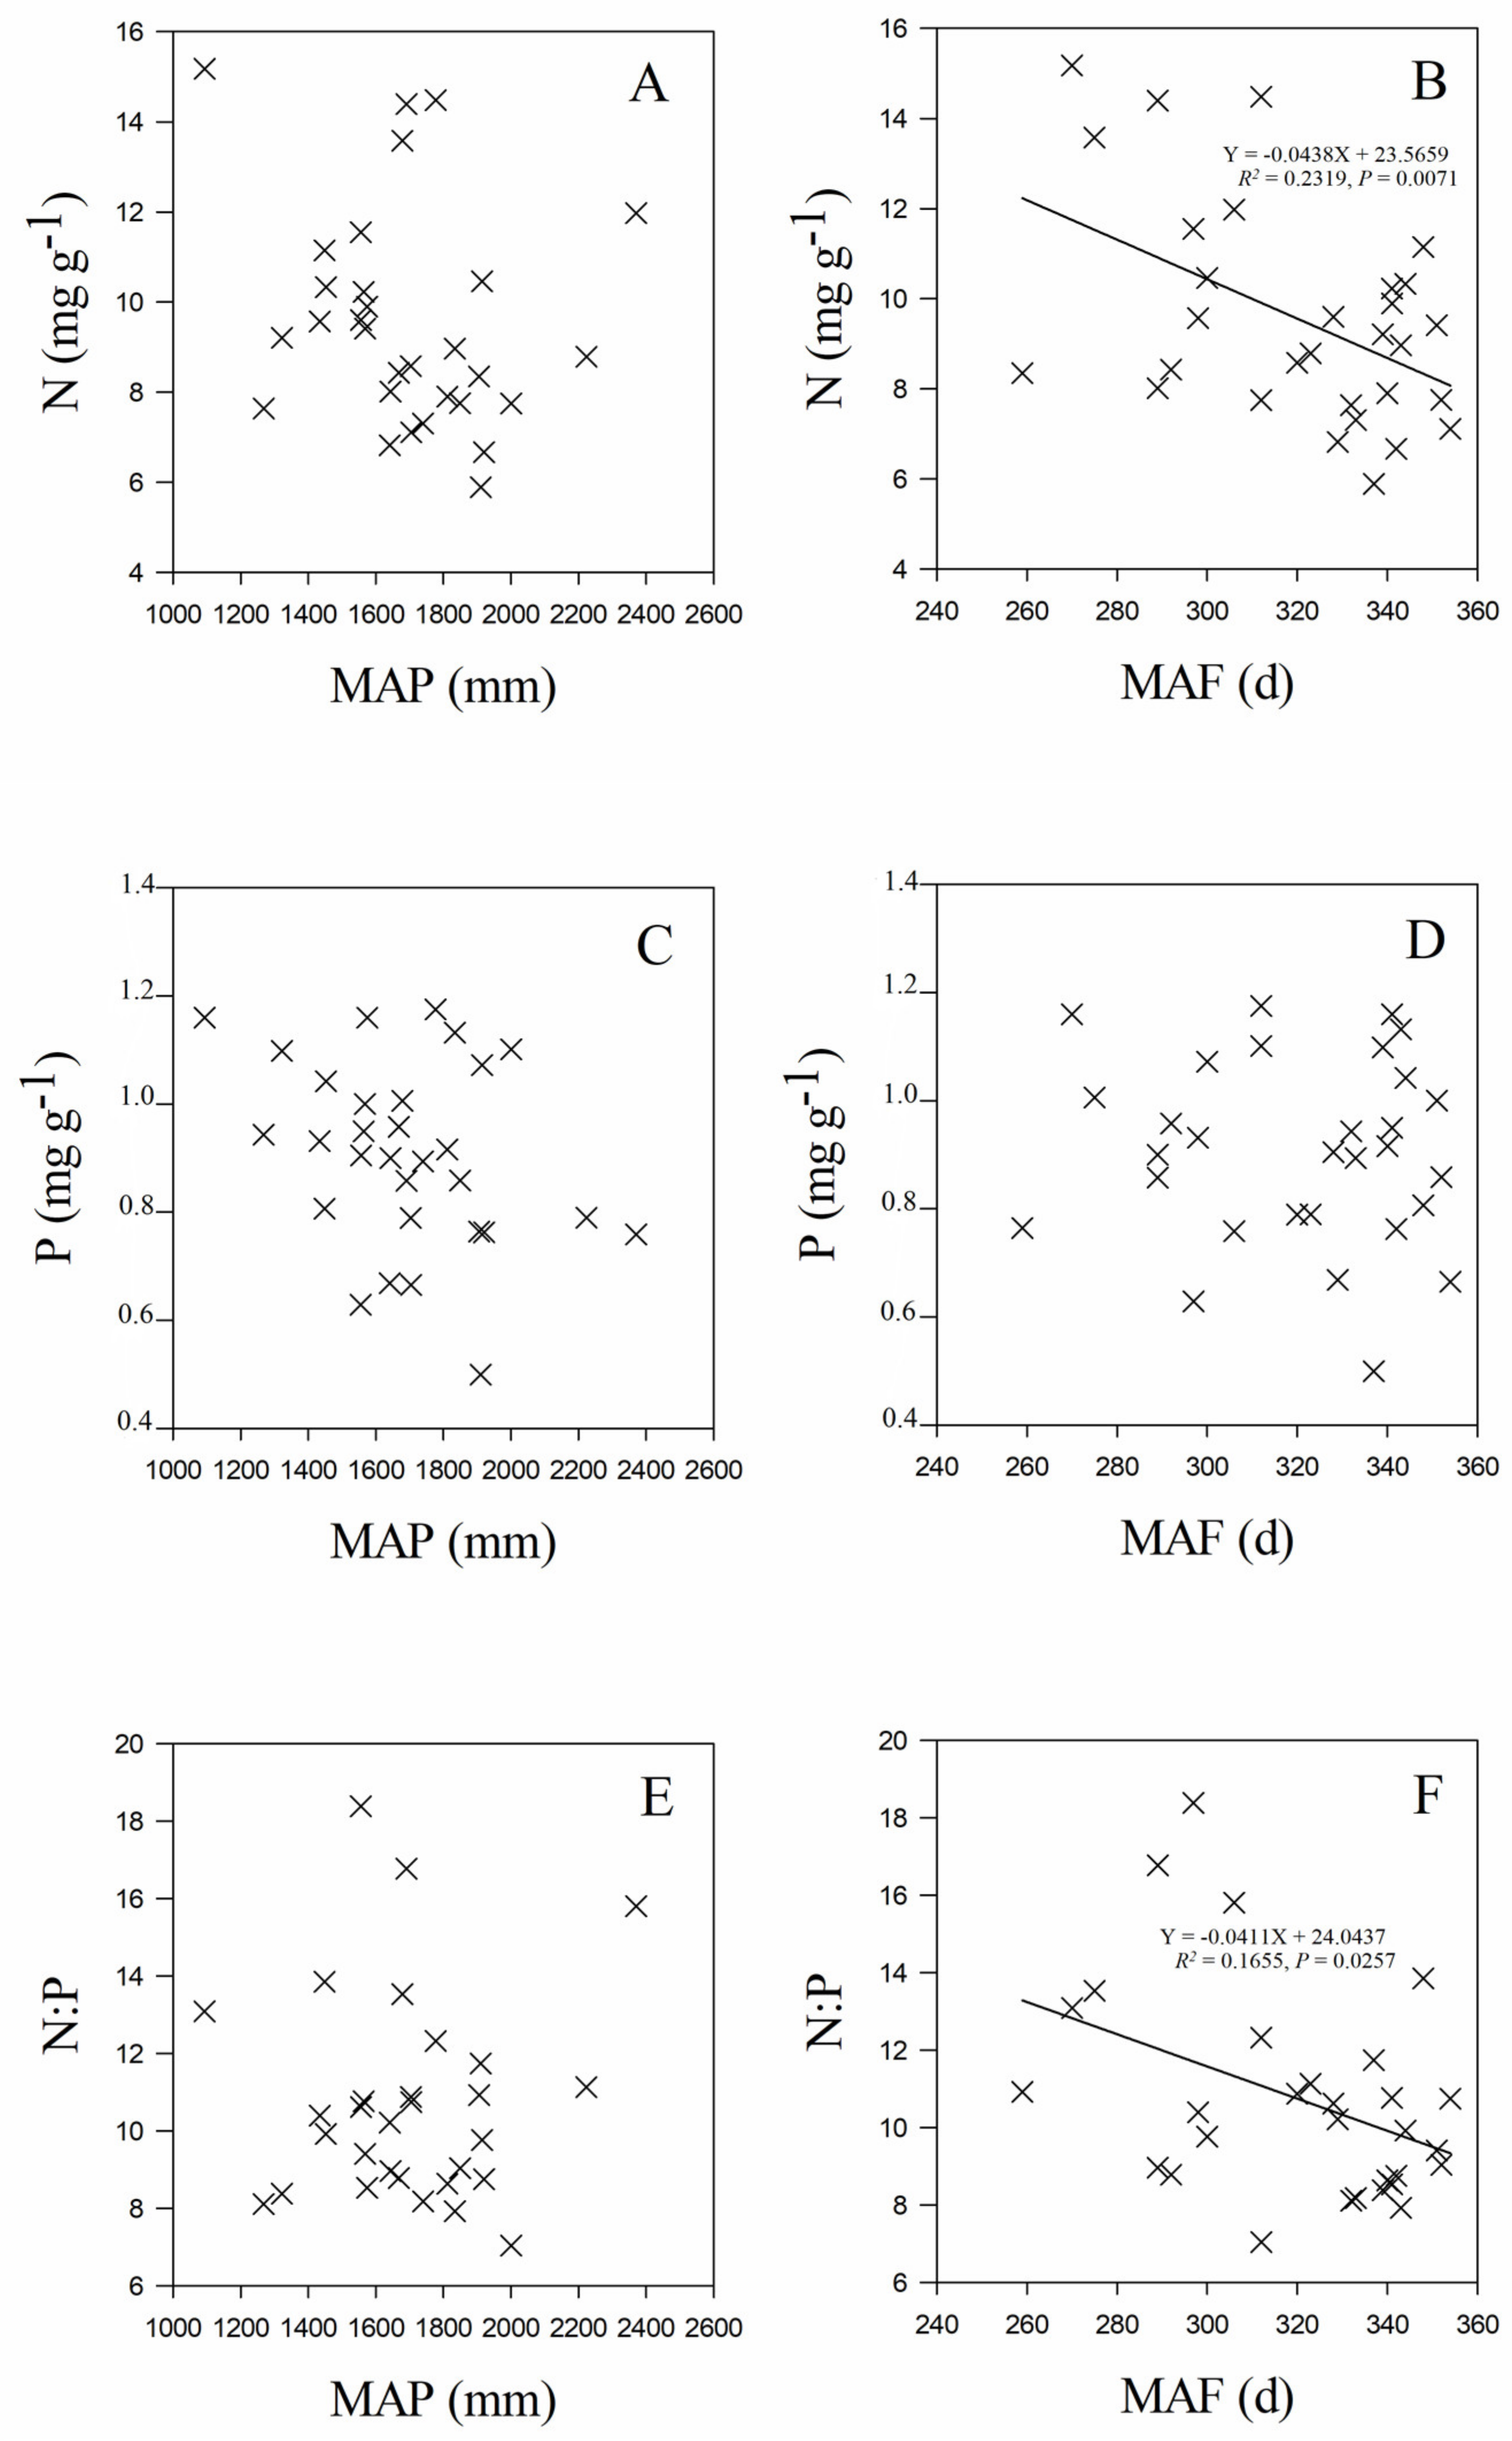
3. Results
3.1. Variation in Leaf Stoichiometry among C. paliurus Populations
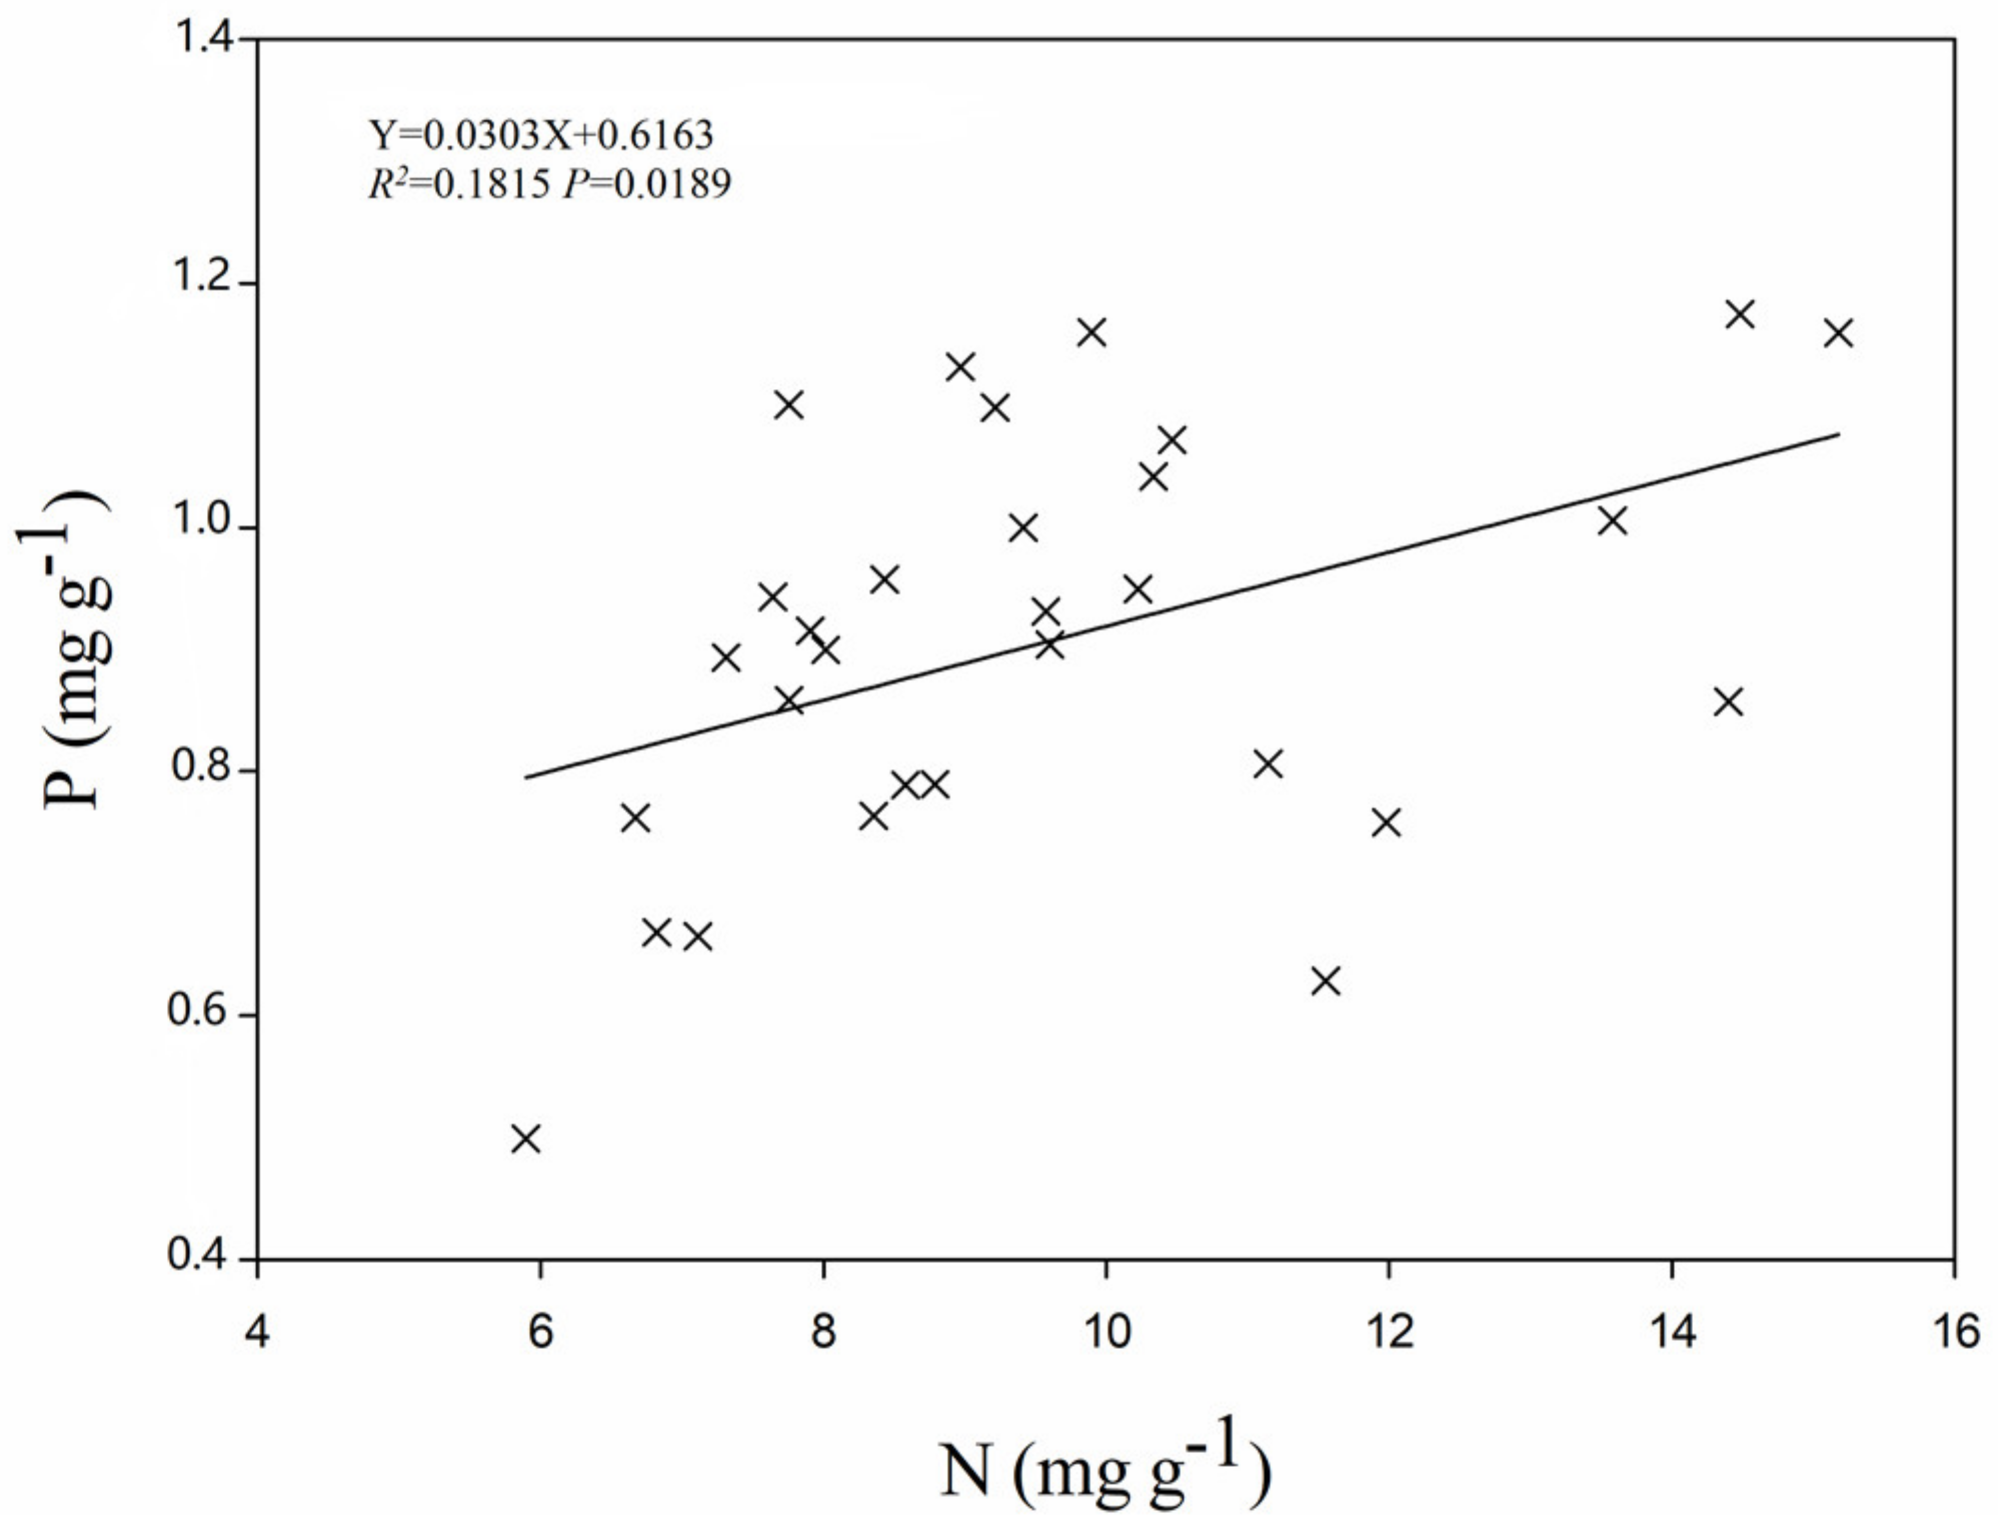
3.2. Soil Properties and Their Relationships with Leaf Stoichiometry
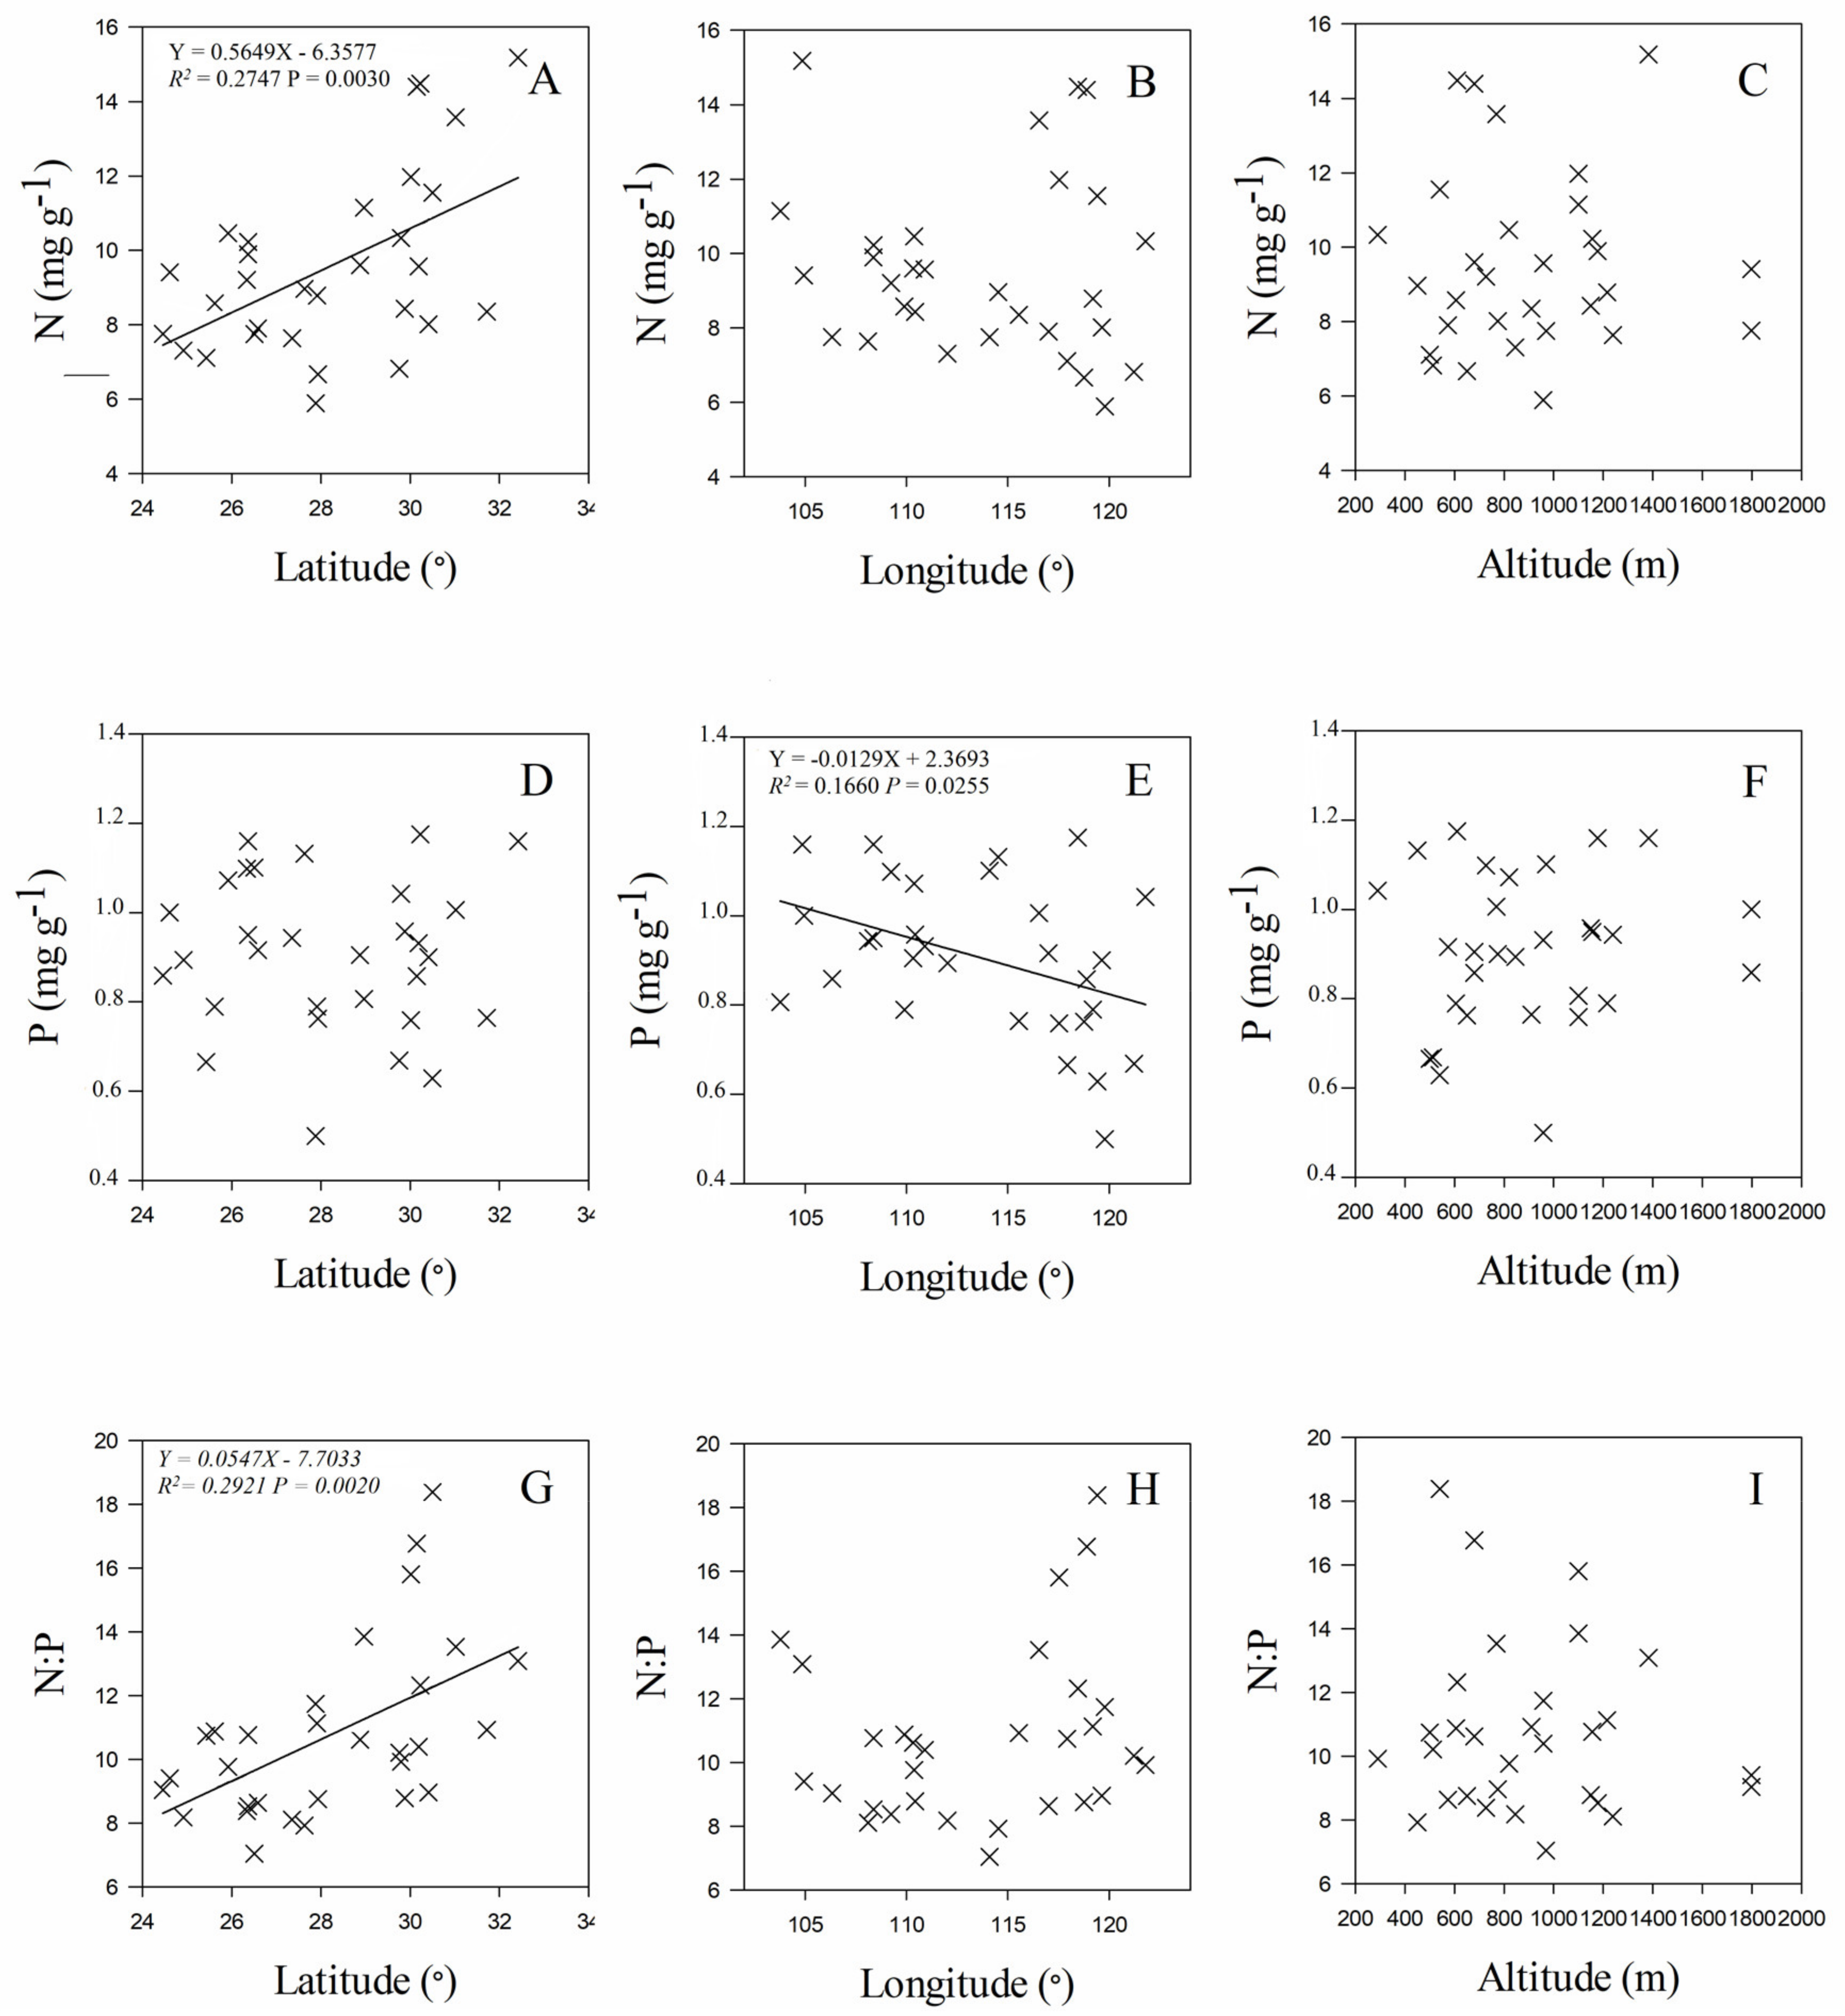
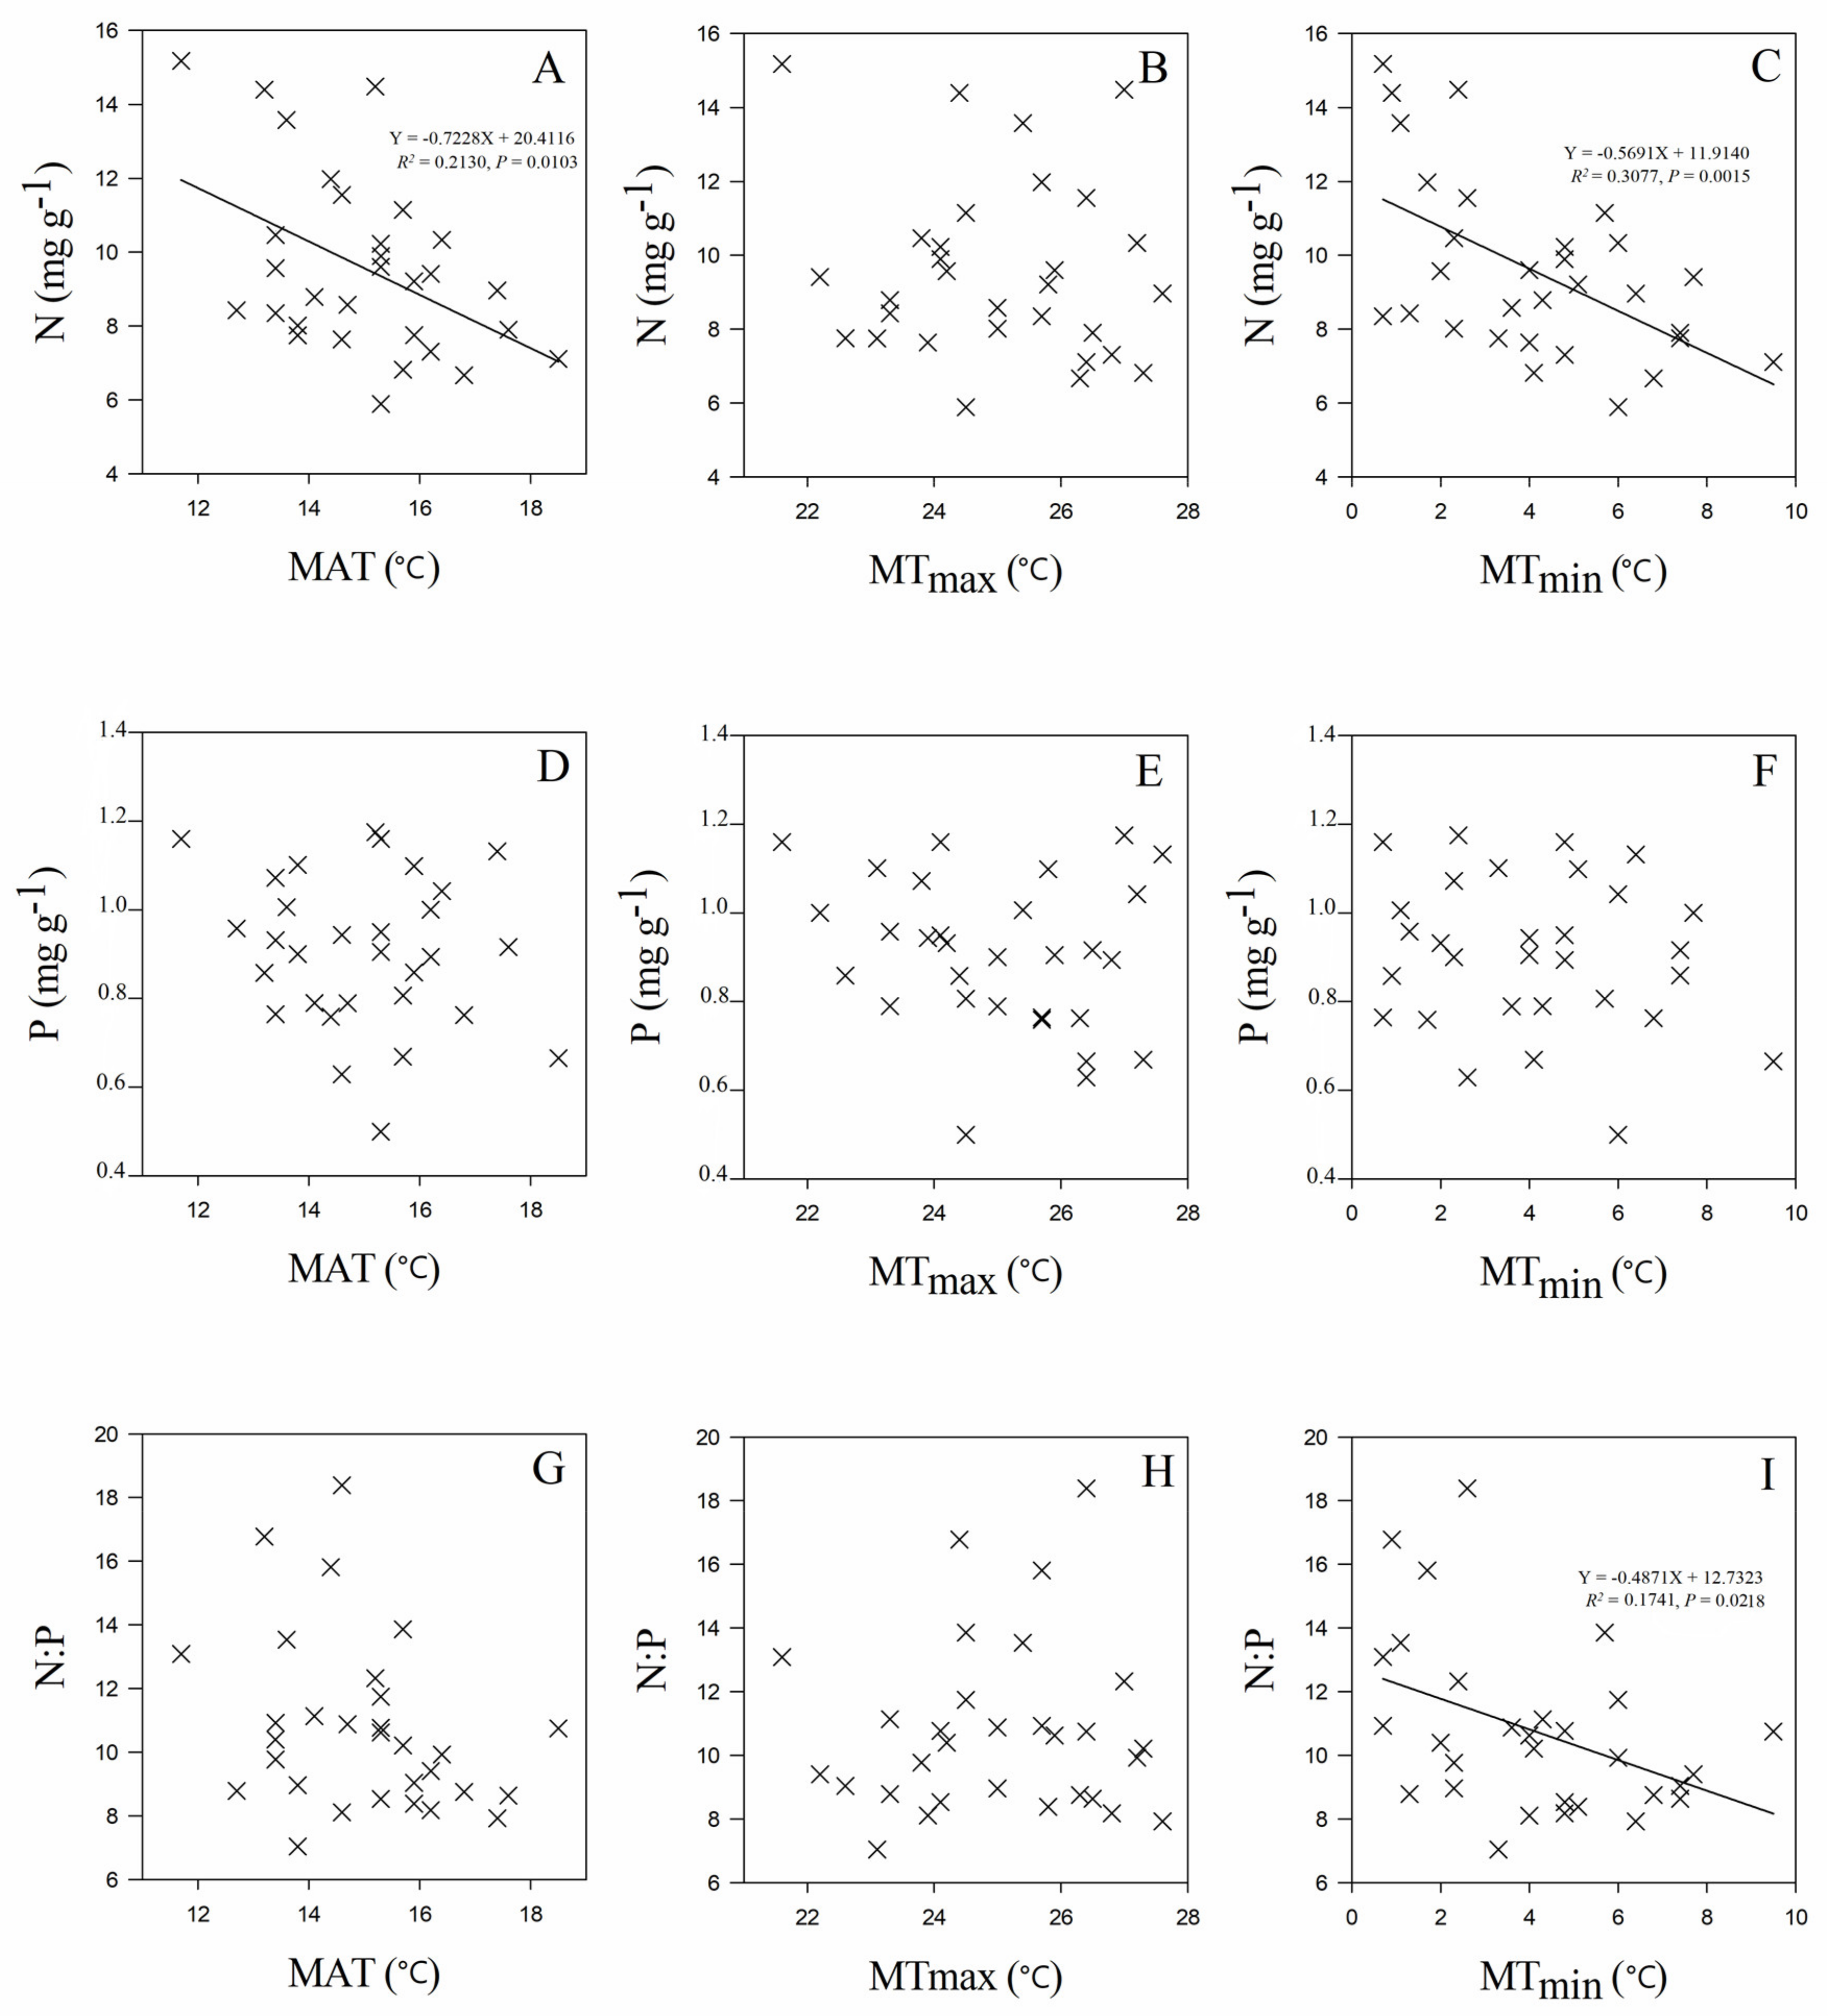
3.3. Leaf Stoichiometry in Relation to Geographic and Climate Variables
4. Discussion
4.1. Patterns of Leaf Stoichiometry of C. paliurus across China
4.2. Leaf N and P Stoichiometry in Relation to Soil Properties, Geographic Origins and Climate Factors
5. Conclusions
Author Contributions
Funding
Conflicts of Interest
References
- Allen, A.P.; Gillooly, J.F. Towards an integration of ecological stoichiometry and the metabolic theory of ecology to better understand nutrient cycling. Ecol. Lett. 2009, 12, 369–384. [Google Scholar] [CrossRef] [PubMed]
- Elser, J.J.; Sterner, R.W.; Gorokhova, E.A.; Fagan, W.F.; Markow, T.A.; Cotner, J.B.; Weider, L.W. Biological stoichiometry from genes to ecosystems. Ecol. Lett. 2000, 3, 540–550. [Google Scholar] [CrossRef]
- Venterink, H.O.; Güsewell, S. Competitive interactions between two meadow grasses under nitrogen and phosphorus limitation. Funct. Ecol. 2010, 24, 877–886. [Google Scholar] [CrossRef]
- Pang, D.; Wang, G.; Li, G.; Sun, Y.; Liu, Y.; Zhou, J. Ecological stoichiometric characteristics of two typical plantations in the karst ecosystem of southwestern China. Forests 2018, 9, 56. [Google Scholar] [CrossRef]
- Zhang, P.; Wang, H.; Wu, Q.; Yu, M.; Wu, T. Effect of wind on the relation of leaf N, P stoichiometry with leaf morphology in Quercus species. Forests 2018, 9, 110. [Google Scholar] [CrossRef]
- Reich, P.B.; Oleksyn, J. Global patterns of plant leaf N and P in relation to temperature and latitude. Proc. Natl. Acad. Sci. 2004, 101, 11001–11006. [Google Scholar] [CrossRef] [PubMed]
- Han, W.; Fang, J.; Guo, D.; Zhang, Y. Leaf nitrogen and phosphorus stoichiometry across 753 terrestrial plant species in China. New Phytol. 2005, 168, 377–385. [Google Scholar] [CrossRef] [PubMed]
- Rentería, L.Y.; Jaramillo, V.J. Rainfall drives leaf traits and leaf nutrient resorption in a tropical dry forest in Mexico. Oecologia 2011, 165, 201–211. [Google Scholar] [CrossRef] [PubMed]
- Wu, T.; Dong, Y.; Yu, M.; Wang, G.G.; Zeng, D.H. Leaf nitrogen and phosphorus stoichiometry of Quercus species across China. For. Ecol. Manag. 2012, 284, 116–123. [Google Scholar] [CrossRef]
- Jiang, P.; Chen, Y.; Cao, Y. C: N: P stoichiometry and carbon storage in a naturally-regenerated secondary Quercus variabilis forest age sequence in the Qinling Mountains, China. Forests 2017, 8, 281. [Google Scholar] [CrossRef]
- Chen, Y.; Han, W.; Tang, L.; Tang, Z.; Fang, J. Leaf nitrogen and phosphorus concentrations of woody plants differ in responses to climate, soil and plant growth form. Ecography 2013, 36, 178–184. [Google Scholar] [CrossRef]
- Ordoñez, J.C.; Van Bodegom, P.M.; Witte, J.P.M.; Wright, I.J.; Reich, P.B.; Aerts, R. A global study of relationships between leaf traits, climate and soil measures of nutrient fertility. Glob. Ecol. Biogeogr. 2009, 18, 137–149. [Google Scholar] [CrossRef]
- McGroddy, M.E.; Daufresne, T.; Hedin, L.O. Scaling of C:N:P stoichiometry in forests worldwide: Implications of terrestrial redfield-type ratios. Ecology 2004, 85, 2390–2401. [Google Scholar] [CrossRef]
- Kang, H.; Zhuang, H.; Wu, L.; Liu, Q.; Shen, G.; Berg, B.; Liu, C. Variation in leaf nitrogen and phosphorus stoichiometry in Picea abies across Europe: An analysis based on local observations. For. Ecol. Manag. 2011, 261, 195–202. [Google Scholar] [CrossRef]
- Sardans, J.; Rivas-Ubach, A.; Peñuelas, J. The C:N:P stoichiometry of organisms and ecosystems in a changing world: A review and perspectives. Perspect. Plant Ecol. 2012, 14, 33–47. [Google Scholar] [CrossRef]
- Zhang, S.B.; Zhang, J.L.; Slik, J.F.; Cao, K.F. Leaf element concentrations of terrestrial plants across China are influenced by taxonomy and the environment. Glob. Ecol. Biogeogr. 2012, 21, 809–818. [Google Scholar] [CrossRef]
- Yin, X. Variation in foliar nitrogen concentration by forest type and climatic gradients in North America. Can. J. For. Res. 1993, 23, 1587–1602. [Google Scholar] [CrossRef]
- Gotelli, N.J.; Mouser, P.J.; Hudman, S.P.; Morales, S.E.; Ross, D.S.; Ellison, A.M. Geographic variation in nutrient availability, stoichiometry, and metal concentrations of plants and pore-water in ombrotrophic bogs in New England, USA. Wetlands 2008, 28, 827–840. [Google Scholar] [CrossRef]
- Townsend, A.R.; Cleveland, C.C.; Asner, G.P.; Bustamante, M.M. Controls over foliar N:P ratios in tropical rain forests. Ecology 2007, 88, 107–118. [Google Scholar] [CrossRef]
- Elser, J.J.; Fagan, W.F.; Kerkhoff, A.J.; Swenson, N.G.; Enquist, B.J. Biological stoichiometry of plant production: Metabolism, scaling and ecological response to global change. New Phytol. 2010, 186, 593–608. [Google Scholar] [CrossRef] [PubMed]
- Hall, E.K.; Maixner, F.; Franklin, O.; Daims, H.; Richter, A.; Battin, T. Linking microbial and ecosystem ecology using ecological stoichiometry: a synthesis of conceptual and empirical approaches. Ecosystems 2011, 14, 261–273. [Google Scholar] [CrossRef]
- Oleksyn, J.; Reich, P.B.; Zytkowiak, R.; Karolewski, P.; Tjoelker, M.G. Nutrient conservation increases with latitude of origin in European Pinus sylvestris populations. Oecologia 2003, 136, 220–235. [Google Scholar] [CrossRef] [PubMed]
- Fang, S.; Wang, J.; Wei, Z.; Zhu, Z. Methods to break seed dormancy in Cyclocarya paliurus (Batal) Iljinskaja. Sci. Hortic. 2006, 110, 305–309. [Google Scholar] [CrossRef]
- Liu, Y.; Fang, S.; Zhou, M.; Shang, X.; Yang, W.; Fu, X. Geographic variation in water-soluble polysaccharide content and antioxidant activities of Cyclocarya paliurus leaves. Ind. Crop. Prod. 2018, 121, 180–186. [Google Scholar] [CrossRef]
- Ladanai, S.; Ågren, G.I. Temperature sensitivity of nitrogen productivity for Scots pine and Norway spruce. Trees 2004, 18, 312–319. [Google Scholar] [CrossRef]
- Briceno-Elizondo, E.; Garcia-Gonzalo, J.; Peltola, H.; Matala, J.; Kellomäki, S. Sensitivity of growth of Scots pine, Norway spruce and silver birch to climate change and forest management in boreal conditions. For. Ecol. Manag. 2006, 232, 152–167. [Google Scholar] [CrossRef]
- Liu, Y.; Cao, Y.; Fang, S.; Wang, T.; Yin, Z.; Shang, X.; Fu, X. Antidiabetic effect of Cyclocarya paliurus leaves depends on the contents of antihyperglycemic flavonoids and antihyperlipidemic triterpenoids. Molecules 2018, 23, 1042. [Google Scholar] [CrossRef]
- Liu, Y.; Chen, P.; Zhou, M.; Wang, T.; Fang, S.; Shang, X.; Fu, X. Geographic variation in the chemical composition and antioxidant properties of phenolic compounds from Cyclocarya paliurus (Batal) Iljinskaja leaves. Molecules 2018, 23, 2440. [Google Scholar] [CrossRef]
- Xie, J.H.; Dong, C.J.; Nie, S.P.; Li, F.; Wang, Z.J.; Shen, M.Y.; Xie, M.Y. Extraction, chemical composition and antioxidant activity of flavonoids from Cyclocarya paliurus (Batal.) Iljinskaja leaves. Food Chem. 2015, 186, 97–105. [Google Scholar] [CrossRef]
- Fang, S.; Yang, W.; Chu, X.; Shang, X.; She, C.; Fu, X. Provenance and temporal variations in selected flavonoids in leaves of Cyclocarya paliurus. Food Chem. 2011, 124, 1382–1386. [Google Scholar] [CrossRef]
- Deng, B.O.; Shang, X.; Fang, S.; Li, Q.; Fu, X.; Su, J. Integrated effects of light intensity and fertilization on growth and flavonoid accumulation in Cyclocarya paliurus. J. Agric. Food Chem. 2012, 60, 6286–6292. [Google Scholar] [CrossRef] [PubMed]
- Liu, Y.; Fang, S.; Yang, W.; Shang, X.; Fu, X. Light quality affects flavonoid production and related gene expression in Cyclocarya paliurus. J. Photochem. Photobiol. B Biol. 2018, 179, 66–73. [Google Scholar] [CrossRef] [PubMed]
- Liu, Y.; Qian, C.; Ding, S.; Shang, X.; Yang, W.; Fang, S. Effect of light regime and provenance on leaf characteristics, growth and flavonoid accumulation in Cyclocarya paliurus (Batal) Iljinskaja coppices. Bot. Stud. 2016, 57, 28. [Google Scholar] [CrossRef] [PubMed]
- Liu, Y.; Wang, T.; Fang, S.; Zhou, M.; Qin, J. Responses of morphology, gas exchange, photochemical activity of photosystem II, and antioxidant balance in Cyclocarya paliurus to light spectra. Front. Plant Sci. 2018, 9, 1704. [Google Scholar] [CrossRef] [PubMed]
- Wang, T.; Wang, G.; Innes, J.L.; Seely, B.; Chen, B. ClimateAP: An application for dynamic local downscaling of historical and future climate data in Asia Pacific. Front. Agric. Sci. Eng. 2017, 4, 448–458. [Google Scholar] [CrossRef]
- Wang, T.; Campbell, E.M.; O’Neill, G.A.; Aitken, S.N. Projecting future distributions of ecosystem climate niches: Uncertainties and management applications. For. Ecol. Manag. 2012, 279, 128–140. [Google Scholar] [CrossRef]
- Jiao, F.; Shi, X.R.; Han, F.P.; Yuan, Z.Y. Increasing aridity, temperature and soil pH induce soil CNP imbalance in grasslands. Sci. Rep. 2016, 6, 19601. [Google Scholar] [CrossRef] [PubMed]
- Yan, D.L.; Huang, Y.J.; Jin, S.H.; Huang, J.Q. Temporal variation of C, N, P stoichiometric in functional organs rootlets, leaves of Carya cathayensis and forest soil (in Chinese). J. Soil Water Conserv. 2013, 5, 256–259. [Google Scholar]
- Niklas, K.J.; Cobb, E.D. Biomass partitioning and leaf N, P-stoichiometry: comparisons between tree and herbaceous current-year shoots. Plant Cell Environ. 2006, 29, 2030–2042. [Google Scholar] [CrossRef] [PubMed]
- Yuan, Z.Y.; Li, L.H.; Han, X.G.; Huang, J.H.; Jiang, G.M.; Wan, S.Q.; Chen, Q.S. Nitrogen resorption from senescing leaves in 28 plant species in a semi-arid region of northern China. J. Arid Environ. 2005, 63, 191–202. [Google Scholar] [CrossRef]
- Batjes, N.H. A Homogenized Soil Data File for Global Environmental Research: A Subset of FAO, ISRIC and NRCS Profiles (Version 1.0) (No. 95/10b); ISRIC: Wageningen, The Netherlands, 1995. [Google Scholar]
- Han, W.X.; Fang, J.Y.; Reich, P.B.; Ian Woodward, F.; Wang, Z.H. Biogeography and variability of eleven mineral elements in plant leaves across gradients of climate, soil and plant functional type in China. Ecol. Lett. 2011, 14, 788–796. [Google Scholar] [CrossRef] [PubMed]
- He, J.S.; Wang, L.; Flynn, D.F.; Wang, X.; Ma, W.; Fang, J. Leaf nitrogen: Phosphorus stoichiometry across Chinese grassland biomes. Oecologia 2008, 155, 301–310. [Google Scholar] [CrossRef] [PubMed]
- Zhang, L.X.; Bai, Y.F.; Han, X.G. Application of N:P stoichiometry to ecology studies. Acta Bot. Sin. 2003, 45, 1009–1018. [Google Scholar]
- Li, H.; Crabbe, M.J.C.; Xu, F.; Wang, W.; Niu, R.; Gao, X.; Chen, H. Seasonal variations in carbon, nitrogen and phosphorus concentrations and C:N:P stoichiometry in the leaves of differently aged Larix principis-rupprechtii Mayr. plantations. Forests 2017, 8, 373. [Google Scholar] [CrossRef]
- Koerselman, W.; Meuleman, A.F. The vegetation N:P ratio: A new tool to detect the nature of nutrient limitation. J. Appl. Ecol. 1996, 33, 1441–1450. [Google Scholar] [CrossRef]
- Aerts, R.; Chapin, F.S. The mineral nutrition of wild plants revisited: A reevaluation of processes and patterns. Adv. Ecol. Res. 2000, 30, 1–67. [Google Scholar]
- Woods, H.A.; Makino, W.; Cotner, J.B.; Hobbie, S.E.; Harrison, J.F.; Acharya, K.; Elser, J.J. Temperature and the chemical composition of poikilothermic organisms. Funct. Ecol. 2003, 17, 237–245. [Google Scholar] [CrossRef]
- Van de Waal, D.B.; Verschoor, A.M.; Verspagen, J.M.; van Donk, E.; Huisman, J. Climate-driven changes in the ecological stoichiometry of aquatic ecosystems. Front. Ecol. Environ. 2010, 8, 145–152. [Google Scholar] [CrossRef]
- Zhang, C.; Tian, H.; Liu, J.; Wang, S.; Liu, M.; Pan, S.; Shi, X. Pools and distributions of soil phosphorus in China. Glob. Biogeochem. Cycles 2005. [Google Scholar] [CrossRef]
- Wendroth, O.; Vasquez, V.; Matocha, C.J. Field experimental approach to bromide leaching as affected by scale-specific rainfall characteristics. Water Resour. Res. 2011. [Google Scholar] [CrossRef]
- Wu, T.; Wang, G.G.; Wu, Q.; Cheng, X.; Yu, M.; Wang, W.; Yu, X. Patterns of leaf nitrogen and phosphorus stoichiometry among Quercus acutissima provenances across China. Ecol. Complex. 2014, 17, 32–39. [Google Scholar] [CrossRef]


| Sample ID | Locations | Longitude (°) | Latitude (°) | Altitude (m) | MAP (mm) | MAT (°C) | MTmax (°C) | MTmin (°C) | MAF (d) | Leaf N (mg g−1) | Leaf P (mg g−1) | N:P |
|---|---|---|---|---|---|---|---|---|---|---|---|---|
| HF | Hefeng, Hubei | 110.42 | 29.88 | 1150 | 1669 | 12.7 | 23.3 | 1.3 | 292 | 8.43 ± 1.38 h~n | 0.96 ± 0.03 fg | 8.78 ± 1.21 j~o |
| WF | Wufeng, Hubei | 110.90 | 30.19 | 959 | 1434 | 13.4 | 24.2 | 2 | 298 | 9.57 ± 0.46 e~i | 0.93 ± 0.13 f~h | 10.40 ± 1.40 f~k |
| LS | Longsheng, Guangxi | 109.89 | 25.62 | 606 | 1704 | 14.7 | 25 | 3.6 | 320 | 8.58 ± 0.49 g~m | 0.79 ± 0.01 ij | 10.88 ± 0.65 e~h |
| ZY | Ziyuan, Guangxi | 110.38 | 25.92 | 820 | 1915 | 13.4 | 23.8 | 2.3 | 300 | 10.47 ± 1.11 c~f | 1.07 ± 0.03 cde | 9.77 ± 1.04 g~n |
| BS | Baise, Guangxi | 106.34 | 24.46 | 1798 | 1850 | 15.9 | 22.6 | 7.4 | 352 | 7.76 ± 0.22 i~o | 0.86 ± 0.01 hi | 9.04 ± 0.35 h~n |
| JZS | Jinzhongshan, Guangxi | 104.95 | 24.61 | 1798 | 1568 | 16.2 | 22.2 | 7.7 | 351 | 9.41 ± 1.18 f~j | 1.00 ± 0.01 ef | 9.40 ± 1.08 g~n |
| JGS | Jinggangshan, Jiangxi | 114.10 | 26.51 | 970 | 2001 | 13.8 | 23.1 | 3.3 | 312 | 7.75 ± 0.82 i~o | 1.10 ± 0.04 a~d | 7.04 ± 0.65 o |
| FY | Fenyi, Jiangxi | 114.53 | 27.63 | 450 | 1834 | 17.4 | 27.6 | 6.4 | 343 | 8.97 ± 0.67 f~l | 1.13 ± 0.01 abc | 7.92 ± 0.56 no |
| GNJ | Guniujiang, Anhui | 117.53 | 30.02 | 1100 | 2371 | 14.4 | 25.7 | 1.7 | 306 | 11.98 ± 1.04 c | 0.76 ± 0.01 j | 15.81 ± 1.44 b |
| JD | Jingde, Anhui | 118.45 | 30.23 | 610 | 1777 | 15.2 | 27 | 2.4 | 312 | 14.48 ± 0.75 ab | 1.18 ± 0.01 a | 12.32 ± 0.56 cde |
| SC | Sucheng, Anhui | 116.54 | 31.02 | 769 | 1679 | 13.6 | 25.4 | 1.1 | 275 | 13.58 ± 1.91 b | 1.01 ± 0.06 ef | 13.53 ± 1.16 c |
| QLF | Qingliangfeng, Anhui | 118.89 | 30.15 | 680 | 1691 | 13.2 | 24.4 | 0.9 | 289 | 14.40 ± 1.68 ab | 0.86 ± 0.03 hi | 16.77 ± 1.54 b |
| QC | Qingchuan, Sichuan | 104.86 | 32.42 | 1383 | 1093 | 11.7 | 21.6 | 0.7 | 270 | 15.18 ± 1.16 a | 1.16 ± 0.03 ab | 13.09 ± 0.95 cd |
| MC | Muchuan, Sichuan | 103.78 | 28.97 | 1100 | 1448 | 15.7 | 24.5 | 5.7 | 348 | 11.15 ± 0.59 cde | 0.80 ± 0.09 ij | 13.86 ± 1.32 c |
| LP | Liping, Guizhou | 109.24 | 26.34 | 727 | 1322 | 15.9 | 25.8 | 5.1 | 339 | 9.21 ± 0.75 f~k | 1.10 ± 0.02 bcd | 8.38 ± 0.58 l~o |
| LGS | Leigongshan, Guizhou | 108.38 | 26.37 | 1178 | 1574 | 15.3 | 24.1 | 4.8 | 341 | 9.89 ± 0.17 e~h | 1.16 ± 0.03 ab | 8.53 ± 0.07 k~o |
| BWS | Bawanshan, Guizhou | 108.38 | 26.37 | 1156 | 1564 | 15.3 | 24.1 | 4.8 | 341 | 10.22 ± 0.39 d~g | 0.95 ± 0.02 fg | 10.77 ± 0.32 e~i |
| SQ | Shiqian, Guizhou | 108.11 | 27.35 | 1239 | 1268 | 14.6 | 23.9 | 4 | 332 | 7.64 ± 0.16 k~o | 0.94 ± 0.04 fg | 8.11 ± 0.28 mno |
| YS | Yongshun, Hunan | 110.33 | 28.88 | 680 | 1556 | 15.3 | 25.9 | 4 | 328 | 9.60 ± 0.28 e~i | 0.90 ± 0.02 gh | 10.62 ± 0.44 e~j |
| JH | Jianhe, Hunan | 112.03 | 24.92 | 845 | 1740 | 16.2 | 26.8 | 4.8 | 333 | 7.31 ± 0.88 l~p | 0.89 ± 0.02 gh | 8.18 ± 0.95 mno |
| PC | Pucheng, Fujian | 118.76 | 27.93 | 650 | 1921 | 16.8 | 26.3 | 6.8 | 342 | 6.67 ± 0.37 op | 0.76 ± 0.02 j | 8.75 ± 0.48 j~o |
| NML | Niumulin, Fujian | 117.93 | 25.43 | 500 | 1705 | 18.5 | 26.4 | 9.5 | 354 | 7.11 ± 1.04 m~p | 0.66 ± 0.03 k | 10.75 ± 1.19 e~i |
| MX | Mingxi, Fujian | 117.01 | 26.59 | 574 | 1812 | 17.6 | 26.5 | 7.4 | 340 | 7.91 ± 1.00 i~o | 0.92 ± 0.02 gh | 8.63 ± 0.98 k~o |
| SCH | Shangcheng, Henan | 115.55 | 31.72 | 910 | 1906 | 13.4 | 25.7 | 0.7 | 259 | 8.35 ± 0.86 h~o | 0.76 ± 0.03 j | 10.92 ± 0.77 e~h |
| WC | Wencheng, Zhejiang | 119.79 | 27.88 | 959 | 1911 | 15.3 | 24.5 | 6 | 337 | 5.89 ± 0.17 p | 0.50 ± 0.07 l | 11.74 ± 0.83 def |
| FH | Fenghua, Zhejiang | 121.22 | 29.76 | 513 | 1641 | 15.7 | 27.3 | 4.1 | 329 | 6.82 ± 0.88 n~p | 0.67 ± 0.08 k | 10.21 ± 0.71 f~l |
| LQ | Longquan, Zhejiang | 119.19 | 27.91 | 1216 | 2224 | 14.1 | 23.3 | 4.3 | 323 | 8.79 ± 0.34 f~m | 0.79 ± 0.03 ij | 11.13 ± 0.25 efg |
| NB | Ningbo, Zhejiang | 121.79 | 29.80 | 290 | 1452 | 16.4 | 27.2 | 6 | 344 | 10.33 ± 0.77 def | 1.04 ± 0.01 de | 9.92 ± 0.80 f~m |
| MW | Meiwu, Zhejiang | 119.64 | 30.41 | 774 | 1643 | 13.8 | 25 | 2.3 | 289 | 8.02 ± 0.11 i~o | 0.90 ± 0.08 gh | 8.96 ± 0.81 i~n |
| LWS | Laowangshan, Zhejiang | 119.41 | 30.50 | 540 | 1555 | 14.6 | 26.4 | 2.6 | 297 | 11.55 ± 0.26 b~f | 0.63 ± 0.02 k | 18.39 ± 0.39 a |
| Sample ID | Locations | Organic C (mg g−1) | Total N (mg g−1) | Total P (mg g−1) |
|---|---|---|---|---|
| HF | Hefeng, Hubei | 28.41 ± 1.01 ijk | 2.07 ± 0.06 gh | 1.45 ± 0.23 c~f |
| WF | Wufeng, Hubei | 47.46 ± 6.79 d~h | 2.72 ± 0.10 e~h | 1.30 ± 0.24 d~g |
| LS | Longsheng, Guangxi | 50.53 ± 1.74 c~f | 4.21 ± 0.62 bcd | 1.29 ± 0.13 d~g |
| ZY | Ziyuan, Guangxi | 31.05 ± 4.62 ijk | 3.80 ± 0.84 b~e | 0.88 ± 0.08 efg |
| BS | Baise, Guangxi | 51.33 ± 6.22 c~f | 3.48 ± 0.21 c~g | 0.76 ± 0.13 g |
| JZS | Jinzhongshan, Guangxi | 52.54 ± 1.97 b~f | 4.44 ± 0.82 abc | 3.51 ± 0.97 a |
| JGS | Jinggangshan, Jiangxi | 45.64 ± 3.57 e~h | 4.94 ± 0.78 ab | 1.67 ± 0.16 cde |
| FY | Fenyi, Jiangxi | 45.57 ± 5.57 e~h | 3.93 ± 0.75 b~e | 1.13 ± 0.02 d~g |
| GNJ | Guniujiang, Anhui | 36.03 ± 2.10 h~k | 2.14 ± 0.16 gh | 0.80 ± 0.16 fg |
| JD | Jingde, Anhui | 37.49 ± 4.33 g~j | 2.17 ± 0.26 fgh | 1.83 ± 0.22 bcd |
| SC | Sucheng, Anhui | 49.76 ± 1.43 c~g | 4.13 ± 0.27 b~e | 2.18 ± 0.16 bc |
| QLF | Qingliangfeng, Anhui | sm | sm | sm |
| QC | Qingchuan, Sichuan | 31.55 ± 4.91 ijk | 2.79 ± 0.24 d~h | 0.95 ± 0.05 efg |
| MC | Muchuan, Sichuan | 35.73 ± 2.11 h~k | 2.67 ± 0.17 e~h | 0.80 ± 0.19 fg |
| LP | Liping, Guizhou | 58.22 ± 3.91 bcd | 3.90 ± 0.58 b~e | 1.57 ± 0.10 c~f |
| LGS | Leigongshan, Guizhou | 75.82 ± 5.73 a | 5.84 ± 0.66a | 1.37 ± 0.24 d~g |
| BWS | Bawanshan, Guizhou | 56.21 ± 2.39 b~e | 3.98 ± 0.42 b~e | 1.23 ± 0.06 d~g |
| SQ | Shiqian, Guizhou | 54.58 ± 2.27 b~e | 3.80 ± 0.38 b~e | 1.86 ± 0.25 bcd |
| YS | Yongshun, Hunan | 25.99 ± 2.52 jk | 1.94 ± 0.19 h | 0.96 ± 0.10 efg |
| JH | Jianhe, Hunan | 24.04 ± 0.52 k | 1.97 ± 0.23 h | 1.49 ± 0.29 c~f |
| PC | Pucheng, Fujian | 47.28 ± 1.40 d~h | 3.92 ± 0.25 b~e | 1.17 ± 0.15 d~g |
| NML | Niumulin, Fujian | 40.55 ± 5.23 f~i | 3.34 ± 0.13 c~h | 0.92 ± 0.22 efg |
| MX | Mingxi, Fujian | 55.25 ± 3.32 b~e | 4.12 ± 0.24 b~e | 1.12 ± 0.05 d~g |
| SCH | Shangcheng, Henan | 61.30 ± 3.38 bc | 4.64 ± 0.16 abc | 3.52 ± 0.20 a |
| WC | Wencheng, Zhejiang | 64.82 ± 4.20 ab | 3.45 ± 0.23 c~g | 0.85 ± 0.03 fg |
| FH | Fenghua, Zhejiang | 47.97 ± 2.28 d~h | 4.05 ± 0.75 b~e | 2.57 ± 0.25 b |
| LQ | Longquan, Zhejiang | 36.21 ± 1.20 h~k | 2.71 ± 0.07 e~h | 0.79 ± 0.06 fg |
| NB | Ningbo, Zhejiang | 58.83 ± 5.47 bcd | 4.23 ± 0.50 bcd | 1.18 ± 0.19 d~g |
| MW | Meiwu, Zhejiang | 64.10 ± 0.86 ab | 4.79 ± 0.57 abc | 2.17 ± 0.17 bc |
| LWS | Laowangshan, Zhejiang | 61.36 ± 2.41 bc | 3.60 ± 0.46 b~f | 1.39 ± 0.02 def |
| Leaf Stoichiometry | Soil Properties | ||
|---|---|---|---|
| Organic C (mg g−1) | Total N (mg g−1) | Total P (mg g−1) | |
| Leaf N (mg g−1) | −0.222 | −0.245 | −0.063 |
| Leaf P (mg g−1) | −0.102 | 0.152 | 0.065 |
| Leaf N:P | −0.073 | −0.337 | −0.140 |
| Data Source | Leaf N (mg g−1) | Leaf P (mg g−1) | N:P | References | |||
|---|---|---|---|---|---|---|---|
| Range | Mean | Range | Mean | Range | Mean | ||
| Present study | 5.89–15.18 | 9.57 | 0.50–1.18 | 0.91 | 7.04–18.39 | 10.51 | |
| Carya cathayensis Sarg. in China | 13.10–24.65 | 19.92 | 1.24–2.70 | 1.75 | 8.83–15.31 | 11.92 | ref. [38] |
| Juglans nigra Linn. in the USA | - | 15.90 | - | 1.70 | - | - | ref. [39] |
| China’s flora | 6.25–52.61 | 20.24 | 0.05–10.27 | 1.45 | 3.28–78.89 | 16.35 | ref. [7] |
| The global flora | 4.10–59.9 | 20.10 | 0.10–6.99 | 1.77 | 2.60–111.80 | 13.80 | ref. [6] |
© 2018 by the authors. Licensee MDPI, Basel, Switzerland. This article is an open access article distributed under the terms and conditions of the Creative Commons Attribution (CC BY) license (http://creativecommons.org/licenses/by/4.0/).
Share and Cite
Liu, Y.; Liu, Q.; Wang, T.; Fang, S. Leaf Nitrogen and Phosphorus Stoichiometry of Cyclocarya paliurus across China. Forests 2018, 9, 771. https://doi.org/10.3390/f9120771
Liu Y, Liu Q, Wang T, Fang S. Leaf Nitrogen and Phosphorus Stoichiometry of Cyclocarya paliurus across China. Forests. 2018; 9(12):771. https://doi.org/10.3390/f9120771
Chicago/Turabian StyleLiu, Yang, Qingliang Liu, Tongli Wang, and Shengzuo Fang. 2018. "Leaf Nitrogen and Phosphorus Stoichiometry of Cyclocarya paliurus across China" Forests 9, no. 12: 771. https://doi.org/10.3390/f9120771
APA StyleLiu, Y., Liu, Q., Wang, T., & Fang, S. (2018). Leaf Nitrogen and Phosphorus Stoichiometry of Cyclocarya paliurus across China. Forests, 9(12), 771. https://doi.org/10.3390/f9120771