1. Introduction
Various timber harvesting systems have been developed to implement silvicultural treatments (e.g., clearcut, commercial thinning, and selective harvesting) under a wide range of vegetation and terrain conditions [
1]. Involving multiple machines and operators, timber harvesting is a complex process that, if poorly designed and implemented, could become dangerous, costly or environmentally damaging. Efforts to understand harvesting system performance and the ability to identify the most suitable system for given operational conditions are essential to achieve safe, economically viable, and environmentally sound harvesting operations.
Time study (TS) techniques have been widely applied to timber harvesting operations to understand the performance of individual harvesting machines as well as the entire system [
2]. In general, the field-collected data are used to model the productivity of individual machines based on independent variables (e.g., stand density, skidding distance, terrain slope, tree size, etc.) through regression. These regression models are then used to predict machine productivity in productive machine hours (PMH) in various scenarios under similar work conditions [
3,
4,
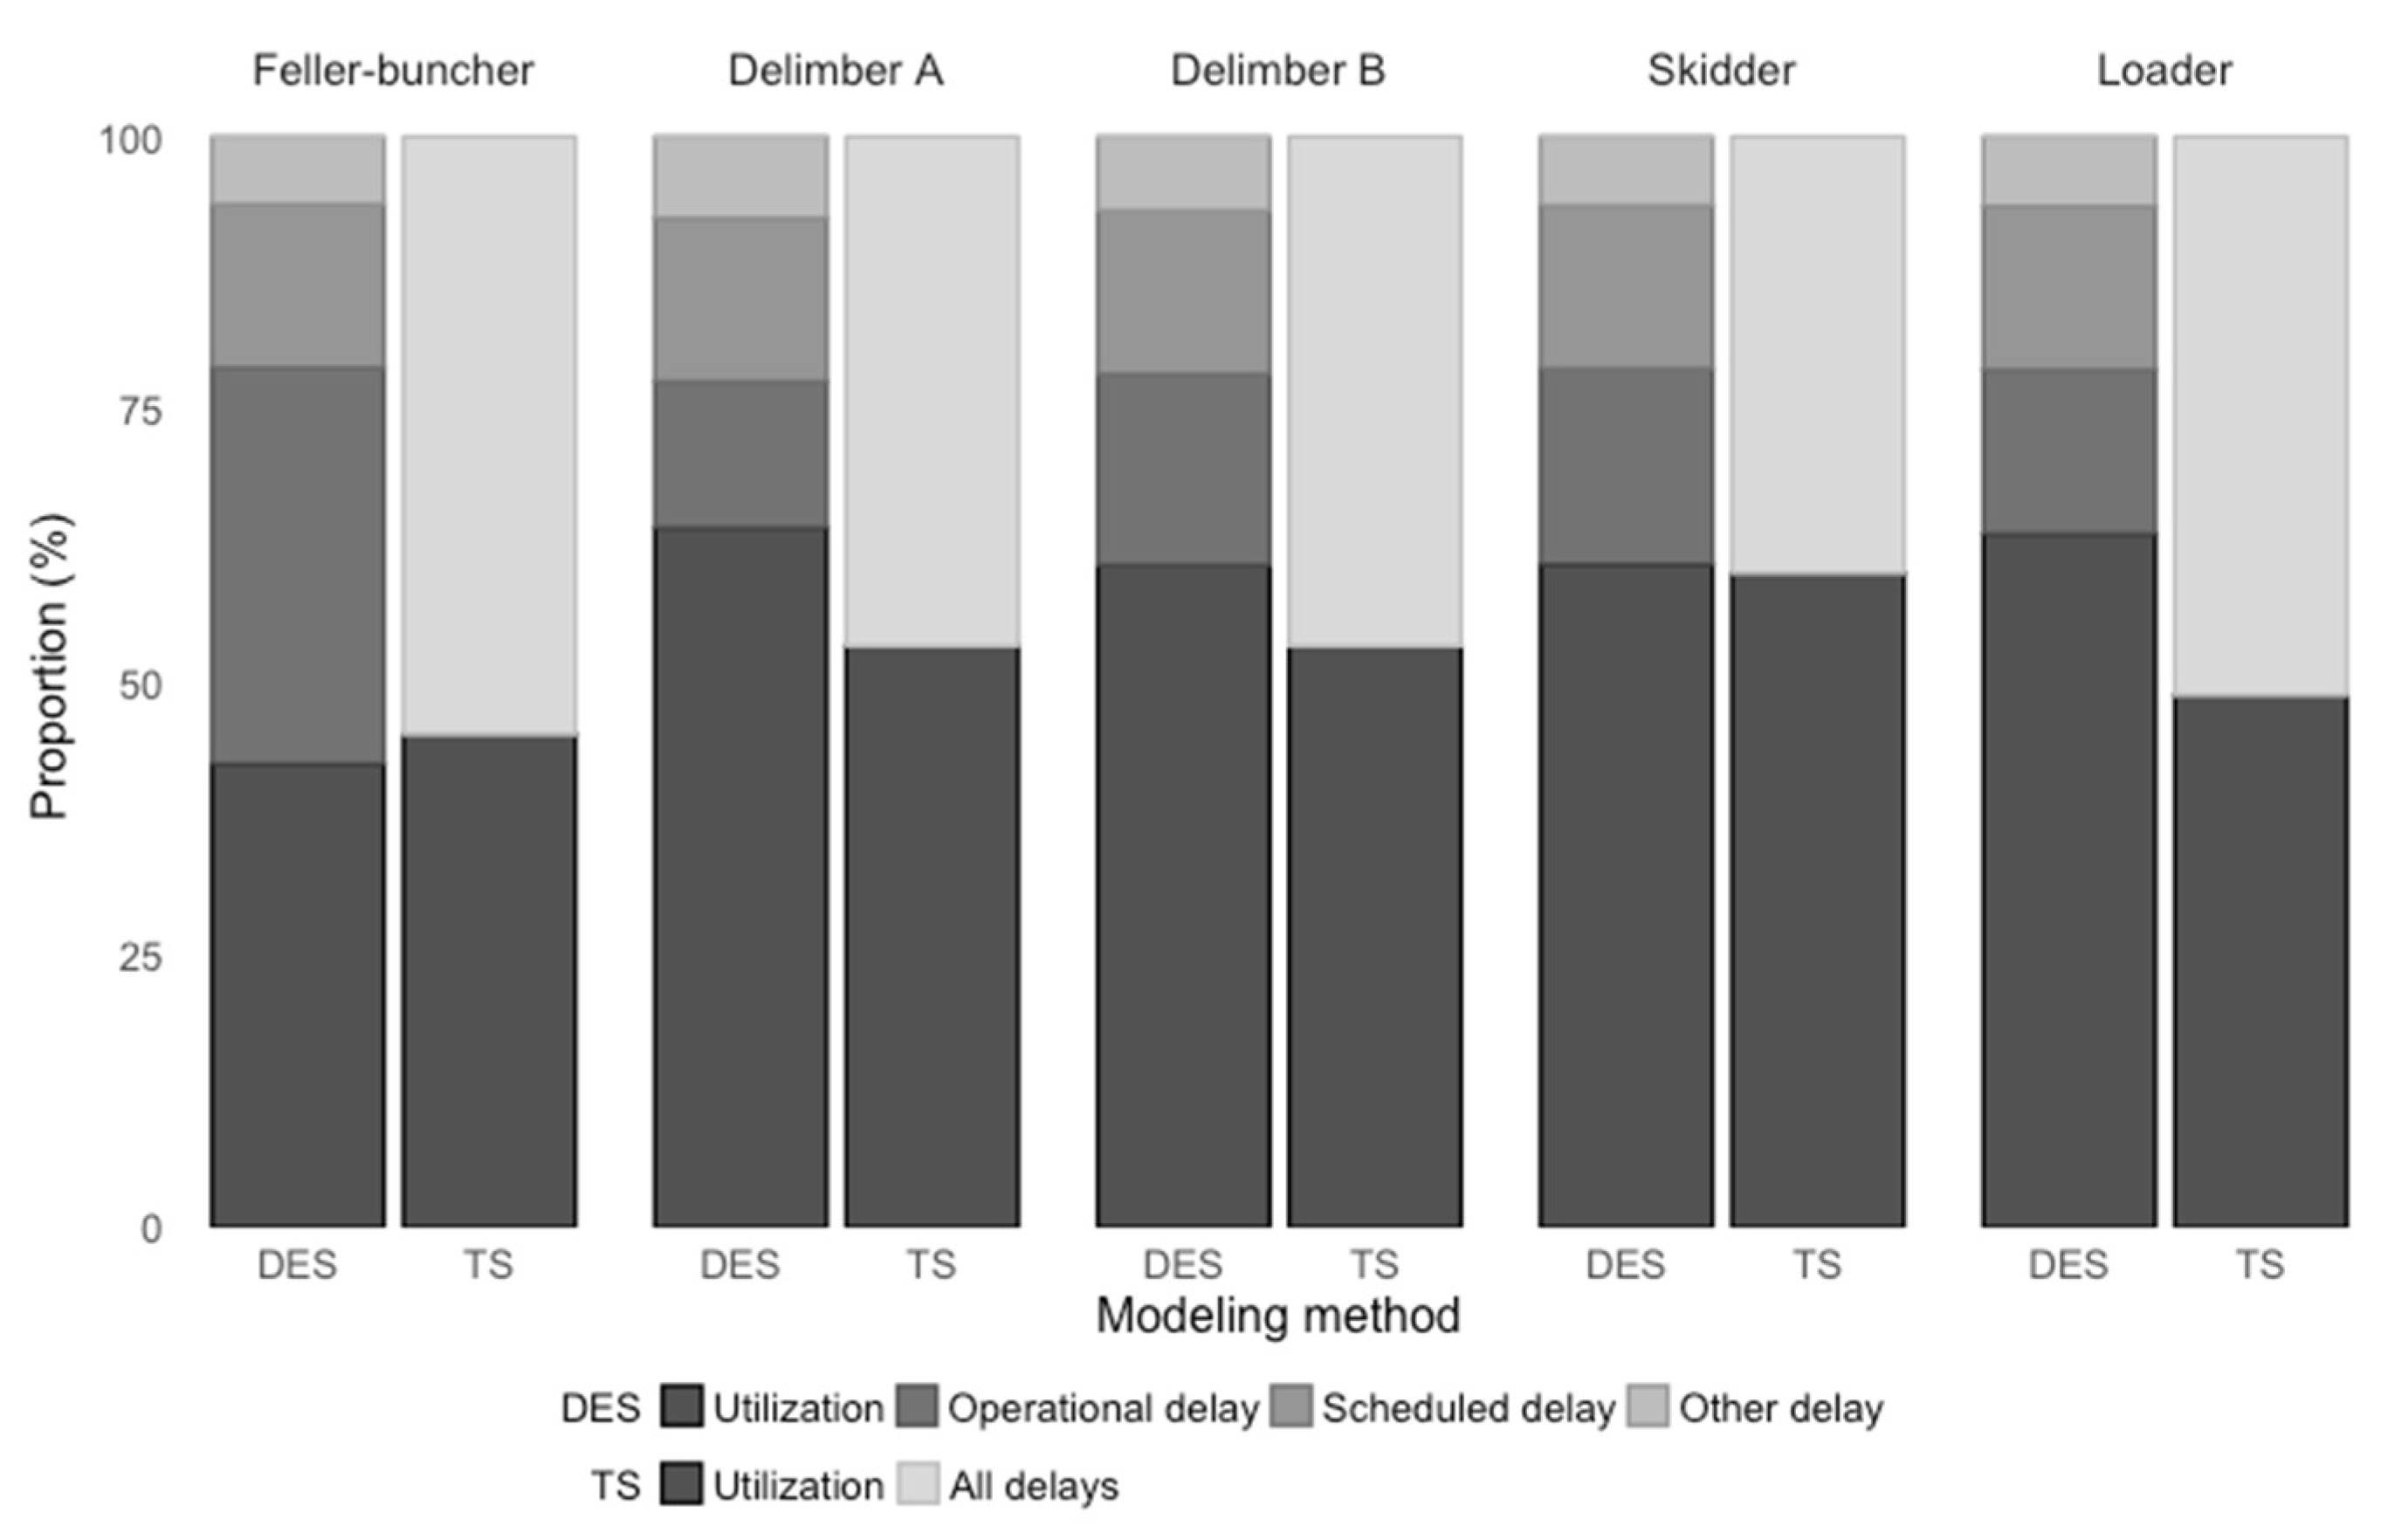
5]. A timber harvesting system often involves multiple machines working simultaneously, and estimating the productivity of the entire harvesting system requires the productivity of individual machines in scheduled machine hours (SMH). The conversion of productivity from PMH to SMH is based on the rate of machine utilization which incorporates potential delays that may occur to individual machines. Because the entire system productivity is limited by bottlenecks in any given machine or operation, it is important to understand and accurately quantify the utilization rates of individual machines [
6,
7,
8].
However, quantifying machine utilization rates is often omitted in TS techniques when the field observation period is not long enough to accurately assess utilization rates. It has been a custom to use the published machine utilization rates from past studies [
9,
10,
11], or the average values from long-term shift-level production data [
12,
13,
14]. But either approach may not provide suitable estimates unless the harvesting system and site are similar to the ones used in the past studies, or represent the average system and work conditions. Using the published or average data becomes a larger issue when one attempts to compare different harvesting systems or system configurations. It may not be justifiable to assume the same utilization rates for machines used in different systems.
One might collect machine delay times during a detailed time study for future uses. However, due to high costs of field data collection, most detailed time studies are conducted only for a short time period (e.g., a few days) [
15], and short-term data on delays might misrepresent the “normal” operational conditions as data can be biased with the presence or absence of any irregular and unpredictable events, such as machine breakdowns and adverse weather conditions. Alternatively, shift-level time studies are less costly [
16] and can provide long-term delay data, but once data are averaged out, they lack detail, such as delay types and causes, and thus provide limited insights for future improvement [
17]. It is also noted that some studies only reported delays longer than 15 min and included shorter delays as part of productive time [
18]. A drawback with an arbitrary cutoff time is that this interpretation could depict system performance very differently when most delays last less than the cutoff time.
The TS approach also provides limited insights on how multiple machines interact with each other during the harvesting process. Although delay-free cycle time regression models depict the relationship between dependent and independent variables [
19], outputs are only mean cycle time values without accounting for variation, especially variation caused by chain effects across multiple machines and tasks. When system components (i.e., individual machines) are highly interdependent, cycle time regression developed for individual machines can lead to biased productivity and cost estimates [
20]. In addition, when one machine performs multiple tasks (e.g., a loader is used to sort and deck logs, as well as to load log trucks), it would be difficult to build a regression model representing a series of different tasks.
Simulation techniques have been widely used in industrial and manufacturing engineering as an effective tool to understand production systems and estimate system productivity and costs [
21]. When properly developed and applied, simulation techniques can be useful to overcome the aforementioned limitations of the conventional TS approach in forest operations. Discrete-event simulation (DES) models the operation of a system as a series of events occurring at discrete points in time. In DES, events are broadly defined as things that may happen and cause a change in the system’s state [
22]. The term ‘discrete’ means the system’s state changes only at specific time points in response to events occurring at those time points. The simulation clock advances by jumping from one event time point to the next. No system components change in the interval between two events. As events occur in sequence, mimicking operations in practice, all operational information (e.g., processing time, wait time, queue length) is recorded to evaluate the performance of the modeled system. With DES, systems are analyzed by numerical methods rather than analytical methods [
23], which becomes an advantage when a large number of variables, parameters and functions are involved in a system, and various interactions occur among system components.
In addition, the ability of DES models to keep track of all events throughout the simulation process enables the user to build and test various operational scenarios simply by changing simulation inputs and observing the resulting outputs without disturbing the actual workflow [
23]. Another attractive benefit of the DES technique is the ability to construct and examine hypothetical, unobserved systems. Production and supply systems can be studied by observing the operation of the system if the system is already in operation [
24]. However, due to high costs and the laborious work of field data collection, it would be beneficial if previously collected data can be used to estimate the performance of an unobserved system. The DES model can facilitate this because with the same machines and technology, some processes and parameter values are invariant and still applicable under different circumstances. For instance, when the same machine is operated by the same operator under similar terrain and vegetation conditions for the similar harvest practice (e.g., clearcut), a skidder’s empty travelling speed might not dramatically change by skidding distances or system layouts. In such cases, previously collected data may be used in designing and analyzing new systems through DES models.
DES techniques have been applied to operational studies in forestry for many years, and simulation of harvesting operations was among the first attempts. Some studies focused on the productivity and operation of individual machines [
25] and others addressed interactions among harvest equipment and interactions between the harvesting system and log transportation [
26,
27]. These early stage models were implemented with the General Purpose Simulation System (GPSS/360, International Business Machines Corporation, Armonk, NY, USA) or programming language (e.g., FORTRAN, International Business Machines Corporation, Armonk, NY, USA), and thus required long development times especially when complex model construction was required. Later, the emergence of graphical-based simulation software development systems (e.g., Arena, Arena 15, Rockwell Automation Technologies, Inc., Milwaukee, WI, USA), AnyLogic (AnyLogic 8.3, The AnyLogic Company, Oakbrook Terrace, IL, USA), and Witness (Witness Horizon 22.0, Lanner Group Limited, Houston, TX, USA) facilitated the DES modeling process, and DES has been proved to be a reliable approach in supply chain management through various applications [
28]. In recent years, there were some DES applications in the fields of forest biomass supply chains where different chipping locations [
29], equipment configurations [
20,
30], trucking options [
31], and transportation methods [
32] were examined. These studies mainly focused on supply chain logistics, comparing different systems under various circumstances in order to support operational decisions. For upstream forest harvesting operations, however, there is a dearth of studies that have employed the DES technique. Asikainen [
33,
34] modeled mechanized harvesting systems and log transportation, incorporating the effects of random elements such as machine failures and transportation distances on the entire system. Hogg et al. [
35] simulated stump-to-mill multi-stem Eucalyptus harvesting and transport operations for system comparisons. However, none of the past studies explicitly compared DES with TS to highlight the differences between the two approaches and the potential benefits of the DES approach in analyzing the performance of harvesting systems.
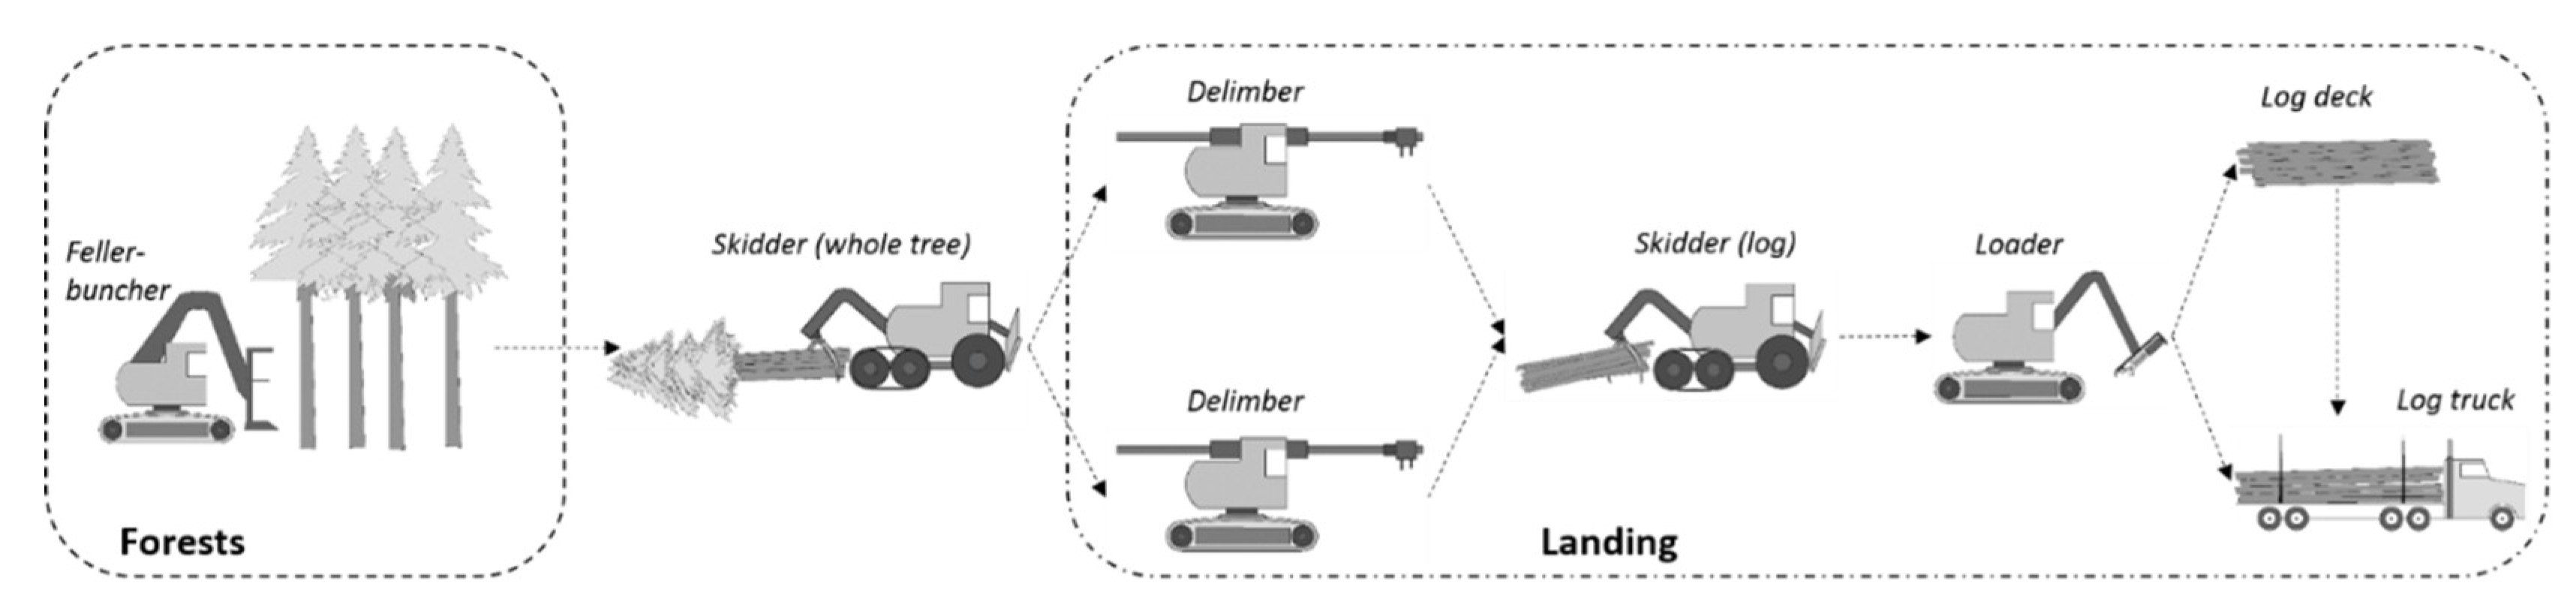
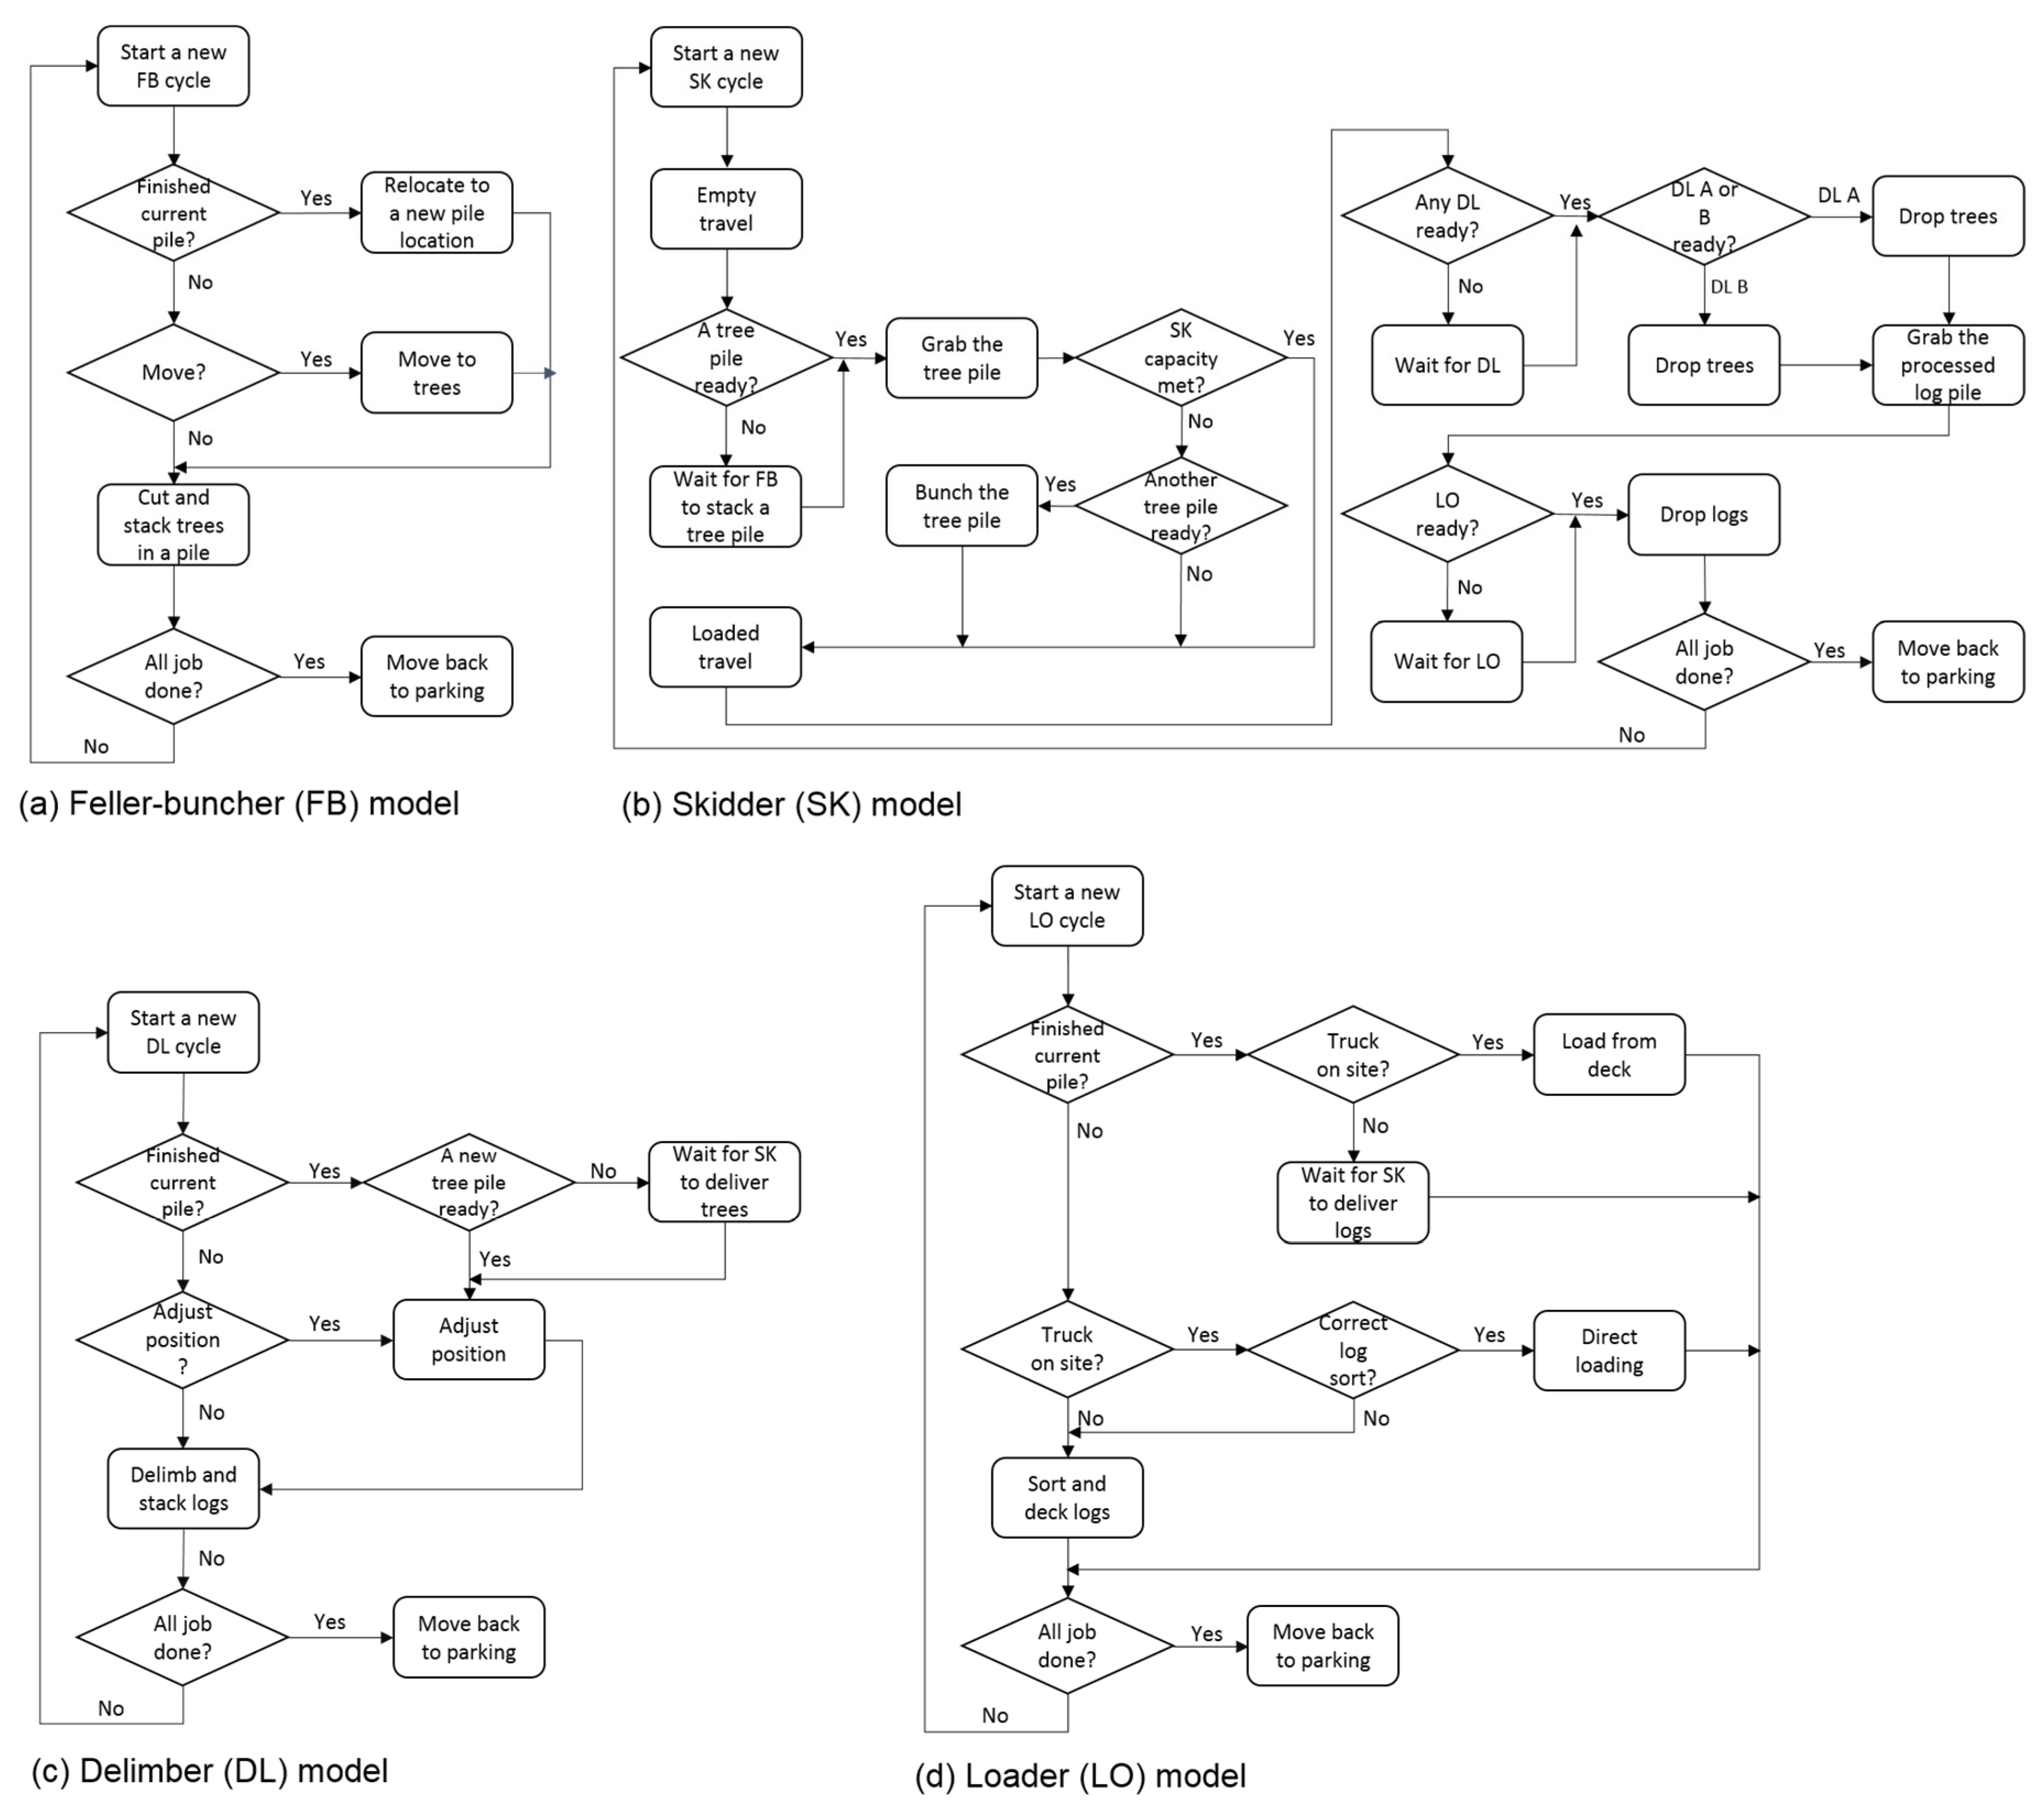
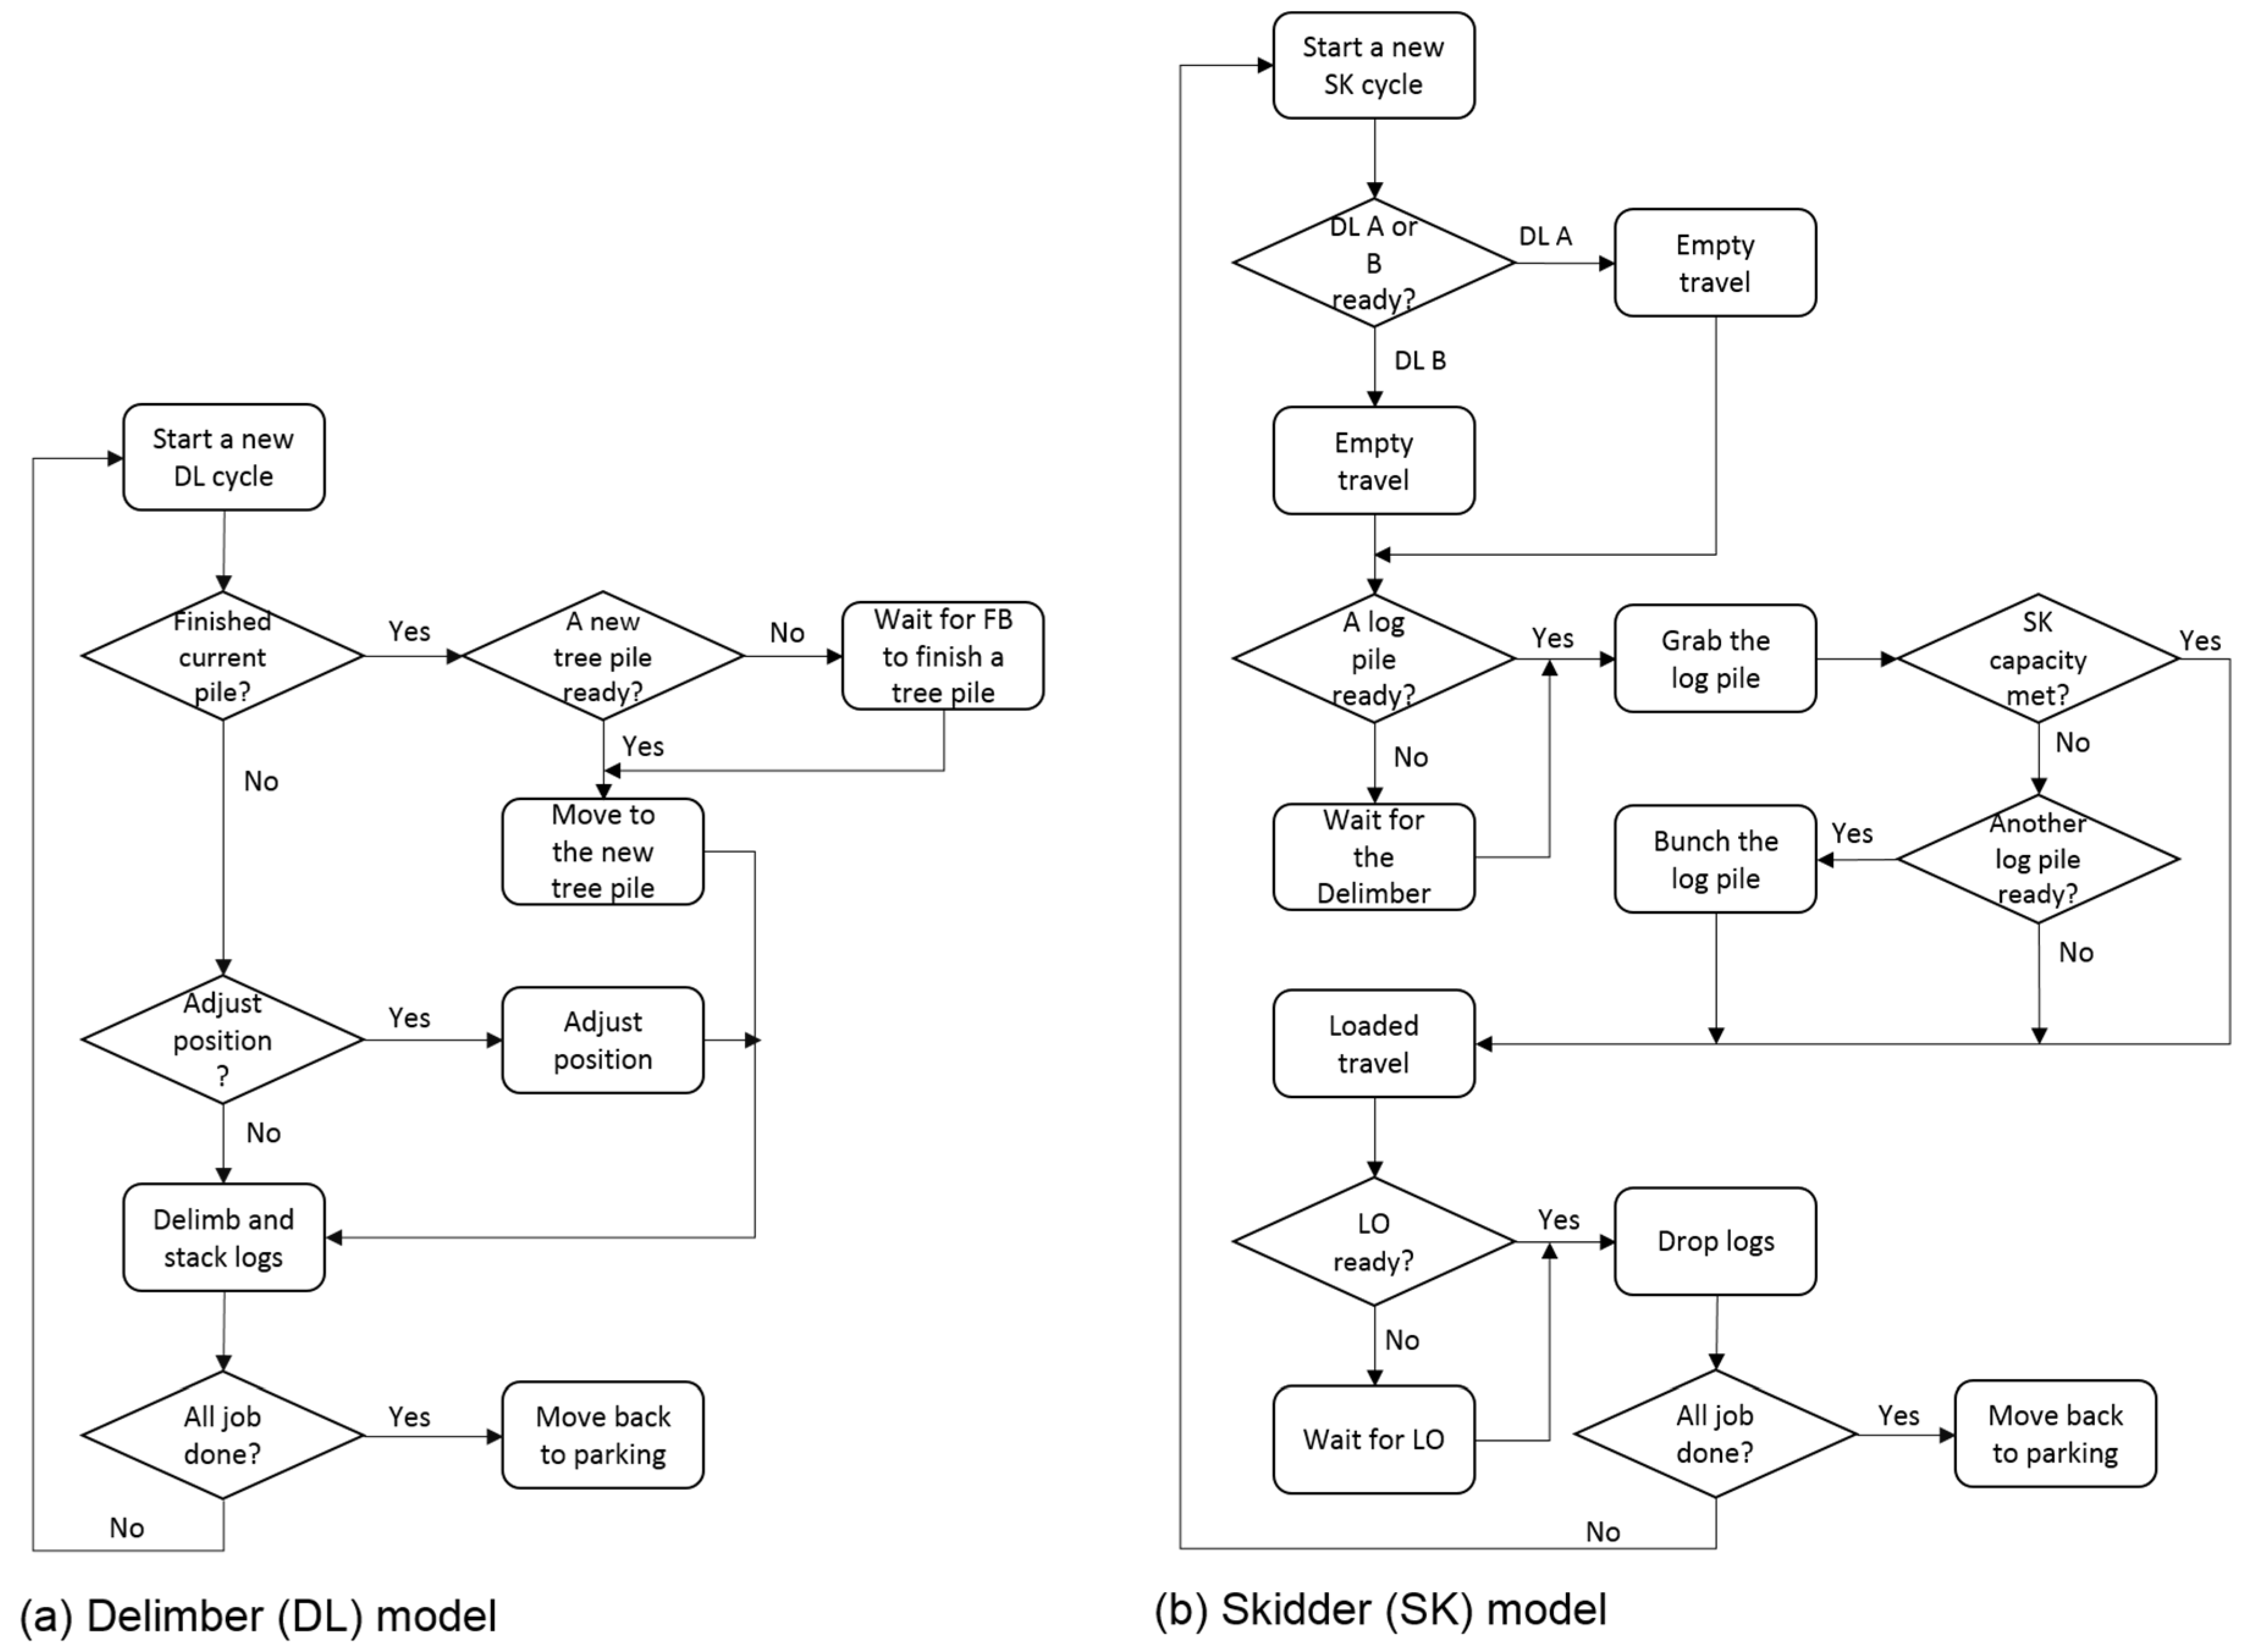
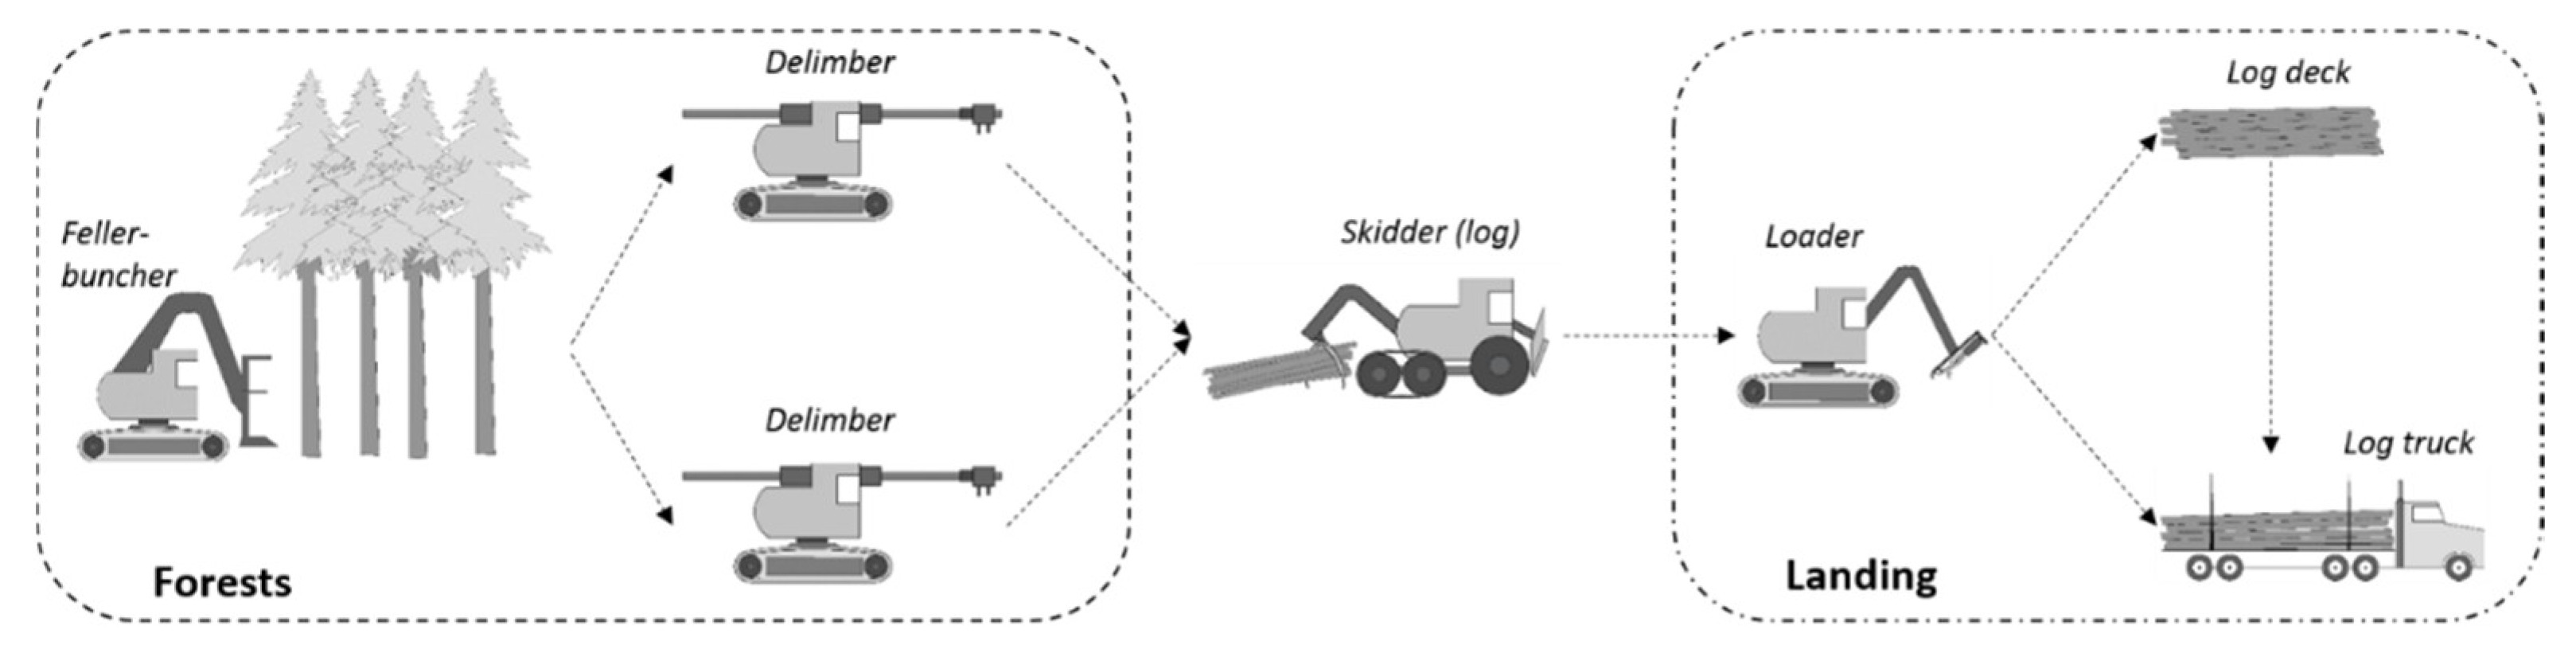
In this study, we developed a stochastic DES model for a ground-based, whole-tree harvesting (WT) system, and compared it to the conventional TS approach in order to demonstrate the use of DES techniques in timber harvesting operations modeling and highlight its potential advantages in flexibility, precision, and analytical ability. We also applied the data from the WT DES model to a new DES model simulating another ground-based harvesting method called “lop-and-scatter (LS)”, to demonstrate the ability of DES in analyzing hypothetical harvesting systems by reusing the previously collected data from the existing system.


