Article

Effect of Soil Layer and Plant–Soil Interaction on Soil Microbial Diversity and Function after Canopy Gap Disturbance

1
Department of Forestry, College of Forestry, Northwest A&F University, Yangling 712100, China
2
Key Comprehensive Laboratory of Forestry, Shaanxi Province, Yangling 712100, China
3
Key Lab Silviculture Loess Plaetau State Forestry, Yangling 712100, China
*
Author to whom correspondence should be addressed.
Forests 2018, 9(11), 680; https://doi.org/10.3390/f9110680
Submission received: 12 September 2018 / Revised: 18 October 2018 / Accepted: 23 October 2018 / Published: 29 October 2018
(This article belongs to the Section Forest Ecology and Management)

Abstract

:
Gaps by thinning can have different microclimatic environments compared to surrounding areas, depending on the size of the gap. In addition, gaps can play important roles in biological dynamics, nutrient cycling, and seedling regeneration. The impacts of gap size on soil microbial communities and enzyme activities in different soil layers in Chinese pine plantations are not well understood. Here, we created gaps of 45 m2 (small, G1), 100 m2 (medium, G2), and 190 m2 (large, G3) by thinning unhealthy trees in an aged (i.e., 50 years old) monoculture Chinese pine plantation in 2010. Soil samples were collected in 2015. The total, bacterial, Gram-positive (G+), and Gram-negative (G) phospholipid fatty acid (PLFA) profiles were highest in medium gaps in both the organic and mineral layers. These indicesdecreased sharply as gap size increased to 190 m2, and each of the detected enzyme activities demonstrated the same trend. Under all the gap size managements, abundances of microbial PLFAs and enzyme activities in the organic layers were higher than in the mineral layers. The soil layer was found to have a stronger influence on soil microbial communities than gap size. Redundancy analysis (RDA) based on the three systems with different gap sizes showed that undergrowth coverage, diversity, soil total nitrogen (TN), total organic carbon (TOC), and available phosphorus (AT) significantly affected soil microbial communities. Our findings highlighted that the effect of gap size on soil microenvironment is valuable information for assessing soil fertility. Medium gaps (i.e., 100 m2) have higher microbial PLFAs, enzyme activity, and soil nutrient availability. These medium gaps are considered favorable for soil microbial communities and fertility studied in a Chinese pine plantation managed on the Loess Plateau.

1. Introduction

Soil microbial communities and extracellular enzymes play critical roles in organic matter decomposition and nutrient cycling of carbon, nitrogen, sulfur, and phosphorus, and both microbial communities and enzyme activity can change quickly in response to changes in the environment [1,2]. Therefore, changes in microbial communities or enzyme activities can influence soil biochemical processes and, consequently, soil fertility and plant growth. The formation of forest, gap-altered microenvironments, especially in regard to soil moisture and temperature, as well as in substrate quantity and quality, can result in changes in microbial communities and enzyme activities. The impacts of gap size on soil microbial properties are not clear in the existing literature. Some researchers have reported that gaps lead to increased air temperatures, solar radiation, soil moisture, and temperature. These soil microclimatic conditions can be beneficial for the growth of microorganisms and, consequently, can result in an increase in microbial activity and microbial-mediated decomposition rates [3,4]. However, other researchers have suggested that the creation of gaps can result in an unfavorable environments for microbial growth as a result of reduced litter input and alteration of soil microclimates [5,6]. Muscolo et al. [7] demonstrated that smaller gaps led to higher soil organic matter content, microbial biomass, and enzyme activity. Denslow et al. [8] reported no relationship between gap sizes and litterdecay rates in a wet tropical forest. The influence of gap size on soil nutrient cycling, microbial community structure, and enzyme activity is unclear. Studies focused on soil properties and microbial-mediated nutrient cycling processes under different gap sizes have mainly focused on the mineral soil layer and, in particular the topsoil layer [6,9,10]. However, research has yet to explore the role that gap sizes may play on soil organic layers.
Organic layers often includingdecomposed organic matter in various states (i.e., highly decomposed, moderately decomposed, and minimally decomposed), are considered to be rich in organic matter, and have high biological activity as there are typically a variety of substrates for microbial growth [11]. In contrast, these high loads of organic material and biological activity are not commonly observed in mineral layers. Because of different substrate quality and availability between the organic and the mineral layer, the soil microbial communities may vary between the two soil layers. In addition, forest gaps are distinct habitats that differ from the surrounding forest environment, and this can have a significant impact on plant diversity, plant species composition, litter type, as well as amount of litter [5]. Therefore, compared with mineral soils, microbial communities and activities in organic layers may be more susceptible to formation in forest gaps since the organic layer is strongly controlled by litter production and decomposition.
Pinus tabulaeformis Carrière is widely distributed in the warm temperate forest. Gap formation is beneficial for the management of Pinus tabulaeformis plantations [12]. Previous studies reported that gap creation positively influenced Chinese pine seeding regeneration [13,14,15]. However, there have been few studies regarding the changes of soil microbial communities and enzyme activities after gap creation in a Pinus tabulaeformis forest. Forests, and past studieshavemainly focused on the mineral soil layer [16]. Therefore, the objectives of this study were: (1) to investigate effects of gap size on soil biochemical properties; (2) to identify differences in soil microbial community structure and enzyme activities between organic layers and mineral soil layers under different gap size managements; and (3) to reveal potential relationships betweenvegetation characteristics, soil properties, and microbial community properties associated with the effects of gap size.

2. Materials and Methods

2.1. Study Site Description

The study site is located in the CaiJiachuan forest region in Shaanxi Province in northwest China. This area is in the Loess gully region in the central part of the Loess Plateau (35°28′ N to 36°02′ N, 109°38′ E to 110°12′ E). Altitudes range from 1100 m to 1500 m, and thearea is characterized by a semi-arid climate. The mean annual precipitation is 606.2 mm, and both dry and wet seasons occur. The wet season is mainly from July to September, and the total rainfall during this time accounts for more than 50% of the mean annual precipitation. The annual mean temperature is 8.6 °C, and the frost-free period is 126 d. The soil type is classified as a cinnamon soil (a Hapludalfsin the USDA classification).The forests in this region are mostly pure stands derived primarily from artificial afforestation in the 1960s, and the predominant silvicultural tree species is the Chinese pine (Pinus tabulaeformis). Currently, Chinese pine plantations occupy 60% of the afforestation area in this region. The understory vegetation is mainly composed of Festuca ovina L., Lonicera maakii (Rupr.) Maxim., Spiraea salicifolia L., Lonicera ferdinandii Franch., and Carex tristachya Thunb.

2.2. Experimental Design

The four treatments included plots of small gap (G1, 45 m2), medium gap (G2, 100 m2), large gap (G3, 190 m2), and a closed canopy (G0). In November 2010, twelve plots with anarea of 400 m2 (20 m × 20 m) were first selected in an aged (i.e., 50-year-old) monoculture Chinese pine plantation that had similar aspect, slope, soil types, and soil textures. Plots were randomly assigned into four treatments, each with three replicates. Then, a polygon with area approximate to 45 m2, 100 m2, and 190 m2 was separately established around the center of each plot. Finally, canopy trees (Diameter at breast height >10 cm) located on the edge of the polygon were marked and surrounded using plastic rope, while canopy trees within the polygon were all cut down. On average, the G1, G2, and G3 were formed by felling 1–3 trees, 5–8 trees, and 10–12 trees, respectively. The gap size was calculated according to Brokaw (1982) [16]. The gaps were separated fromeach other by at least 500 m. Stems, branches, and leaves of the cut trees were removed in the thinned plots. Stumps were retained at 50 cm above the ground, and the undergrowth shrubs and herbs were left in the plots.

2.3. Soil Sampling

Soil samples were taken in August 2015, five years after gap creation. Organic layers included a fresh litter layer, a fragment layer, and a humified layer. Based on the color, texture, and consistency of the soil, organic layers were clearly distinguishable from the mineral soil layers. At each plot, a 1 m × 1 m subplot was established in the center of each gap or closed canopy, and a cross transect was taken across the center of each subplot. Along the cross section, avoiding trunksand site edges, 6 subsamples of the organic layer and the upper mineral layer (10 cm) were taken randomly via a corer (5 cm diameter) and mixed to produce one composite sample. All selected soil sampling points were free of any other vegetation within a radius of 0.75 m. A total of 12 composite soil samples of organic layer or mineral soil layer were obtained. Each composite soil sample was sieved to 2 mm mesh size, and any visible living plant materials were removed manually from the sieved soil. Each soil sample was divided into two portions for use as fresh and air-dried samples. The air-dried soil samples were used for soil chemical analysis. The fresh samples for phospholipid fatty acid (PLFA), ammonium nitrogen, nitrate nitrogen, and enzyme activity determination were stored at 4 °C.

2.4. Plant Characteristics

A 5 m × 5 m quadrat in the center of each plot and 6 1 m×1 m quadrats were selected randomly to investigate the characteristics of shrubs and grass, respectively. Plant coverage and biomass were separately measured for each species in each quadrat. Plant biomass included above-ground biomass and below-ground biomass as measured according to Zhang et al. [17]. The Shannon diversity index of plant communities (Hplant) was calculated based on the equation by Tscherko et al. [18], with Pi representing the relative abundance of each species in total sum and n representing the total number of species. The number of species was used to estimate the richness (Splant) [17].

2.5. Analysis of Soil Properties

Soil chemical properties were determined based on the methods of Liu (1996) [19]. Soil pH was determined using a pH meter (Metrohm 702, Herisau, Switzerland) after shaking the soil:water (1:2.5, w/v) suspension for 30 min. Soil organic carbon (OC) was measured using an elemental analyzer (Vario MACRO cube CN, Langenselbold, Germany). An amount of 1 g dried, ground soil was used to detect soil total nitrogen using the Kjeldahl method. Nitrogen in the form of ammonium (NH4+–N) and in the form of nitrate (NO3–N) was determined following extractions of fresh soil with 2 M KCl for 18 h and was analyzed colorimetrically on an AlpkemAutoanalyzer (OI Analytical, College Station, TX, USA). Total phosphorus (TP) was assayed colorimetrically after wet digestion with HClO4–H2SO4, and available phosphorus (AP) was measured by the molybdenum antimony colorimetric methodusingan Agilent 8453 spectrophotometer (Agilent Technologies, Santa Clara, CA, USA) at wavelength of 880 nm.

2.6. PLFA Analysis

The phospholipid fatty acid (PLFA) analyses were performed as described in White et al. (1979) [20] and Yang et al. (2018) [21].The total PLFAs was quantified as the sum of all detected PLFA biomarkers [22]. Bacterial markers were identified by the following PLFAs: 14:0, 15:0, 16:0, 18:0, 14:0i, 15:0i, 15:0a, 16:0i, 17:0i, 17:0a, 14:1w5c, 15:1w6c, 16:1w7c, cy17:0, cy19:0, 15:03OH, 16:12OH, 16:1w9c, 18:1w5c, and cy18:0 [23,24]. PLFAs 14:0i, 15:0i, 15:0a, 16:0i, 17:0i, and 17:0a were used as markers for Gram-positive bacteria [23], and PLFAs 14:1w5c, 15:1w6c, 16:1w7c, cy17:0, cy19:0, 15:03OH, 16:12OH, 16:1w9c, 18:1w5c, and cy18:0 were used as markers for Gram-negative bacteria [23]. PLFAs 16:1w5c was used as arbuscularmycorrhizal fungi (AMF) marker [25]. Fungi were identified by PLFAs 18:1w9c and 18:3w6c [26,27].

2.7. Soil Enzyme Activity

Potential activities of four extracellular enzymes were assayed based on the methods of Guan [28]. Alkaline phosphatase (PHO) and urease (URE) were determined in 5 g soil, whereas activities of β-glucosidase (GLU) and cellulose (CEL) were determined in 1 g soil. Substrates included disodium phenylphosphate, urea, p-nitrophenyl-β-d-glucoside, and carboxymethyl cellulase, respectively. Distilled water was used as controls instead of substrates. All four enzyme activities were determined via a colorimetric method and expressed based on soil dry weight. Each enzyme assay was done in triplicate.

2.8. Statistical Analyses

Two-way ANOVA was conducted to evaluate the effects of gap size, soil layer, and their interactions on biotic and abiotic variables. One-way ANOVA followed by Fisher’s least significant difference (LSD) test was used to examine the differences in soil properties, microbial communities, and enzyme activities among forest gaps in a given layer. Student’s t-tests were used to compare the differences between soil layers under the same gap size. A principal component analysis (PCA) was used to analyze changes in PLFA profiles as related to forest gap sizes. Pearson correlations were performed to examine the relationships between soil microbial communities and enzyme activities. The above analyses were carried outwith SPSS 19.0(IBM, Armonk, NY, USA). In addition, redundancy analysis (RDA) was used to analyze the relationships between plant characteristics, soil microbial communities, and soil properties. Partial redundancy analyses (PRDA) were performed to quantify the contribution of gap size and soil layer on soil microbial communities. RDA and PRDA were performed using the R software package ver. 2.9 (R Foundation for Statistical Computing, Vienna, Austria).

3. Results

3.1. Plant Characteristics

Gap size had a significant effect on plant characteristics (Table 1). The coverage, biomass, Shannon–Wiener index, and richness of shrubs and herbs increased gradually with gap size. However, these indices decreased under large gaps, with maximum values observed in medium gap areas. The dominant plant species varied with gap size. Shade bearers were mostly observed under closed canopy, including Lonicera ferdinandii and Spiraea salicifolia. As gap formation size increased, intolerant shrub and herb species increased. The predominant shrub species observed included Cotoneaster zabelii Schneid, Qstryopsis davidiana Decne. and Spiraea salicifolia in all gap areas. Herb species (Artemisia argyi Levl. et Van and Anemone vitifolia Buch.-Ham.) increased significantly under gaps.

3.2. Soil Chemical Properties.

Each of the soil chemical properties, with the exception of TP, were significantly higher in the organic layers than in the mineral layers (Table 2). Organic layer soil TOC, TP, NO3–N, and AP were 1.16–1.23, 2.12–2.29, 1.38–1.59, 1.48–1.58 times higher in samples from sites with medium gaps than in samples from sites with closed canopies or large gaps. Amounts observed in large gaps were similar to those with closed gaps. The contents of soil TN, NO3–N, and AP were highest in medium gaps in the mineral layers. However, there were no significant differences in soil pH, TOC, or NH4+–N among medium gaps, small gaps or closed canopies. No significant interactions between gap size and soil layer were observed.

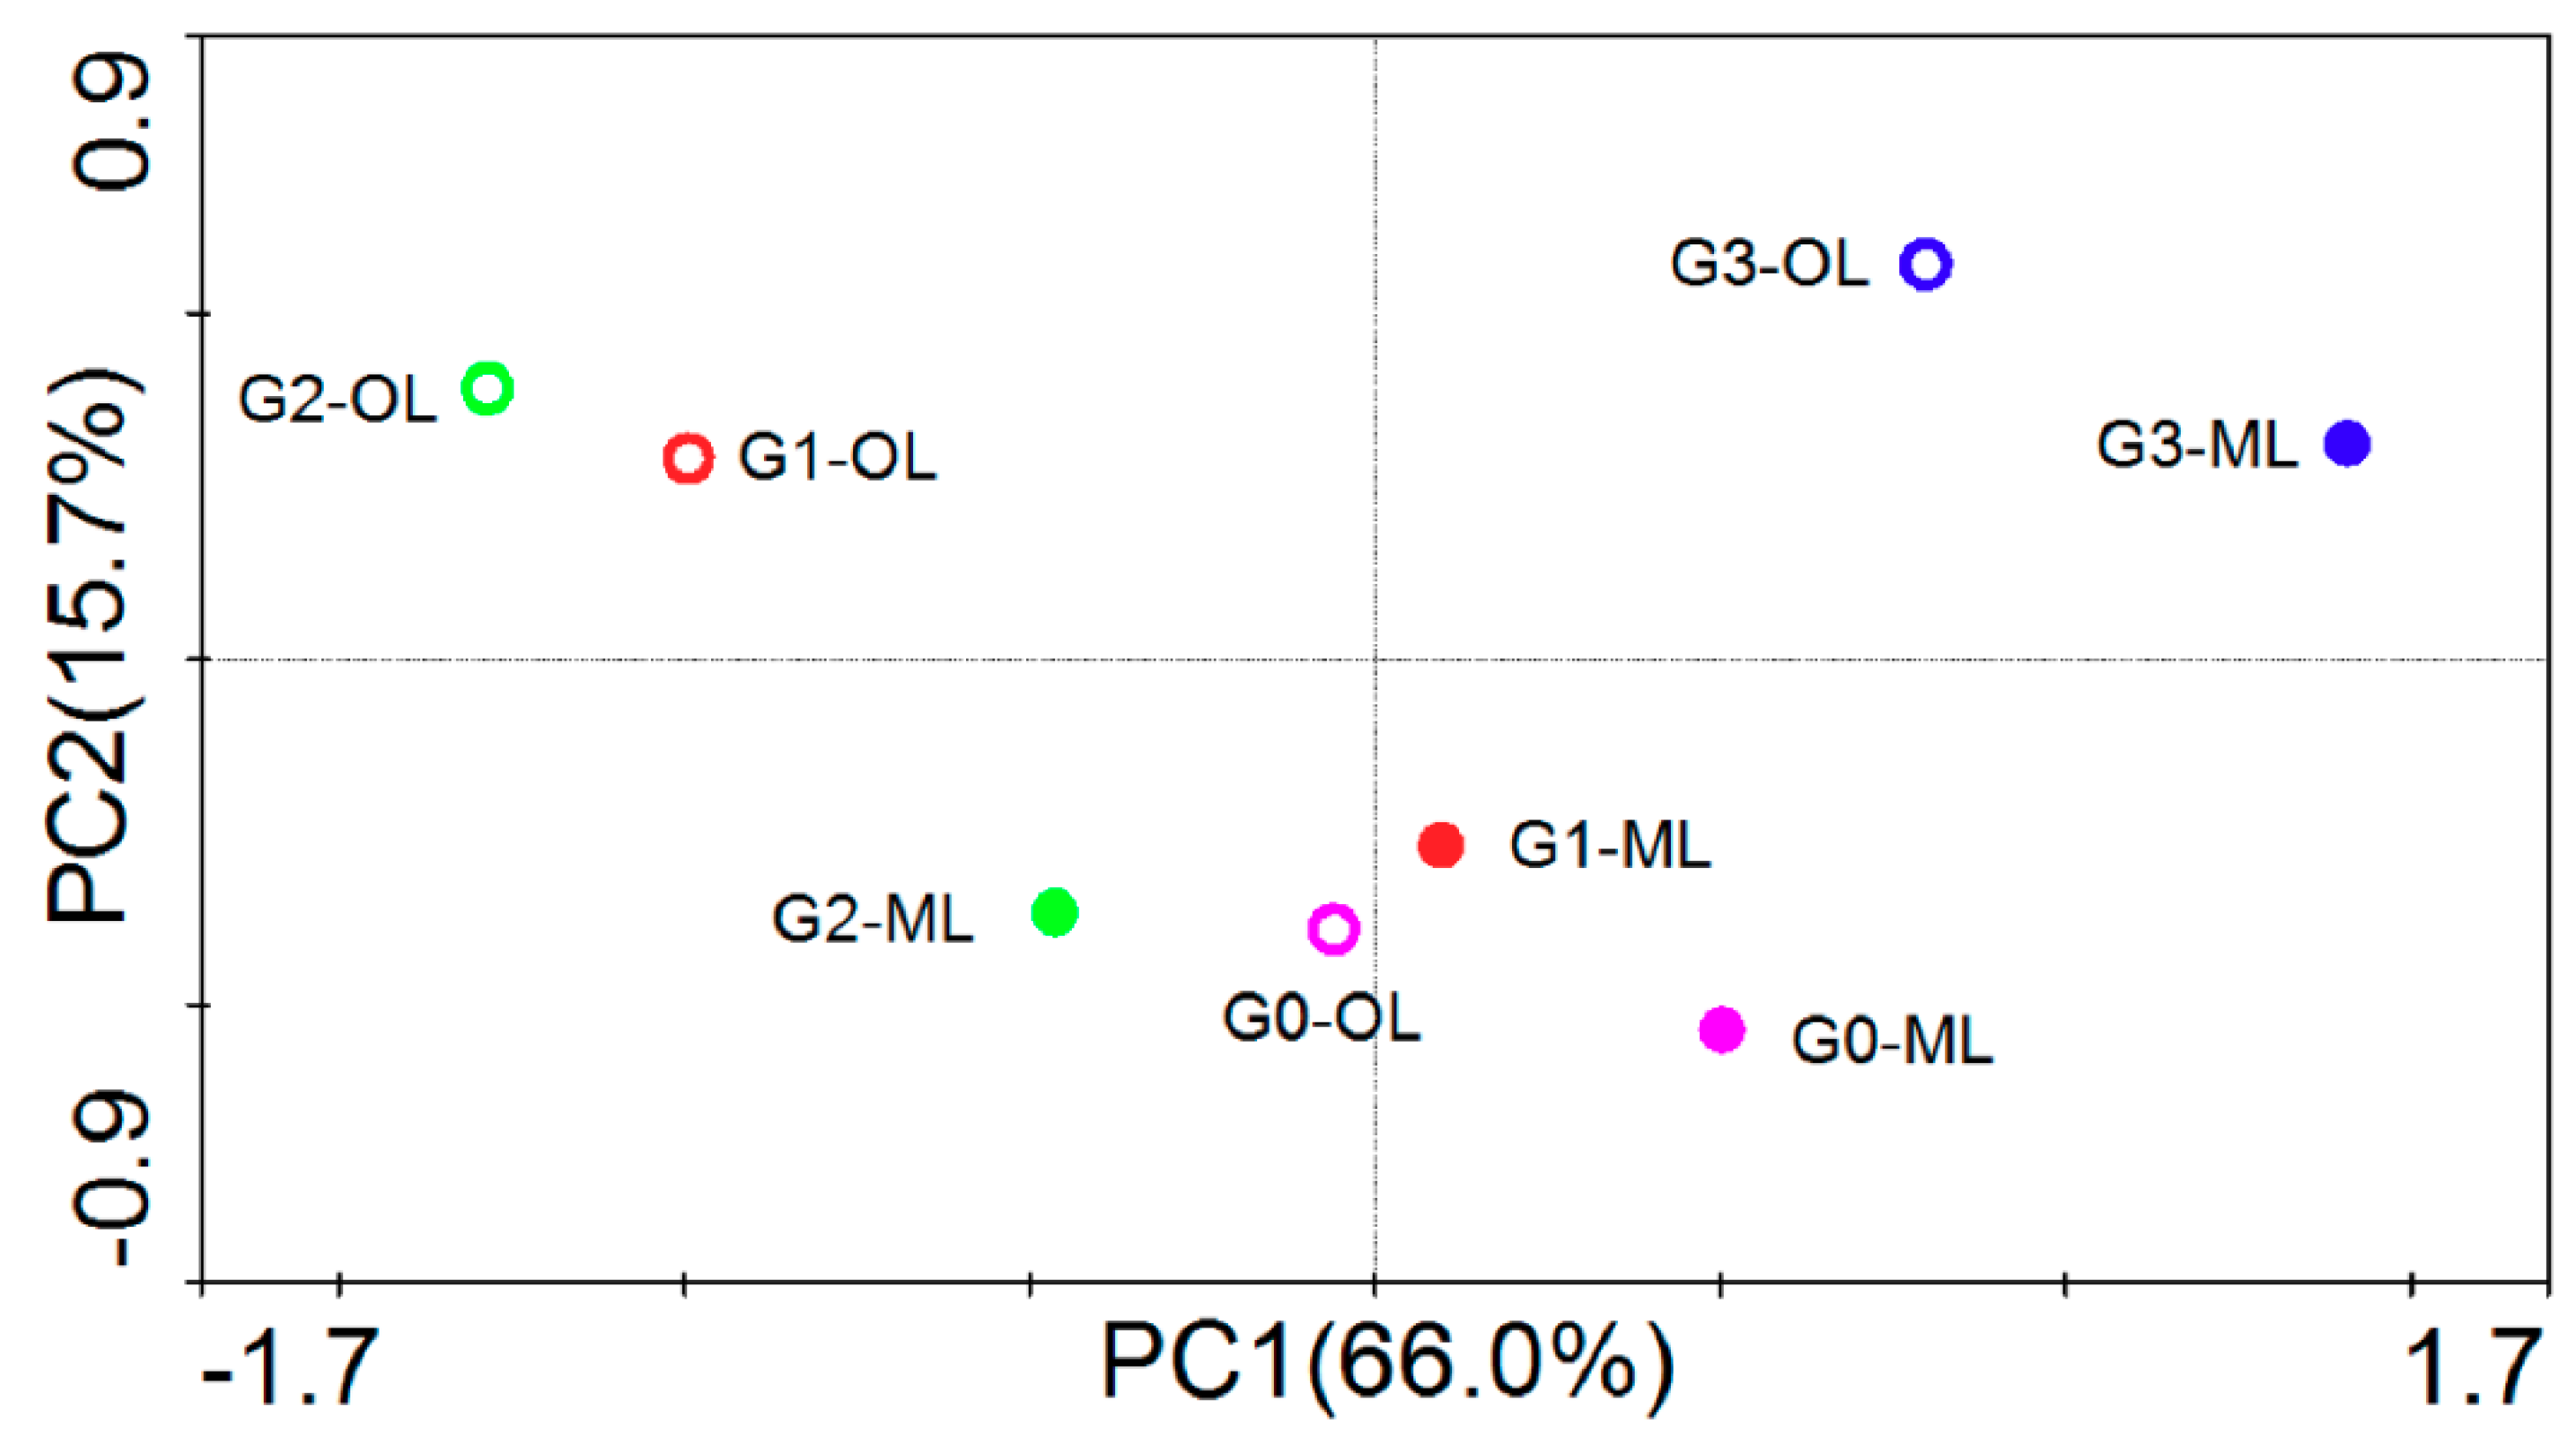
3.3. Microbial Community Structure

Gap size had significant effects on soil microbial communities (Table 3). In the organic layer, there were significant differences in the amount of total PLFAs among the four treatments, and the highest value was detected with the medium gap. The concentration of Gram-positive PFLAs (G+PLFAs), Gram-negative PFLAs (GPLFAs), bacteria, fungi, and AMF in the medium gap increased by 95.83%, 98.75%, 103.06%, 60.09%, and 39.47%, respectively, compared to the large gap. These concentrations, with the exception of total PLFAs and bacteria, were similar between the large gap and under-canopy cover sites. The trend of total PLFAs, G+PLFAs, and GPLFAs under different gap sizes in the mineral layer corresponded with the organic layer. However, there were no significant differences in the biomass of AMF under the four treatments. All of the indices were higher in the organic layer than in the soil mineral layer. However, the interaction between gap size and soil layer was not significant for the soil microbial community structure.
Principle component analysis (PCA) clearly showed variations of soil microbial community structures associated with different gap sizes and the soil layers (Figure 1). Component 1 was responsible for 66.0% of the total variation and was mainly associated with fatty acids 16:0i, 17:0cyclow7c, 18:1w7c, 19:0cyclow7c, 19:1w8c, 15:0a, 10me17:0, and 12:0. Component 2 was responsible for 15.7% of the total variation and was mainly associated with the fatty acids 13:0, 14:0a, 18:1w7c, 16:0a, 13:0a, 17:0, 20:0, 19:1cyclow7c, 17:1w8c, and 17:0cyclow7c.

3.4. Enzyme Activities

Regardless of gap sizes, soil enzyme activities were significantly higher in the organic layer than in the mineral layer (Table 4). In the organic layer, the activities of β-glucosidase and cellulase were higher in the medium gap than in the large gap. There were no significant differences in the activities of cellulose, urease, and phosphatase in the small gap, medium gap, or the under-canopy cover sites. However, in the mineral layer, the highest values of all enzymatic activities were found in the medium gap, and significant differences were observed between the medium gap and the other treatments. No significant differences between gap size and soil layer were observed.

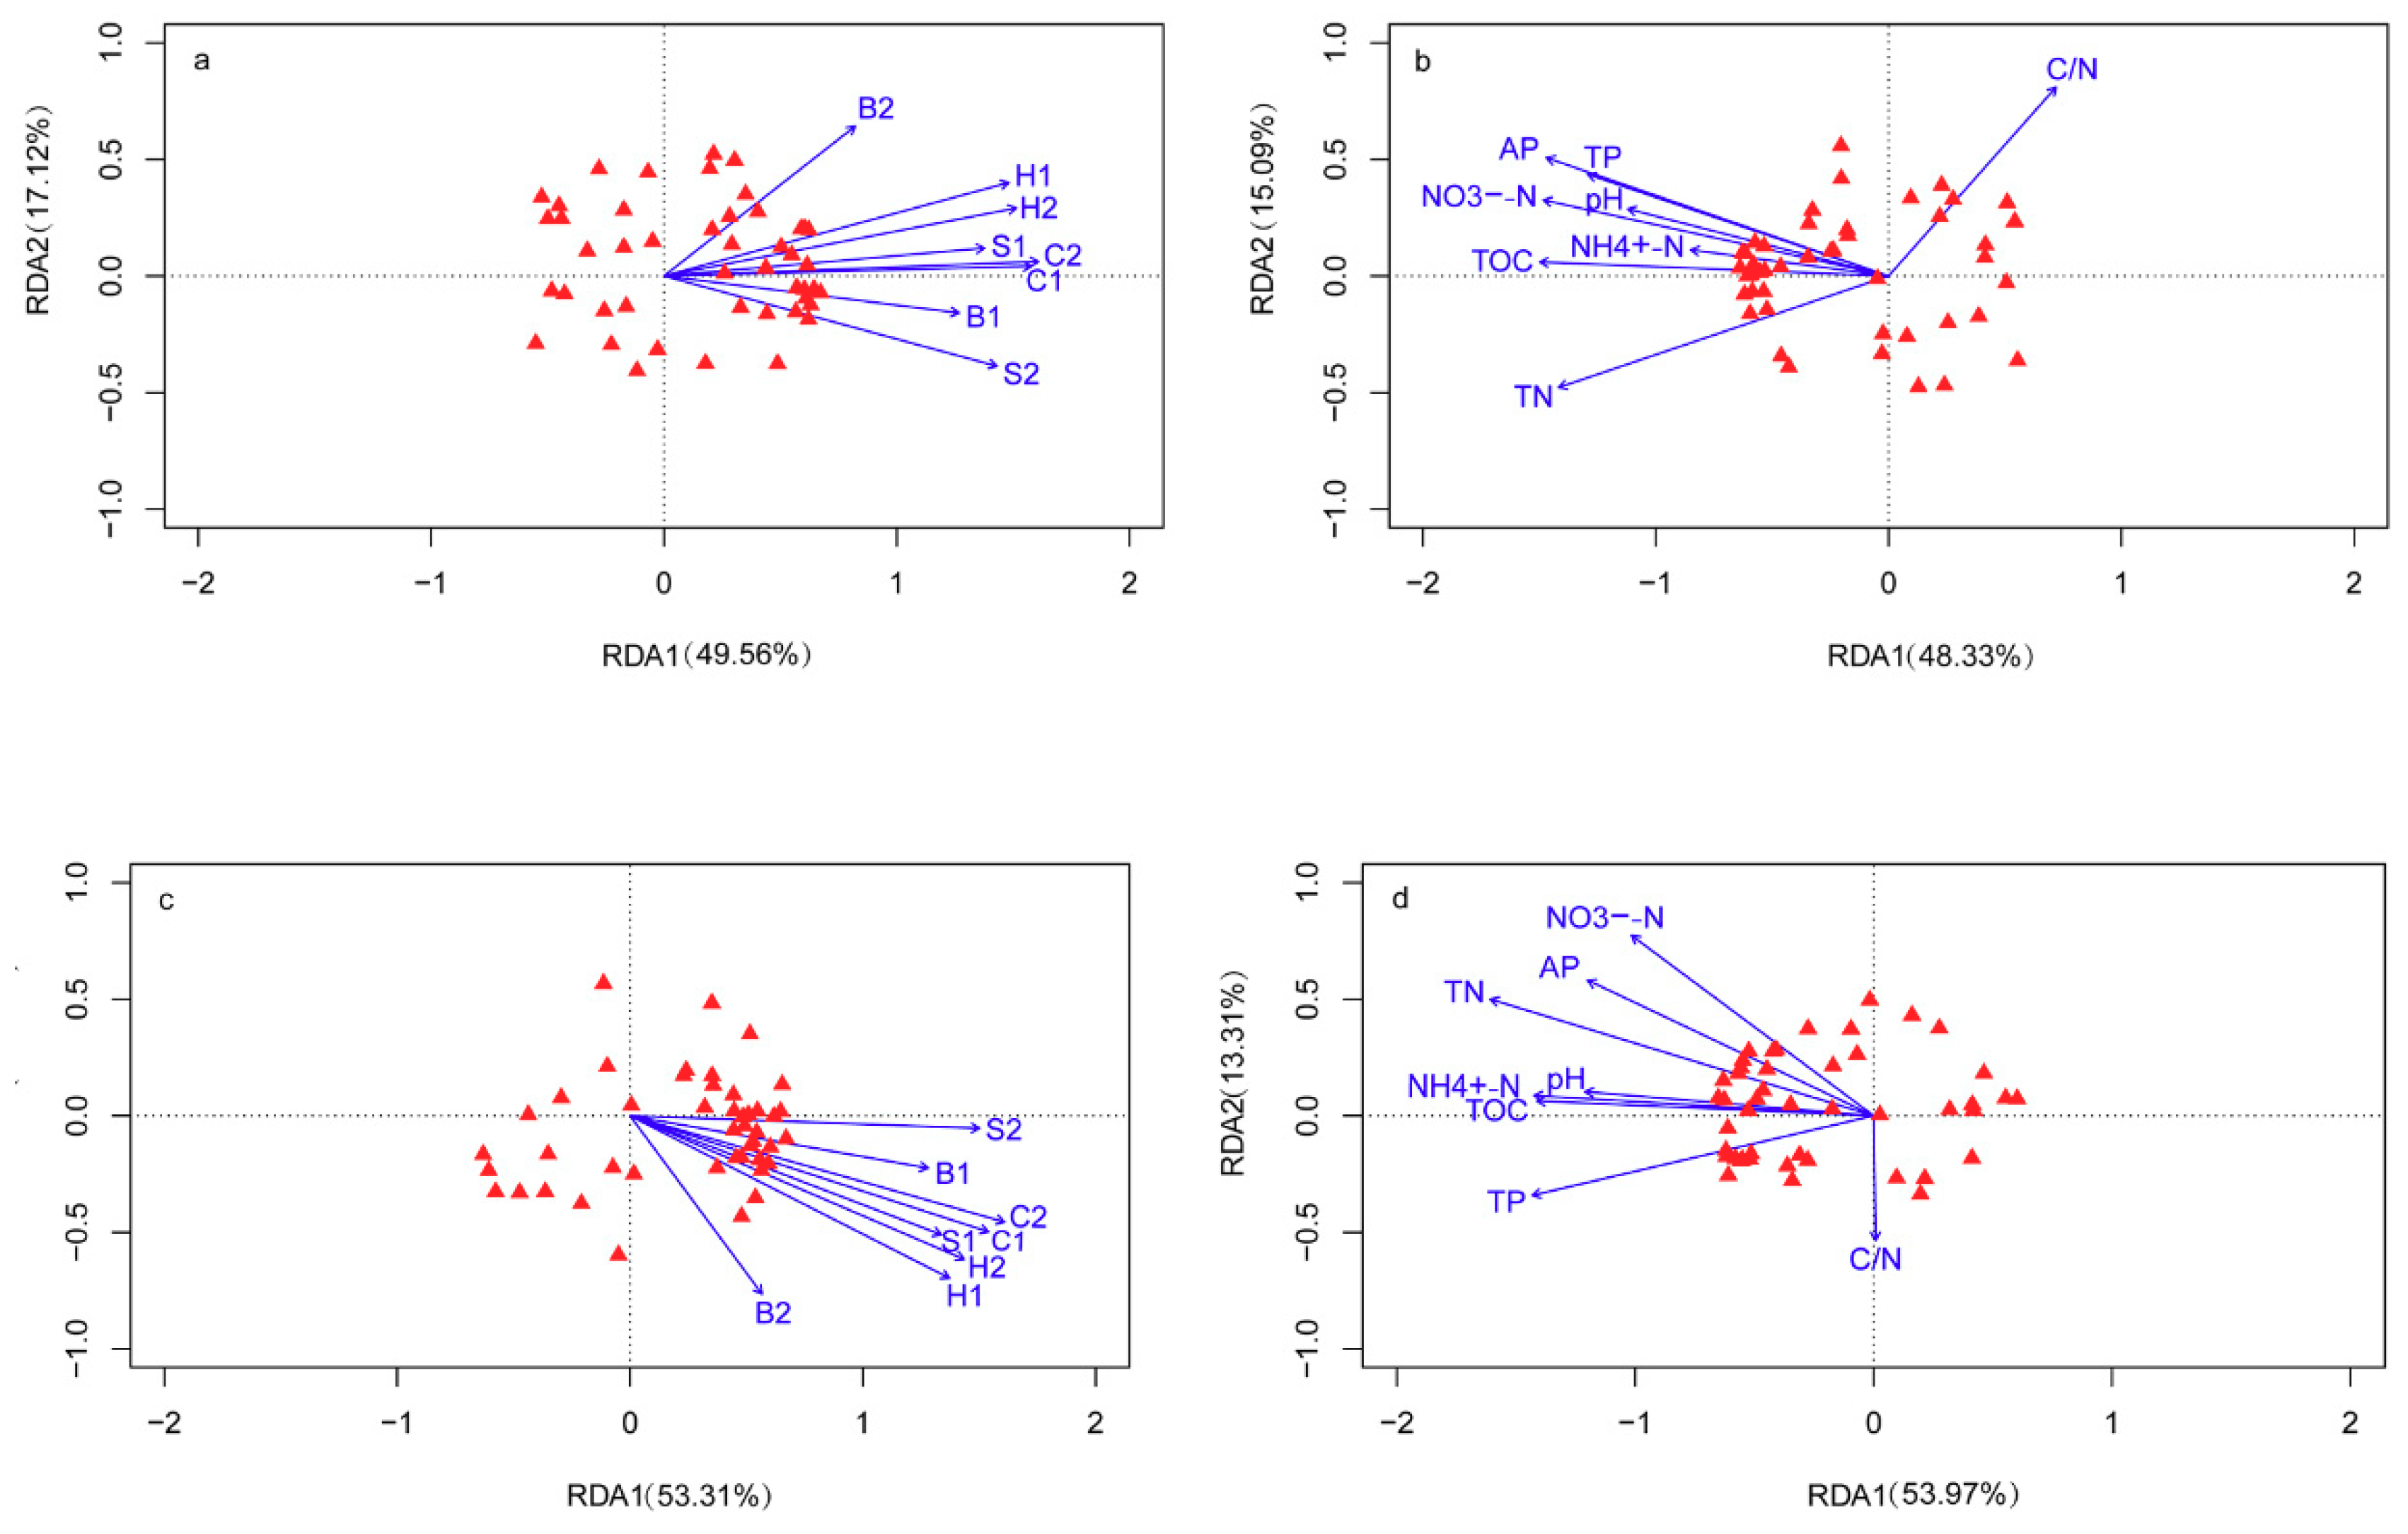
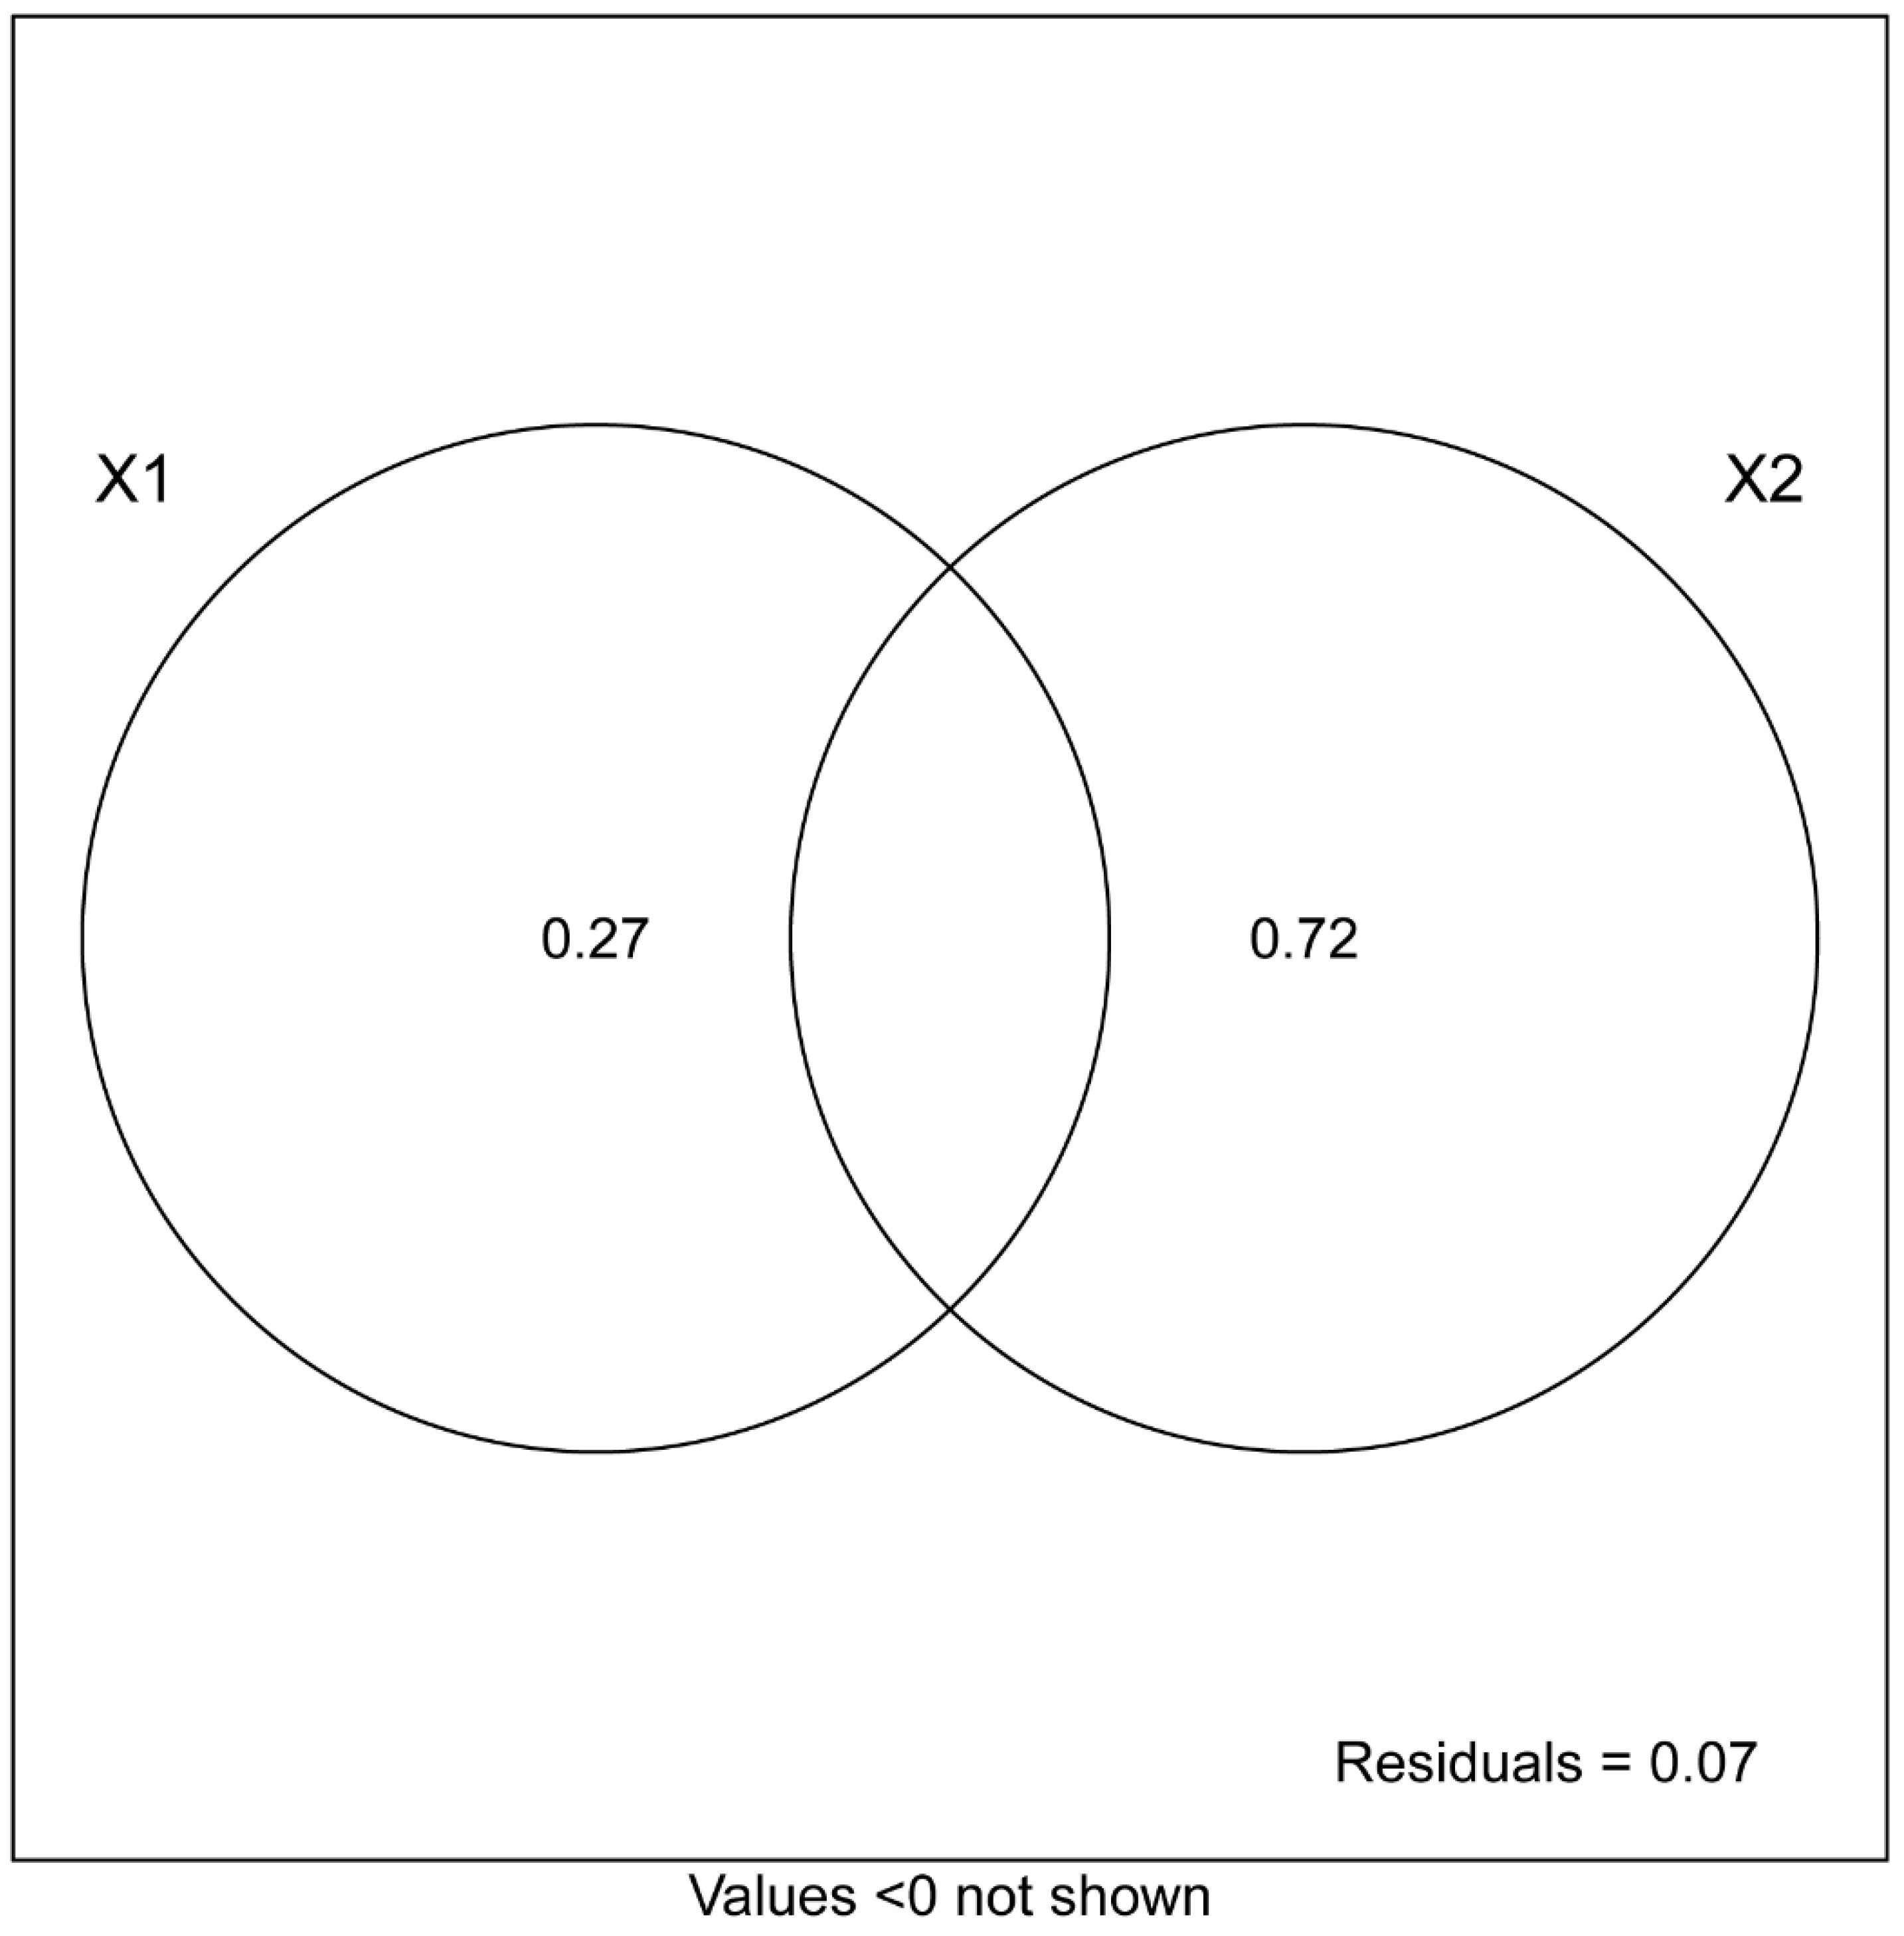
3.5. Correlations among Plant Characteristics, Soil Chemical Properties, and Microbial Communities

Redundancy analysis (RDA) revealed that the first two axes, representing vegetation and soil chemical properties, accounted for 66.68% (Figure 2a)and 63.42%(Figure 2b) of the total variation in soil microbial communities in the organic layer, respectively. In the mineral layer, the first two axes correspond to vegetation and soil chemical properties accountingfor 67.92% (Figure 2c) and 67.28% (Figure 2d) of the total variation, respectively. Forward selection of environmental variables showed that vegetation characteristics, such as coverage, Hplant, Splant of shrubs and herbs, and shrub biomass significantly impacted the microbial community structure with regard to the two layers. Similarly, soil AP, TN, TOC, NO3–N, and TP were the most important factors influencing the microbial community composition.

3.6. Correlation between Soil Microbial Communities and Enzyme Activities

Pearson correlation analyses showed that in the organic layer, total PLFAs (TPLFAs), bacterial PLFAs (BPLFAs), fungal PLFAs (FPLFAs), and GPLFAs were strongly associated with GLU and PHO activity. G+PLFAs and GPLFAs were significantly correlated with URE. However, there were no significant relationship between the above-mentioned microbial variables and CEL (Table 5). In the mineral layer, TPLFAs, BPLFAs, and GPLFAs were significantly positively correlated with each of the detected enzyme activities. G+PLFAs were highly correlated toCEL and URE, whereas FPLFAs showed no significant correlations with any the four detected enzyme activities (Table 6).

4. Discussion

It was reported that high-density, monoculture plantations can damage soil fertility, ecological function, and seedling regeneration [29,30]. The creation of gaps in plantations is an opportunity for the system to change in both species dynamicsand ecological processes. Gap size is an important factor which impacts the function of gap. Gap size affected the soil microbiome in forests by altering specific environmental conditions, including vegetation, microclimate, and soil physicochemical properties under the gaps [31]. Previous studies did not provide evidence to indicate which gap size is the most beneficial for soil nutrient pools and/or microbial communities. Hu et al. [32] suggested that an intermediate gap (i.e., 74 m2) and a large gap (i.e., 109 m2) increased the labile inorganic phosphorus in soil in a reforested spruce forest near a mountain ecosystem. A small gap (e.g., 5 ha) was reported to result in soil with a high organic matter content and the highest calcium and nitrogen concentrations in beech forests located in a humid, oceanic climate zone [33]. Coulombe et al. [34] demonstrated that a small gap (i.e., 6–12 m2) increased nitrogen mineralization rates and mineral nitrogen concentration and proportions in a mixed wood forest at a boreal-temperate interface. Here, we report that gap size can significantly affect the soil microbial community. The abundance of TPLFAs, G+PLFAs, GPLFAs, and AMF PLFAs were highest under the medium gap (i.e., 100 m2) compared to the other treatments. The abundance of FPLFAs exhibited no significant differences between the under-canopy and gap treatments, which suggests that gap formation had little impact on the fungal communities. This indicates that theappropriate gap size varies between different climate and forest types. Therefore, specific environmental conditions, and in particular climate conditions and habitat, should be considered in future studies when determining a favorable gap size.
Previous studies demonstrated that soil chemical properties (i.e., pH, organic carbon, nitrogen, and phosphorus) can alter soil microbial community structures [35,36,37]. Our results show that soil organic carbon (48.01%, p < 0.01) and total nitrogen (54.83%, p < 0.05) were the more important explanatory variables for changes in microbial communities. The highest soil organic carbon, total nitrogen, total phosphorus, and available phosphorus were observed in the medium gap, and this corresponded to the highest microbial PLFAs, suggesting that there were available substrates for the growth of soil microbial communities. Medium gaps (i.e., 100 m2) are able to receive more solar energy and typically exhibit moderate air temperature and soil moisture content (Table S1), which can provide more favorable conditions for vegetation growth. Higher plant diversity and plant biomass can provide an elevated quantity of high-quality substrates (i.e., high soil organic carbon) for microbes that can result in higher numbers in soil microbial community populations. Indeed past research has shown that colonizer understory plants and multi-species plant interactions can shape microbial community structure, soil nutrients, and enzyme activity [38,39,40]. However, as gap size increased to large (i.e., 190 m2), the soil nutrient contents decreased sharply, illustrating that this environment is not as beneficial for the growth of soil microorganisms. In sites with large gaps, higher temperature, higher light intensity, and increased water evaporation can result in a lower plant biomass and litter input, thereby creating a more negative environment for microbial growth. Microbial communities and activities were, as expected, lower under large gaps.
In the present work, soil layer was found to have a stronger influence on soil microbial communities than gap size (Figure 3). Under all the gap sizes, microbial community structure was different between the two soil layers whilethe impact of microbial community on soil nutrient might be related to soil layers. Pearson correlation analyses showed that in the organic layers, PHO activity positively increased with the concentrations of Gram-negative bacteria and fungi (i.e., 0.608 and 0.637, respectively, p < 0.05). However, in the mineral layer, only Gram-negative bacteria potentially play an important role in PHO activity (0.706, p < 0.01). It suggested that similar microbial communities may have different roles in nutrient cycling in distinct soil layers due to substrate availability. In addition, our insights are correlational, however, this work suggests the potential of future studies to connect more specific subsets of microbial communities with particular enzyme activities. Regarding soil PLFA variables, they were higher in the organic layers compared to mineral layers. There are possible mechanisms responsible for the increased relative abundance of soil microbial community in the organic layers. Litter inputs, root exudate, and turnover in the upper soil layer would provide large amounts of fresh substrates and energy for microorganisms [41]. Furthermore, the high C:N ratios slowdown soil organic carbon decomposition and nitrogen mineralization, as well as N immobilization [42]. Our results indicate that the C:N ratios in the organic layer were significantly lower than in the mineral layer. This suggests that soil organic carbon decomposition occurred mainly in the organic layer and the rates of decomposition and nitrogen mobilization were higher than the mineral layer which might provide a favorable environment for microorganisms.
Generally, AMF form important mutualisms with 80% of terrestrial plants [43]. They enhance nutrient capture for the associated host plant, while in return, the fungus obtains a supply of carbon [44]. Besides, they have traditionally been used as indicators of soil fertility. First, increasing litter decomposition rates. AMF mediated litter decomposition by regulating the activities of litter decomposition-related enzymesand proliferation of AMF extraradical hypha [45]. Second, improvingsoil structure. The hyphal network of the highly ramified AMF mycelium creates a three-dimensional matrix that enmeshes and crosslinks soil particles and promoting effects on plant growth and root system development protects the soil from erosion by wind and water. Third, reduce nutrient leaching from the soil by enlarging the nutrient interception zone and preventing nutrient loss after rain-induced leaching events [46]. AMF were widely found in the rhizosphere soil of Artemisia argyi [47,48], which is the main species of understory vegetation under gaps in Pinus tabulaeformis plantations. In addition, AMF colonization was found in Spiraea Linn [49] and Anemone L. [50]. In our study, the AMF PLFA 16:1w5c was higher in the medium gap compared to the forest canopy. Based on the effect of AMF, we deduced that the high values of AMF PLFA indicate soil fertility improvementin the medium gap opening. In addition, it was reported that soil enzymes drive mineralization and decomposition [51]. Activities of GLU, CEL, URE, and PHO are indicators of soil carbon, nitrogen, and phosphorus cycling, respectively [52]. In the present study, there were higher GLU, CEL, URE, and PHO activities in sites with a medium gap, relative to other treatments, indicating medium gap openings provide a more favorable environment for microbial metabolism and can accelerate the mineralization rates of soil organic carbon, nitrogen, and phosphorus. Furthermore, these enzyme activities were significantly correlated with soil organic carbon, nitrogen, and phosphorus, suggesting that an increase in soil enzyme activities may increase the content of soil organic carbon, nitrogen, and phosphorus. Medium gaps promote enzyme activities and an increase in soil nutrient availability by promoting the growth of microorganisms and thereby increasing microbial PLFA abundance. We conclude that a medium gap is the most beneficial for improving soil fertility, but note that detail of the gap size may verywell be based on the ecosystem. Nonetheless our research indicates a ‘sweet spot’ may exist in gap size that improves soil, plant, and microbial attributes.

5. Conclusions

Gap size significantly affected soil microbial communities and enzyme activities in organic and mineral soil layers. The highest PLFA abundance and enzyme activities were observed in the medium gap (i.e., 100 m2). As gap size increased to 190 m2, microbial communities and enzyme activities significantly decreased. Regardless of gap formation, microbial community structure in the organic layers was different from that in the mineral layers. The abundance of microbial PLFAs and enzyme activities in the organic layer was higher than in the mineral layer. Undergrowth vegetation coverage, diversity, soil nitrogen, total organic carbon, and available phosphorus were the mostimportant factors resulting in the alteration of microbial communities, indicating that the influence of forest gap on the microbial communities was the combined result of changing vegetation and soil properties. The gap size of 100 m2 is beneficial for soil microbial communities and soil fertility in a Chinese pine plantation. Overall, our results demonstrate that further studies are clearly needed in order to fully understand the effect gap size can have on soil properties and microbial community structure in varying types of managed tree systems.

Supplementary Materials

The following are available online at https://www.mdpi.com/1999-4907/9/11/680/s1, Table S1: Ecological factors from four treatments.

Author Contributions

Z.Z. and Y.X. conceived and designed the experiment; L.Y. and S.F. completed the experiment; Z.M. and R.H. analyzed the experimental data; Z.Z. and Y.X. wrote the paper.

Funding

This study was financially supported by National Key Research and Development Program of China (2016YFC0501706-1), China Postdoctoral Science Foundation (2016M60082), Fundamental Research Funds for the Central Universities (2452018132), Tang Scholar Program of Northwest A&F University, and Young Teacher Culture Programs of College of Forestry of Northwest A&F University (Z111021602).

Acknowledgments

We are very grateful to the two graduates Dan Yang and Miao Yang for providing us with some of the experimental materials, as well as Sichuan Agricultural University providing us with the pre-treatment platform of the experimental samples.

Conflicts of Interest

The authors declare no conflict of interest.

References

  1. Liu, D.; Huang, Y.M.; Sun, H.Y.; An, S.S. The restoration age of Robiniapseudoacacia plantation impacts soil microbial biomass and microbial community structure in the Loess Plateau. Catena 2018, 165, 192–200. [Google Scholar] [CrossRef]
  2. Parvin, S.; Blagodatskaya, E.; Becker, J.N.; Kuzyakov, Y.; Uddin, S.; Dorodnikov, M. Depth rather than microrelief controls microbial biomass and kinetics of C-, N-, P- and S-cycle enzymes in peatland. Geoderma 2018, 324, 67–76. [Google Scholar] [CrossRef]
  3. Bolat, I. The effect of thinning on microbial biomass C, N and basal respiration in black pine forest soils in Mudurnu, Turkey. Eur. J. For. Res. 2014, 133, 131–139. [Google Scholar] [CrossRef]
  4. Scharenbroch, B.C.; Bockheim, J.G. Impacts of forest gaps on soil properties and processes in old growth northern hardwood-hemlock forests. Plant Soil 2007, 294, 219–233. [Google Scholar] [CrossRef]
  5. Schliemann, S.A.; Bockheim, J.G. Influence of gap size on carbon and nitrogen biogeochemical cycling in Northern hardwood forests of the Upper Peninsula, Michigan. Plant Soil 2014, 377, 323–335. [Google Scholar] [CrossRef]
  6. Xu, J.X.; Xue, L.; Su, Z.Y. Impacts of Forest Gaps on Soil Properties after a Severe Ice Storm in a Cunninghamialanceolata Stand. Pedosphere 2016, 26, 408–416. [Google Scholar] [CrossRef]
  7. Muscolo, A.; Sidari, M.; Mercurio, R. Influence of gap size on organic matter decomposition, microbial biomass and nutrient cycle in Calabrian pine (Pinuslaricio, Poiret) stands. For. Ecol. Manag. 2007, 242, 412–418. [Google Scholar] [CrossRef]
  8. Denslow, J.S.; Ellison, A.M.; Sanford, R.E. Treefall gap size effects on above- and below-ground processes in a tropical wet forest. J. Ecol. 1998, 86, 597–609. [Google Scholar] [CrossRef] [Green Version]
  9. Hu, W.J.; Wang, P.C.; Zhang, Y.; Teng, M.J.; Zhou, Z.X. Effects of gap disturbances on soil properties and understory plant diversity in a Pinusmassoniana in Hubei, central China. J. Anim. Plant Sci. 2016, 26, 988–1001. [Google Scholar]
  10. Wang, Z.M.; Pan, L.; Xue, L. Effects of forest gaps on soil microbial diversity in a Cunninghamialanceolata stand after a serve storm. Int. J. Agric. Biol. 2018, 20, 1161–1166. [Google Scholar]
  11. He, R.Y.; Yang, K.J.; Li, Z.J.; Schaedler, M.; Yang, W.Q.; Wu, F.Z.; Tan, B.; Zhang, L.; Xu, Z.F. Effects of forest conversion on soil microbial communities depend on soil layer on the eastern Tibetan Plateau of China. PLoS ONE 2017, 12, e0186053. [Google Scholar] [CrossRef] [PubMed]
  12. Han, W.J.; He, J.F.; Zhang, W.H.; Li, J.X. Effects of gap size on root growth of seedlings and soil physical and chemical properties in Pinustabulaeformis plantation in the Huanglong Forest. Sci. Silvae Sin. 2013, 49, 16–23. [Google Scholar]
  13. Wang, Z.B.; Yang, H.J.; Dong, B.Q.; Zhou, M.M.; Ma, L.Y.; Jia, Z.K.; Duan, J. Effects of canopy gap size on growth and spatial patterns of Chinese pine (Pinustabulaeformis) regeneration. For. Ecol. Manag. 2017, 385, 46–56. [Google Scholar] [CrossRef]
  14. Wang, Z.B.; Yang, H.J.; Dong, B.Q.; Zhou, M.M.; Ma, L.Y.; Jia, Z.K.; Duan, J. Regeneration response to canopy gap size in a Chinese pine plantation: Species diversity patterns, size structures and spatial distributions. For. Ecol. Manag. 2017, 397, 97–107. [Google Scholar] [CrossRef]
  15. Wang, Z.B.; Zhao, K.J.; Yang, H.J.; Ma, L.Y.; Jia, Z.K. Various response of Pinustabulaeformis Carr. regeneration in artifical gaps. Sci. Rep. 2017, 7, 1–12. [Google Scholar]
  16. Brokaw, N.V.L. The definition of treefall gap and its effect on measures of forest dynamics. Biotropica 1982, 14, 158–160. [Google Scholar] [CrossRef]
  17. Zhang, C.; Liu, G.B.; Xue, S.; Wang, G.L. Soil bacterial community dynamics reflect changes in plant community and soil properties during the secondary succession of abandoned farmland in the Loess Plateau. Soil Biol. Biochem. 2016, 97, 40–49. [Google Scholar] [CrossRef]
  18. Tscherko, D.; Hammesfahr, U.; Marx, M.C.; Kandeler, E. Shifts in rhizosphere microbial communities and enzyme activity of Poaalpina across an alpine chronosequence. Soil Biol. Biochem. 2004, 36, 1685–1698. [Google Scholar] [CrossRef]
  19. Liu, G.S. Soil Physical and Chemical Analysis and Description of Soil Profiles, 1st ed.; Standards Press of China: Beijing, China, 1996; pp. 5–42. ISBN 7-5066-1218-6. [Google Scholar]
  20. White, D.C.; Davis, W.M.; Nickels, J.S.; King, J.D.; Bobbie, R.J. Determination of the sedimentary microbial biomass by extractible lipid phosphate. Oecologia 1979, 40, 51–62. [Google Scholar] [CrossRef] [PubMed]
  21. Yang, M.; Yang, D.; Yu, X. Soil microbial communities and enzyme activities in sea-buckthorn (Hippophae rhamnoides) plantation at different ages. PLoS ONE 2018. [Google Scholar] [CrossRef] [PubMed]
  22. Zelles, L. Fatty acid patterns of phospholipids and lipopolysaccharides in the characterization of microbial communities in soil: A review. Biol. Fertil. Soils 1999, 29, 111–129. [Google Scholar] [CrossRef]
  23. Frostegård, A.; Bååth, E. The use of phospholipid fatty acid analysis to estimate bacterial and fungal biomass in soils. Biol. Fertil. Soils 1996, 22, 59–65. [Google Scholar] [CrossRef]
  24. Bossio, D.A.; Fleck, J.A.; Scow, K.M.; Fujii, R. Alteration of soil microbial communities and water quality in restored wetlands. Soil Biol. Biochem. 2006, 38, 1223–1233. [Google Scholar] [CrossRef]
  25. Frostegård, A.; Tunlid, A.; Bååth, E. Use and misuse of PLFA measurements in soils. Soil Biol. Biochem. 2011, 43, 1621–1625. [Google Scholar] [CrossRef]
  26. Myers, R.T.; Zak, D.R.; White, D.C.; Peacock, A. Landscape-level patterns of microbial community composition and substrate use in upland forest ecosystems. Soil. Sci. Soc. Am. J. 2001, 65, 359–367. [Google Scholar] [CrossRef]
  27. Yarwood, S.A.; Myrold, D.D.; Hogberg, M.N. Termination of belowground C allocation by trees alters soil fungal and bacterial communities in a boreal forest. Fems. Microbiol. Ecol. 2009, 70, 151–162. [Google Scholar] [CrossRef] [PubMed] [Green Version]
  28. Guan, S.Y. Soil Enzyme and Its Study Methods, 1st ed.; Agriculture Press: Beijing, China, 1986; pp. 274–339. ISBN 161443123. [Google Scholar]
  29. Yang, Y.; Geng, Y.Q.; Zhou, H.J.; Zhao, G.L.; Wang, L. Effects of gaps in the forest canopy on soil microbial communities and enzyme activity in a Chinese pine forest. Pedobiologia 2017, 61, 51–60. [Google Scholar] [CrossRef]
  30. Pang, X.Y.; Hu, B.; Bao, W.K.; Vargas, T.D.; Tian, G.L. Effect of thinning-induced gap size on soil CO2 efflux in a reforested spruce forest in the eastern Tibetan Plateau. Agric. For. Meteorol. 2016, 220, 1–9. [Google Scholar] [CrossRef]
  31. Liu, Y.; Zhang, J.; Yang, W.Q.; Wu, F.Z.; Xu, Z.F.; Tan, B.; Zhang, L.; He, X.H.; Guo, L. Canopy gaps accelerate soil organic carbon retention by soil microbial biomass in the organic horizon in a subalpine fir forest. Appl. Soil. Ecol. 2018, 125, 169–176. [Google Scholar] [CrossRef]
  32. Hu, B.; Yang, B.; Pang, X.Y.; Bao, W.K.; Tian, G.L. Reponses of soil phosphorus fractions to gap size in a reforested spruce forest. Geoderma 2016, 279, 61–69. [Google Scholar] [CrossRef]
  33. Özcan, M.; Gökbulak, F. Effect of size and surrounding forest vegetation on chemical properties of soil in forest gaps. iForest 2015, 8, 67–72. [Google Scholar] [CrossRef] [Green Version]
  34. Coulombe, D.; Sirois, L.; Paré, D. Effect of harvest gap formation and thinning on soil nitrogen cycling at the boreal-temperate interface. Can. J. For. Res. 2017, 47, 308–318. [Google Scholar] [CrossRef]
  35. Han, Z.M.; Deng, M.W.; Yuan, A.Q.; Wang, J.H.; Li, H.; Ma, J.C. Vertical variation of a black soil’s properties in response to freeze-thaw cycles and its links to shift of microbial community structure. Sci. Total Environ. 2018, 625, 106–113. [Google Scholar] [CrossRef] [PubMed]
  36. Ren, C.J.; Zhao, F.Z.; Kang, D.; Yang, G.H.; Han, X.H.; Tong, X.G.; Feng, Y.Z.; Ren, G.X. Linkages of C:N:P stoichiometry and bacterial community in soil following afforestation of former farmland. For. Ecol. Manag. 2016, 376, 59–66. [Google Scholar] [CrossRef]
  37. Wang, Y.; Li, C.Y.; Tu, C.; Hoyt, G.D.; DeForest, J.L.; Hu, S.J. Long-term no-tillage and organic input management enhanced the diversity and stability of soil microbial community. Sci. Total Environ. 2017, 609, 341–347. [Google Scholar] [CrossRef] [PubMed]
  38. Knelman, J.E.; Graham, E.B.; Trahan, N.A.; Schmidt, S.K.; Nemergut, D.R. Fire severity shapes plant colonization effects on bacterial community structure, microbial biomass, and soil enzyme activity in secondary succession of a burned forest. Soil Biol. Biochem. 2015, 90, 161–168. [Google Scholar] [CrossRef]
  39. Knelman, J.E.; Graham, E.B.; Prevéy, J.S.; Robeson, M.S.; Kelly, P.; Hood, E.; Schmldt, S.K. Interspecific plant interactions reflected in soil bacterial community structure and nitrogen cycling in primary succession. Front. Microbiol. 2018, 9, 1–11. [Google Scholar] [CrossRef] [PubMed]
  40. Zhao, F.Z.; Wang, J.Y.; Zhang, L.; Ren, C.J.; Han, X.H.; Yang, G.H.; Doughty, R.; Deng, J. Understory plants regulate soil respiration through changes in soil enzyme activity and microbial C, N, and P stoichiometry following afforestation. Forests 2018, 9, 436. [Google Scholar] [CrossRef]
  41. Zhou, Z.C.; Shangguan, Z.P. Vertical distribution of fine roots in relation to soil factors in Pinustabulaeformis Carr. forest of the Loess Plaetau of China. Plant Soil 2007, 291, 119–129. [Google Scholar] [CrossRef]
  42. Reverchon, F.; Bai, S.H.; Liu, X.; Blumfield, T.J. Tree plantation systems influence nitrogen retention and the abundance of nitrogen functional genes in the solomon islands. Front. Microbiol. 2015, 6, 1–12. [Google Scholar] [CrossRef] [PubMed]
  43. Smith, S.E.; Smith, F.A. Roles of arbuscularmycorrhizas in plant nutrition and growth: New paradigms from cellular to ecosystem scales. Annu. Rev. Plant Biol. 2011, 62, 227–250. [Google Scholar] [CrossRef] [PubMed] [Green Version]
  44. Herman, D.J.; Firestone, M.K.; Nuccio, E.; Hodge, A. Interactions between an arbuscularmycorrhizal fungus and a soil microbial community mediating litter decomposition. FEMS Microbiol. Ecol. 2012, 80, 236–247. [Google Scholar] [CrossRef] [PubMed]
  45. Kong, X.S.; Jia, Y.Y.; Song, F.Q.; Tian, K.; Lin, H.; Bei, Z.L.; Jia, X.Q.; Yao, B.; Guo, P.; Tian, X.J. Insight into litter decomposition driven by demands of symbiosis system through the hypha bridge of arbuscularmycorrhizal fungi. Environ. Sci. Pollut. Res. 2018, 25, 5369–5378. [Google Scholar] [CrossRef] [PubMed]
  46. Cavagnaro, T.R.; Bender, S.F.; Asghari, H.R.; van der Heijden, M.G.A. The role of arbuscularmycorrhizas in reducing soil nutrient loss. Trends Plant Sci. 2015, 20, 283–290. [Google Scholar] [CrossRef] [PubMed]
  47. Zhao, X.F.; Yuan, S.H.; Song, H.C.; Su, X.L.; Mao, H.Q.; Shen, W.Y.; Qu, X.L.; Dong, J.Y. Arbuscularmycorrhizal and dark septate fungal associations in riparian plants of the three Gorges Reservoir Region, Southwest China. Aquat. Bot. 2016, 133, 28–37. [Google Scholar] [CrossRef]
  48. Guo, X.H.; Gong, J. Differential effects of abiotic factors and host plant traits on diversity and community composition of root-colonizing arbuscularmycorrhizal fungi in a salt-stressed ecosystem. Mycorrhiza 2014, 24, 79–94. [Google Scholar] [CrossRef] [PubMed]
  49. Marosz, A. Effect of green waste compost and mycorrhizal fungi on calcium, potassium, and sodium uptake of woody plants growth under salt stress. Water Air Soil Pollut. 2012, 223, 223–787. [Google Scholar] [CrossRef]
  50. Bongard, C.L.; Navaranjan, G.; Yan, W.; Fulthorpe, R.R. Fungal colonization of the invasive vine Vincetoxiumrossicumand native plants. Plant Ecol. Evol. 2013, 146, 45–52. [Google Scholar] [CrossRef]
  51. Zhang, W.; Qiao, W.J.; Gao, D.X.; Dai, Y.Y.; Deng, J.; Yang, G.H.; Han, X.H.; Ren, G.X. Relationship between soil nutrient properties and biological activities along a restoration chronosequence of Pinustabulaeformis plantation forests in the Ziwuling Mountains, China. Catena 2018, 161, 85–95. [Google Scholar] [CrossRef]
  52. Yuan, B.C.; Yue, D.X. Soil Microbial and Enzymatic Activities across a Chronosequence of Chinese Pine Plantation Development on the Loess Plateau of China. Pedosphere 2012, 22, 1–12. [Google Scholar] [CrossRef]
Figure 1. Principal component analysis (PCA) of fatty acids from different gap size in organic and mineral layer. G1: small gap; G2: medium gap; G3: large gap; G0: canopy; OL: organic layer; ML: mineral layer.
Forests 09 00680 g001
Figure 2. Redundancy analysis on the relationship betweenthe undergrowth vegetation, soil properties, and microbial communities in organic layer (a,b) and mineral layer (c,d). The solid red triangle presents for individual phospholipid fatty acids (PLFA), determined in sites. S1: shrub richness; S2: herb richness; H1: shrub Hplant; H2: herb Hplant; C1: shrub coverage; C2: herb coverage; B1: shrub biomass; B2: herb biomass; TOC: total organic carbon; TN: total nitrogen; TP: total phosphorus; AP: available phosphorus; C/N: organic carbon to total nitrogen ratio.
Forests 09 00680 g002
Figure 3. Partial redundancy analysis (RDA) for gap size, soil layer and microbial communities. X1: gap size; X2: soil layer.
Forests 09 00680 g003
Table 1. The plant characteristics from four treatments. Values are the mean ± standard deviation (n = 3).
Undergrowth Plant SpeciesGapCoverage (%)Biomass (g cm−3)HplantSplant
Shrub speciesG117.13 ± 2.68b1.03 ± 0.32ab1.20 ± 0.03b7.33 ± 0.58b
G225.70 ± 1.40a1.53 ± 0.18a1.69 ± 0.08a9.33 ± 0.58a
G311.57 ± 1.10c0.72 ± 0.21b1.08 ± 0.06b6.33 ± 0.58b
G015.37 ± 2.10b1.01 ± 0.21ab1.15 ± 0.09b7.00 ± 1.00b
Herb speciesG118.47 ± 0.75b0.32 ± 0.13b0.91 ± 0.04b5.67 ± 0.58a
G227.43 ± 0.91a0.62 ± 0.09a1.44 ± 0.06a6.33 ± 0.58a
G312.13 ± 1.05d0.41 ± 0.22ab0.74 ± 0.07c4.33 ± 0.58b
G016.47 ± 1.07c0.30 ± 0.07b0.81 ± 0.05bc5.33 ± 0.58ab
Different lowercase letters indicate significant differences among gap size in the same layer (Fisher’s LSD test at 0.05). Hplant: the Shannon diversity index of plant communities; Splant: the richness of plant communities.
Table 2. Soil chemical properties in the organic and mineral soils from four treatments. Values are the mean ± standard deviation (n = 3).
LayerGappHTOCTNTPNH4+–NNO3–NAP
OLG17.51 ± 0.15 abA42.61 ± 2.50 abA7.18 ± 0.17 bA0.29 ± 0.13 bA13.56 ± 0.65 abA8.25 ± 1.32 bA9.11 ± 0.28 bA
G27.73 ± 0.12 aA47.09 ± 3.25 aA7.89 ± 0.35 aA0.55 ± 0.21 aA16.02 ± 2.34 aA11.13 ± 1.60 aA13.12 ± 1.23 aA
G37.41 ± 0.12 bA38.41 ± 1.92 bA5.46 ± 0.35 cA0.24 ± 0.11 bA12.61 ± 0.57 bA7.02 ± 0.93 bA8.33 ± 0.70 bcA
G07.50 ± 0.12 abA40.62 ± 2.30 bA7.35 ± 0.05 abA0.26 ± 0.11 bA15.36 ± 1.06 abA8.05 ± 0.53 bA8.85 ± 0.42 bcA
MLG17.14 ± 0.17 abB13.65 ± 1.24 abB1.20 ± 0.19 bB0.20 ± 0.01 abA5.26 ± 1.06 abB3.95±1.37 bB4.06 ± 2.57 bB
G27.36 ± 0.05 aB16.15 ± 1.65 aB1.58 ± 0.19 aB0.23 ± 0.12 aA6.45 ± 0.63 aB7.17 ± 1.51 aB8.41 ± 1.75 aB
G37.06 ± 0.13 bB11.36 ± 1.81 bB1.09 ± 0.08 bB0.11 ± 0.03 abA4.09 ± 1.12 bB4.45 ± 0.73 bB3.48 ± 2.18 bB
G07.10 ± 0.19 abB12.45 ± 1.79 abB1.12 ± 0.10 bB0.10 ± 0.03 bA4.56 ± 0.68 abB4.08 ± 1.03 bB3.88 ± 2.23 bB
L ********************
G ***************
L × G nsns***nsnsnsns
Different lowercase letters indicate significant differences among gap size in the same layer (Fisher’s LSD test at 0.05). Different capital letters denote significant difference between OL and ML in the same gap size (Fisher’s LSD test at 0.05). OL: organic layer; ML: mineral layer; L: layer; G: gap; L × G: layer × gap; G1: small gap; G2: medium gap; G3: large gap; G0: canopy; TOC: total organic carbon; TN: total nitrogen; C:N: organic carbon to total nitrogen ratio; TP: total phosphorus; AP: available phosphorus; *: p < 0.05; **: p < 0.01; ***: p < 0.001; ns: no significant.
Table 3. Soil microbial communities in the organic and mineral soils from four treatments. Values are the mean ± standard deviation (n = 3).
LayerGapTotal LipidG+GBacteriaFungiAMF
OLG159.21 ± 2.40 bA16.86 ± 1.98 aA9.83 ± 1.94 aA35.33 ± 4.61 abA6.14 ± 1.60 abA2.15 ± 0.23 bA
G266.90 ± 4.80 aA18.78 ± 1.30 aA11.13 ± 0.95 aA39.21 ± 3.12 aA7.46 ± 0.53 aA2.65 ± 0.24 aA
G343.35 ± 2.44 dA9.59 ± 0.58 bA5.60 ± 0.56 bA19.31 ± 0.40 cA4.66 ± 0.59 bA1.90 ± 0.27 bA
G054.74 ± 1.78 cA10.62 ± 2.46 bA6.17 ± 1.36 bA29.76 ± 4.05 bA5.80 ± 0.75 abA2.04 ± 0.30 bA
MLG146.70 ± 3.05 bB13.74 ±1.64 aB5.11 ± 0.23 aB28.09 ± 2.35 bB3.93 ± 0.52 bB1.06 ± 0.48 aB
G257.88 ± 3.17 aB15.32 ±1.77 aB6.36 ± 0.28 aB31.58 ± 1.64 aB5.02 ± 0.43 aB1.35 ± 0.38 aB
G331.61 ± 1.23 dB7.36 ±0.02 bB3.24 ± 0.67 bB14.33 ± 0.43 dB2.14 ± 0.21 cB0.82 ± 0.33 aB
G042.19 ± 1.01 cB9.88 ± 2.2 bB3.77 ± 0.47 bB21.29 ± 2.03 cB3.25 ± 0.37 bcB0.79 ± 0.18 aB
L *****************
G ****************
L × G nsnsnsnsnsns
Different lowercase letters indicate significant differences among gap size in the same layer (Fisher’s LSD test at 0.05). Different capital letters denote significant difference between OL and ML in the same gap size (Fisher’s LSD test at 0.05). OL: organic layer; ML: mineral layer; L: layer; G: gap; L × G: layer × gap; G1: small gap; G2: medium gap; G3: large gap; G0: canopy; G+: gram-positive bacteria; G: gram-negative bacteria; *: p < 0.05; **: p < 0.01; ***: p < 0.001; ns: no significant. AMF: arbuscular mycorrhizal fungi.
Table 4. Soil enzyme activities in the organic and mineral soils from the four treatments. Values are the mean ± standard deviation (n = 3).
LayerGapβ-glucosidase (μg g−1dw h−1)Cellulase (mg g−1dw h−1)Urease (mg g−1dw d−1)Phosphatase (mg g−1dw d−1)
OLG127.64 ± 0.95 bA0.63 ± 0.21 abA1.84 ± 0.42 abA3.18 ± 0.34 aA
G232.72 ± 0.88 aA0.92 ± 0.20 aA2.10 ± 0.26 aA3.24 ± 0.12 aA
G311.48 ± 0.61 dA0.51 ± 0.18 bA1.57 ± 0.48 abA3.08 ± 0.33 aA
G025.45 ± 0.80 cA0.70 ± 0.25 abA1.32 ± 0.28 bA3.51 ± 0.43 aA
MLG19.35 ± 1.00 bB0.15 ± 0.12 bB0.84 ± 0.22 acB1.30 ± 0.30 aB
G212.26 ± 0.87 aB0.41 ± 0.10 aB1.06 ± 0.23 aB1.46 ± 0.42 aB
G37.66 ± 0.19 cB0.11 ± 0.04 bB0.31 ± 0.21 bcB1.26 ± 0.18 aB
G08.45 ± 0.24 bcB0.12 ± 0.04 bB0.48 ± 0.15 cB1.55 ± 0.32 aB
layer ************
gap *******ns
Layer × gap ***nsnsns
Different lowercase letters indicate significant differences among gap size in the same layer (Fisher’s LSD test at 0.05). Different capital letters denote significant difference between OL and ML in the same gap size (Fisher’s LSD test at 0.05). OL: organic layer; ML: mineral layer; L: layer; G: gap; L × G: layer × gap; G1: small gap; G2: medium gap; G3: large gap; G0: canopy; **: p < 0.01; ***: p < 0.001; ns: no significant.
Table 5. Correlation coefficients between soil microbial community and enzyme activity in the organic layer.
Total LipidsBacteriaFungiG+G
GLU0.937 **0.931 **0.622 *0.785 **0.762 **
CEL0.5460.5290.4640.4110.462
URE0.5000.5550.3550.717 **0.732 **
PHO0.696 *0.628 *0.637 *0.5730.608 *
GLU: β-glucosidase; CEL: Cellulose; URE: Urease; PHO: phosphatase; G+: gram-positive bacteria; G: gram-negative bacteria; * and ** denote significant differences at p < 0.05 and p < 0.01, respectively.
Table 6. Correlation coefficients between soil microbial community and enzyme activity in the mineral layer.
Total LipidsBacteriaFungiG+G
GLU0.673 *0.612 *0.4240.4960.692 **
CEL0.783 **0.791 **0.4110.710 **0.805 **
URE0.885 **0.855 **0.5290.789 **0.784 **
PHO0.701 *0.646 *0.5300.5460.706 **
GLU: β-glucosidase; CEL: Cellulose; URE: Urease; PHO: phosphatase; G+: gram-positive bacteria; G: gram-negative bacteria; * and ** denote significant differences at p < 0.05 and p < 0.01, respectively.

